e-xploring the how much is your electronic economy time … · nebraska workforce trends|september...
TRANSCRIPT

Fast Facts...Back to School
September 2012
Map Facts...Travel Time to Work
Occupational Profile...Teaching Assistants
Also Featuring...
How Much is Your Time Worth?
E-xploring the Electronic Economy
Tr endsNEBRASKA WORKFORCE
College Placement...Peru State College

Travel Time to WorkMap Facts
Teaching AssistantsOccupational Profile
E-xploring the Electronic EconomyFeature Article
How Much is Your Time Worth? Feature Article
Back to SchoolFast Facts
Openings and Expansions
4
6
7
8
9
10
11
TABlE OF CONTENTS
Peru State CollegeCollege Placement 3
Economic Indicators
12Industry Developments
15July 2012County Rates
www.dol.nebraska.gov Nebraska Workforce Trends|September 2012
GRADuATE OuTCOMESPeru State College
College Placement
There were 468 Peru State College graduates from July 1, 2009 to June 30, 2010. Of these graduates, 311 (66%) were employed in Nebraska in first quarter 2011. The percentage of graduates working in the state was the same as in the previous year. Females made up 63% of the graduates and were more likely (73%) to be working in the state than males (56%). The estimated average annual wages for all graduates was $35,502. Bachelor’s degree graduates averaged $29,984 while Master’s graduates averaged $45,584 per year.
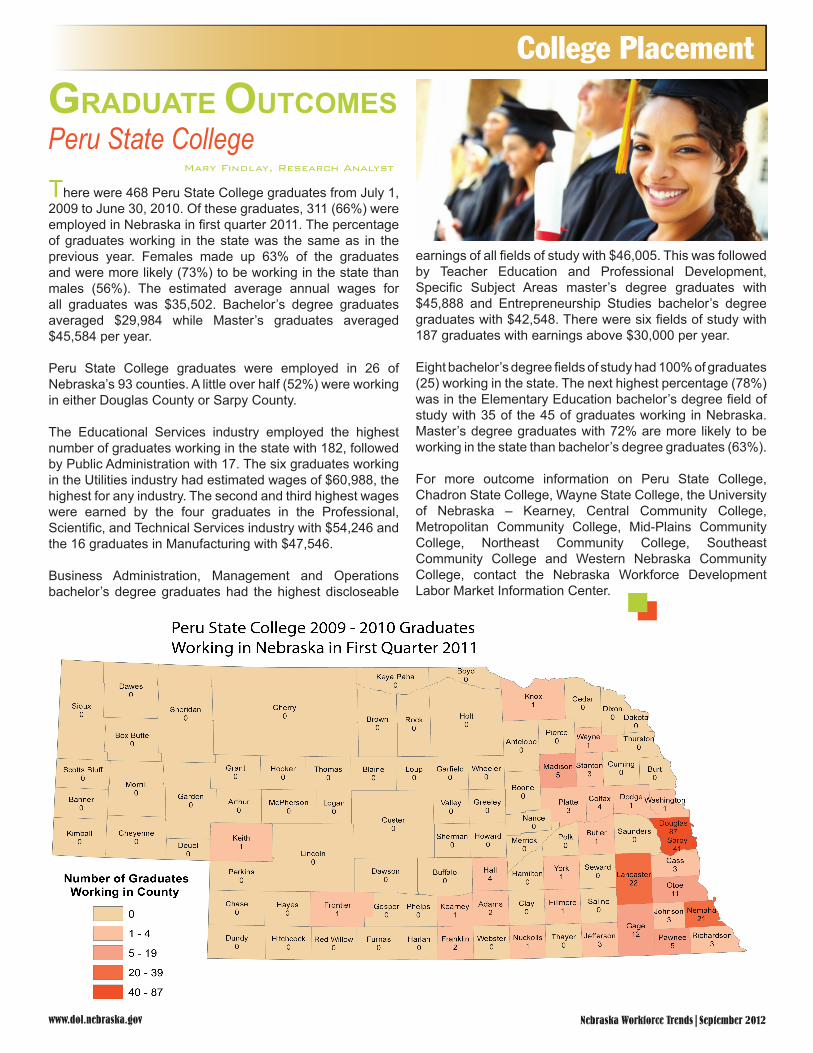
Peru State College graduates were employed in 26 of Nebraska’s 93 counties. A little over half (52%) were working in either Douglas County or Sarpy County.
The Educational Services industry employed the highest number of graduates working in the state with 182, followed by Public Administration with 17. The six graduates working in the Utilities industry had estimated wages of $60,988, the highest for any industry. The second and third highest wages were earned by the four graduates in the Professional, Scientific, and Technical Services industry with $54,246 and the 16 graduates in Manufacturing with $47,546.
Business Administration, Management and Operations bachelor’s degree graduates had the highest discloseable
earnings of all fields of study with $46,005. This was followed by Teacher Education and Professional Development, Specific Subject Areas master’s degree graduates with $45,888 and Entrepreneurship Studies bachelor’s degree graduates with $42,548. There were six fields of study with 187 graduates with earnings above $30,000 per year.
Eight bachelor’s degree fields of study had 100% of graduates (25) working in the state. The next highest percentage (78%) was in the Elementary Education bachelor’s degree field of study with 35 of the 45 of graduates working in Nebraska. Master’s degree graduates with 72% are more likely to be working in the state than bachelor’s degree graduates (63%).
For more outcome information on Peru State College, Chadron State College, Wayne State College, the University of Nebraska – Kearney, Central Community College, Metropolitan Community College, Mid-Plains Community College, Northeast Community College, Southeast Community College and Western Nebraska Community College, contact the Nebraska Workforce Development Labor Market Information Center.
Mary Findlay, Research Analyst

www.dol.nebraska.govNebraska Workforce Trends|September 2012
Feature Story
Jodie Meyer, Research Analyst
E-xploring the Electronic Economy
B uying and selling goods via electronic markets is still a relatively new and growing aspect of business. The United States Census Bureau began releasing an
annual E-stats Report in 1999 to measure the value of goods and services sold online. The latest report was released in May of 2012 and reports on business activity in 2010.
This E-Stats report compiles data from four surveys to calculate e-commerce estimates. The four surveys are the Annual Survey of Manufactures, the Annual Retail Trade Survey, Annual Wholesale Trade Survey, and the Service Annual Survey. All of these surveys are conducted by the Census. Each survey uses different measures of economic activity such as shipments for manufacturing, sales for wholesale and retail trade, and revenues for service industries. Approximately 125,000 plants and firms nationwide are surveyed and used in this report. The term online refers to open networks such as the Internet and also proprietary networks running systems such as Electronic Data Interchange.
The E-Stats report has information on four industry sectors, Manufacturing, Merchant Wholesale Trade, Retail Trade, and Selected Services Industries. The report does not cover agriculture, mining, construction, utilities, non-merchant wholesalers and parts of the service sector.
In 2010, e-commerce was on the rise and grew faster on a year-to-year percent change basis than total economic activity. Manufacturing and Merchant Wholesale Trade relied more heavily on e-commerce than other industries. Most of the e-commerce activities within these industries were business-to-business activities which accounted for
90% of e-commerce.Manufactures had 46.4% of total shipments in e-commerce, the largest portion of the industries surveyed. This accounted for $2,283 billion in sales for the sector. E-shipments as a share of total shipments where the highest in Transportation Equipment Manufacturing accounting for 65% of total shipments. Beverage and Tobacco products had 62% of total shipments classify in e-commerce. Four subsectors accounted for 57% of manufacturing e-shipments: Transportation Equipment (17.9%), Chemical Products (13.6%), Food Products (12.8%), and Petroleum and Coal Products (12.6%). E-shipments have also been growing in Manufacturing between 2009 and 2010 they grew in all subsectors with the largest percentage increase in Primary Metal Manufacturing with an increase of 55%.
In Merchant Wholesale Trade 24.6% of sales were e-related. This figure includes Manufacturing Sales Branches and Offices or MSBOs. When MSBOs are excluded, 20.2% of sales were e-sales. E-commerce accounted for more than 6% of sales in 11 of the 17 4-digit merchant wholesale industry groups. Druggists Sundries Merchant Wholesalers had the largest percentage of sales from e-commerce at more than 70% of business. The three industry groups of Motor Vehicles and Automotive Equipment; Professional and Commercial Equipment and Supplies; and Drugs, Drug Proprietaries and Druggists’ Sundries accounted for 61.7% of total e-sales in Merchant Wholesale Trade.
E-commerce is on the rise in the Retail Trade sector and increased by 16.3% from 2009 to 2010. When looking at the time period of 2002 to 2010 retail e-sales have increased at an average annual growth rate of 17.9% compared to a 2.6% rate for total retail sales in the same timeframe. E-sales do not make up too much of total retail sales, only 4.4%, but this is up from the 2009 figure of

www.dol.nebraska.gov Nebraska Workforce Trends|September 2012
4.0%. Over 90% of the total retail e-sales were concentrated in Nonstore Retailers (80.2%) and Motor Vehicles and Parts Dealers (12.1%).
Most of the Nonstore Retail e-sales occurred in the Electronic Shopping and Mail-Order Houses industry that includes catalog and mail order operations. Many of these operations sell through multiple channels generally through online only sales or as the e-commerce division of traditional brick-and-mortar retailers. When looking at this industry in more detail, the highest percentage of industry total sales from e-commerce are in Music and Videos sales at 87.9%. Books and Magazine sales also have a large amount of sales from e-commerce at 82.7%. Electronics and appliances e-sales made up 82.1% of total sales and Clothing and Clothing Accessories e-sales made up 78.5% of total sales. However, if you look at total e-sales for the Electronic Shopping and Mail-Order Houses, Clothing and Clothing Accessories make up the largest merchandise line for e-sales at 17.6% of total category sales.
In the Selected Services Industries e-commerce was up by 6.6% from 2009 to 2010 and accounted for 2.3% of total revenues in these industries. E-commerce has been growing in these industries at a faster rate than the total revenue, with e-sales increasing at an annual rate of 12.3% since 2004 compared to a 4.0% increase for total revenue. Three main groups within the selected services industries accounted for 27.2% of the total e-revenues for this industry group: Air Transportation, Publishing Industries (except Internet), and Securities and Commodity Contracts Intermediation and Brokerage. Air Transportation had the largest share of total revenue from e-sales at 26.2% of the industries total sales.
E-commerce is a relatively new form of business and is steadily growing throughout the economy. To access the full report by the Census and to learn more about this program please visit the Census Bureau website at www.census.gov.
Source: US Census Bureau, May 10, 2012 “E-Stats” Report
www.dol.nebraska.govNebraska Workforce Trends|September 2012
Source: Bureau of labor Statistics, May 8, 2008, American Time use Survey
Feature Story
Istarted thinking about this question after having my second child and planning my return to work. I was terrified about how I would possibly work 40 hours per week, plus commute, care
for our home and children, and somehow find some time for myself. What I discovered was not surprising, but still a little scary.
Beginning in 2003, the U.S. Bureau of Labor Statistics (BLS) began gathering data on how Americans spend their time. Time spent on activities such as work, housework, childcare, and leisure are calculated and reported annually in the American Time Use Survey (ATUS). Data can be sorted and analyzed in a variety of ways, but I was mostly curious about how married mothers and fathers spend their time and what kind of pay they would deserve for their activities.
The ATUS has found that 43% of married mothers and 88% of married fathers work full time. On average, married mothers employed full time work 36.0 hours per week and married fathers employed full time work 42.6. The difference in these numbers generally reflects the married mothers’ greater likelihood of being absent from work for childcare.
When comparing full time employed mothers and fathers time outside of work, you can see some stark differences. Full time employed mothers average 2.05 hours per day of household activities (housework, cooking, and lawn care), while full time employed fathers average 1.24 hours. That is a difference of 5.67 hours per week! Childcare by these two groups also differ significantly, with full time employed mothers caring for household members 1.22 hours per day and fathers .84 hours per day. The difference there is 2.66 hours per week.
Shopping for the family and transporting children tends to fall more on the full time working mother as well. These mothers spend .60 hours shopping per day versus fathers .38 hours. Mothers spend .23 hours driving kids around each day and fathers spend .12 doing the same. These differences certainly add up.
A full time employed mother dedicates 64.7 hours per week to working and caring for the household and a full time employed father spends 60.66 hours. The impact of these numbers is seen in the amount of leisure time full time employed mothers have per week: 20.51 hours versus full time employed fathers 25.62 hours. See chart below for the complete analysis.
So how much is my time worth? And secondly, can I buy more leisure time? Considering I would pay a housekeeper an average of $10.31 per hour, I could spend $50 to have the same amount of leisure time as my husband. However, what I would probably do with that time is spend it with my kids, so that would still fall into the ‘childcare’ category. And I certainly am not trying to be a martyr or take more credit than is due. But $50 per week to have 5 more hours with my kids? Sold!
In conclusion, the ATUS gives us some interesting insights into how Americans spend their time, but it doesn’t tell us why or how they decide to spend their time that way. More analysis is needed to determine what your own time is worth to you and how you want to spend it.
Nisha Avey, Research AnalystHow much is your time worth?

www.dol.nebraska.gov Nebraska Workforce Trends|September 2012
When are people on the road? Statewide the most common time that people reported leaving for work was between 7:30 and 7:59 a.m. with 18.2% reporting this timeframe. The second most frequent time was 7:00 to 7:29 a.m., when 15.2% of people left for work. The least reported time frame was 11:00 to 11:59 a.m. with only 1.1% of people leaving for work during this time frame.
How are people getting to work? Most people (84.0%) who travel to work traveled by car, truck, or van and traveled alone. Ten point five percent of workers carpooled in a car, truck, or van. Walking was the main form of transportation for 3.4% and 1.4% traveled by taxicab, motorcycle, bicycle, or other means. Workers in Manufacturing and Construction are more likely to have carpooled than those in other industries with 15.3% of Manufacturing and 14.4% of Construction indicating traveling to work by car, truck or van and carpooling.
Sources: US Census Bureau 2010 American Community Survey 5-year estimates
Almost no one likes sitting in rush hour traffic and most of us want to sit in it for the least amount of time possible. The map highlights the median travel time
to work by county. Most Nebraskan’s enjoy not having to be in traffic for very long.
In Nebraska the mean travel time to work is 17.9 minutes. This is lower than the United States where the mean travel time is 25.2 minutes. People in Logan County Nebraska have the longest commute time in the state at 29.4 minutes. Chase County has the shortest commute time at 10.9 minutes. Seven counties have commute times above the national average: Logan, Loup, Sherman, Cass, McPherson, Banner, and Saunders.
Jodie Meyer, Research Analyst
Map Facts
www.dol.nebraska.govNebraska Workforce Trends|September 2012
Fast Facts
Sources: 2006-2010 American Community Survey Selected Population Tables, uS Census Bureau2010 County Business Patterns, uS Census Bureau 2007 Economic Census, uS Census Bureau, Graduate Outcomes in Nebraska, NE Department of labor
With summertime winding down and vacations coming to an end, back-to-school time is once again upon us. The end of August and beginning of September means students will be headed back to school across Nebraska, buying new school clothes and supplies to fill their lockers. But just how many students are there in Nebraska?
This edition of Fast Facts takes a look at some of the statistics associated with going back to school.
According to the American Community Survey 5 year estimates, there are just over half a million students in Nebraska, ages 3 and older. Of children ages 3 and 4, only 3% are enrolled in school. This figure jumps dramatically in the next age group, with 95% of children ages 5 to 9 attending school. The American Community Survey does not count children who are home schooled as being enrolled in school. Children between the ages of 10 to 14 attend a public or private school 99% of the time. This percentage drops to 98% for 15 to 17 year olds, 78% for 18-19 year olds, 43% for 20 to 24 year olds, 13% for 25 to 34 year olds and only 3% of Nebraskan’s over 39. All totaled, students make up 29.1% of the population of Nebraska ages 3 and older, compared with 27% nationally.
Children ages 5 to 9 enrolled in school choose public over private school 84% of the time. This increases to 87% for 10-14 year olds, and 90% for 15-17 year olds. At 18 years old the trend begins to change, no doubt as students graduating high school opt for private colleges. 18 to 19 year olds enrolled in school attend public schools 81% of the time, while 20 to 24 year olds attend public schools 78% of the time. 79% of 25 to 34 year olds attend public over private schools, while 76% of students age 35 or older enroll in public schools. Asians attends private schools at the highest rate of 20%, followed by whites at 19%, Hispanics at 14%, Blacks at 13%, and American Indians at 9%. Male and female students attend public schools vs. private schools at about the same rate, at 84% and 82 % respectively. .
68% of Hispanic children between the ages of 3 and 4 were not enrolled in school. This compares with 61% of Black or African American children not enrolled, 54% of white children, 52% of American Indian children, and 42% of Asian children between the ages of 3 and 4 not enrolled in school. Of the population ages 18-24, 68% of Asians were enrolled in college, compared to 47% of whites, 37% of Blacks or African Americans, 22% of Hispanics, and 17% of Native Americans.
Nebraskans have plenty of choices where to do their back to school shopping. In 2010 there were 148 family clothing stores, 29 children and infant clothing stores, 136 shoe stores, 63 office supply and stationary stores, 146 sporting goods stores, 68 book stores, and 64 department stores. Across the U.S., consumers spent $7.7 billion at family clothing stores in August, 2011, and $2.4 billion at book stores. In 2007, Nebraskans spent $182 million on children’s wear, $97.5 million on books, and $263 million on computer hardware, software, and supplies.
After graduating college, graduates working in Nebraska with an associate’s degree had an estimated median annual earnings of $22,219. Graduates from Nebraska’s state colleges with a bachelor’s degree had an estimated median annual earnings of $24,936, while master’s degree graduates earned $47,506 and post-master’s degree graduates earned $97,253.
Back to School
Kermit Spade, Research Analyst

www.dol.nebraska.gov Nebraska Workforce Trends|September 2012
ED JAROS, Research Analyst
Many of our formative years are set in the school classroom. During these years our personalities take shape, friendships are forged and much of life’s most
essential learning takes place. Teachers play a pivotal role in these important processes, but teachers do not operate in a vacuum. A successful and vital school depends on the hard work of individuals in several roles. Administrators, counselors, coaches and cooks all have important parts to play. One of the crucial supporting roles in many schools is that of the Teacher Assistant. A Teacher Assistant, sometimes called a Paraprofessional Educator or simply a Para, provides instruction and services to students and their parents in accordance with designs implemented by a Teacher.
Occupational CharacteristicsTeacher Assistants generally work part time in auxiliary functions. They perform a variety of tasks including tutoring to reinforce lessons, supervising students in study halls, lunchrooms or schoolyards, taking attendance and grading schoolwork. Many Teacher Assistants also help to provide sufficient attention to students who are disabled, are learning English as a second language or take part in Special Education programs.
DistributionTeacher Assistants can be found working primarily in the Education Employment industry, which employs 89.5% of the people in this occupation in Nebraska. The Social Assistance industry employs a further 8.1% of Teacher Assistants in Nebraska. Other industries employing Teachers Assistants include Nursing and Residential Care Facilities, Hospitals and Museums Parks and Historical Sites.
EducationTeacher Assistants are typically required to complete some
on the job training, and most employers also require them to have attained certain levels of education. Of employers who answered a national survey, 40% responded that they require a high school diploma or GED, 33% responded that they require an associate’s degree, and 12% responded that they require at least some college courses. Some employers require a bachelor’s degree or other post-secondary education. The state of Nebraska does not require any licensing for Teacher Assistants.
WagesThe estimated mean wage for Teacher Assistants during the first quarter of 2012 was $21,912 annually. A statistical breakdown of wage data for job openings posted online indicated that the entry level wage for Teacher Assistants was $19,919 annually and that the experienced wage for Teacher Assistants was $25,126. In evaluating these wages, it is important to remember that nearly 40% of Teacher Assistants work part time.
OutlookWhile the projected annual average change in employment of Teacher Assistants in Nebraska is consistent with the projected change in employment for all occupation at 1%, the outlook for individuals seeking employment in this occupation is quite positive. This is due to high turnover in the Teacher Assistant Occupation. Two out of every three job openings each year are projected to open due to replacement, the remaining one third are projected to open due to growth. Growth in this occupation is drive by increasing numbers of students in Special Education programs and students learning English as a second language.If you or someone you know has an interest in learning more about this occupation, please visit Career Resources on the Nebraska Department of Labor’s website.
Teaching Assistants
Occupational Profile
www.dol.nebraska.govNebraska Workforce Trends|September 2012
Note: The following information is obtained through a monthly survey of Nebraska’s Career Centers. Openings and expansions that were not publicly reported or reported to Career Center Managers in confidence are not listed. If you know of a business that is opening or expanding, please email [email protected] with your information.
Openings
Kermit Spade, Research Analyst
Openings & Expansions
lincoln• The Lincoln Chamber of Commerce reported the following businesses are opening or expanding their operations: Top Shelf Beverage Service – wines, etc. beverage catering business; Humanex – community based consulting and training organization; Mutual of Omaha Bank – 1317 Q St – branch office; The Eatery – formerly the Pantry, which has been sold and is currently under renovation.• The Lincoln Journal Star reported the following businesses are opening or expanding their operations: Casual Male XL Store – 48th and O undergoing renovation; Family Dollar – coming soon at the Indian Village Shopping Center; Snowflakes – second location; Hart Dance Academy – relocation to StoneView Center, 48th and Pioneer.• Strictly Business reported the following businesses are opening or expanding their operations: Happy Cab Company; Trash Taxi – trash removal/recycling; Finer Things Consignment – expansion of Pearls and Pebbles Shop; A Cut Above the Rest Catering Company; Amtrak – new train station at 510 N Street.Omaha• The Greater Omaha Chamber of Commerce reported the following businesses are opening or expanding their operations: Greenbelly, Restaurant, 5 employees; Northern Tool & Equip,Tool store, 15 employees; HusKars Golf Carts, Golf cart sales, 2 employees; American National Bank, Bank, 7 employees; Enterprise Publishing, Newspaper, 4 employees; Scooter’s Coffeehouse, Coffee shop, 10 employees; LeWonderment, Toy store, 3 employees; Revive Massage Spa, Spa, 5 employees; SAC Federal Credit Union, Credit Union, 5 employees; AccuCut/AccuQuilt Co, Cutting machine manufacturer, 25 employees; Level 3 Communications, Data center, 3 employees; Dundee Venture Capital, Venture capital firm, 2 employees; Starbucks – Metro Crossing, Coffee shop, 10 employees; Ultimate Disc Store, Frisbee golf shop, 3 employees; The Art Room, Art instruction center, 3 employees; Raising Cain’s, Restaurant, 20 employees; Mantra, Restaurant, 15 employees; Elevate, Brand strategy & design shop, 2 employees; Lexus of Omaha, Car Dealership; Papillion Community Foundation, Not-for-profit; Cutler-O’Neil-Meyer-Woodring, Funeral home; Bellevue Police Department, City Government; St. John’s Lutheran Church, Church.• The Omaha World Herald reported the following businesses are opening or expanding their operations: Brix Midtown Crossing, Restaurant, 10 employees; McFoster’s Natural Kind, Café, 2 employees; Silver of Oz at Montclair Center, Jewelry Store.
SoutheastNebraska City• A new business opened in Nebraska City. Sweet Expressions Bakery - Full-Service Bakery Featuring: Donuts, Rolls, Cakes, Cookies, Cupcakes, Breads, Muffins, Coffee and more. York• Stenger Plumbing is a new business that has opened with 2-3 employees.NortheastNorfolk• Franklin’s Bistro, Norfolk restaurant, 18 employees.• Chartwells is new food Service for Northeast Community College.• Quiznos has new owners.• The Abbey has new owners Doug and Pam Coulter.• Clean to AT owner Tiffany Guenther, one employee.• At One Massage Therapy LLC, Stephanie Ahlmann, ATOM Teapy is to promote the well-being of its clientsColumbus• A new restaurant opened; 1st N 10 Steakhouse and Dining employing 20 workers.PanhandleScottsbluff/Sidney• Construction on the new KYS foods plant is nearing completion with ribbon cutting ceremony scheduled for August 31st. The facility will employ 20 new employees and will turn Nebraskan-grown beef and pork into Asian-style jerky and sausage. (Star-Herald).• Bluff Sanitary Supply of Scottsbluff moving to a building 3 times larger than present facility. (Star-Herald).• Steel Grill Restaurant and Bar of Gering has expanded their local building. Between the Gering and Bridgeport locations, the Steel Grill employs about 90 people. (Star-Herald). • Cabela’s Distribution Center held a job fair at Scottsbluff Career Center on July 30, 2012 for their Sidney, Ne facility. Veterans were encouraged to apply. (Cabela’s flyer). • Showtime West (Video) opened its doors in Sidney with a staff of 2 and people can rent videos.CentralGrand Island/Hastings• Dickies restaurant opening local in Grand Island and Kearney. • Hastings: Dunham sporting goods have announced the opening of new store in Hastings and will employ 20-25 people.
and
E x p a n s i o n s

www.dol.nebraska.gov Nebraska Workforce Trends|September 2012
Economic Indicators
Note: Retail Sales figures are in billions of dollars. Median Employment Wages are OES 50th percentile Annual Wage for All Occupations. ECI is Employment Cost Index. PPI is Producer Price Index. CPI is Consumer Price Index.
Facts Sheet
Sources: DOL: Bureau of Labor Statistics, U.S. Energy Information Administration, Federal Housing Finance Agency, Nebraska Department of Revenue, DOL: Bureau of Economic Analysis, Board of Governors of the Federal Reserve System

www.dol.nebraska.govNebraska Workforce Trends|September 2012
Industry Developments
Total Nonfarm Since last month, Nebraska non-seasonally adjusted employment decreased to 958,081 jobs by losing 10,012 jobs (-1.0%). In July, over-the-month change has ranged from -9,405 to -15,410 jobs in the past ten years. From June to July, seven industries decreased, two increased, and one was unchanged. The top two super sector over-the-month gains were in Professional and Business Services (1,035 jobs or 1.0%); followed by Manufacturing (804 jobs or 0.9%). Over the year, total nonfarm employment rose by 16,559 jobs (1.8%). The last July that posted similar growth was in 2004 (16,250 or 1.8%). Over-the-year employment improved the most in Mining and Construction (4,075 jobs or 9.3%); followed by Trade, Transportation, and Utilities (3,162 jobs or 1.6%); and Professional and Business Services (3,124 jobs or 3.0%).
The Lincoln MSA employment went down by 837 jobs from last month to 176,308 jobs (-0.5%). Over the month, three super sector industries increased, three decreased, and four were stable. Since July 2011, Total Nonfarm employment increased by 4,941 jobs (2.9%) which is the same as the highest July increase in the past decade occurring in 2003 (4,547 jobs or 2.9%). The majority of additions came from Government (1,457 jobs) and Professional and Business Services (1,042 workers).
In the Omaha MSA, over-the-month employment fell by 1,389 to 471,140 jobs (-0.3%), a smaller drop than usual. Over the month, the Omaha MSA had two super sector industries gain, three remained stable, and five dropped. The largest super sector monthly gains were in Professional and Business Services (886 jobs or 1.3%) and Manufacturing (344 jobs or 1.1%). Since last year, there has been an increase of 10,603 jobs (2.3%). The highest numerical growth in July in the past decade occurred in 2003 (16,395 or 3.8%). Over half of last year’s additions came from three industries - Education and Health Services (3,595 jobs or 5.1%), Professional and Business Services (2,815 jobs or 4.3%), and Trade, Transportation, and Utilities (2,760 jobs or 3.0%).
MINING AND CONSTRuCTION
Over the month, statewide employment in Mining and Construction advanced slightly by 228 to 48,078 jobs (0.5%) due mostly to Heavy and Civil Engineering Construction (396 jobs or 5.0%). During the past four months combined, Mining and Construction grew by 11,163 workers. Over the year, employment went up by 4,075 jobs (9.3%), the most of any month in the past decade. The only time it increased close to 4,000 was in 2007 from July to August (3,979 jobs or 7.8%). Over half of the increase came from outside of the MSAs. The bulk of the growth came from Heavy and Civil Engineering Construction (1,803 or 27.7%) and Construction of Buildings (1,353 jobs or 15.2%).
Since last month, employment in the Lincoln MSA fell by 46 to 7,537 jobs (-0.6). Over-the-year employment jumped up 234 workers (3.2%). In the Omaha MSA, from June to July employment decline by 149 to 22,733 jobs (-0.7%). Since July 2011, employment rose by 1,480 jobs (7.0%).
MANuFACTuRING
From June to July this year, statewide employment gained 804 jobs to 95,280 (0.9%), the largest growth in July in the past decade. July’s over-the-year employment added 1,465
Responsibilities for the Current Employment Statistics (CES) estimates of monthly industry employment for the state and metropolitan areas (Lincoln & Omaha) changed from the Nebraska Department of Labor to the Bureau of Labor Statistics (BLS) in April 2011. This transition happened in all states. Concurrent with this transition, BLS implemented several methodological changes to the estimation approach across states. The new estimation process reduces local economic knowledge in the process and may result in more month to month variability of the estimates, particularly in the smaller states. More detailed information on the changes to procedures for producing CES estimates is available on the BLS Web site at http://www.bls.gov/sae/cesprocs.htm
Industry Developments
Janet Oenbring, Research Analyst

www.dol.nebraska.gov Nebraska Workforce Trends|September 2012
jobs with the majority growth coming from Durable Goods (1,316 jobs).
From May 2012 to June 2012, Lincoln MSA employment jumped up by 513 jobs and posted the highest monthly percentage increase in the past decade of 4.2%. Since last month it remained stable at 12,696 (0.2%). Since last year, Manufacturing employment remained steady (-0.1%). Over the month, employment in the Omaha MSA grew by 344 jobs to 32,554 workers (1.1%). Since July 2011, employment rose by 1,043 jobs (3.3%), which is the strongest growth in July in the past decade, mostly due to Non-durable Goods adding 678 jobs (3.4%).
TRADE, TRANSPORTATION, AND uTIlITIES
Since last month, statewide Trade, Transportation, and Utilities employment dropped by 1,260 to 198,518 jobs (-0.6%) after growing the past four months by 8,074 jobs. Since July 2011, employment has gained 3,162 jobs (1.6%), with most of the year’s increase due to Retail Trade going up by 1,767 jobs (1.7%).
Employment in the Lincoln MSA fell by 742 to 33,280 jobs (-2.2%) since last month. This is the largest monthly loss that has occurred out of the seasonal drops in January. Since July 2011, employment gained 709 jobs (2.2%). In the Omaha MSA, over-the-month employment remained flat at 95,406 jobs after increasing the past three months by 2,842 jobs. From July 2011 to July 2012, employment expanded by 2,760 jobs (3.0%), a high for July. The only month in the past decade with a higher gain occurred in March 2005 (3,458 jobs or 3.6%).
INFORMATION
Statewide over-the-month employment decreased by 107 to 16,354 jobs (-0.7%). It decreased by 544 during the past two month. It is currently the lowest it has been in the past decade. Since July 2011, employment contracted by 652 jobs (-3.8%). The last July it was lower occurred in 2009 (-6.0%).
Employment in the Lincoln MSA dropped to its lowest point this month at 2,094 workers (-18 jobs or -0.9%). Since July
2011, it fell by 75 jobs (-3.5%). In the Omaha MSA, over-the-month employment decreased by 45 to 10,728 jobs (-0.4%). Over-the-year employment is down by 351 jobs (-3.2).
FINANCIAl ACTIVITIES
Over the month, statewide employment decreased by 722 jobs to 68,678 (-1.0%). Monthly declines of -1.0% or more usually only occur in January. Over the year, employment declined by 1,141 jobs (-1.6%) with the majority of the decline coming from Finance and Insurance (-1,078 jobs or -1.8%). The only other year it has been negative in July was in 2009 (-2.0%).
From June 2012 to July 2012, Lincoln MSA employment dropped by 50 to 13,743 jobs (-0.4%) after peaking last month. Since July 2011, employment increased by 180 workers (1.3%). In the Omaha MSA, over-the-month employment declined by 556 to 39,787 jobs (-1.4%). Monthly decreases of 500 or more have only occurred in five months out of the past decade. Over-the-year employment fell by 1,173 jobs (-2.9%) which is the largest decline in the last decade.
PROFESSIONAl AND BuSINESS SERVICES
Statewide over-the-month employment went up by 1,035 to 107,591 jobs (1.0%). During the prior five months it has gained 5,672 workers. Since July 2011, statewide employment has grown by 3,124 jobs (3.0%). It is only 323 jobs away from the historical high that happened in October 2011.
In Lincoln, over-the-month employment expanded by 518 to 19,339 jobs (2.8%). Over the year, employment declined by 1,042 jobs (5.7%). The Omaha MSA posted over-the-month growth for the past four months (3,697) plus this month’s increase of 886 (1.3%) lead to the decade high of 68,173 jobs. Since July 2011, it has rose by 2,815 (4.3%). The majority of the increase came from Professional, Scientific and Technical Services (2,815 jobs or 4.3%).
EDuCATION AND HEAlTH SERVICES
Over the month, statewide employment declined by 939 to 137,030 jobs (-0.7%) due mostly to Educational Services

www.dol.nebraska.govNebraska Workforce Trends|September 2012
seasonal decrease (-746 jobs or -4.4%). Over-the-year employment was up by 1,885 jobs (1.4%), with the majority of gains coming from the Health Care and Social Assistance sector (1,902 jobs or 1.6%) due mostly to the growth in the Ambulatory Health Care Services subsector (1,640 jobs or 4.8%).
Over the year, employment in the Lincoln MSA increased by 495 to 26,102 jobs (1.9%). Since July 2011, the Omaha MSA rose by 3,595 to 74,331 jobs (5.1%), with the majority of the yearly expansion attributable to Health Care and Social Assistance (3,375 workers or 5.6%).
lEISuRE AND HOSPITAlITY
Statewide employment peaked last month at 89,185 jobs, but dropped by 768 in July (-0.9%). Over-the-year employment expanded by 2,110 jobs (2.4%), mostly due to the Food Services and Drinking Places subsector adding 1,479 jobs (2.3%).
From June to July, the Lincoln MSA employment expanded by 202 to 17,080 jobs (1.2%) setting the historic growth for July in the past decade. Over-the-year employment gained 781 jobs (4.8%) which is higher than many years, but was
larger in July 2003 (6.1%). Due to large monthly gains in the Omaha MSA from March 2012 to June 2012 of 7,419 jobs, employment peaked last month at 48,225 jobs; however, July dropped by 1,434 jobs (-3.0%). Since last year, employment remained flat (0.1%).
OTHER SERVICES
After three months of growth (1,717), statewide employment reached its highest point of 37,955 jobs in June. It declined by 387 jobs in July (-1.0%). Over-the-year employment has grown by 1,102 jobs (3.0%) with the only past July that was higher occurring in 2009 (3.7%).
The Lincoln MSA expanded by 218 jobs during the past five months; however, it declined in July by 25 to 7,054 jobs (-0.4%). Since July 2011, employment expanded by 126 jobs (1.8%). Over-the-month employment in the Omaha MSA fell by 96 to 17,614 jobs (-0.5%). Since July 2011, employment rose by 118 jobs (0.7%).

www.dol.nebraska.gov Nebraska Workforce Trends|September 2012
County Rates
Statewide • July unemployment rate: 4.0%
• July Total Non-farm: 958,081
• Manufacturing: 95,280
• Average Weekly Hours: 39.6 hours
• Average Weekly Earnings: $666.86
• Average Hourly Earnings: $16.84
Omaha MSA • July unemployment rate: 4.7%
• July Total Non-farm: 471,140
• Manufacturing: 32,554
lincoln MSA • July Unemployment Rate: 3.8%
• July Total Non-farm: 176,308
• Manufacturing: 12,652
Office of Labor Market Information
Unemployment Rate InfoRmatIon foR JUly 2012
labor Force Employment by Place of Residence:
Nebraska (smoothed seasonally adjusted): • July unemployment rate: 4.0%
• Change (OTM): 0.1%
• Change (OTY): -0.5%
Economic Regions (not seasonally adjusted):• Central: 3.7% • Panhandle: 4.4%
• Mid Plains: 3.7% • Southeast: 4.7%
• Northeast: 4.2%
Revisions to June Data:• Unemployment rate: 0.1%
• Labor Force: 119
• Unemployment: 117
www.dol.nebraska.govNebraska Workforce Trends|September 2012
Commissioner of Labor Catherine D. Lang
LMI AdministratorPhil Baker
EditorScott Hunzeker
Editor/Graphic DesignerAshley Turner
Credits
Nebraska Workforce Trends is published by the Nebraska Department of Labor - Labor Market Information Center in cooperation with the U.S. Department of Labor, Bureau of Labor Statistics.