e nergy s ector i nitiating c overage r eport geo-thermal energy industry senior analyst: amit singh...
TRANSCRIPT
ENERGY SECTORINITIATING COVERAGE REPORTGeo-Thermal Energy Industry
Senior Analyst: Amit Singh
Junior Analysts: Keshav Agnihotri, Stefan Bell, Erik Carlson, Ryan Cantor, Michael Chiu, Hua Li, Julien Mattei, Roma Patel, Jorge Pio, Ashwin Telukuntla, Edison Vo, and Xun Yao
Research Analysts & Sector Head: Craig Arnoff, Bryan Connely, and Matt Rosen
November 17th, 20091
GEOTHERMAL ENERGY INDUSTRY
Companies engaged in the generation and acquisition of geothermal energies through
the development, ownership and operation of geothermal energy plants. These
companies are concentrated in the western continental United States and serve non-
consumer clients such as the Southern California Edison Company. Companies focus
on direct sales and the actual generation and sale of electric power in MwH from
geothermal energy.
2
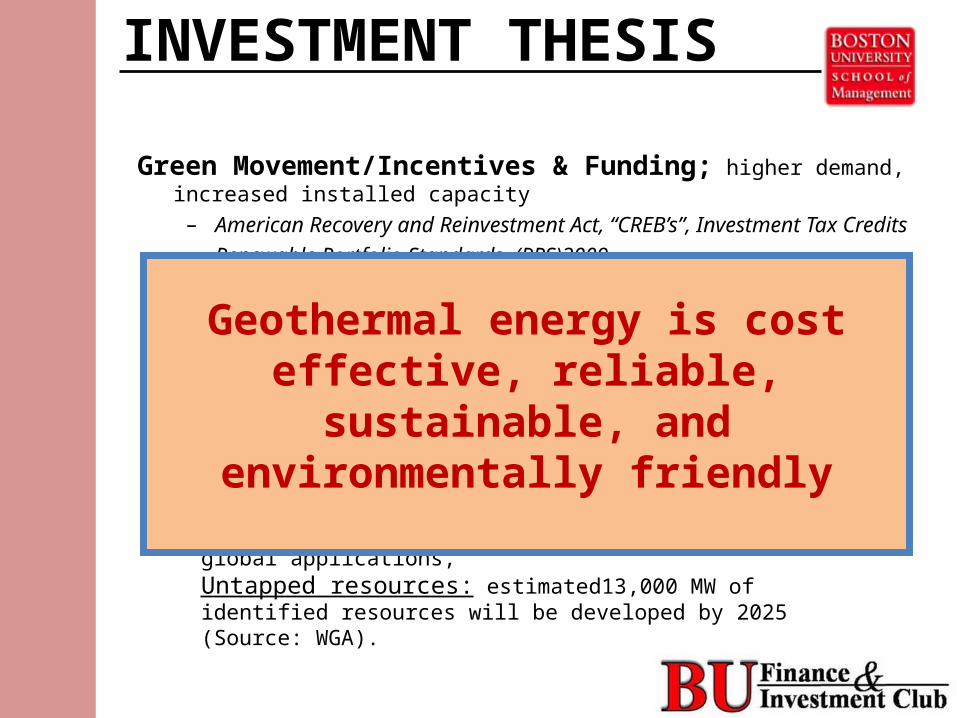
Green Movement/Incentives & Funding; higher demand, increased installed capacity
– American Recovery and Reinvestment Act, “CREB’s”, Investment Tax Credits– Renewable Portfolio Standards (RPS)2009
INVESTMENT THESIS
Competitive Pricing and Stability; Base-load powerPrice ranges from $0.06 - $0.08 / kWh WITH PTC
Technology/Flexibilitybinary cycle, EGS, “waste heat”, direct heat , global applications, Untapped resources: estimated13,000 MW of identified resources will be developed by 2025 (Source: WGA).
Geothermal energy is cost effective, reliable, sustainable, and environmentally friendly
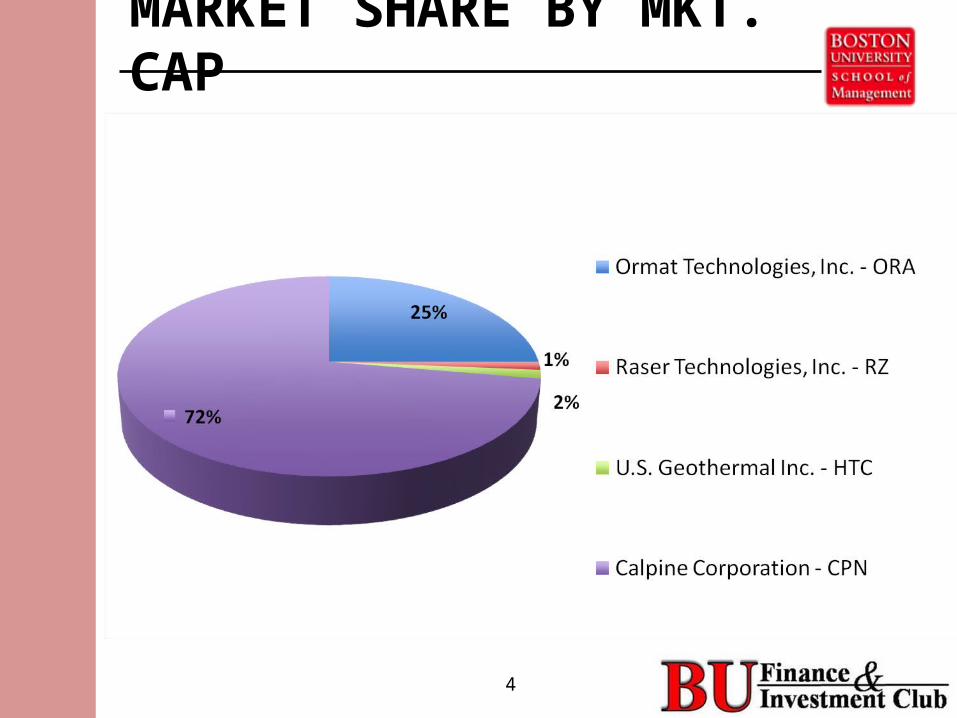
MARKET SHARE BY MKT. CAP
4
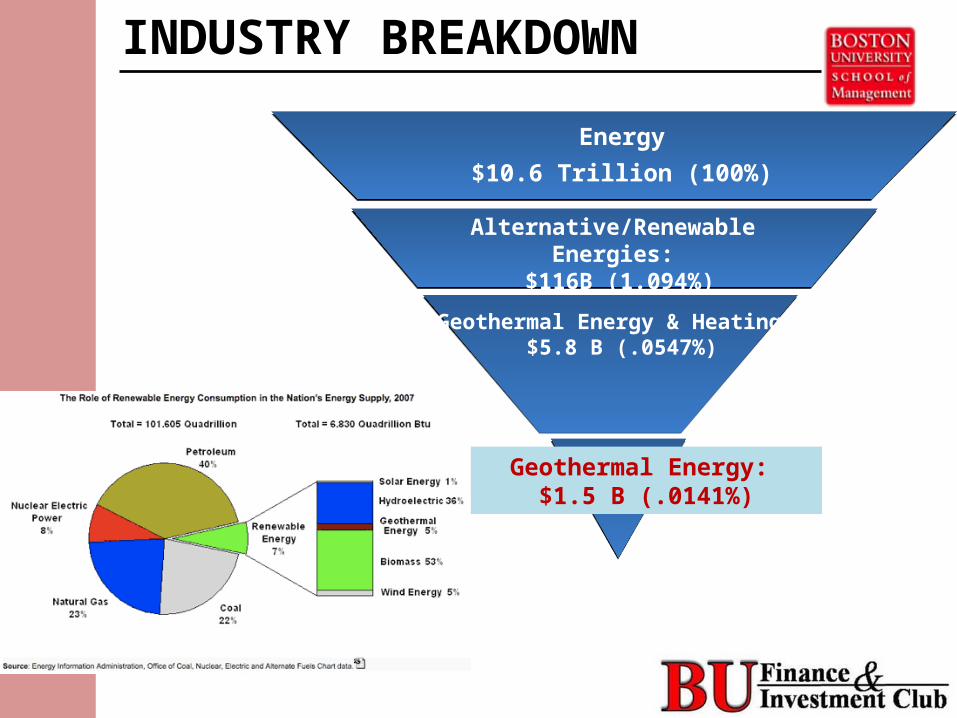
INDUSTRY BREAKDOWN
Energy$10.6 Trillion (100%)
Geothermal Energy: $1.5 B (.0141%)
Geothermal Energy & Heating: $5.8 B (.0547%)
Alternative/Renewable Energies: $116B (1.094%)
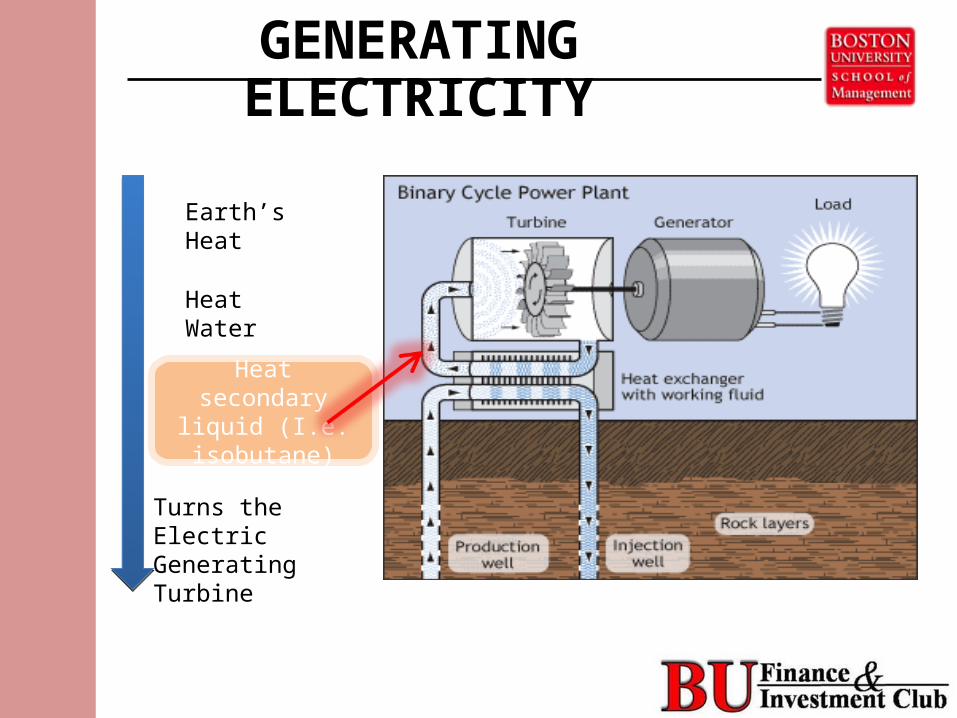
Earth’s Heat
Heat Water
Turns the Electric Generating Turbine
Heat secondary liquid (I.e. isobutane)
GENERATING ELECTRICITY
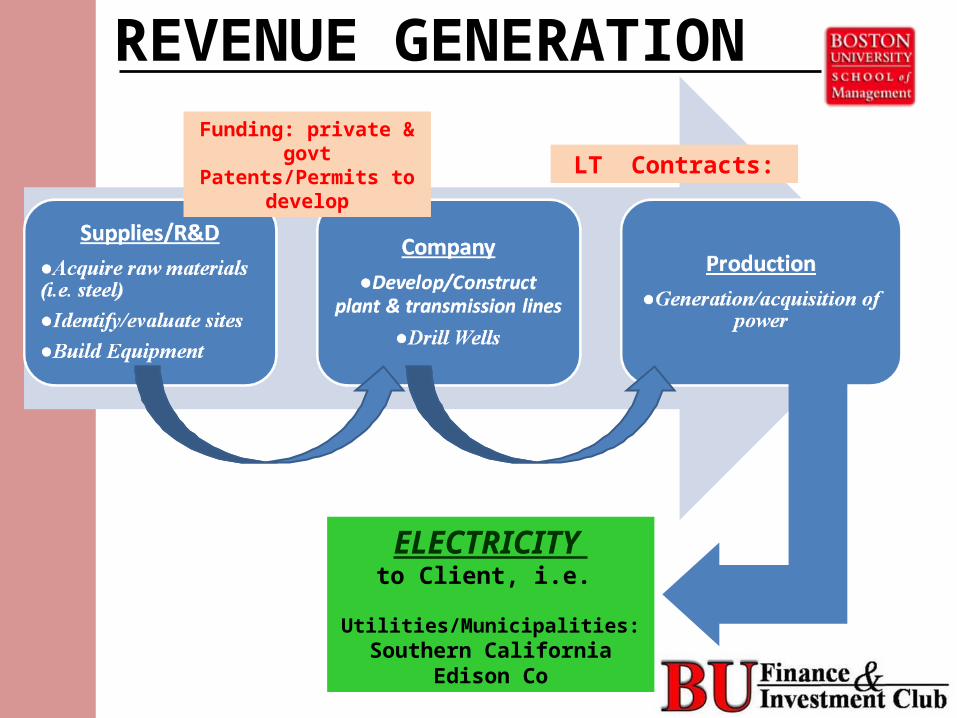
REVENUE GENERATION
LT Contracts:
Funding: private & govtPatents/Permits to
develop
ELECTRICITY to Client, i.e.
Utilities/Municipalities: Southern California Edison Co
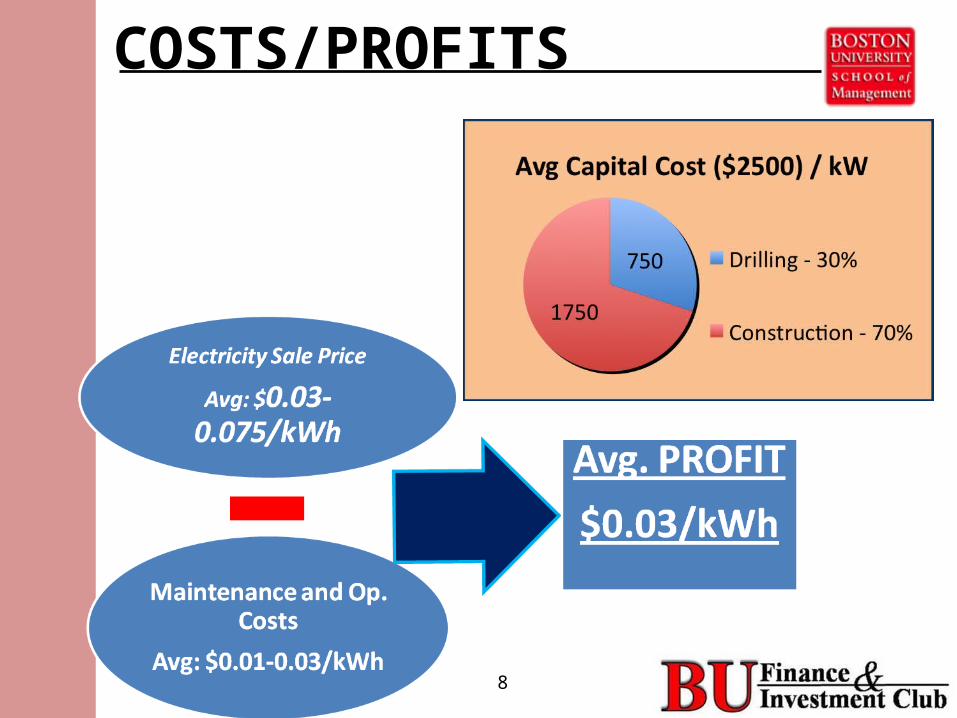
COSTS/PROFITS
8
INDUSTRY TRENDS/DRIVERS
I) Increased installed capacity– Green Movement– Competitive prices
• Base load, PTC $0.02/kWh
II) Stimulus for increased project development
III) Technology Advancement– Hot Dry Rock is EGS
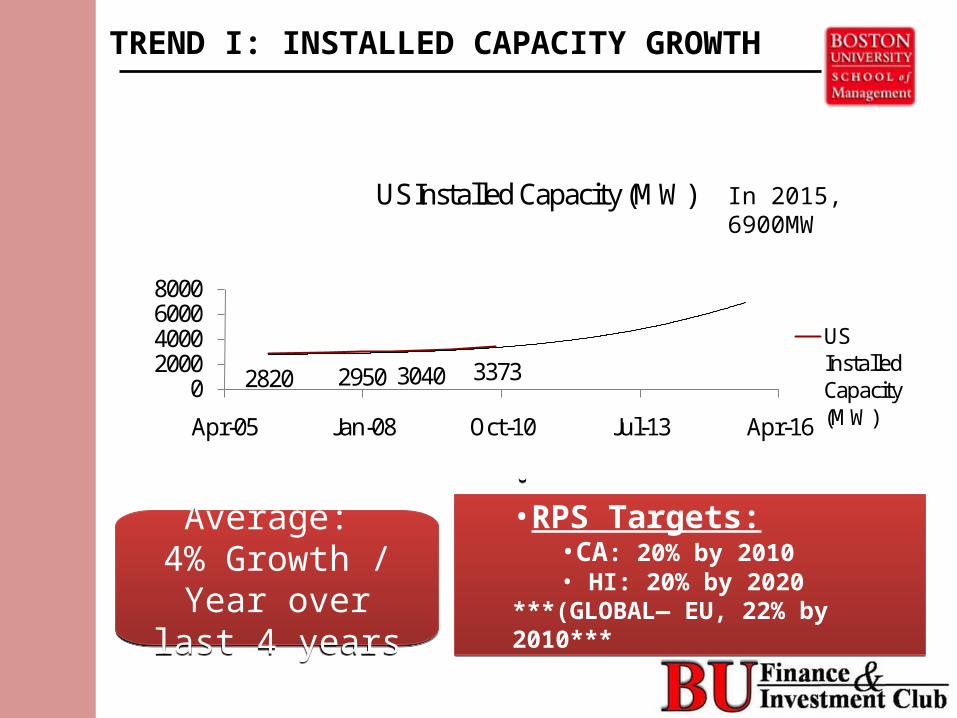
TREND I: INSTALLED CAPACITY GROWTH
2820 2950 3040 33730
2000400060008000
Apr-05 Jan-08 Oct-10 Jul-13 Apr-16
US Installed Capacity (MW)
US Installed Capacity (MW)
Average: 4% Growth / Year over last 4 years
Average: 4% Growth / Year over last 4 years
• •RPS Targets:
•CA: 20% by 2010• HI: 20% by 2020
***(GLOBAL— EU, 22% by 2010***
• •RPS Targets:
•CA: 20% by 2010• HI: 20% by 2020
***(GLOBAL— EU, 22% by 2010***
In 2015, 6900MW
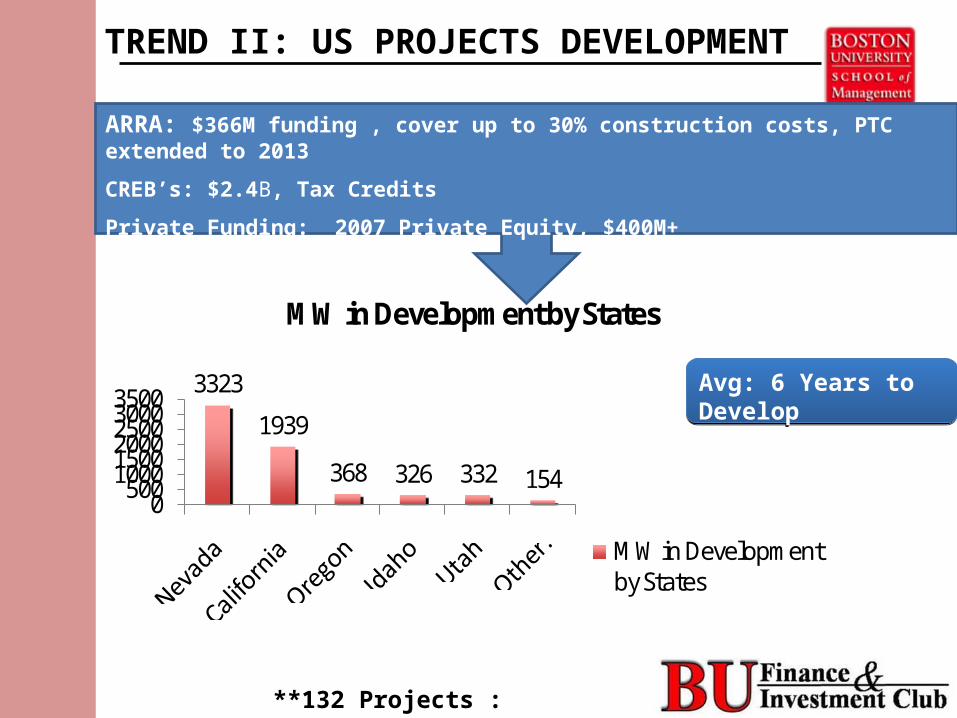
TREND II: US PROJECTS DEVELOPMENT
**132 Projects : 6442MW **
3323
1939
368 326 332 1540500100015002000250030003500
MW in Development by States
MW in Development by States
Avg: 6 Years to Develop Avg: 6 Years to Develop
ARRA: $366M funding , cover up to 30% construction costs, PTC extended to 2013
CREB’s: $2.4B, Tax Credits
Private Funding: 2007 Private Equity, $400M+
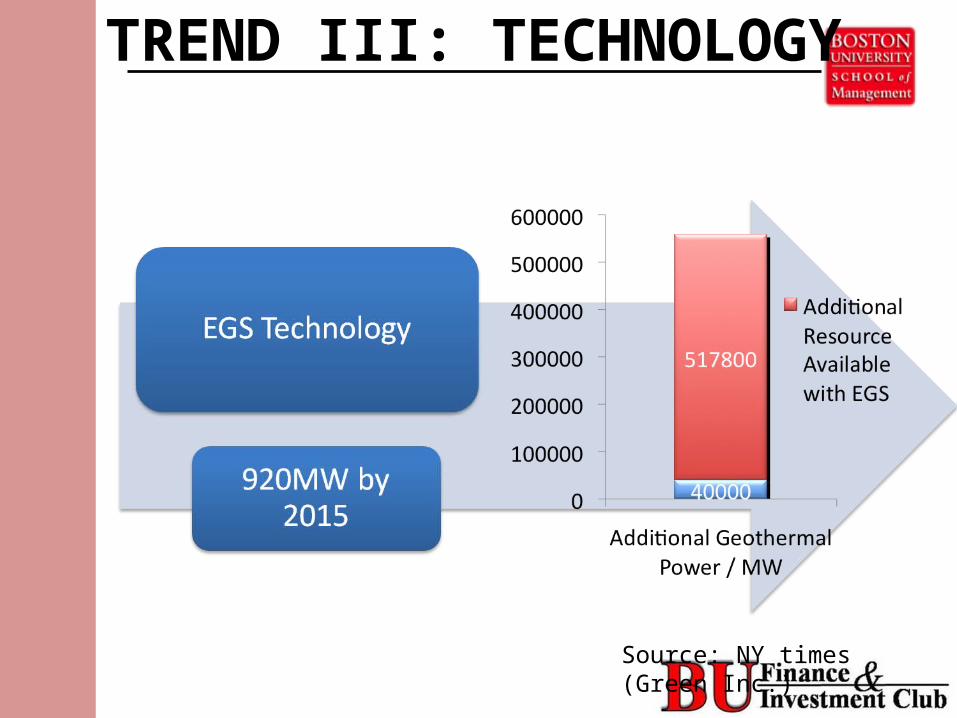
TREND III: TECHNOLOGY
Source: NY times (Green Inc.)
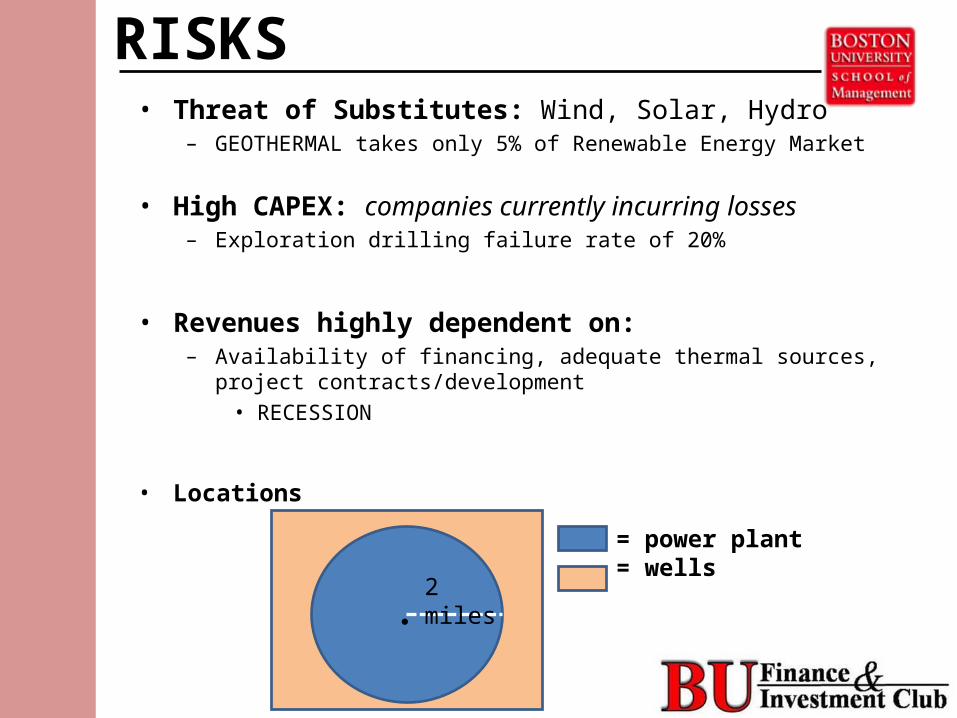
RISKS• Threat of Substitutes: Wind, Solar, Hydro
– GEOTHERMAL takes only 5% of Renewable Energy Market
• High CAPEX: companies currently incurring losses– Exploration drilling failure rate of 20%
• Revenues highly dependent on: – Availability of financing, adequate thermal sources, project
contracts/development• RECESSION
• Locations
2 miles●
= power plant= wells
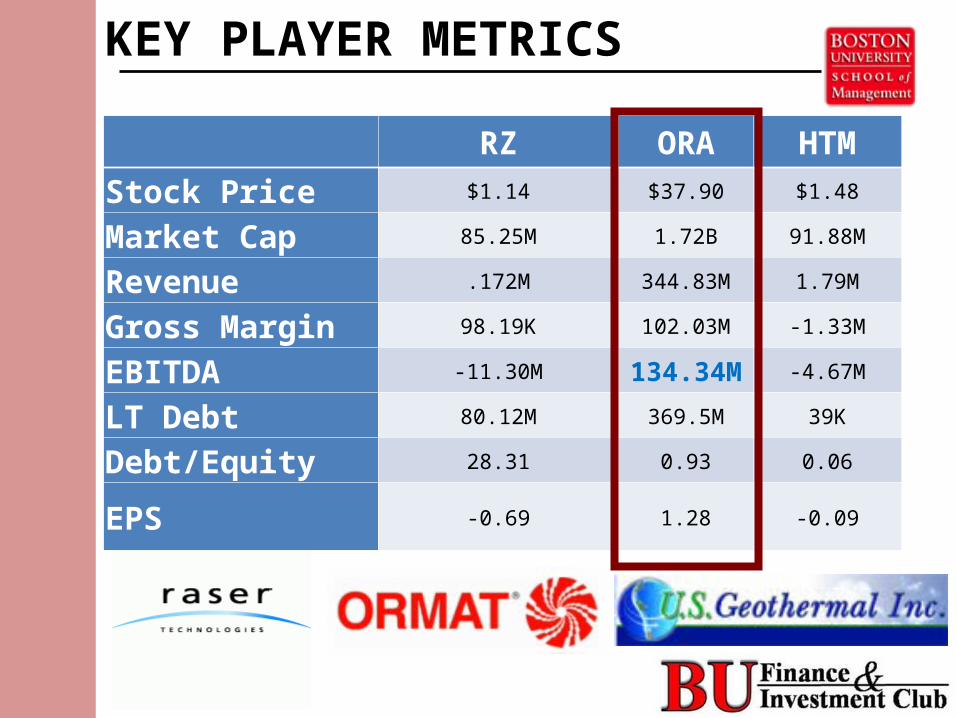
KEY PLAYER METRICS
RZ ORA HTM
Stock Price $1.14 $37.90 $1.48
Market Cap 85.25M 1.72B 91.88M
Revenue .172M 344.83M 1.79M
Gross Margin 98.19K 102.03M -1.33M
EBITDA -11.30M 134.34M -4.67M
LT Debt 80.12M 369.5M 39K
Debt/Equity 28.31 0.93 0.06
EPS -0.69 1.28 -0.09
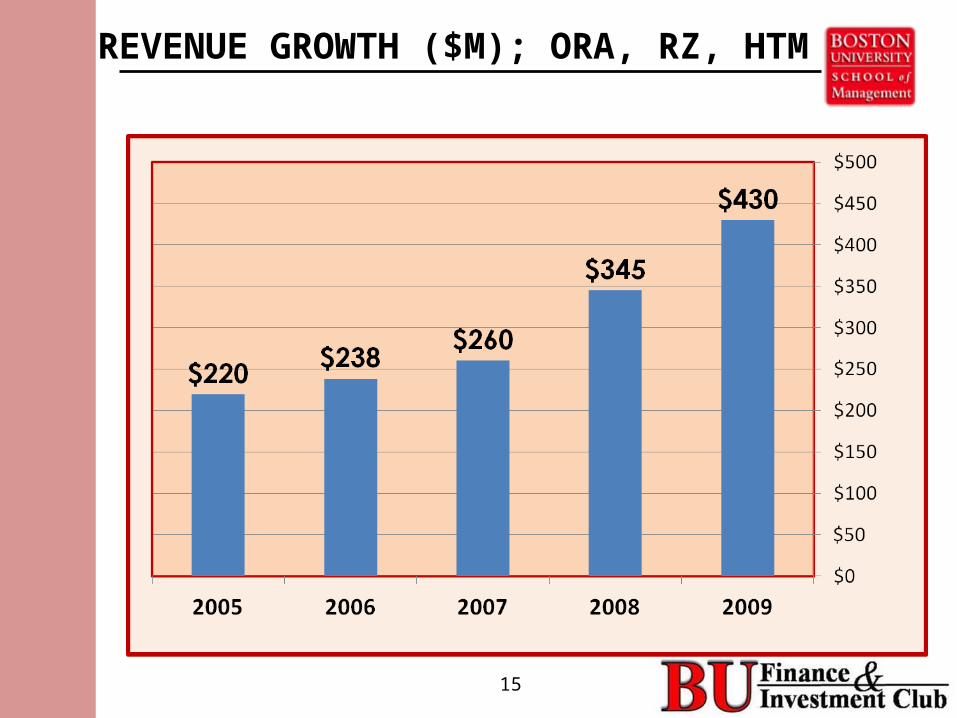
REVENUE GROWTH ($M); ORA, RZ, HTM
15
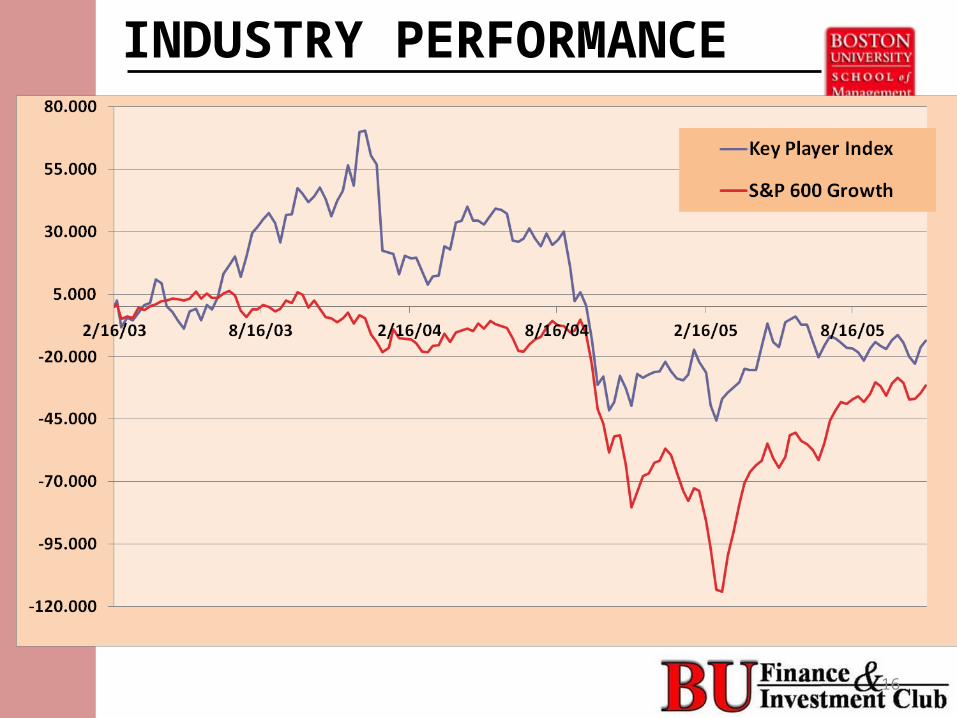
INDUSTRY PERFORMANCE
16

17
Sales Growth (%) 07-08
P/S
Multiples Analysis
17
Market Cap
Most Current Revenue (M)
P/S Sales 2007(M)
Sales 2008 (M)
Sales Growth 07-08
Raser 85.25 .172 495.64 .320 .172 -.462
Ormat 1720 344.83 4.99 295.00M 344.00 .166
HTM 91.88 .184 499.34 .090 .184 1.04
Embryonic stage companiesCompanies are overvalued, BESIDES ORA
ORA has the potential to overtake competitors
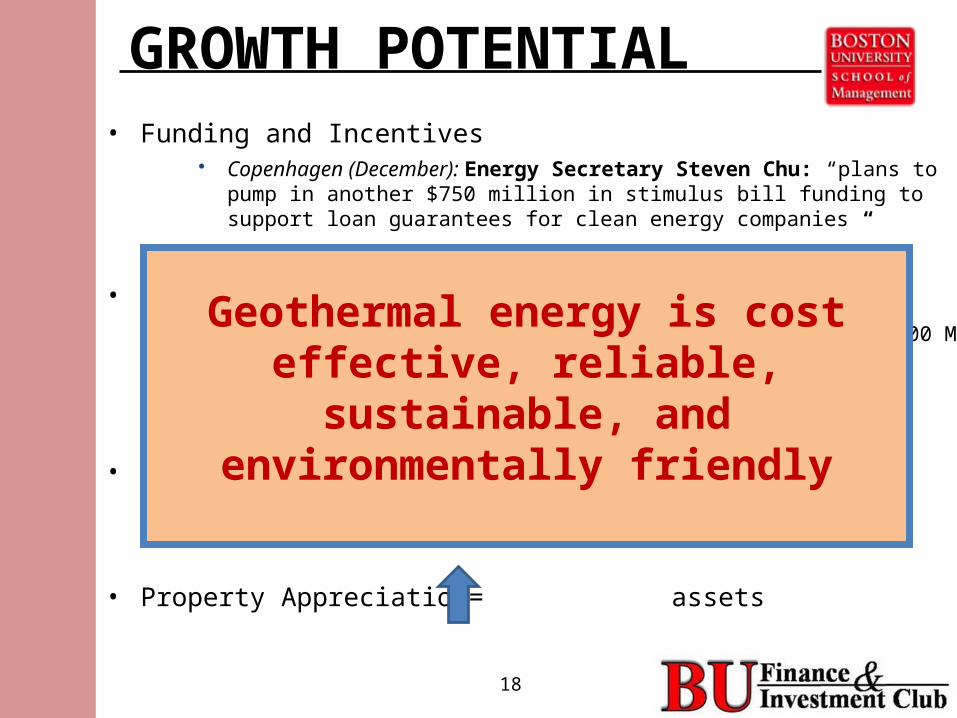
GROWTH POTENTIAL• Funding and Incentives
Copenhagen (December): Energy Secretary Steven Chu: “plans to pump in another $750 million in stimulus bill funding to support loan guarantees for clean energy companies “
• Untapped Resources– Current production: 3,000 MW, potential for up to 300,000 MW
• = electricity sales from $1.8B /yr $11B/yr– Increased drilling = increased exposure to higher heat
• Technology Advances
– “waste heat”
• Property Appreciation= assets
18
Geothermal energy is cost effective, reliable, sustainable, and environmentally friendly
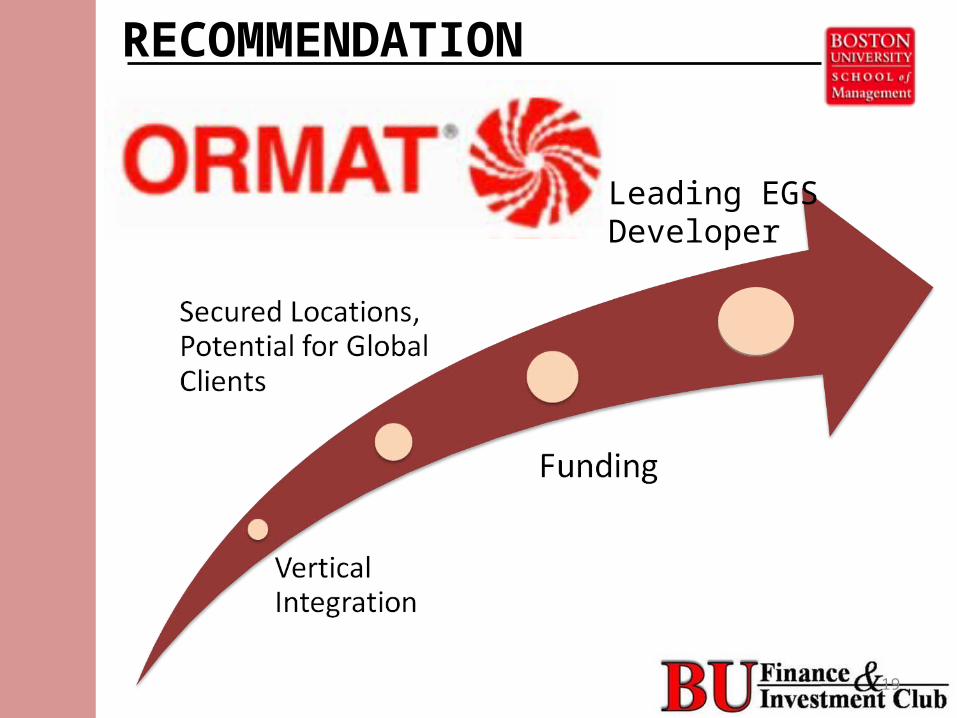
RECOMMENDATION
19
Leading EGS Developer

QUESTIONS?
20
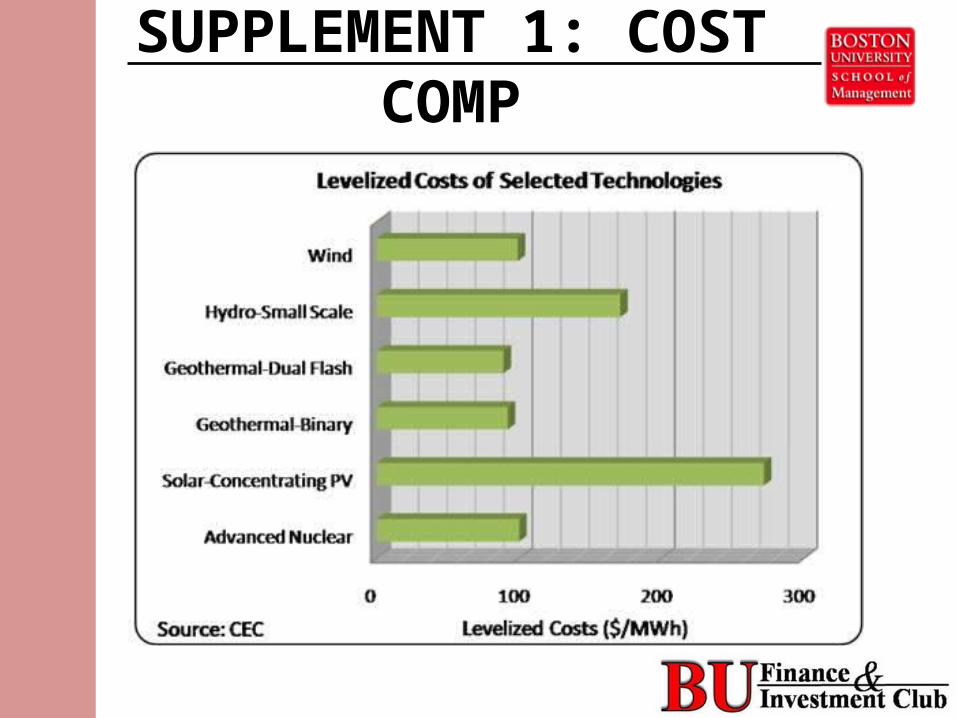
SUPPLEMENT 1: COST COMP
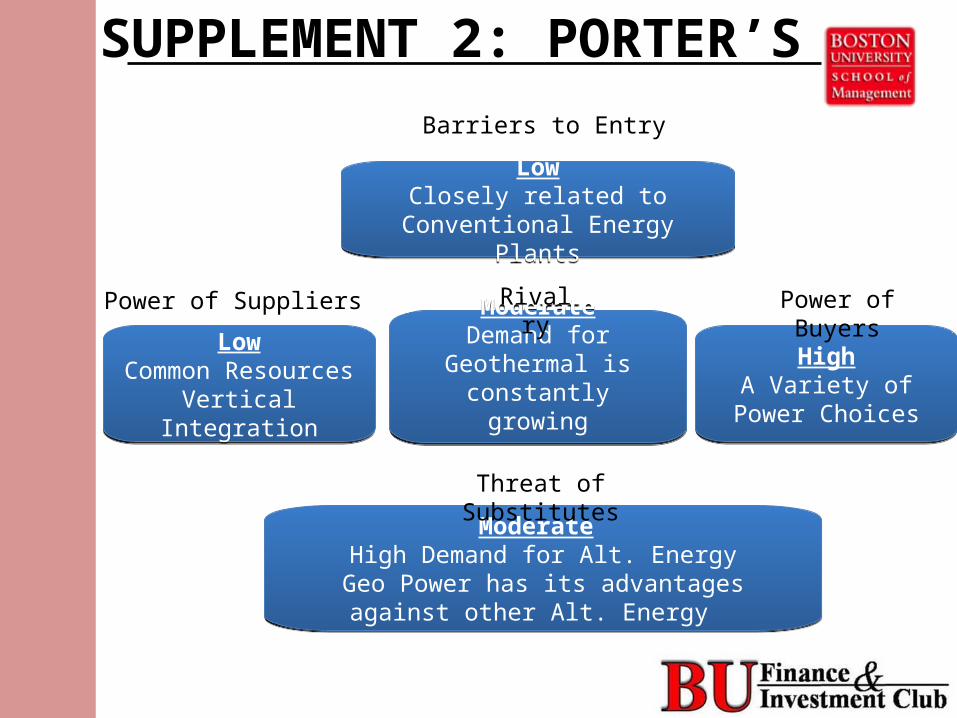
SUPPLEMENT 2: PORTER’S
LowClosely related to Conventional
Energy Plants
LowClosely related to Conventional
Energy Plants
LowCommon ResourcesVertical Integration
LowCommon ResourcesVertical Integration
HighA Variety of Power
Choices
HighA Variety of Power
Choices
Moderate High Demand for Alt. Energy
Geo Power has its advantages against other Alt. Energy
Moderate High Demand for Alt. Energy
Geo Power has its advantages against other Alt. Energy
Barriers to Entry
Power of Suppliers Power of Buyers
Threat of Substitutes
ModerateDemand for Geothermal
is constantly growing
ModerateDemand for Geothermal
is constantly growing
Rivalry