e m f —c c c a - mutual fund news indiacafemutual.com/uploadpdf/634265667275468750_bcg-cams...
TRANSCRIPT

E M F—C C C A
Equity Mutual FundsCharting your Course with a Compass

The Boston Consulting Group (BCG) is a global manage-ment consulting fi rm and the world’s leading advisor on business strategy. We partner with clients in all sectors and regions to identify their highest–value opportunities, address their most critical challenges, and transform their businesses. Our customized approach combines deep in-sight into the dynamics of companies and markets with close collaboration at all levels of the client organization. This ensures that our clients achieve sustainable compet-itive advantage, build more capable organizations, and secure lasting results. Founded in 1963, BCG is a private company with 69 offi ces in 40 countries. For more infor-mation, please visit www.bcg.com.
Through its evolution of more than 20 years, Computer Age Management Services Pvt. Ltd. (CAMS) has emerged as a dynamic and well–regulated institution supporting India’s mutual fund industry. CAMS’s meteoric growth has made it a service solution partner for nearly 60 percent of the Assets under Management and has been built on its fundamental business ethos of being a customer–centric, process–oriented and metric–driven organization. Our fl exibility to align with our clients’ visions and goals, deep domain knowledge, and state–of–the–art technology have all come together to make the journey with the communi-ty we are serving a meaningful one.
Headquartered in Chennai, India, CAMS is a joint venture of three shareholders: HDFC Group, Avent International, and Acsys So ware. For more information please visit www.camsonline.com.

Equity Mutual FundsCharting your Course with a Compass
bcg.comcamsonline.com
Alpesh Shah
Ashish Garg
Kamala Radhakrishnan
N K Prasad
June 2010

© The Boston Consulting Group, Inc. 2010. All rights reserved.
For information or permission to reprint:
Please contact BCG at:E–mail: bcg–[email protected]: +91 22 6749 7001, attention BCG/PermissionsMail: BCG/Permissions The Boston Consulting Group (India) Private Limited Nariman Bhavan 14th Floor Nariman Point Mumbai 400 021 India
Please contact CAMS at:E–mail: [email protected]: +91 44 4203 2952 CAMS/Business DevelopmentMail: CAMS Business Development Computer Age Management Services Pvt. Ltd. 158, Anna Salai Rayala Towers 3rd Floor Chennai – 600 002 India

E M F—C C C
Contents
Preface 4
Executive Summary 5
Introduction 7
The Customer Compass 11
The Product Compass 17
The Channel Compass 23
The Geography Compass 33
The Future 37
Note to the Reader 40
T B C G • C A M S P. L
Preface
The Indian equity mutual fund industry has witnessed spectacular growth in both unit capital and Assets under Management (AuM) in the last few years. This growth has been much higher than the growth of vari-
ous market indices. Also, the equity mutual funds are gaining broader consideration as a fi nancial savings in-strument, as shown by growth in percentage share of household savings and by the increased equity AuM to market capitalization ratio.
We believe that the Indian equity mutual funds industry is likely to continue growing rapidly for the next fi ve to six years given many favourable factors such as under penetration, high economic growth rate, tax benefi ts such as equity linked savings schemes, and enhanced presence in household savings products.
This report focuses on equity mutual funds and is based on detailed analyses of the equity mutual funds data with
CAMS from 2003 to 2010. CAMS accounts for about 57 percent of equity mutual funds AuM in the country as per recent analysis. We also believe that the CAMS data is representative of the industry, with a wide variety of asset management companies (AMCs) being represented in its portfolio. In addition to the CAMS data, focused group discussions were conducted with independent fi -nancial advisors (IFAs) in multiple cities. Unless specifi ed, all years referred in the report should be read as calendar years.
The intent of this report is not to develop detailed recom-mendations and strategy for the AMCs or policy advocacy for the regulator and government. Rather our goal is to identify some key themes and to explain their implica-tions; doing so allows us to off er new insights or to reaf-fi rm existing beliefs. These themes and inspirations build the compass that can be used to chart the future course.
E M F—C C C
Executive Summary
The global asset management industry has been growing steadily over the past decade, with a 9 percent annual growth rate from 2001 to 2007. During this phase, the develop-ing regions—specifically, Asia and Latin
America—have been demonstrating higher growth rates than the rest of the world. The economic downturn in 2008 hit the global asset management industry hard, re-sulting in an approximately 17 percent fall in the total Assets under Management (AuM) and a more than 23 percent fall in retail AuM. The year 2009 has been better, however, and the industry has partially bounced back with approximately 12 percent growth.
In line with the global trends, the Indian asset manage-ment industry demonstrated very rapid growth till 2007 and this industry growth stagnated for a year due to the economic downturn. India too has done better in 2009, and Indian AuM growth is back on track. During the past decade, India’s asset management industry has evolved dramatically in all key dimensions.
The journey so far: the coming of age of the equity mutual funds
Equity mutual funds are increasingly gaining acceptance as a fi nancial savings instrument by retail investors. Mu-tual fund investments as a percentage of gross household savings have increased from a negligible 1.1 percent in 1994 to a more signifi cant 7.9 percent in 2008. As an out-come, equity AuM as a percentage of total market capital-ization has increased from approximately 3 percent in 2004 to approximately 7 percent in 2009. This is because investors, as a group, have generally made money from their investments in equity mutual funds. Our analysis shows that about 72 percent of redemptions, during the
period 2008–2010 were at a profi t.
Retail customers continue to dominate the equity mutual funds with over 90 percent of the investment volume coming from ticket sizes of less than Rs 1 lakh. And truly retail products like systematic investment plans (SIPs) and equity linked savings scheme (ELSS) have grown dra-matically over the past few years to become a substantial part of the AuM. In 2009, SIP subscription infl ows ac-counted for approximately 15 percent of total infl ows in equity mutual funds compared with approximately 2 per-cent in 2005. There are nearly 40 lakh active SIPs today with a small ticket size of about Rs 2,300. SIPs infl ows are nearly immune to market volatility and continue to grow even when the rest of the market is fl at or negative.
ELSS products have been growing rapidly over the past few years and have created larger depth in the overall market. This large pool of retail investors investing through ELSS has ensured that the average duration of the investments is long, approximately 30 months. How-ever, the growth in equity AuM has not been backed up by truly diff erentiated products. Large–cap and multi–cap funds have grown rapidly and now account for 87 percent of total AuM. And not surprisingly, over 80 per-cent of all schemes launched post 2003 have been multi–cap– or large–cap–oriented schemes. The other interest-ing trend regarding the equity mutual fund is that once a scheme belongs to a particular group or set, then the in-fl ows in a scheme are not correlated with its long term performance. In fact, we fi nd that total infl ows in equity mutual funds are not even related to market move-ment.
On the distribution front, there are four key distributor types—banks, national and regional distributors, inde-

T B C G • C A M S P. L.
pendent fi nancial advisors (IFAs), and direct. Interest-ingly, while all the distributors are independent and can sell products from all asset management companies (AMCs), they typically sell three to four AMCs. IFAs dom-inate in smaller cities and retail segments while banks dominate in metros and high networth individuals HNI segments. We also observe stark diff erences in the distri-bution mix across AMCs. Even with just four major dis-tributor types, the share of each distributor type can range from X to 2X among diff erent AMCs. IFAs as a dis-tributor type have gained share over the past few years. If one disaggregates more, it is clear that large IFAs are gaining share rapidly at the expense of the small IFAs and other distributors.
The equity AuM is concentrated, with the top ten cities accounting for about 74 percent of the total AuM and Mumbai and Delhi accounting for about 45 percent of the total AuM. But this concentration of AuM in the top cities is diminishing: the share of AuM beyond the top ten cities increased rapidly from about 10 percent in March 2003 to about 26 percent in March 2010.
Recent regulatory changes have caught most IFAs unpre-pared, and they are now looking to enhance their capa-bilities so as to be able to off er better advice and service. Some other regulatory changes have had a limited impact on the industry so far. For example, there has been lim-ited impact on the distributor category’s share of gross equity infl ows a er the regulatory changes. We also fi nd that AMCs are paying 50–100 basis points to distributors to compensate for their loss a er the removal of entry loads. And mutual fund transactions are yet to gain mo-mentum on stock exchanges. These are early days, and a span of these changes will have a long–term impact on the behaviour of investors, AMCs, and distributors.
The journey ahead for the industry
While the asset management industry has evolved sig-nifi cantly over the past few years, it still has a long way to go. In fact, there are many stark diff erences when com-paring the asset management industry with the more mature and larger life insurance industry. On each of the dimensions, life insurance is at least ten times bigger than the asset management industry. The asset management industry also has to keep regulatory changes in perspec-tive and consider their implications on the business. The big regulatory change that has already happened is the
removal of entry load for all schemes and transparency in payments of commissions to distributors. This is a re-cent phenomenon, and the true impact of this change still has to play out.
In this context, the ten commandments of success for the AMCs in future are:
Develop a plan to get ‘retail’ long term money in a 1. cost–eff ective manner.
Defi ne a city footprint strategy, keeping in mind pro-2. gression of the equity AuM market share beyond the top ten cities.
Defi ne the optimal distribution mix and put in place 3. a plan to get the maximum throughput from all dis-tributors.
Build a value proposition for IFAs to increase share of 4. contribution from IFAs.
Defi ne the value proposition for banks and distribu-5. tors to increase share of wallet by being a preferred fund for private/foreign banks and regional/national distributors.
Invest in public sector banks as a distributor type as 6. the share of PSU banks grows and becomes substan-tial.
Communicate to increase customer awareness and 7. build confi dence with a larger untapped investor community, leveraging the fact that most investors have made money from equity mutual funds.
Explore product innovation as a means of better serv-8. ing customer needs.
Develop a plan to take advantage of the upsurge in 9. demand as the market moves up.
Create the support mechanism for the small IFAs as 10. industry and nurture large pool of small IFAs to en-able IFAs with potential to morph into large IFAs with enhanced investor base.

E M F—C C C
IntroductionThe Full Compass
The asset management industry globally has shown a steady growth trajectory. Analysis from The Boston Consulting Group (BCG) shows that global Assets under Manage-ment (AuM) has increased at a compounded
annual growth rate of approximately 9 percent from 2001 through 2007. This growth, as one would imagine, has not been uniform across the regions, and the developing re-gions have shown much larger growth, albeit from much smaller absolute AuM. As Exhibit 1a shows, Asia (exclud-ing Japan and Australia), Latin America, and Middle East
and South Africa have outgrown the rest of the regions during the same period. Asia grew at approximately 40 percent and Latin America grew at approximately 21 per-cent per annum in the same period. The economic down-turn in 2008 clearly hit the asset management business, and we observed a sharp fall of approximately 17 percent in AuM. Again, this fall was not uniform—Latin America and Asia were largely fl at, while the rest of the market declined dramatically; the market in North America, for example, fell by 21 percent.
Exhibit 1a. Steady increase in global Assets under Management (AuM)
Source: BCG Global Asset Management Market Sizing database 2010.Note: For all countries with non–USD currency, fixed exchange rate as of average 2009 applied to all years. Global includes Offshore AuM.1North America includes US and Canada.2Europe includes UK, Italy, Germany, Netherlands, Spain, Switzerland, Sweden, Denmark, Belgium, Finland, Ireland, Norway, Austria, Portugal, Russia, Luxembourg, Poland, Greece, Czech Republic.3Asia includes China, Hong Kong, India, South Korea, Singapore, Taiwan.4Latin America includes Brazil and Mexico.

T B C G • C A M S P. L.
The year 2009 has been better, and the industry has clearly bounced back with double–digit growth of nearly 12 percent. As in the past, Asia and Latin America have outgrown the rest of the market and registered 22–25 per-cent growth in 2009. This global growth has been across all customer segments, retail as well as institutional, as well as across the retail and institutional subsegments, as shown in Exhibit 1b. All the retail subsegments (mutual funds, unit–linked insurance, unit–linked pensions, pri-vate banking) as well as the institutional segments (insur-ance, pension, nonprofi t, government, banks, corpora-tions) have shown a similar trend. The other interesting trend is that institutional funds are linked less to the mar-ket as compared with retail funds. As a result, retail funds fell more in 2008 and grew more in 2009 compared with institutional funds.
The Indian story is completely consistent with the global story. India has demonstrated a very rapid growth in its asset management business over the past few years. The equity mutual fund (MF) AuM grew at an compounded annual growth rate of about 61 percent from March 2005 through March 2008. The cumulative equity mutual fund units grew by about 20 times (CAMS data only) from
March 2003 through March 2008, as shown in Exhibit 1c. Then the economic downturn took over and the industry growth stagnated. A look at the equity MF units reveals that there has been no net unit capital addition since 2008 and that the total number of units has remained nearly the same since early 2008.
Consistent with the global experience, India has done better in 2009, specifi cally the second half of 2009, and equity AuM growth is back on track. A er a really steep drop from the cliff in 2008, when equity AuM fell by near-ly 50 percent, 2009 has seen a remarkable turnaround; the AuM has nearly made up in 2009 for the drop in 2008, as shown in Exhibit 1d. (This analysis is based on CAMS data alone.)
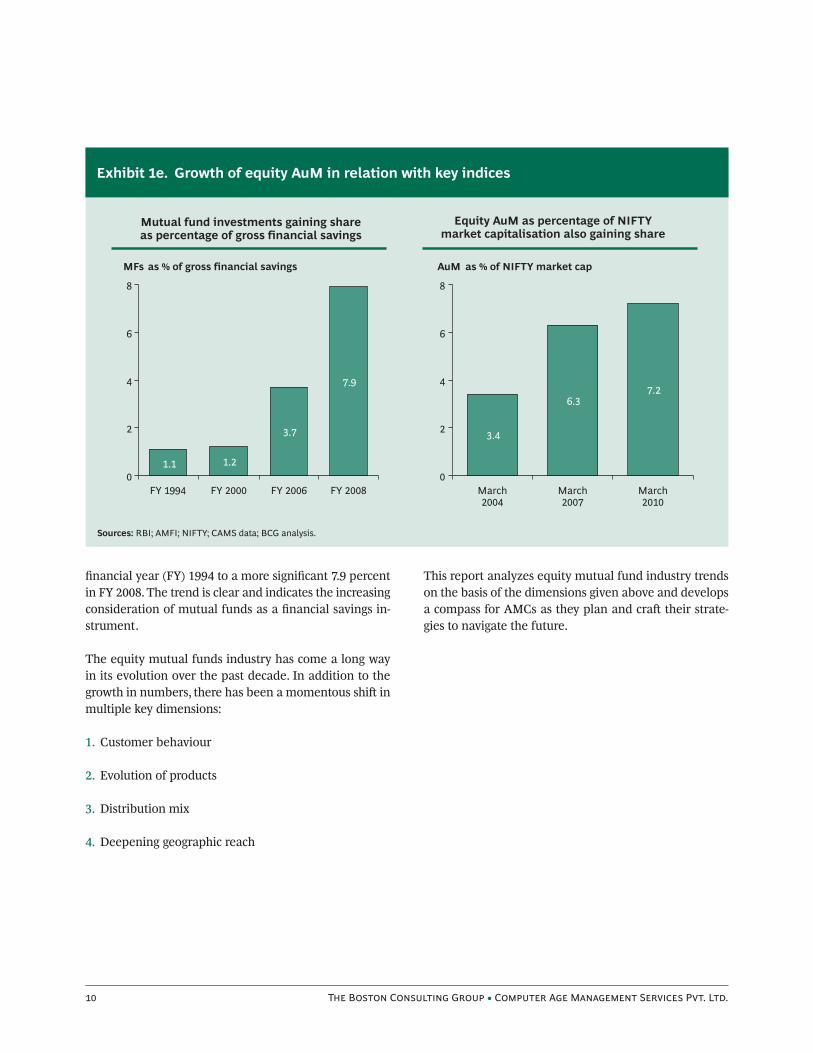
The wind is behind the sails of Indian equity mutual funds as the industry here continues its long–term jour-ney of increase in the share of mutual funds as a percent-age of household savings and an increase in the ratio of equity AuM to market capitalization. As shown in Exhib-it 1e, mutual funds have started coming of age and mu-tual fund investments as a percentage of gross household savings have increased from a negligible 1.1 percent in
Exhibit 1b. Widespread rebound across client segments
Source: BCG Global Asset Management Market Sizing database 2010.Note: For all countries with non–USD currency, average 2009 exchange rate to USD applied to all years.

E M F—C C C
Exhibit 1c. Cumulative equity mutual fund units largely unchanged after January 2008
Exhibit 1d. Growth in equity mutual fund AuM has outpaced the market growth
Sources: CAMS data; BCG analysis.
Sources: CAMS data; BCG analysis.
T B C G • C A M S P. L.
fi nancial year (FY) 1994 to a more signifi cant 7.9 percent in FY 2008. The trend is clear and indicates the increasing consideration of mutual funds as a fi nancial savings in-strument.
The equity mutual funds industry has come a long way in its evolution over the past decade. In addition to the growth in numbers, there has been a momentous shi in multiple key dimensions:
Customer behaviour1.
Evolution of products2.
Distribution mix3.
Deepening geographic reach4.
This report analyzes equity mutual fund industry trends on the basis of the dimensions given above and develops a compass for AMCs as they plan and cra their strate-gies to navigate the future.
Exhibit 1e. Growth of equity AuM in relation with key indices
Sources: RBI; AMFI; NIFTY; CAMS data; BCG analysis.

E M F—C C C
The Indian equity mutual fund investor is maturing. The investor is increasingly con-sidering and accepting mutual funds as an instrument of savings. National Accounts published by the Reserve Bank of India
(RBI) indicate that the share of mutual funds in house-hold savings has increased to 7.9 percent in fi nancial year (FY) 2008 from less than 1.1 percent in FY 1994.
Retail products such as systematic investment plans (SIPs) and equity linked savings scheme (ELSS) are in-
creasingly gaining traction with the retail investors. These products are helping the industry to bring in small inves-tors and investors from outside of the top ten cities.
‘Retail’ consumers dominate equity AuMThe small retail investor clearly dominates the invest-ment volumes, based on our analysis of investment vol-ume by diff erent ticket sizes of investment. Over 90 per-cent of the investment volume is in ticket sizes of less than Rs 1 lakh, and nearly 99 percent of the investment volume is in ticket sizes of less than Rs 5 lakh. Obviously,
The Customer CompassThe Coming of Age of the ‘Retail’ Customer
Exhibit 2a. Equity AuM by customer segment and city as of March 2010
Sources: CAMS data; BCG analysis.

T B C G • C A M S P. L.
share of AuM by value is quite diff erent. As Exhibit 2a shows, nearly 40 percent of the AuM is through ticket sizes of less than Rs 1 lakh, and nearly 60 percent of the AuM is through investments in ticket sizes of less than Rs 5 lakh. The remaining approximately 40 percent of the AuM is through ticket size investments of greater than Rs 5 lakh.
Average tenure for the equity money is about 30 months, with nearly 50 percent of the AuM with tenure greater than two yearsWe estimate that on average the tenure for the equity money is about 30 months. As shown in Exhibit 2b, more than 50 percent of the equity AuM has a tenure of more than 24 months across all channels except the direct channel. And nearly 70 percent of the equity AuM has a tenure exceeding 12 months. Hence, only 30 percent of the AuM has a tenure of less than 12 months. Investors seem to prefer long–term investments. The preference toward long–duration assets may refl ect the growing im-portance that retail investors are attaching to equity mu-tual fund investments as a savings tool. The popularity of ELSS and SIP has also contributed to the enhanced dura-tion of equity AuM. In any case, this customer behaviour
is clearly favorable for the overall market and the inves-tors.
The other interesting facet is that in spite of diff erences amongst the organization and structure of various dis-tributor types, there is similarity in AuM investment ten-ure across distributor types. This implies that customer behaviour is independent of the distributor. Possibly, an average investor makes entry and exit decisions, based on his or her understanding of the market and personal choice. This again augurs well for the industry because it suggests that the investors are getting knowledgeable and have a mind of their own.
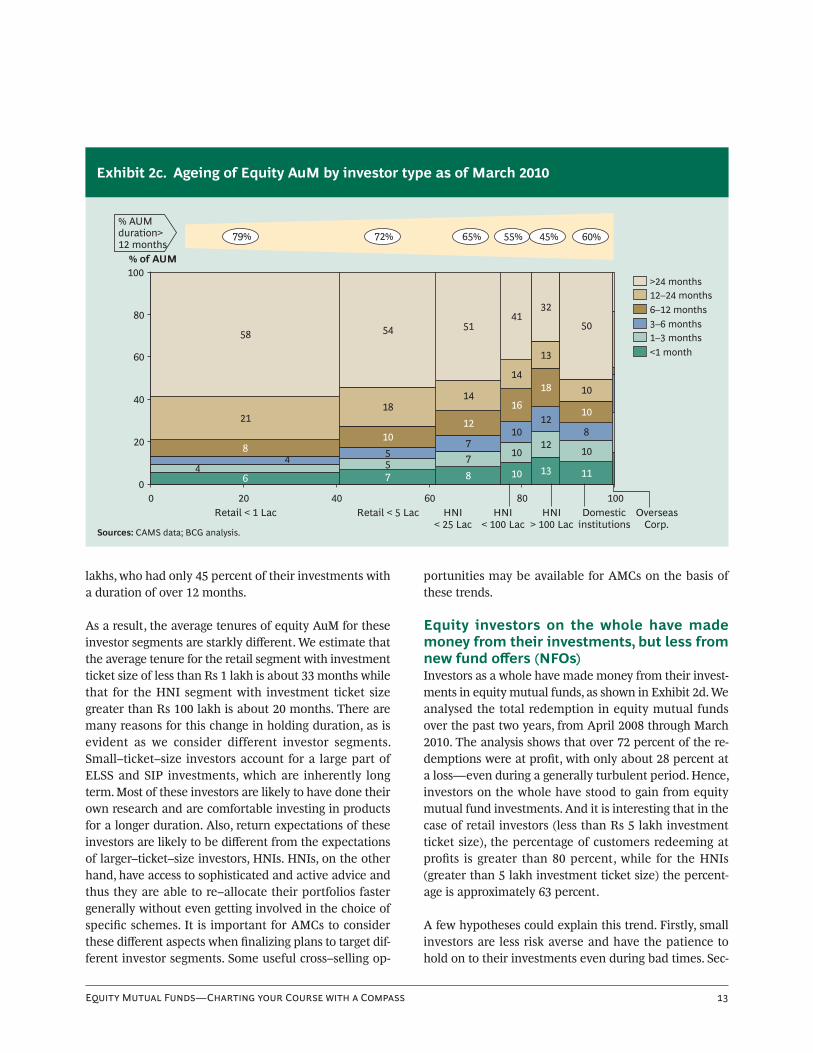
‘Retail’ investors have signifi cantly longer holding duration than HNIsThere are signifi cant diff erences in investment duration by type of investor. While the average tenure across the industry is about 30 months, retail and mass customers (not surprisingly) have a longer tenure AuM than high networth individuals (HNIs). As per Exhibit 2c, investors with ticket sizes of less than Rs 1 lakh had 79 percent of their investment with a duration of over 12 months as compared with HNI investors with ticket size over Rs 100
Exhibit 2b. Equity AuM by tenure and distributor type as of March 2010
Sources: CAMS data; BCG analysis.
E M F—C C C
lakhs, who had only 45 percent of their investments with a duration of over 12 months.
As a result, the average tenures of equity AuM for these investor segments are starkly diff erent. We estimate that the average tenure for the retail segment with investment ticket size of less than Rs 1 lakh is about 33 months while that for the HNI segment with investment ticket size greater than Rs 100 lakh is about 20 months. There are many reasons for this change in holding duration, as is evident as we consider different investor segments. Small–ticket–size investors account for a large part of ELSS and SIP investments, which are inherently long term. Most of these investors are likely to have done their own research and are comfortable investing in products for a longer duration. Also, return expectations of these investors are likely to be diff erent from the expectations of larger–ticket–size investors, HNIs. HNIs, on the other hand, have access to sophisticated and active advice and thus they are able to re–allocate their portfolios faster generally without even getting involved in the choice of specifi c schemes. It is important for AMCs to consider these diff erent aspects when fi nalizing plans to target dif-ferent investor segments. Some useful cross–selling op-
portunities may be available for AMCs on the basis of these trends.
Equity investors on the whole have made money from their investments, but less from new fund off ers (NFOs)Investors as a whole have made money from their invest-ments in equity mutual funds, as shown in Exhibit 2d. We analysed the total redemption in equity mutual funds over the past two years, from April 2008 through March 2010. The analysis shows that over 72 percent of the re-demptions were at profi t, with only about 28 percent at a loss—even during a generally turbulent period. Hence, investors on the whole have stood to gain from equity mutual fund investments. And it is interesting that in the case of retail investors (less than Rs 5 lakh investment ticket size), the percentage of customers redeeming at profi ts is greater than 80 percent, while for the HNIs (greater than 5 lakh investment ticket size) the percent-age is approximately 63 percent.
A few hypotheses could explain this trend. Firstly, small investors are less risk averse and have the patience to hold on to their investments even during bad times. Sec-
Exhibit 2c. Ageing of Equity AuM by investor type as of March 2010
Sources: CAMS data; BCG analysis.

T B C G • C A M S P. L.
ondly, they have likely invested for a longer duration, thus giving themselves a larger window of opportunity to re-deem at profi t. Unlike retail, for HNI investors, the mar-ket uncertainty and active management could be the main reason for comparatively larger proportion of re-demptions at losses.
Though investors’ experience is signifi cantly diff erent with redemption from NFOs, out of the approximately Rs 7,000 crore redemptions over the same two–year period between April 2008 through March 2010, only about 50 percent of that volume was redeemed above par value, as shown in Exhibit 2e. And within the remaining 50 per-cent redeemed at profi t, nearly 22 percent was redeemed at a net asset value (NAV) of less than Rs 11, implying a return of less than 10 percent. Thus we infer that inves-tors’ experience within NFO redemptions has not been encouraging.
Equity infl ows are not linked to scheme per-formance and overall market movementConventional wisdom would suggest a high correlation between infl ows in a scheme and the long–term perfor-mance of that scheme. However, there is no correlation
between infl ows in a scheme and the scheme perfor-mance as shown in Exhibit 2f. We compared the long–term returns (fi ve–year returns) of select schemes (having similar investment objective) with the infl ows in those schemes in the following year,. And that revealed no cor-relation. This is quite intriguing and seems to imply that once a scheme belongs to a particular set, then either investors do not fi ne–tune their choice or they are more comfortable with other factors such as brand image of the AMC.
We then posed a question trying to establish a correlation between change in gross infl ows and change in market, using NIFTY as a proxy for the market. As shown in Ex-hibit 2g, the change in gross infl ow has been plotted with a period of one–month lag against the change in NIFTY. Out of 82 months plotted, we observe that for 50 months the direction of change in gross infl ow, lagging by a peri-od of one month, was in the same direction as the change of NIFTY and it was the opposite for 32 months. With a very poor R2 of 8 percent, it is safe to assume that there is no meaningful correlation between the gross infl ows and market movement. This chart off ers other interesting perspectives as well. There appears to be a fl oor in the
Exhibit 2d. Total outflows from April 2008–March 2010 by different investor segments
Sources: CAMS data; BCG analysis.

E M F—C C C
Exhibit 2e. NFO redemptions at different NAVs (April 2008–March 2010)
Sources: CAMS data; BCG analysis.
Exhibit 2f. Multicap scheme inflows not correlated with its five–year performance
Sources: CAMS data; BCG analysis.Note: Each bullet type represents a particular year.

T B C G • C A M S P. L.
negative change in gross infl ows. Irrespective of the sharp drop in NIFTY, the infl ows don’t drop beyond a certain level. This may be happening because of increased sub-scriptions of SIPs and value buying by investors at time of dips. The top righthand box indicates somewhat better correlation between gross infl ows and NIFTY movement, suggesting that in ‘exuberant times’ investors are willing to be more open to investing in equity mutual funds.
Implications for AMCs
The maturing Indian equity mutual fund investor raises a set of questions for the AMCs:
What is the plan to get ‘retail’ money in a cost–eff ec-1. tive manner? How can AMCs get longer–term inves-tors?
While HNI money is concentrated it also has the • lowest duration. Is there a sweet spot with respect to investor category?
How can AMCs leverage the fact that investors have 2. stood to gain from equity mutual fund investments, with over 70 percent AuM redeemed at profi ts?
How best can AMCs use this information and com-• municate more to build confi dence with a larger untapped investor community?
If scheme performance is not the driver of customer 3. choice, what is? AMCs need to truly understand cus-tomer choice and act on the same. Considering the potential linkages to market movements, AMCs should be prepared to take advantage of the upsurge in de-mand as the market moves up.
While NFOs may be a good way to mobilize money, 4. mis–selling may be involved. AMCs may need to re-consider their NFO strategy and communication.
Exhibit 2g. Relation between gross inflows and NIFTY change (2003–2010)
Sources: CAMS data; BCG analysis.

E M F—C C C
The growth in equity mutual funds has been spectacular. As discussed in the introduc-tion chapter, between March 2003 and March 2008 the number of Indian equity mutual fund units grew by over 20 times; in
comparison, the market index grew by approximately 5 times. The evolution of equity mutual fund products has been a story of savings and simplicity, as the products have been aligned with the needs of small investors via systematic investment plans (SIPs) encouraging invest-ments even at small ticket sizes, less than Rs 1,000. The rapid growth of SIPs and equity linked savings scheme (ELSS) products is a measure of the movement toward savings. And the proliferation of large–cap and multi–cap funds points to the simplicity of the equity mutual fund product evolution story. (Note that exchange traded funds (ETFs), which constitute about 0.5 percent of eq-uity assets, have not been included in this study.)
SIPs are rapidly gaining share as percentage of infl ows SIPs are fast gaining currency amongst the investor com-munity. This is best observed in the division of infl ows share between SIP and non–SIP subscriptions, shown in Exhibit 3a. From a modest share of about 2 percent in-fl ows in 2005, SIPs accounted for about 15 percent of infl ows in 2009. Their impressive march continues: SIPs accounted for about 19 percent of infl ows in the fi rst quarter of 2010. This translates into an impressive growth of roughly 50 percent in volumes through SIP subscrip-tions. One of the key reasons for this growth has been sustained campaigns by many asset management com-panies (AMCs) promoting investments through SIP sub-scriptions. Other reasons include positive investor expe-rience, third–party recommendation by a large number of fi nancial planners, and similarity of the products to
other saving products such as recurring deposits. We be-lieve that SIPs will continue to grow in share and that this bodes well both for the investors and for the indus-try.
SIP infl ows are nearly immune to market volatilitySIP infl ows have had continuous growth over the last four years and seem to be almost immune to general market volatility. In the period from January 2006 to January 2010, but specifi cally from September 2008 to February 2009, SIP infl ows have grown continuously, as shown in Exhibit 3b. In comparison, overall gross infl ows in equity mutual funds have been volatile. To reiterate the point, despite the sharp downturn in the equity mar-kets from January 2008 onwards, the fall in infl ows from SIP subscriptions was observed only from September 2008. This is attributable to investor behavior associated with SIP subscriptions. Most of these investors have lon-ger–term investment horizons and do not get rattled by market volatility. This SIP infl ows trend has a very posi-tive impact on the industry.
SIPs are a truly small savings product, with small ticket size, distributed electronicallySIPs have grown dramatically in the past few years; the number of live SIPs has multiplied many–fold. In March 2010, there were over 22 lakh live SIPs with CAMS alone. This fi gure was a paltry 32,000 in 2004 and about 8 lakh in 2006. And this is just the number of SIPs with CAMS. Extrapolating based on CAMS’ share, we estimate that there are nearly 40 lakh live SIP accounts in the Indian market. Most of this growth has come from the small savings investors. This assertion is supported by the de-creasing average size of subscription. The average ticket size of the SIPs has marginally decreased over the last
The Product CompassGoing ‘Retail’

T B C G • C A M S P. L.
Exhibit 3b. SIP inflows less volatile compared with overall inflows
Sources: CAMS data; BCG analysis.
Exhibit 3a. SIP steadily gaining popularity as an investment vehicle
Sources: CAMS data; BCG analysis.1First quarter of 2010.

E M F—C C C
Exhibit 3c. Small ticket size SIPs continue to dominate
Sources: CAMS data; BCG analysis.
few years, as shown in Exhibit 3c. In 2006, the average ticket size was approximately Rs 2,700; it is now approx-imately Rs 2,300. The fact that sub–Rs 1,000 SIP sub-scription accounts for more than 58 percent of live SIP accounts clearly points to the use of SIPs for small sav-ings.
Sustaining SIPs at this small ticket size is clearly an eco-nomic challenge. But the AMCs have realized that the only way growth will come is through the small ticket sizes. As a result, most AMCs have stipulated the mini-mum subscription limit for SIP subscriptions at levels below Rs 1,000. And they are sustaining this through au-tomation and electronic means. This has led to a mate-rial change in the way investors subscribe to SIPs. In 2004, less than 10 percent of SIP subscription infl ows were subscribed electronically. By 2009, this proportion had risen to 97 percent, as shown in Exhibit 3d. This al-lows a signifi cant reduction in transaction cost for SIP subscriptions.
AMCs will need to continue identifying appropriate channels and servicing models as they tap and continue to grow this investor segment to ensure sustainability.
ELSS infl ows are growing strongly and creat-ing depth in the marketELSS products are another big success story for the Indi-an equity mutual funds industry. ELSS infl ows grew at an annual rate of approximately 200 percent between 2004 and 2008, backed by tax incentives provided by the gov-ernment of India. In 2007 and 2008, ELSS infl ows were over Rs 4,500 crore for schemes managed by CAMS alone. Given the strong linkage with tax incentives provided, there is a clear seasonality in the infl ows of ELSS schemes and March is the peak month for ELSS infl ows. Sensing this need and behaviour, many AMCs put their selling force behind ELSS schemes during the months of Janu-ary, February, and March.
ELSS is primarily a ‘retail’ product because of the tax benefi ts. Nearly 75 percent of all ELSS infl ows are in tick-et sizes lower than Rs 1 lakh, and nearly 95 percent are in ticket sizes of less than Rs 5 lakh. Another interesting facet is the depth in geographical reach created by ELSS. Exhibit 3e provides details of ELSS infl ows distribution between the top ten cities and other locations. The share of ELSS infl ows from beyond the top ten cities has steadi-ly increased, from 20 percent to 38 percent in the period

T B C G • C A M S P. L.
Exhibit 3e. Sizeable ELSS inflows coming from beyond top 10 cities
Sources: AMFI; CAMS data; BCG analysis. 1Mumbai, Delhi, Bangalore, Chennai, Kolkata, Pune, Ahmedabad, Hyderabad; Chandigarh, Jaipur.2First quarter of 2010.
Exhibit 3d. Increasing adoption of electronic payment for SIP subscriptions
Sources: CAMS data; BCG analysis. 1Mandates include all kinds of instructions such as ECS, debit mandates, standing instruction, etc. except cheque.2First quarter of 2010.

E M F—C C C
Exhibit 3f. ‘Sectoral’ funds have lost significant share in product mix
Sources: CAMS data; BCG analysis.
Exhibit 3g. Most manufacturers launched either large or multicap equity schemes
Sources: CAMS data; BCG analysis.

T B C G • C A M S P. L.
from 2003 to 2010. This 38 percent for ELSS compares with approximately 26 percent for the overall equity AuM. This clearly demonstrates that ELSS is reaching out further and is getting more untapped investors into the mutual fund fold.
Sectoral and mid cap funds have lost market share The growth in equity AuM has not, however, been backed by truly diff erentiated products from the AMCs. The unique sectoral and mid–cap funds have lost signifi cant market share and now represent only about 13 percent of total AuM. Large–cap and multi–cap funds have grown rapidly and now account for 87 percent of total AuM as shown in Exhibit 3f. This is further supported by the fact that out of 202 product schemes launched by diff erent AMCs since 2003 (with CAMS), 160 schemes were multi–cap– or large–cap–oriented. And only 16 schemes were sector–oriented. This is shown in Exhibit 3g. There are many reasons for this outcome, including limited penetra-tion in the Indian market and, more importantly, limited
understanding of the sectoral products by investors and lack of proper advice to larger numbers of investors. The key question remains whether AMCs can and will diff er-entiate themselves based on products.
Implications for AMCs
The product trends raise a couple of questions for AMCs:
Given the attractiveness of SIPs (long retention and 1. low volatility), how should AMCs build their business and distribution models to tap and grow small–ticket–size savings–oriented products? Given the high accep-tance of SIPs, should AMCs introduce new metrics in their business, such as number of SIPs per investor or per household?
Is there breakout growth opportunity for AMCs based 2. on product?

E M F—C C C
The Indian equity mutual funds industry has four key channels, as shown in Exhibit 4a and described here:
Independent financial advisors (IFAs): Nearly 100,000 IFAs are registered with As-
sociation of Mutual Funds in India (AMFI )and nearly 80 percent of IFAs sell other fi nancial products in addition to mutual funds—for example, life insurance, small sav-ings, general insurance. Of the 100,000 IFAs registered, many are dormant and inactive; amongst the remaining
IFAs, many sell mutual funds part time to supplement their families’ income. Most IFAs typically sell mutual funds of three or four asset management companies (AMCs).
Banks: Banks, especially private and foreign, have been selling mutual fund products to their customers through their branch network and wealth relationship managers. While banks typically empanel funds of many AMCs, most of them basically sell funds of three to fi ve AMCs. Public sector banks entered the distribution business
Exhibit 4a. Distribution channel mix as of March 2010
Sources: CAMS data; BCG analysis.
The Channel CompassThe Evolving Distribution Landscape

T B C G • C A M S P. L.
late and are yet to establish themselves in this business. Overall, banks contribute to a substantial part of AuM.
National and regional distributors: The national and regional distributors typically have a more organised and formal setup compared to IFAs with many of them hav-ing their own branch network, salesforce, and online channel. In addition, many of them aggregate some of the sub–brokers’ business.
Direct: Direct channel refers to the sale of mutual funds to the investor directly by the AMCs, through their of-fi ces and through their online channels.
Channel mix is starkly different across AMCsWhile the above mix is the industry average mix, there are stark diff erences in the channel mix across AMCs. The range of diff erences in channel mix is highlighted in Exhibit 4b. This exhibit has the distribution channel mix for three typical AMCs. The share of bank ranges from 19 percent to 38 percent, IFAs from 20 percent to 34 per-cent, and distributors from 29 percent to 42 percent. Across channels, we observe an X to 2X variance be-
tween diff erent AMCs. This implies that AMCs have sig-nifi cant diff erences in their approach to diff erent chan-nels.
Large IFAs are gaining share rapidly, while small IFAs are losing shareThe evolution of channel mix has been interesting over the past few years. On the one hand, there seems not to have been much change, while on the other hand there have been signifi cant movements in the channel mix. As Exhibit 4c shows, the change of channel share is minimal over six years from 2004 to 2010. The only substantial movement has been the growth in the share of IFAs from about 18 percent in 2004 to about 29 percent in 2010. Moreover, further probing reveals starker movement in mix: the share of large IFAs (>1 crore CAMS AuM) has increased from 10 percent in 2004 to 23 percent in 2010.
At the same time, the small IFAs (<10 lakh CAMS AuM) are losing share. The total share of small IFAs has fallen from about 6 percent in 2004 to less than 1 percent in 2010. Further analysis indicates that small IFAs are large-ly inactive, with no sales recorded. On average, nearly 80 percent of all small IFAs are inactive every month. This
Exhibit 4b. Distribution channel mix for three AMCs as of March 2010
Sources: CAMS data; BCG analysis.

E M F—C C C
Exhibit 4c. AuM share of different distributor categories over 2004–2010
Sources: CAMS data; BCG analysis.1Includes National, Regional and Distributor with online presence. 2Large IFA = CAMS AuM > 1 cr; Medium IFA = CAMS AuM between 10 lakh to 1 cr; Small IFA = CAMS AuM < 10 lakh.
implies that small IFAs are either growing bigger and becoming medium IFAs (CAMS AuM between 10 lakh and 1 crore) or quitting this business.
The growth in share of IFAs from 18 percent to 29 per-cent is even more interesting given the fact that typically the services provided by IFAs are basic. As shown in Ex-hibit 4d, most IFAs off er basic services and their proposi-tion is based on off ering simple convenience to inves-tors.
IFAs are hurting with recent regulatory chang-es and looking to enhance their capabilitiesIn the recent past, there have been many regulatory changes regarding mutual fund distribution, the most pro-found being the removal of entry load on all schemes and introduction of transparency in payment of the commis-sions. While all distributor categories have been aff ected, the IFAs seem to have been impacted most negatively. IFAs, especially medium and small IFAs, are struggling. However, most of them are living in a denial mode. The fi rst reaction of many IFAs is to deny the magnitude of the change, as indicated by their quotes in Exhibit 4e. This is based on detailed discussions that were conducted with
IFAs of diff erent sizes across diff erent cities. However, upon further probing, it is clear that the IFAs are awaken-ing to the need for change and improvement; Exhibit 4e illustrates this changing attitude as well.
As IFAs prepare for the future, they are looking to en-hance their capabilities on four key dimensions, as shown in Exhibit 4f.
Business build◊ , which covers improving selling capa-bilities to convert leads into business and business into relationships, as well as improving preparation for meetings.
Improved advisory◊ , which includes developing the ability to truly understand client needs and to off er advice on portfolio allocation and ongoing portfolio management.
Ease of operations◊ , which is about leveraging technol-ogy and tools to make the administrative elements easier so that the IFAs can spend more time on busi-ness building and sales activities, as well as to help reduce costs.

T B C G • C A M S P. L.
Exhibit 4e. IFA reactions to need for skill upgrading and providing better services and advice
Source: BCG interviews.
Exhibit 4d. Current IFA value proposition is very basic
Source: BCG interviews.

E M F—C C C
Exhibit 4f. IFA dimensions to improve upon
Source: BCG interviews.
Improved client services◊ , which is again about leverag-ing technology and tools to off er better services to cli-ents—for example, off ering clients an online account, off ering ongoing rebalancing support, providing regu-lar performance updates, among other services.
It will be interesting to observe how AMCs, industry bod-ies like AMFI, and other third–party service providers rally around these needs and support and equip them for the future.
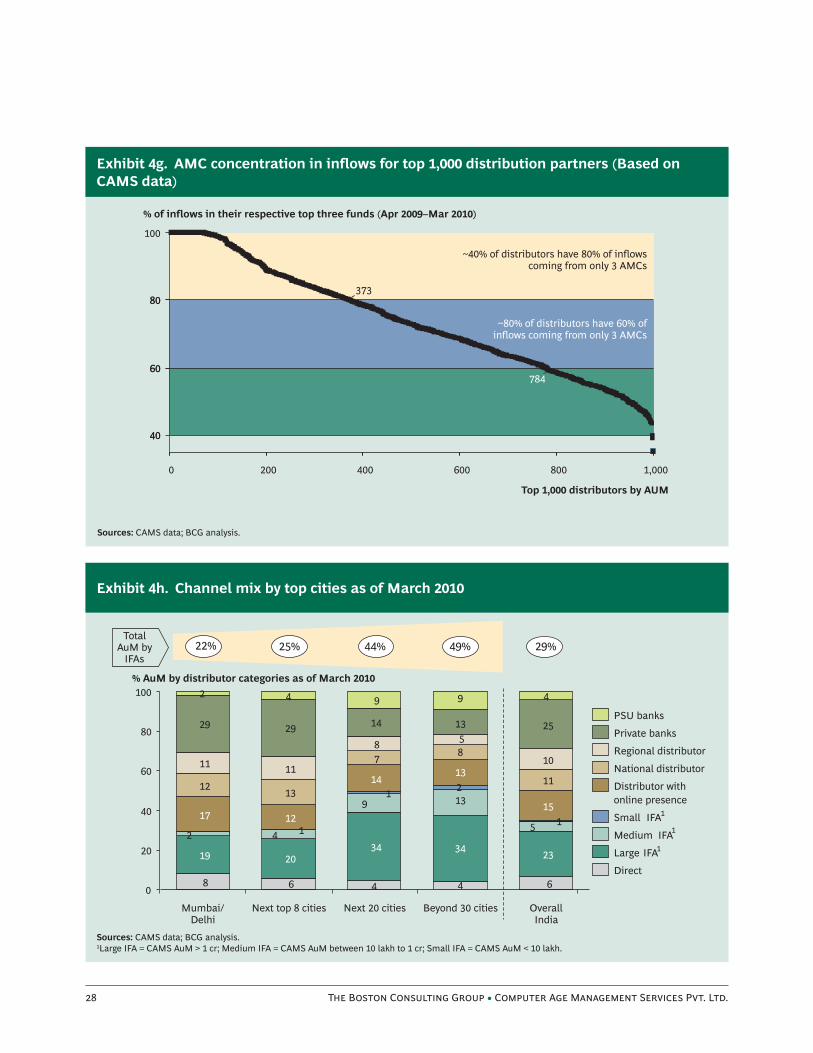
Most distribution partners sell a select few fund housesDistributors, by defi nition, are independent and can tech-nically sell funds of all the AMCs. But practically, most sell products of only three or four AMCs. In fact, detailed con-centration analyses of the top 1,000 distribution partners shows that for 40 percent of these top 1,000 partners (based on CAMS data), over 80 percent of their AuM comes from just three AMCs, and for the next 40 percent, over 60 percent of their AuM comes from just three AMCs. Hence, in total, 80 percent of distribution partners garner more than 60 percent of their AuM from just three AMCs, as shown in Exhibit 4g.
This behaviour can be explained by the following reasons:
Capabilities to understand products:◊ Most sales chan-nels like to focus on a few products. Considering the fact that most AMCs have multiple schemes, channels would be more comfortable restricting the number of fund houses they sell so that they have fewer products to understand and explain.
Slab wise incentives:◊ All AMCs have incentives based on total volume of sales, and this incentivizes the chan-nels to sell more of the same fund houses.
Loyalty and relationships:◊ Fund houses invest in chan-nel management, and their sales teams work on devel-oping relationships with channel partners based on service in addition to commissions, which in turn re-sults in loyalty.
IFAs are dominant in smaller cities and ‘retail’ segments, banks dominate in top cities and the high networth individual (HNI) segmentThe other interesting aspect concerned the prevalence of channels of distribution by location and customers. On
T B C G • C A M S P. L.
Exhibit 4h. Channel mix by top cities as of March 2010
Sources: CAMS data; BCG analysis.1Large IFA = CAMS AuM > 1 cr; Medium IFA = CAMS AuM between 10 lakh to 1 cr; Small IFA = CAMS AuM < 10 lakh.
Exhibit 4g. AMC concentration in inflows for top 1,000 distribution partners (Based on CAMS data)
Sources: CAMS data; BCG analysis.

E M F—C C C
Exhibit 4i. AuM distribution across distributor categories & investor segments as of March 2010
Sources: CAMS data; BCG analysis.1Large IFA = CAMS AuM > 1 cr; Medium IFA = CAMS AuM between 10 lakh to 1 cr; Small IFA = CAMS AuM < 10 lakh.
the location front, not surprisingly, IFAs are much larger in smaller towns. As shown in Exhibit 4h, while IFAs make up only approximately 20 percent of AuM in Mum-bai and Delhi and approximately 25 percent in the next top eight cities, they have nearly 44 percent share among the next 20 cities. Private/foreign banks have about a 30 percent share in the top ten cities and about 14 percent in the next 20 cities. Interestingly, while PSU banks have only about a 2 percent share in Mumbai and Delhi, they hold approximately 9 percent of the market in all other cities.
On the customer front, IFAs service 30 to 35 percent of all retail investors (less than 5 lakh), while private and for-eign banks service nearly 40 to 45 percent of the HNI investments, as shown in Exhibit 4i.
Recent regulatory changes have had other effects on the industry
As mentioned earlier in this chapter, there have been a number of regulatory changes in the recent past. One of the biggest changes was regarding the removal of entry loads on all schemes and transparency in payment of
commissions to distributors. This is a major shi and the full impact of this change will unfold over a longer time period. Interestingly, in the short time period since the announcement of the change in regulations removing entry loads, there has been limited impact on the dis-tributor category share of gross equity infl ows, as shown in Exhibit 4j.
In addition, it is quite interesting to look at the commis-sions paid to the channel partners pre and post removal of entry loads, as we do in Exhibit 4k. A er the removal of entry loads in August 2009, the commissions have clearly been reduced. The average commission paid was about 1.8 percent in 2008, which has come down to about 0.9 percent in 2010. Thus, even today in the no–load re-gime, nearly 1 percent of upfront commission is being paid by the AMCs out of their revenues.
The other important regulatory change has been the eas-ing of the process for a customer to change distributors on his or her existing investment, with the elimination of the no objection certifi cate requirement in December 2009. The immediate reaction has been an increase of six times in the number of transfer requests and an increase

T B C G • C A M S P. L.
Exhibit 4k. Average commissions paid out (2005–2010)
Sources: CAMS data; BCG analysis.
Exhibit 4j. Gross equity inflows from different distributor categories in 2009–10
Sources: CAMS data; BCG analysis.1Large IFA = CAMS AuM > 1 cr; Medium IFA = CAMS AuM between 10 lakh to 1 cr; Small IFA = CAMS AuM < 10 lakh.

E M F—C C C
Exhibit 4m. Gain and loss through transfers by channel ( January–March 2010)
Exhibit 4l. AuM transfer trends post regulatory changes (number and AuM), 2003–2010
Sources: CAMS data, BCG analysis.
Sources: CAMS data; BCG analysis.1Large IFA = CAMS AuM > 1 cr; Medium IFA = CAMS AuM between 10 lakh to 1 cr; Small IFA = CAMS AuM < 10 lakh.

T B C G • C A M S P. L.
Exhibit 4n. MF transactions on BSE/NSE (2010)
Sources: NSE; BSE; BCG analysis.
in transfer AuM of nearly 2.5 times as shown in Exhibit 4l. While the number of change in distributor code re-quests has gone up signifi cantly, there has been no dis-cernable change in ownership of AuM by distributors. We estimate that this is primarily the result of some pent–up investor dissatisfaction demonstrating itself; internation-al experience indicates that it is likely a short–term trend.
If one looks at the movement of AuM, regional distribu-tors are the ones that have gained the greatest share so far ( January–March 2010), while the small IFAs have lost the most share, as shown in Exhibit 4m. Interestingly, small IFAs had the largest volume of AuM transfers be-tween January and March 2010.
Finally, the last key regulatory change has been the en-abling of transactions through the stock exchanges in No-vember 2009. While this facility has been available for the last few months, mutual fund transactions are yet to gain momentum on stock exchanges, as shown in Exhibit 4n.
Implications for AMCs
The distribution landscape and its evolution raise a set of questions for the AMCs:
What is the optimal channel mix for AMCs? Are AMCs 1. getting the maximum throughput from each of the channels?
How can AMCs support and nurture small IFAs? What 2. value proposition can AMCs demonstrate to large and medium IFAs to get a bigger share of contribution from them?
How do AMCs ensure that they are among the top 3. AMCs sold by the banks and distributors?
What are AMC’s plans for the public sector banks? Are 4. AMCs willing to invest early in these banks to benefi t as the public sector banks share gradually increases and becomes substantial?

E M F—C C C
The Geography CompassBeyond Metros
The last key dimension in the equity mutual fund industry is geography. We use the word geography to refer to diff erent cities, ranked by the equity Assets under Manage-ment (AuM) held by investors living in that
city. Elements of this dimension have been covered in the previous chapters, along with customer and distribu-tion dimensions. However, geography dimension de-serves a mention on its own because a large part of the Indian population still lives in smaller cities and semi–urban/rural areas, and there is a strong stated desire on the part of the regulator for fi nancial inclusion and en-hancing retail participation in mutual funds across all types of cities and locations in the country. We have analysed the equity AuM spread along the following cit-ies:
Mumbai◊
Delhi◊
Next 8 cities—Chennai, Kolkata, Bangalore, Hydera-◊ bad, Ahmedabad, Pune, Jaipur, and Chandigarh—hence cumulatively adding up to the top ten cities
Next 20 large cities, cumulatively adding up to the top ◊ 30 cities
Next 70 cities, cumulatively adding up to the top 100 ◊ cities
Rest of India—beyond the 100 cities◊
Equity AuM is highly concentratedThe equity AuM is extremely concentrated, with the top ten cities accounting for approximately 74 percent of the
total equity AuM in March 2010, as shown in Exhibit 5a. Mumbai and Delhi together account for about 45 per-cent of total equity AuM, and the top 30 cities account for about 90 percent of total equity AuM. It is no wonder that these top 30 cities are the fi rst port of call for asset management companies (AMCs). However, as one would expect, these markets feature heavy competition.
Locations beyond the top ten cities are gain-ing share continuously…The concentration of AuM in the top cities is falling as total equity AuM continues to grow rapidly in cities be-yond the top ten. The share of AuM beyond the top ten cities has increased from about 10 percent in March 2003 to about 26 percent in March 2010, as shown in Exhibit 5b. Since this is the share of AuM, the share of equity net infl ows is likely to be much larger. We estimate that the share of gross infl ows in cities beyond the top ten is al-ready in the range of 30 percent for the equity mutual fund industry.
… with large implications on AMCs’ footprint strategyThis concentration of equity AuM and the unambiguous movement away from concentration has large implica-tions for the AMCs regarding their cities footprint. This is clearly visible in the diff erent strategies of various AMCs for their cities footprint and presence.
Take the examples of three AMCs that are shown in Ex-hibit 5c. AMC A has a truly distributed business coming from a truly national footprint strategy, with Mumbai and Delhi accounting for only 30 percent of their total equity AuM vis–à–vis an industry average of 43 percent. Further, AMC A has approximately 40 percent coming from beyond the top ten cities vis–à–vis the industry av-

T B C G • C A M S P. L.
Exhibit 5b. Equity AuM distribution by geography cuts (2003–2010)
Sources: CAMS data; BCG analysis.
Exhibit 5a. Equity AuM distribution by geography cuts (March 2010)
Sources: CAMS data; BCG analysis.

E M F—C C C
erage of 26 percent. This is the fastest–growing segment, hence clearly positioning AMC A very well for the future. AMC B has charted a diff erent path with a clear focus on the top ten cities. For AMC B, the top ten cities accounts for approximately 87 percent of the AuM vis–à–vis the industry average of 74 percent, and 13 percent comes from outside the top ten cities vis–à–vis an industry aver-age of 26 percent. AMC C, on the other hand, tracks the industry average very closely.
As the market evolves and the investors mature, this trend will be magnifi ed many times. The level of geo-graphic concentration of different financial services products is very diff erent. As shown in Exhibit 5d, mu-tual funds are at one end of the concentration with the tier 1 cities accounting for about an 80 percent share; savings deposits are at the other extreme, with the tier 1 cities accounting for only 30 percent of the overall mar-ket for savings deposits. The rest of the fi nancial services products are somewhere in between these two extremes. Life insurance, since it is seen primarily as a savings ve-hicle by investors and meets the needs of most segments is, a er savings deposits, the second most evenly distrib-uted product. Wealth management and asset manage-
ment, on the other hand, are clearly products used more by high networth individuals (HNIs) and the affl uent, and hence are highly concentrated in large cities. As the market and customers mature, the movement from the right to the le is inevitable. This has already been dem-onstrated in the equity mutual fund AuM over the past few years and highlighted in Exhibit 5b.
Implications for AMCs
How should the AMCs think about their geographic and cities footprint strategy? Considering the increasing share among cities beyond the top 10 cities and even the top 30 cities, and the likely further movement, should AMCs invest in distribution in these locations? What is the ap-propriate balance for each AMC based on its starting point and aspiration?
What are the most optimal business models to serve these customers? Considering that these customers will be present in large numbers beyond the top cities but their investment will be in small ticket sizes. Which are the best channel partners to service these new set of customers in these locations and cities?
Exhibit 5c. Equity AuM distribution by geography cuts for select players
Sources: CAMS data; BCG analysis.

T B C G • C A M S P. L.
Exhibit 5d. Comparison of city tiers in urban India (2005–2006)
Sources: City Skyline of India 2006; BSR data; Literature survey; BCG analysis.Note: Tier 1 includes Delhi, Mumbai, Bangalore, Pune, Chennai, Ahmedabad, Hyderabad, Surat, Coimbatore, Kolkata; Tier 2 calculated as an average based on 11–30 cities (Thane, Vadodara, Indore, Chandigarh, Jaipur, etc.); Tier 3 includes next 70 centers, typically small cities.1Turnover of retail stock broking.2Customer deposits.3RBI 2007 data.

E M F—C C C
The FutureCharting your Course
The Indian asset management industry, along with the equity mutual funds industry, has evolved a lot over the past few years. Equity AuM has grown at approximately 30 per-cent yearly over the past decade. There is a
defi nite increase in the acceptance of mutual funds as a savings vehicle. Equity MFs as a percentage of gross household savings have grown from a negligible 1.1 per-cent (approximately) in 1994 to about 7.9 percent in 2008. Retail investors (ticket size less than Rs 1 lakh) ac-count for more than 90 percent of all volumes and are longer–term investors, with an average duration of ap-proximately 33 months, as compared with only about 20 months for High Networth Individuals (HNI) investors.
Interestingly, most investors made money, and over 70 percent of their investments were redeemed at a profi t. Products have evolved to keep pace with the customers’ requirements, and as a result, Systematic Investment Plans (SIPs) as well as Equity Linked Savings Scheme (ELSS) products have become quite substantial. And geo-graphically, there has been a continuous shi of AuM beyond the metros. The share of cities beyond the top ten has increased from about 10 percent in 2003 to about 26 percent in 2010. The channel distribution is evolving and has matured to a stage where banks, IFAs, and dis-tributors are all equally signifi cant. The share of large IFAs has increased, and the small IFAs have almost dis-appeared.
But the asset management industry still has a long way to go. This is just the beginning. It is easier to visualize the future if we compare the asset management industry to the life insurance industry, as shown in Exhibit 6a. In fact, the diff erence is stark. On each of the key dimen-sions, the life insurance industry is at least ten times the
size of the asset management industry. For example, the number of life insurance offi ces as an industry is about ten times the number of asset management offi ces. The life insurance industry has nearly 15 times the number of employees and 30 times the number of agents relative to the asset management industry
With its larger employee and agency base, the life insur-ance industry has reached out much further and deeper than asset management has. As discerned previously in Exhibit 5d in Chapter 5, the reach of life insurance is exemplifi ed by the fact that approximately 45 percent of the new premium comes from outside the top 100 cities, compared with only 1 percent of the AuM in case of eq-uity mutual funds. This can be explained by multiple reasons, including customer awareness or the lack of it, and the reach in terms of agents, branches, and employ-ees beyond the top 100 cities.
As the asset management industry looks ahead, it also has to keep in mind regulatory changes and their impli-cations on the business. The big regulatory change that has already happened is the removal of entry load for all schemes and transparency in payments of commissions to distributors. This is a recent phenomenon, and the true impact of many of these changes still has to play out fully.
One of the most profound trends is that the small IFAs are being nudged out of the business. While that may not hurt the industry in the short term, the key challenge will be felt in the long run. These small IFAs were the pipeline for the successful medium and large IFAs of to-day. Also, the small IFAs mobilized small–ticket–size in-vestments and got new investors into the MF industry. Hence, as an industry, it is critical to fi gure out how the

T B C G • C A M S P. L.
Exhibit 6a. Comparing the asset management and life insurance industries
Sources: AMFI; IRDA; BCG analysis.
industry can support the small IFAs so that they can pro-vide the pool for the successful IFAs of the future and so that untapped smaller investors have access to mutual funds.
In addition, the other key challenge for the industry is economics. The profi tability of the industry has been af-fected by the withdrawal of the entry loads. Over the past six months, since the new regulations took eff ect, the manufacturers have taken some share out of their earnings and paid distributors to make up for their loss. And some big and organized distributors have been able to charge the customers, while many of the smaller dis-tributors have not been able to do the same. Going for-ward, the industry will need to fi nd a new equilibrium.
Charting your course with a compass—The ten commandments of success for AMCs:
Develop a plan to get ‘retail’ long–term money 1. in a cost–eff ective manner. Given the potential attractive-ness of SIPs (high stickiness and low volatility), create a SIP action plan.
Defi ne a geographic footprint strategy, 2. keeping in mind the progression of share beyond the top ten cities.
Defi ne the optimal channel mix 3. and put in place a plan to get the maximum throughput from all channels.
Build a value proposition for IFAs 4. to get a bigger share of contribution from them. Be in the top three AMCs sold by them.
Defi ne a value proposition for banks and distributors 5. to increase share of wallet by being a ‘preferred’ fund for private/foreign banks and regional/national dis-tributors.
Invest in PSU banks as a channel 6. to benefi t in the future as the share of PSU banks grows and becomes substantial.
Communicate to increase customer awareness 7. and build confi dence with a larger untapped investor com-munity—leverage the fact that most investors have made money from MF investments, with more than 70 percent redeeming at profi ts.

E M F—C C C
Explore product innovation 8. as a means of better serv-ing customer needs, keeping in mind that while New Fund Off ers (NFOs) may be a good way to mobilize money, there may be mis–selling involved.
Invest in understanding customer behavior. 9. Consider-ing linkages to market movements, and develop a
plan to take advantage of the upsurge in demand as the market moves up.
Create the support mechanism for the small IFAs10. as an industry and nurture large pool of small IFAs to enable IFAs with potential to morph into large IFAs with enhanced investor base.

T B C G • C A M S P. L.
Note to the Reader
About the AuthorsAlpesh Shah is a Partner & Director at BCG’s Mumbai offi ce. Alpesh heads the Asset Management and Insurance vertical of BCG India.
Ashish Garg is a Partner & Director at BCG’s New Delhi offi ce. Ashish has wide experience in the fi eld of strategy, organization and operations with fi nancial services institutions.
Kamala Radhakrishnan is General Manager at CAMS. Kamala comes with rich experience in retail banking and out–sourcing.
N K Prasad heads CAMS as Presi-dent and CEO and is based at Chennai.
For Further ContactIf you would like to discuss the themes and content of this report, please contact:
Alpesh ShahBCG Mumbai+91 22 6749 [email protected]
Ashish GargBCG New Delhi+91 124 459 [email protected]
Kamala RadhakrishnanCAMS Chennai+91 443 021 [email protected]
N K PrasadCAMS Chennai+91 443 021 [email protected]
AcknowledgmentsThis study was undertaken by The Boston Consulting Group (BCG) and Computer Age Management Services (CAMS).
We would like to thank the execu-tives from both the institutions that participated in the research eff ort and helped enrich this report.
We gratefully acknowledge the contribution of T G Sekhar and V Janarthanan from CAMS, Chennai for their eff orts in data extraction and proof checking the analysis.
We gratefully acknowledge the contribution of Ankur Dhawan and Maneck Katrak from BCG India for their eff orts in data analyses and production of this report.

For a complete list of BCG publications and information about how to obtain copies, please visit our Web site at www.bcg.com/publications.
To receive future publications in electronic form about this topic or others, please visit our subscription Web site at www.bcg.com/subscribe.
06/10
