e-commerce product information supporting user experience
TRANSCRIPT
Reetta Kivistö
E-COMMERCE PRODUCT INFORMATION SUPPORTING USER EXPERIENCE
UNIVERSITY OF JYVÄSKYLÄ
FACULTY OF INFORMATION TECHNOLOGY 2020

ABSTRACT
Kivistö, Reetta E-commerce product information supporting user experience Jyväskylä: University of Jyväskylä, 2020, 85 p. Information Systems, Master’s Thesis Supervisor: Clements, Kati
The aim of this master’s thesis was to understand different aspects of product information in online environment and how these aspects affect the formation of overall user experience in e-commerce websites. The focus was in online vendors that sell electronic products to consumers (B2C) on their website. The study was conducted in Finland and the three most popular electronics selling online shops in this location were selected as subjects of study. The aim of this thesis was to better understand product information and the phenomenon of user experience. At first a literature review was conducted, after which an em-pirical study was carried out. Quantitative research was selected as research method for the empirical section and more specifically, a survey approach was taken. The data was collected with an online questionnaire, that was completed by 93 respondents. A statistical program was then used to analyze the collected data and the research findings were gathered from the analysis. The findings of the study implied that consumers tend to value pricing related information, product availability, full product pictures, and product reviews when they are browsing electronic products in online shops. The role of product’s package size, actual product size, availability of user’s manual, videos describing prod-uct use and product recommendations availability, however, appeared to be less significant to the consumers. The comparison of product information as-pects and facets of user experience indicated that product information’s ability to help customers to evaluate, understand and compare products affects all re-searched aspects of online shop’s user experience. Along to product evaluation aspect, adequate, complete, and high-quality product information, which is presented using well-suited presentation formats, is seen to support website’s attractiveness and pragmatic quality. As a conclusion, the findings implied that product information plays an important role in the formation of user experience of an e-commerce website. However, the effect of individual product infor-mation aspect plays only a minor role in development of total user experience. This highlights that product information alone is not sufficient to explain the complex phenomenon of user experience. Yet, if online shop’s intention is to maximize their user experience, significance of product information should not be underestimated.
Keywords: product information, user experience, e-commerce, electronics, business-to-consumer
TIIVISTELMÄ
Kivistö, Reetta Käyttäjäkokemusta tukevat tuotetiedot verkkokaupoissa Jyväskylä: Jyväskylän yliopisto, 2020, 85 s. Tietojärjestelmätiede, pro gradu –tutkielma Ohjaaja: Clements, Kati
Tämän maisterin tutkielman tavoitteena oli ymmärtää verkkokaupassa esitettä-vien tuotetietojen eri puolia ja kuinka ne vaikuttavat kokonaisvaltaisen käyttä-jäkokemuksen muodostumiseen verkkokaupassa. Tutkielman keskipisteessä olivat verkkokaupat, jotka myyvät elektroniikkaa verkkosivuillaan kuluttaja-asiakkailleen (B2C). Tutkimus toteutettiin Suomessa ja tutkimuksen kohteiksi valittiin alueen kolme suosituinta elektroniikkaa myyvää verkkokauppaa. Tut-kielman keskeinen tavoite oli ymmärryksen kerääminen tuotetiedoista ja käyt-täjäkokemuksesta. Ensiksi tutkielmassa toteutettiin kirjallisuuskatsaus, jota seu-rasi empiirisen tutkimus. Tutkimusmenetelmäksi valittiin kvantitatiivinen tut-kimus ja siinä sovellettiin kyselytutkimuksen menetelmiä. Data kerättiin ver-kossa julkaistulla kyselylomakkeella, johon vastasi yhteensä 93 osallistujaa. Da-tan analysoinnissa hyödynnettiin tilastotieteellisen analyysiin tarkoitettua oh-jelmistoa ja tutkimuksen tulokset muodostettiin analyysin pohjalta. Tutkimuk-sen tulokset viittasivat siihen, että kuluttajilla on taipumus arvostaa hinnoitte-luun liittyvää tietoa, tuotteen saatavuuteen liittyviä tietoja, kokonaisia tuoteku-via sekä tuotteesta tehtyjä arvosteluja, kun he tutkivat elektroniikka tuotteita verkkokauppaympäristössä. Tuotteen pakkauksen kokoon, tuotteen kokoon, käyttöohjeisiin, tuotteen käyttöä kuvaaviin videoihin ja tuotesuosituksiin liitty-vien tietojen rooli vaikuttaa puolestaan jäävän vähemmän merkittäviksi kulut-tajille. Tuotetietojen eri osa-alueiden sekä käyttäjäkokemuksen eri näkökohtien vertailu viittasi siihen, että tuotetietojen kyky auttaa asiakkaita arvioimaan, ymmärtämään ja vertailemaan tuotteita vaikuttaa kaikkiin tutkittuihin verkko-kaupan käyttäjäkokemuksen puoliin. Tuotteen arvioimisen puolien lisäksi asi-anmukaisten, täydellisten ja laadukkaiden tuotetietojen, jotka on esitetty käyt-täen sopivia esittämistapoja, nähtiin tukevan verkkokaupan houkuttelevuutta sekä pragmaattista laatua. Yhteenvetona voidaan todeta, että tulokset viittaavat siihen, että tuotetiedoilla todella on tärkeä rooli kokonaisvaltaisen käyttäjäko-kemuksen muodostumisessa verkkokaupassa. Kuitenkin yksittäisen tuotetie-don osa-alueen vaikutus on vain pieni osa käyttäjäkokemuksen muodostumista. Tämä korostaa sitä, että tuotetieto yksin ei riitä selittämään monitahoista käyt-täjäkokemusta. Kuitenkin jos tavoitteena on verkkokaupan käyttäjäkokemuk-sen parantaminen, tuotetietojen merkittävyyttä ei tulisi aliarvioida.
Asiasanat: tuotetieto, käyttäjäkokemus, verkkokaupankäynti, elektroniikka, yritykseltä-kuluttajalle

FIGURES
FIGURE 1 Facets of user experience (Hassenzahl & Tractinsky, 2006, 95) ......... 22 FIGURE 2 Three components of user experience (Roto et al., 2011) .................... 23 FIGURE 3 The Total Customer Experience (Petre et al. 2006, 200) ...................... 27 FIGURE 4 Research model ......................................................................................... 29 FIGURE 5 User experience per website .................................................................... 58
TABLES
TABLE 1 Presentation formats of product information ......................................... 20 TABLE 2 Statements about information presentation formats ............................. 44 TABLE 3 Statements about information amount .................................................... 45 TABLE 4 Statements about timeliness of the information ..................................... 45 TABLE 5 Statements about information accuracy .................................................. 46 TABLE 6 UEQ’s semantic differential scale (Rauschenberger et al., 2013) ......... 47 TABLE 7 Respondent gender distribution ............................................................... 51 TABLE 8 Significance of different product information ........................................ 52 TABLE 9 Used presentation formats per e-commerce site .................................... 53 TABLE 10 Product information factors presented in rotated factor analysis ..... 55 TABLE 11 Experiences with product information per website ............................ 56 TABLE 12 User experience constructs per website ................................................. 57 TABLE 13 Two user experience factors suggested in rotated factor analysis .... 60 TABLE 14 Correlation between research items ....................................................... 61 TABLE 15 Role played by product information factors to website’s attractiveness and pragmatic quality ........................................................................ 62 TABLE 16 Role played by product information factors to website’s hedonic quality ............................................................................................................................ 63
TABLE OF CONTENTS
ABSTRACT TIIVISTELMÄ FIGURES TABLES
1 INTRODUCTION .................................................................................................. 7
2 E-COMMERCE .................................................................................................... 12 2.1 Different types of e-commerce (B2C, B2B, C2C) ................................... 13 2.2 M-commerce ............................................................................................... 14 2.3 Selling electronics online .......................................................................... 15
3 PRODUCT INFORMATION IN E-COMMERCE ........................................... 16 3.1 Different types of product information .................................................. 17 3.2 Product information presentation formats ............................................ 18
4 USER EXPERIENCE ........................................................................................... 21 4.1 User experience in human-computer interaction ................................. 21
4.1.1 User Satisfaction ............................................................................... 25 4.1.2 User Preference ................................................................................. 25 4.1.3 Usability ............................................................................................. 25
4.2 User experience formation in e-commerce environment ..................... 26
5 PRODUCT INFORMATION’S EFFECT ON USER EXPERIENCE .............. 29 5.1 Information types ...................................................................................... 30
5.1.1 Stock information ............................................................................. 30 5.1.2 Recommendations ............................................................................ 31 5.1.3 Product reviews ................................................................................ 31
5.2 Information presentation formats ........................................................... 32 5.2.1 Textual information ......................................................................... 33 5.2.2 Visual and multimedia presentations ........................................... 33 5.2.3 Virtual product experiences ............................................................ 34
5.3 Information amount .................................................................................. 35 5.4 Timeliness of the information .................................................................. 36 5.5 Information accuracy and quality ........................................................... 36
6 METHODOLOGY ............................................................................................... 38 6.1 Research objective ...................................................................................... 38 6.2 Research method ........................................................................................ 39
6.2.1 Quantitative research ....................................................................... 40 6.2.2 Survey research as data collection method .................................. 40
6.3 Formation of questionnaire ...................................................................... 41 6.3.1 Product information ......................................................................... 43
6.3.2 User experience ................................................................................. 46 6.4 Analysing the data ..................................................................................... 48
7 RESULTS .............................................................................................................. 50 7.1 Overview of the respondents ................................................................... 50 7.2 Product information results ..................................................................... 51
7.2.1 Significant product information ..................................................... 51 7.2.2 Used information presentation formats ........................................ 52 7.2.3 Statements about product information ......................................... 53
7.3 Results from user experience questionnaire .......................................... 56 7.4 Product information’s effect on user experience ................................... 60
8 DISCUSSION AND CONCLUSION ................................................................ 64 8.1 Discussion ................................................................................................... 64 8.2 Research reliability and validity .............................................................. 68 8.3 Limitations and future research ............................................................... 68 8.4 Conclusion .................................................................................................. 69
REFERENCES ................................................................................................................ 71
APPENDIX 1 QUESTIONNAIRE STRUCTURE (IN FINNISH) ........................... 78
APPENDIX 2 RESPONSES TO PRODUCT INFORMATION STATEMENTS .... 84
APPENDIX 3 RESPONSES TO UEQ ......................................................................... 85

1 INTRODUCTION
Traditional commerce has undergone a significant change due to advances in information technology and wide adoption of the Internet. In fact, an increasing number of consumers have turned to e-commerce websites in hopes of lower prices, bigger selection of goods and higher efficiency, when compared to tradi-tional marketplace with brick-and-mortar stores (Dimoka, Hong & Pavlou, 2012). It is also been estimated that e-commerce will still keep growing steadily (Kim, Ferrin & Rao, 2008). Consumers use this new web-based marketplace to find and gather information about different products, to make payments, and to complete purchases (Zhang et al., 2011). In fact, nowadays, almost anything can be purchased online. Various items from books, cars, houses, electronics to fur-niture are sold in e-commerce websites daily. Only the sky appears to be the limit when it comes to products sold online.
When the use of e-commerce websites has become more common, also the number of e-commerce websites has increased. In fact, many traditional firms have extended their operation to the Internet-based platform, and by doing so, have been able to expand their total sales (Duch-Brown, Grzybowski, Romahn & Verboven, 2017). Understandably, this has made the competition between online vendors more intense, making the e-vendors wanting to stand out from the competitors.
From online shop’s perspective, user experience is one of the most signifi-cant factors behind the success of the website. User experience, also known as UX, is a concept mostly acknowledged in research focusing on human-computer interaction. According to one short definition, user experience is an experience that a product or service creates for a user (Garrett, 2010). For a user to continue using a product, the experience gained from the use must be posi-tive or at least bearable (Garrett, 2010). Unlike more researched usability, user experience takes other experience affecting factors like user’s prior experiences and use context into account. Hassenzahl and Tractinsky (2006) propose that user experience has three different facets; it is more than instrumental, emotions and affect play a role in it and it is experiential.
Positive user experience is an asset to any online shop, as it has been seen to lead to many positive outcomes. As an example, positive user experience is
8
seen to enhance customer loyalty towards the online shop (Kujala, Roto, Väänänen-Vainio-Mattila, Karapanos & Sinnelä, 2011). Negative user experi-ence, on the other hand, can lead to user’s decision to stop the purchase process or even stop using the online shop altogether (Garrett, 2010), this means one lost customer from the online shop’s perspective. Unremarkable experiences, however, can lead to consumer turning to competitor’s website, if the experi-ence in that other online shop has been better in customer’s opinion (Garrett, 2010). To conclude, online vendors should aim to improve their user experience in order to better their chances on being successful in the Internet’s marketplace.
Even though, there are many similarities with online shops and traditional brick-and-mortar stores, there are also major significances to consider. Perhaps one of the most significant difference in e-retailing is that consumers are not able to interact with the product before making a purchase decision (Jiang & Benbasat, 2007). This highlights the importance of product information in e-commerce environment (Bigne-Alcaniz, Ruiz-Mafé, Aldas-Manzano & Sanz-Blas, 2008). In the context of this research, product information is seen to cover all product related information that is provided by online shops. For example, product price, images, availability and use instructions are seen to represent product-related information. By providing a good quality information, online vendor can help its customers to make better purchasing decisions (Kim et al., 2008).
Consumers heavily rely upon product information provided by online vendors, which can make product evaluation before purchase rather difficult. Trouble to evaluate the product with the provided information might lead to feelings of uncertainty. (Dimoka et al., 2012.) If any important information is missing or the provided information seems to be insufficient from the consum-ers perspective, it is unlikely that the consumer would proceed in their pur-chase process. In fact, in cases where customer feels that the provided product information is incomplete, they often make an assumption that the missing in-formation is negative, since important information might be intentionally left out from the descriptions to deceive the customer (Dimoka et al., 2012). Even though the role of the product information in e-commerce is known by many online shops, there is still room for improvement of provided product infor-mation and the style that the information is presented.
Prior literature has discussed the topic of product information from differ-ent perspectives. For example, Chiu, Wang, Fang and Huang (2014) have con-sidered product information as one element that affects e-commerce customers’ repeat purchase intentions. Lightner and Eastman (2002), on the other hand, have investigated how product information should be presented to fit users’ preferences. Even though it does not specifically cover the topic of user experi-ence, Lightner’s and Eastman’s (2002) research can most certainly be useful for the purposes of this thesis, but since there are a fair amount of time passed from the release of the article, the relevance of this study is questionable. Even though there are prior literature about product information, product infor-mation has not often been assessed specifically from user experience’s point of view.

9
User experience literature, in contrast, mostly focuses on a bigger picture of experience rather than focusing to small details like product information. User experience literature is often conducted to understand one construct of the experience, i. e. visual appeal, how user experience is formed in specific prod-uct or service or how the user experience should be evaluated. Some prior stud-ies have also suggested different e-commerce related user experience heuristics, of which some are concerning product information (Bonastre & Granollers, 2014; Fang & Salvendy, 2003). However, these heuristics are mainly focusing on whether a specific information about the product exists or not, rather than the overall user experience of the product information, its presentation or layout of the information. That is why it would be beneficial to investigate if the product information and how it is presented have an effect to the overall user experi-ence of the website.
Though there are already a good amount of research on topics of both e-commerce user experience and product information, there is still a lack of stud-ies that combine both e-commerce product information and user experience. To narrow this existing cap in literature, this master’s thesis is conducted to better understand the role played by product information to overall user experience of the e-commerce website. Different attributes of product information will be as-sessed with the user experience of the website. The thesis also aims to recognize different types of product information that is presented in modern e-commerce websites and what kind of presentation formats are used to present this infor-mation. This thesis will aim to answer the following research question:
• How provided product information affects the user experience formation in e-commerce website?
Following supporting questions were constructed from the main research ques-tion:
• How different aspects of product information affect user experience? • Which product information are the most significant to the user?
To answer the set research questions, a literature review and an empirical study are conducted in this thesis. The aim of the literature review is to recognize im-portant product information attributes from the prior research and to later uti-lize these findings in the empirical study. For the empirical study, quantitative research was selected as research method and more specifically, a survey ap-proach was taken. The data was collected with an online questionnaire created with Google Forms, that was completed by 93 respondents. A statistical pro-gram was then used to analyze the collected data.
To get a better picture of the phenomenon, some limitations were made in order to control the size of the study. For example, since the aim is to evaluate user experience, the topic of product information is looked from the user’s point of view. The current research will be focusing in user’s free time use of online shops instead of work-related use. Even though it would be interesting to look into the topic from the business-to-business perspective, it would be challeng-
10
ing to find participators to the research from organizations. Due to this, the re-search is only interested in online shops that sell their goods to consumers. In other words, this research is interested in online shops operating in business-to-consumer area of the market. The investigation of product information was also narrowed down to one product category; electronics. This limitation was done as product information varies significantly different product categories. Elec-tronics were selected as investigated product category since there are a lot of information that can be provided about electronic products, varying from phys-ical features to performance and to appearance. Consumer electronics and other electronic products are seen to represent search goods, which key attributes are often measurable and objective, and evaluation of these types of products does not strongly require use of customer’s senses, which make these types of prod-ucts easier to compare (Mudambi & Schuff, 2010).
It is also important to note, that the study is conducted in Finland and three most popular electronics selling e-commerce websites in Finland are se-lected as subjects of investigation. These selected e-commerce websites are Verkkokauppa.com, Gigantti and Power (Tammilehto, 2019). This limitation makes the results applicable only in this geographical area and no global con-clusions are advised to be made.
The findings of the conducted empirical study indicate that significance of different product information is individual, and it can vary between customers. However, there are still common patterns that were recognized among custom-ers from the results this thesis. As an example, consumers tend to value pricing related information, product availability, full product pictures, and product reviews when they are browsing electronic products on online shops. On the contrary, the role of product’s package size, actual product size, availability of user’s manual, videos describing product use and “you might also like” rec-ommendations availability appears to be less significant to the consumers.
In the context of this study, product information was at first looked from four aspects; information presentation formats, timeliness of the information, information amount, and information accuracy and quality. The aim was then to contrast these aspects to user experience constructs; attractiveness, pragmatic quality and hedonic quality, used in the user experience questionnaire. Howev-er, conducted factor analyses indicated different factor structure to both prod-uct information and user experience in the study. Attributable to this, product information was ultimately looked from four different viewpoints; information timeliness and reliability, information sufficiency, information’s level of detail and product evaluation. These four new aspects were then compared to two recognized constructs of user experience; attractiveness and pragmatic quality, and hedonic quality.
This comparison of product information aspects and facets of user experi-ence implied that product information has, in fact, an effect online shop’s user experience. Especially, product information’s competence to help customers to evaluate, understand and compare products is emphasized, since it is seen to impact all researched aspects of user experience. Also, adequate, complete, and high-quality product information, which is presented using appropriate presen-tation formats, is seen to support website’s attractiveness and pragmatic quality

11
along with product evaluation aspects. No significant affect was found between user experience factors and information timeliness and reliability, and infor-mation amount and level of detail. In summary, the findings of the research suggest that product information plays an important role in the formation of user experience of a website. However, the effect of individual product infor-mation attribute appears not to be great. This leads to conclusion, that product information alone is not sufficient to explain complex phenomenon of user ex-perience. Yet, if online shop aims to maximize its user experience, significance of product information should not be underestimated.
This master’s thesis is divided in to eight sections. After the introduction to the research topic, the concept of e-commerce is presented and discussed in the second chapter. In this chapter, key features of e-commerce are discussed, concept of mobile commerce is touched on and characteristics of selling elec-tronics online are presented. In the third chapter, the concept of product infor-mation is presented and discussed. The fourth chapter of the thesis then pre-sents the concept of user experience and discusses it in the e-commerce context. Also, related concepts like user preference, user satisfaction and usability will be quickly gone through. In the fifth chapter, prior chapters are brought togeth-er to form an overall picture on product information’s effect on user experience based on the prior literature. The methodology and research method will be presented in more detail in the sixth chapter. In this chapter, the formation of online questionnaire will be also presented. The seventh chapter of the thesis then presents the results derived from the conducted empirical study. The the-sis will be finished with discussion and conclusion chapter, where main find-ings of the thesis will be covered and discussed, and the conclusion will be drawn. Also, reliability, validity and limitations of the empirical study will be assessed, and future research topics will be suggested in this final chapter.
12
2 E-COMMERCE
The Internet has created consumers and companies a new platform to operate in. In fact, markets, industries and businesses have undergone a significant change since the information technology and the Internet has evolved and has been widely adopted. Nowadays it is almost expected, that a company has their own website, where they at least provide basic information about their business. Typically, websites can be divided into four categories by their purpose of use, of which one relates to commerce (Lee & Koubek, 2010a), also referred as elec-tronic commerce (e-commerce). According to one definition, electronic com-merce is utilizing the Internet to facilitate, manage and process business pro-cesses, where product or service is exchanged for money when a buyer and a seller encounter (DeLone & McLean, 2002). In a broader sense, e-commerce could be seen as not only trading on the Internet, but also as cooperation with business partners, customer service and electronic transactions (Kim & Eom 2002). However, in spoken language the term of e-commerce is typically used to refer websites that are dedicated to sell their products and services via an online marketplace (Lee & Koubek, 2010a). Online shops, whether they are sell-ing e-books, used cars, or taxi-services, are seen to belong to this category of websites.
Nowadays, consumers and businesses are increasingly purchasing goods, like clothes, electronics and books, and services from different types of online shops, that have captured a significant market share from traditional brick-and-mortar stores. From the consumer’s point of view, e-commerce can offer lower prices, bigger selection of goods and higher efficiency than traditional market-place with brick-and-mortar stores (Dimoka et al., 2012). E-commerce has made it easier for customers to, for example, compare products and prices of different vendors. In fact, electronic commerce sites are used for information seeking as well as purchasing products (Pavlou & Fygenson, 2006). As a matter of fact, many customers purchase their goods from online stores because they feel that they are getting the best deal (Torkzadeh & Dhillon 2002).
E-commerce websites use web interfaces to maintain customer relation-ships, and to present product and service-related information to their potential customers. When compared to traditional brick-and-mortar stores’ more inter-
13
active shopping experience, at e-commerce websites customers are often just passively receiving presented product information. (Bilgihan, Okumus, Nusair & Bujisic, 2014.) In fact, when compared to traditional commerce, one of the most significant difference is that in e-commerce consumers are not able to in-teract with the product before purchase decision (Jiang & Benbasat, 2007). This makes consumers heavily rely upon product information provided by vendors, which can make product evaluation before purchase rather difficult and can aggravate product uncertainty (Dimoka et al., 2012).
As e-commerce has become more widespread, the number of online retail-ers has also increased. Due to plentiful supply and active competition, an e-commerce website must be able to stand out from its competitors. According to Palmer (2002), the website’s success can be assessed by observing and measur-ing prevalence of usage, likelihood of return and user satisfaction. However, among other things, e-commerce requires a strong understanding of the behav-ior of customers as well as the changes risen from the use of new technologies to traditional theories and models (Limayem, Khalifa & Frini, 2000).
E-commerce vendors might use different digital technologies, for example, to increase product differentiation and to stand out from competitors with su-perior interfaces (Duch-Brown et al., 2017). Standing out from the competitors is particularly important, since in the Internet, transferring from one store to an-other is almost effortless to customers when compared to a physical transition from one brick-and-mortar store to another. This means that if the user is unsat-isfied with some of the online shop’s features, it is rather easy for the customer to go from one online store to another. When the aim is to provide superior webservices, inspection of user experience will play a central role, since each visit and purchase made in online store leaves some kind of image and feeling to the consumer. All user experiences experienced by a user, are highly linked to one another and are significantly affected by prior experiences (Petre, Mino-cha & Roberts, 2006). However, designing of a user-friendly online shop can be a tricky job, since almost any attribute or functionality can cause the shopping experience to be either easy or difficult (Kim & Eom, 2002). To address these design questions, online shops can be divided into smaller components, like home page, navigation, classification, product information, shopping cart, cash-ier, registration and service (Fang & Salvendy, 2003).
2.1 Different types of e-commerce (B2C, B2B, C2C)
Prior to huge popularity of the online shops, most of the e-commerce business transactions were between companies as electronic data transfer, also known as business-to-business (B2B) e-commerce. Nowadays, on the contrary, in most parts of the world, online commerce generally happens between a company and a consumer. This, business-to-consumer (B2C) e-commerce is already so common, that many perceive e-commerce as merely selling to the consumer. (Kim & Eom 2002.) Basically, a business-to-consumer online shop provides con-sumers an Internet based platform where consumers can find information and
14
purchase products from the vendor (Pavlou & Fygenson, 2006). However, B2C and B2B e-commerce represents only a small segment of total retail market (Duch-Brown et al., 2017).
Another widespread type of e-commerce is consumer-to-consumer (C2C) e-commerce, which covers all business exchanges taking place between two consumers. In fact, Internet has offered a new platform where consumers can find and buy products from other consumers (Dimoka et al., 2012). For example, selling of used products, like clothes and cars, is nowadays very usual practice in the Internet and it has been practiced by both businesses and consumers. The Internet has, in matter of fact, open a new marketplace where consumers can interact with each other and offered a place user can find the ‘right’ product provided by ‘right’ vendor in ‘right’ place.
Although there are several types of online shops with different business models, this study will be focusing solely to online shops that sell their goods to the consumers, in other words to business-to-consumers online shops.
2.2 M-commerce
When discussing about e-commerce, it is important to address the concept of m-commerce, since nowadays an increasing number of consumers enter e-commerce websites via their mobile devices. Even though e-commerce and m-commerce are not evaluated separately in the context of this study, it is im-portant to understand some major differences between the two. Especially be-cause the role of mobile commerce has grown significantly during the past dec-ade (Chou, Chuang & Shao, 2016). In mobile retailing, users use their mobile devices to access websites and mobile applications of e-retailers (Chou et al., 2016). This means that same e-commerce website’s can be accessed with devices having significantly smaller screen sizes than typical desktop device. This poses its own challenges to how information should be presented on a website.
Even if mobile e-commerce can be seen as a part of company’s e-commerce activities, it is good to acknowledge what are the most significant features of mobile e-commerce, also known as ‘mobile commerce’ and ‘m-commerce’. M-commerce can be seen as a set of activities related to a potential transaction between seller and buyer conducted through communication net-works that interface with mobile or other wireless devices (Tarasewich, Nicker-son & Warkentin, 2002).
Often companies’ attitudes towards mobile commerce are inclined to be off. Firms often tend to just replicate the content they have on their website to their mobile channel. This can lead to negative effects in the user interactions, because presenting a large volume of content on a small mobile device can be overwhelming to the user and can lead user to feel frustrated. (Hoehle & Ven-katesh, 2015.) In fact, the biggest differences between mobile and desktop inter-faces lie in screen sizes and mode of operation. That is why websites and appli-cations should be developed to be mobile-oriented and optimized specifically for mobile devices (Chou et al., 2016). Making mobile-friendly sites is also bene-

15
ficial from the search-engine perspective, since for example Google has im-proved the placing of sites that are fitted also for small screen sizes with bigger text and clear links in the search results (Chou et al., 2016).
2.3 Selling electronics online
There are many types of products and services sold online nowadays. For ex-ample, books, holiday trips, apparel, electronics, furniture and even houses are currently being sold at the Internet-based marketplace. Only the sky appears to be the limit. However, in the context of this thesis, the focus is in e-commerce websites that sell electronic products online.
Items sold online can be roughly divided into two categories; experience, and search goods (Luo, Ba & Zhang, 2012; Mudambi & Schuff, 2010). In this type of division, experience goods are seen to represent products and services that either require sampling or a purchase, before the quality of the good can be evaluated (Luo et al., 2012). For example, books and wine are seen to fall into experience goods category (Mudambi & Schuff, 2010), as well as apparel prod-ucts, like trousers (Luo et al., 2012). When compared to experience goods, search goods are seen to be more easily comparable and evaluable through digi-tal platform. Customers are in case of search goods able to evaluate the product by specific attributes before purchase (Cui, Lui, & Guo, 2012). That is because search goods’ key attributes are often measurable and objective, and evaluation of the product does not strongly require use of customer’s senses (Mudambi & Schuff, 2010). According to Mudambi and Schuff (2010), this makes these types of products easier to compare. For example, digital cameras and natural sup-plement pills are seen to represent search goods (Mudambi & Schuff, 2010). Consumer electronics and other electronics products are in fact, great examples of search goods.
Electronic products are also typical goods that consumers buy online, and in fact, they are amongst the most frequently purchased products online (Blan-co, Sarasa & Sanclemente, 2010). There are wide range of electronic products available and, as an example, they can include electronic technology-based en-tertainment devices such as televisions, digital cameras and videogame con-soles. Electronic products typically have many attributes, of which some are easy and some difficult to understand, and customer needs to consider all of these attributes before purchase. The high number of attributes make electronic products relatively complex and analytic information processing is required. (Blanco et al., 2010.)

16
3 PRODUCT INFORMATION IN E-COMMERCE
As mentioned in earlier chapters, when compared to traditional commerce, one of the most significant difference in e-commerce is that consumers are not able to interact with the product before making a purchase decision (Jiang & Benba-sat, 2007). That is why, the product information and descriptions are the main sources that users utilize to compare different goods and to make a purchase decision. So, by providing enough good quality of information, online vendor can help consumers to make better purchasing decisions (Kim et al., 2008). In fact, Kim et al. (2008) have stated that when consumers perceive presented product and transaction information in a website to be accurate and, in some level, complete, consumers are more likely feel confident to the vendors reliabil-ity. Information quality, among other factors, is recognized in e-commerce as a strong predictor of trust and perceived risk and that is why vendors should pay specific attention to it (Kim et al., 2008).
Other studies also suggest that not only the quality but also the quantity of information have an effect to user satisfaction. For example, Ballantine (2005) noticed that as the number of attributes provided per product increased, the higher satisfaction towards the online shop is. Which again emphasizes the role played by product information behind online shop’s success. However, online retailers should remember to avoid overwhelming customers with too much information, since information beyond certain point might lead to customers feelings of sensory or information overload that will cause more harm than good (Ballantine, 2005).
Because consumers are not able to interact with the product before pur-chase and they heavily rely upon product information provided by vendor, it can make product evaluation before purchase rather difficult and can aggravate product uncertainty (Dimoka et al., 2012). Dimoka et al. (2012), for example, divide product related uncertainty to description related uncertainty and per-formance related uncertainty. Even though e-commerce websites should take action to avoid customer’s feelings of uncertainty, at the same time, it is in cus-tomer’s best interest to be aware of the information that is presented to them. This is because there are cases where product information provided by a ven-dor can be misleading or even fraudulent. For example, some vendors can in-
17
tentionally try to mislead consumers by manipulating information content, in-formation presentation or information generation (Xiao & Benbasat, 2011). Vendors might also be unwilling to disclose product’s true attributes or ex-pected performance (Dimoka et al., 2012), which can lead to consumer’s making incorrect assumptions about the product. That is why, if customers feel that the provided product information is incomplete, they often assume missing infor-mation to be negative, since important information might be intentionally left out from the descriptions to deceive the customer (Dimoka et al., 2012).
Next, to better understand the topic of product information, different types of product information available are presented and discussed. After that, different ways to present information online are discussed.
3.1 Different types of product information
As e-commerce has become more common, consumers have been able to signif-icantly reduce their research costs, compare different products and compare offers for the same product from competitive vendors. This has been majorly enabled by different search engines and price comparison sites. (Duch-Brown et al., 2017.) However, customers still rely upon product information provided by vendors (Dimoka et al., 2012). Online vendor can help their customers to make better purchasing decisions by providing a good quality of information to their customers (Kim et al., 2008). According to Fang and Salvendy (2003), in terms of product information, good e-commerce websites often have three attributes in common: detailed and accurate descriptions, pictures of full product and easy comparison of different products. Product information is seen to cover all product related information that is provided by an online shop and it aims to depict different attributes of the product. For example, product price, images, availability and use instructions are seen as a part of overall product infor-mation. There is nearly limitless amount of product attributes that can be pre-sented in product information, so in this section, only few of product infor-mation are touched upon.
One of the most significant product-related information in online shop is product’s price. Clear presentation of product pricing has been argued to re-duce uncertainty towards a product (Luo et al., 2012). Fang and Salvendy (2003) have also suggested that also other product-related costs, such as the cost of delivery should also be clearly displayed in the context of the product and must be accurate.
Availability of the product is as well information, that should be presented in product page. Fang and Salvendy (2003) for example suggest that product’s quantity in storage should be clearly indicated within the product information. Availability information has been even seen to play an important role in con-sumers' decision making (Guan & Cheng, 2009; Manvi & Venkataram, 2005). In fact, user may become frustrated if they finally find the product they like and only at a later stage of the purchasing process find out that the product is cur-rently out of stock (Fang & Salvendy, 2003).

18
Another addition to product information, can be showing personalized recommendations to customers. As a matter of fact, there are multiple types of recommendations that can be shown for a customer. Product suggestion to con-sumer, personalized product information, summarized community opinion, and provided community critiques are all different forms of recommendations and those can be applied to a website with recommender systems. In e-commerce environment, use of product suggestions can help to supplement the existing shortage of knowledgeable salesperson who could recommend similar or supplementary products. (Schafer, Konstan & Riedl, 2001.)
In addition to the most basic product information, product reviews from other consumers can offer valuable content for customers that can be included to product related information. Another benefit of allowing users to review and recommend purchased product is that it enhances communication between consumers and enhances vendor’s transparency. Person-interactivity, among other interactivity offered by online shop, has been seen to significantly en-hance possibility of satisfying experience with a website (Ballantine, 2005). However, when consumers are given the opportunity to review the product they have purchased, online shop has to be aware that every customer might not be satisfied with the product. In worst cases, this can lead to more negative reviews than positive.
One way to see product information is to view it from the perspectives of extrinsic cues and intrinsic cues (Wells, Valacich & Hess, 2011). Extrinsic product cues are seen to represent product-related attributes that are not inherit to the product and changes to these cues do not change fundamental nature of the product. As an example, product price, warranty policies and brand are seen to be extrinsic product cues. On the contrary, intrinsic cues that change fundamen-tal nature of the product if altered. Intrinsic product cues include for example internal components of a PC. (Wells et al., 2011.) Both extrinsic and intrinsic cues are important product information, and they both should be present in product page of a search good.
3.2 Product information presentation formats
Information technology has offered many ways to depict product related in-formation. For example, Dimoka et al. (2012) have divided product information presentation formats to textual, visual and multimedia. In the context of this study, three different presentation formats were recognized; textual infor-mation, visual and multimedia presentations, and virtual product experiences. These selected presentation formats can be further divided into more specific formats, but in this thesis these three formats are sufficient.
Perhaps the most used product information’s presentation format is text, where product features and functionalities are depicted with words, numbers and/or paragraphs. For example, product’s purpose of use, product name and size details are often offered in textual format (Dimoka et al., 2012). Online re-tailers typically use text to describe product’s search attributes, like product

19
weight, size and warranty policies (Jiang & Benbasat, 2007). Textual infor-mation can be presented either in paragraph or schematic form (Blanco et al., 2010). When product information is presented with paragraph format, details of the product are adduced with sentences. Providing long textual description can offer a good utility to the customer, but at the same time set vendor to some level of liability. (Dimoka et al., 2012.) Schematic form, on the other hand, lists textual information, for example, in tables or in charts (Blanco et al., 2010), that can make comparison between different products easier for the customer (Fang & Salvendy, 2003).
Even though textual information can be very informative and help con-sumers to find that specific product, using of other formats to depict product descriptions is highly encouraged. For example, visual and multimedia product descriptions are a good addition to textual descriptions, since it can depict product’s visual attributes more effectively than a text would. Visual infor-mation can be displayed in many ways, such as full product images, and prod-uct videos and audio (Dimoka et al., 2012; Manvi & Venkataram, 2005). With these presentation formats, product can be displayed with different sizes, per-spectives and angles (Blanco et al., 2010). Along with text, pictures are one the most commonly used presentation formats in online shops’ product infor-mation (Jiang & Benbasat, 2007). Providing full product images to the consum-ers is seen to enhance their feelings of trust towards product, since sellers of poor products are most likely avoiding offering detailed pictures, which could reveal products’ imperfections or that could be used as a legal evidence. In the case of online auctions, the number of images per product has been even linked with higher buyer utility. (Dimoka et al., 2012.) Though images provide an ef-fective way to describe product’s appearance, it is still important to provide product’s exact measures, for example in textual format to make comparing different products easier for the customer (Fang & Salvendy, 2003).
Nowadays, online vendors can also utilize novel multimedia tools and vir-tual product experiences to portray product information. Jiang and Benbasat (2007) categorized online experiences enabled by virtual reality (VR) technolo-gies to represent category of virtual product experiences (VPEs). Dimonka et al (2012) in turn, categorized these presentation formats to represent multimedia product description, and Kim and Forsythe (2010) used the term of product vir-tualization technology in this context. In this thesis, the term of virtual product experience is adopted to describe this type of information presentation. As an example, interactive 3D views, zooming capabilities and functional controls are seen to represent virtual product experiences (Dimonka et al., 2012; Jiang & Benbasat, 2007; Kim & Forsythe, 2010). These technologies can be used to make it easier to consumers to get familiar with the product prior purchase. Virtual product experiences offer a unique, yet costly, way to get familiar with a prod-uct prior purchase and can lead to higher perceived website diagnosticity than other presentation forms (Jiang & Benbasat, 2007). These presentation formats can be particularly helpful for complex experience products (Dimonka et al., 2012), since they allow online shoppers to interact with product and examine the product online before the actual purchase (Kim & Forsythe, 2010).

20
In the following table (table 1) presentation formats recognized in the con-text of this thesis are gathered and displayed along with product information examples that can be depicted with that specific format.
TABLE 1 Presentation formats of product information
Presentation format Information typically presented in selected format Textual information • Product name
• Product size • Weight • Warranty policies • Manufacturer code • Recommendations • Product reviews
Visual and multimedia presentations
• Product appearance • Product guiding
Virtual product experiences • Product appearance • Product walkthroughs

21
4 USER EXPERIENCE
This chapter will take a closer look to the concept of user experience, also known shorter as UX. First, the definition of user experience will be discussed, and a line will be drawn between user experience and concepts of user satisfac-tion, user preference and usability. After that, formation of user experience in e-commerce environment will be covered and phases in a purchasing process that affect the formation of user experience will be discussed.
4.1 User experience in human-computer interaction
User experience (UX) is one of the most researched concepts in Human-Computer Interaction (HCI) research field. The concept of user experience is wide and sometimes difficult to comprehend, and there are still different per-ceptions of what user experience covers and what is left out of the concept among researchers (Hassenzahl & Tractinsky, 2006). When compared to wider concept of experience that can happen everywhere and represent everything that a person experiences, user experience is focused on experiences that are built on interaction through a user interface. That is why face-to-face services often linked to service experiences are often ruled out from the scope of user experience. (Law, Roto, Hassenzahl, Vermeeren & Kort, 2009.) As an example, one brief definition sees user experience to be an experience that the product creates for a user. For a user to continue using the product, the experience gained from using the product must be positive or at least bearable. (Garrett, 2010.) In fact, from the product success’ perspective, it is important to focus on the experience that arise of using the product, since nowadays people consider many of the product's attributes, benefits and quality to be taken for granted. Therefore, it is no longer sufficient to review only the functionality or usability of the product. (Hassenzahl, 2003.)
International Organization for Standardization (ISO) has defined the term of user experience. According to this definition, the user experience is formed of product’s, service’s or system’s use and user’s observations and reactions aris-

22
ing from the expected use. According to the ISO standard, user experience co-vers all user's feelings, beliefs, observations, physical and psychological reac-tions, behaviors and achievements that occur prior to use, during use and after use. (International Organization for Standardization, 2010.) This definition can be seen to highlight that the user experience varies among users. In fact, when examining user experience, it is important to note that user experience is unique to each user (Kujala et al., 2011).
Hassenzahl and Tractinsky (2006) recognized that user experience derived from user-technology interaction can be looked from three different perspec-tives. According to the first perspective, users need system to be more than just instrumental. This means that, in addition to usability, the user experience is influenced by aesthetics, holistic and hedonism. In fact, this perspective sees that user experience is influenced by product qualities such as pragmatic quali-ty, hedonic quality and aesthetics. Another perspective from which user experi-ence can be assessed, deals with emotions and effects derived from the interac-tion. For example, the system's subjectivity, positiveness, and use antecedents and consequences play a central role in the emotions and effects of user experi-ence. The last perspective considers the nature of user experience, which in user experience’s case is experiential. User experience’s nature can be seen to be dy-namic, complex, unique, situated and temporarily bounded. (Hassenzahl & Tractinsky, 2006.) These three perspectives suggested by Hassezahl and Tractinsky (2006) help to comprehend the different facets of user experience. Although, it is important to note that alone, none of the facets are successful to describe the user experience, but when combined together, these three perspec-tives provide a better understanding to what the user experience actually is (figure 1). (Hassenzahl & Tractinsky, 2006.)
FIGURE 1 Facets of user experience (Hassenzahl & Tractinsky, 2006, 95)
23
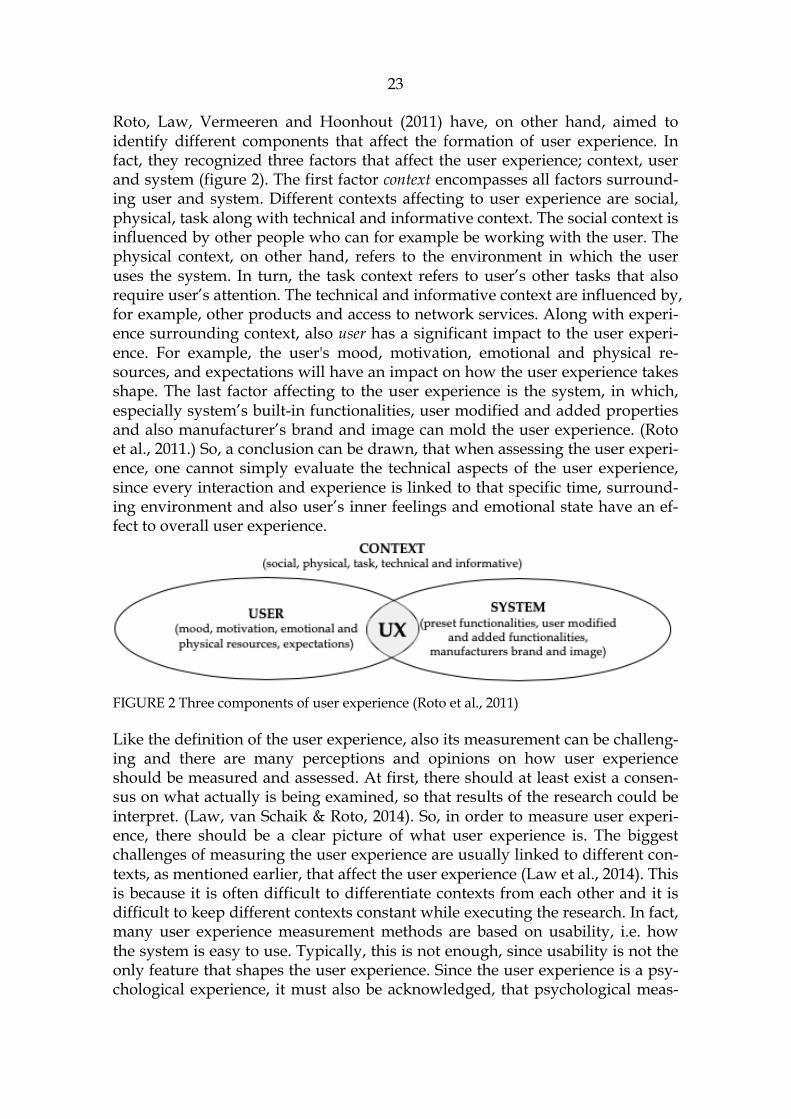
Roto, Law, Vermeeren and Hoonhout (2011) have, on other hand, aimed to identify different components that affect the formation of user experience. In fact, they recognized three factors that affect the user experience; context, user and system (figure 2). The first factor context encompasses all factors surround-ing user and system. Different contexts affecting to user experience are social, physical, task along with technical and informative context. The social context is influenced by other people who can for example be working with the user. The physical context, on other hand, refers to the environment in which the user uses the system. In turn, the task context refers to user’s other tasks that also require user’s attention. The technical and informative context are influenced by, for example, other products and access to network services. Along with experi-ence surrounding context, also user has a significant impact to the user experi-ence. For example, the user's mood, motivation, emotional and physical re-sources, and expectations will have an impact on how the user experience takes shape. The last factor affecting to the user experience is the system, in which, especially system’s built-in functionalities, user modified and added properties and also manufacturer’s brand and image can mold the user experience. (Roto et al., 2011.) So, a conclusion can be drawn, that when assessing the user experi-ence, one cannot simply evaluate the technical aspects of the user experience, since every interaction and experience is linked to that specific time, surround-ing environment and also user’s inner feelings and emotional state have an ef-fect to overall user experience.
FIGURE 2 Three components of user experience (Roto et al., 2011)
Like the definition of the user experience, also its measurement can be challeng-ing and there are many perceptions and opinions on how user experience should be measured and assessed. At first, there should at least exist a consen-sus on what actually is being examined, so that results of the research could be interpret. (Law, van Schaik & Roto, 2014). So, in order to measure user experi-ence, there should be a clear picture of what user experience is. The biggest challenges of measuring the user experience are usually linked to different con-texts, as mentioned earlier, that affect the user experience (Law et al., 2014). This is because it is often difficult to differentiate contexts from each other and it is difficult to keep different contexts constant while executing the research. In fact, many user experience measurement methods are based on usability, i.e. how the system is easy to use. Typically, this is not enough, since usability is not the only feature that shapes the user experience. Since the user experience is a psy-chological experience, it must also be acknowledged, that psychological meas-
24
urements are generally only estimates and should be treated with some level of criticality. (Law et al., 2014.)
Hassenzahl, Diefenbach and Göritz (2010) have suggested that the user experience can be described and evaluated with questionnaires. Questionnaires can be regarded as a good way of examining the subject, because it may be easi-er for users to describe their own experiences with a product rather than the product itself and its functionalities (Hassenzahl et al., 2010). Because user ex-perience is a personal experience, it is important to make the users feel that they can express any positive or negative experience they face when engaging with the system.
When discussing about user experience, often similar concepts like experi-encing, one user experience and co-experience might emerge (Roto et al., 2011). In this context, experiencing is seen as interpreting of observations and feelings derived from use and it is emphasized that, in its nature, experiencing is indi-vidual and dynamic. One user experience, on other hand, highlights the fact that the encounter with user and the system has a clear start and an end. In the key role in this are the user’s experiences that have occurred during that one encounter. The term one user experience can refer to one user’s encounter with the system but also to group’s encountering with the system. Co-experience, in turn, emphasizes that users can experience the system together as a group ra-ther than as separate individuals. In fact, the co-experience highlights the fact that the social environment and its attitudes have an impact on the users’ expe-riences and therefore it is not sufficient to deal with the user experience only from the point of view of individual cases. (Roto et al., 2011.) Co-experience means that, even though user experiences are individual, they are not just it. Behind the idea of co-experience is a thought, that people create, justify and review their experiences with other users and these conversations help users to form an ensemble of their subconscious thoughts. (Battarbee, & Koskinen, 2005.) With that said, from the outside it might be difficult to pinpoint the meaning of co-experience.
As a conclusion, user experience is a combination of many factors, and it is unique to each user as well as a situational. It is affected by user emotions and opinions arising at different phases of an interaction. The user experience con-sists of pre-use experiences and opinions (i.e. anticipated UX), emotions rising during the use (i.e. momentary UX), post-interaction evaluations (i.e. episodic UX) as well as all user experiences gathering summary derived from long-term use (i.e. cumulative UX) (Roto et al., 2011). Even though there are various opin-ions and perspectives to what user experience actually is and how it should be measured, most of the experts tend to agree with main features. In fact, it is of-ten agreed by user experience researchers and practitioners, that the nature of user experience is dynamic, context-dependent and subjective, and it arises from all potential benefits user can derive from using a product (Law et al., 2009). When combined together, time, context, user and system related factors shape the user’s experience with a system. That same experience will later in the future affect user behavior and prejudices, and, at the same time, to other user experiences with same or other system.

25
4.1.1 User Satisfaction
When discussing about concept of user experience, the concept of user satisfac-tion is often raised. According Lindgaard’s and Dudek’s (2003) definition, user satisfaction is a summary of the experience of interactions that user has encoun-tered. User satisfaction is also seen to be depended on how well the user's ex-pectations prior use are met (Flavián, Guinalíun & Gurrea, 2006). When com-pared to concept of user experience, according to Lindgaard and Dudek (2003), the user experience is interested the whole experience with the system, whether or not the user was satisfied with the system. Thus, user satisfaction could be seen as a part or a consequence of the user experience. In fact, according to Rose, Clark, Samouel and Hair (2012), and Rose, Hair and Clark (2011) customer sat-isfaction, along with the intent of trust and re-purchase intention, is seen as a result or consequence of the experience experienced in the online store. A con-clusion can be drawn that the two concepts; user experience and user satisfac-tion are closely related to each other. Therefore, in this study, both user experi-ence literature and user satisfaction materials are utilized.
4.1.2 User Preference
In addition to concepts of user experience and user satisfaction, many publica-tions have also used a concept of user preference. Although user preference can be seen as being comparable to user satisfaction (Lee & Koubek, 2010b), it is good to define what it actually means. The concept of user preference refers to the choice of the user from the existing options, in this case, the user's percep-tion that one website or online store is better than the other (Lee & Koubek, 2010a). According to Cao, Zhang and Seydel (2005), the user's preference for the website arises from the perceived ease of use and usefulness. According to this definition, preference is seen to describe user's attitudes towards a website (Cao et al., 2005). So, like the concept of user satisfaction, user preference is a close concept to user experience and literature regarding the topic will also be uti-lized at some level in this research.
4.1.3 Usability
Another concept important to the user experience research is usability. Human-Computer Interaction (HCI) branch of science began to investigate the usability design in the early 1980’s. To this day, usability has become one of the most popular concepts in the HCI branch of science. (Tractinsky, Katz & Ikar 2000.) While the concept of user experience is broader, the emotions and experience descriptive, usability can be seen as being a more technical concept. For exam-ple, International organization for Standardization (ISO) has defined the term of usability to describe how well the product succeeds in supporting the user to accomplish defined tasks within a specific usage context. In a key role in usabil-ity, according to the standard, is the effectiveness, efficiency and satisfaction. (International Organization for Standardization, 1998.)
26
Flavián et al. (2006), see usability of a website to be based on five different sections. First, usability means how easy it is for the user, on the basis of his ob-servations, to understand the structure, functions, interfaces and contents of the system. In addition, usability discusses how a simple website is to use in the early stages of the use. Thirdly, usability is seen to include how quickly a user manages to find what he is looking for. In addition, usability is seen to be how easy it is to navigate through the site, i.e. how much time and how many steps are required to achieve the desired result. In addition to the features mentioned above, usability is the ability of a user to control where they are and what they are doing, at any time. (Flavián et al., 2006.)
When it comes to usability, the concept of ease-of-use is often raised. These terms, usability and ease of use mostly refer to the same thing and are seen parallel to each other, so, both are used in the field literature (Flavián et al., 2006). However, as it comes to relationship between usability and user experi-ence, usability is in many cases acknowledged as an important component of user experience and even in online shop’s success (DeLone & McLean, 2004; Kim & Eom, 2002; Konradt, Wandke, Balazs & Christophersen, 2003; Palmer, 2002). In fact, e-commerce website’s perceived ease of use and usefulness are seen to play an important role in customer’s attitudes and satisfaction (Devaraj, Fan & Kohli, 2002). Since user experience is seen to cover also the system’s usa-bility (Rose et al., 2012), in this research, usability literature is also utilized in some extent.
4.2 User experience formation in e-commerce environment
From company’s perspective, user experience is one of the most significant fac-tors behind online shop’s success. In prior research, positive user experience has been linked to enhanced customer loyalty towards the online shop (Kujala et al., 2011.), while negative user experience is seen to lead user’s decision to stop us-ing the shopping site altogether (Garrett, 2010). From the online shop’s perspec-tive, if the customer stops using the website, this means one lost customer. On the other hand, if customer’s experience of the online shop has been unremark-able and at the same time experience with some competitor's website has been better, the customer will most likely continue using competitor’s website in-stead (Garrett, 2010). In e-commerce environment, user experience is seen to have an effect to both customer satisfaction and re-purchase intention (Rose, Clark, Samouel & Hair, 2012; Rose, Hair & Clark, 2011), and even to trust in online shopping (Rose et al., 2012). Because of this, online retailers should view their user experience as a long-term strategic priority. In the best case, user ex-perience improvement can lead to continuous brand differentiation and com-petitive advantage of the online store (Rose et al., 2012).
Very close or even overlapping concept to user experience in the context of e-commerce is online customer experience (OCE), that appears typically in re-tailing literature. The overlapping of the two concepts appears when comparing the two concepts closely. For example, Rose et al. (2011) see that online custom-

27
er experience is built on cognitive and affective state of a customer, and it is af-fected by factors like perceived ease-of-use, perceived usefulness, enjoyment and skills. All of these factors are also seen as antecedents of user experience. That is why in the context of this study, literature about online customer expe-rience is also utilized, since the focus is in user experience forming on e-commerce website.
Although the user experience can be examined on a short-term view, in online retailers’ case, inspection of long-term user experience is seen as more significant option (Kujala et al., 2011). In fact, user experience builds and in-volves during customer’s interactions with the online vendor each time cus-tomer interacts with the online shop (Rose et al, 2012). A long-term user experi-ence can offer a better reflection of the user's experience and relationship with the product, service, or even online store. A long-term user experience helps to understand why a user continues to use the product or service or recommend it to someone else. While in some cases it may be useful to observe user experi-ence during a specific time period or event, it remains quite unreliable to pre-dict the actual user experience. (Kujala et al., 2011.)
To better understand the formation of long-term user experience, one can utilize Petre’s, Minocha’s and Roberts’ (2006, 200) model of the Total Customer Experience (TCE) (figure 3). The model aims to depict users pre-purchase and post-purchase activities in online shop and to separate different activities that affect the formation of total user experience. This model is similar to the model provided by Roto et al. (2011), but it is specifically fitted to describe, in more detail, the user experience that is formed in online stores.
FIGURE 3 The Total Customer Experience (Petre et al. 2006, 200)
28
According to the Petre’s et al. (2006) model, online shop’s customer experience consists of seven different phases that follow each other. The first phase covers setting of expectations and it consists of consumer’s expectations and prejudices towards the quality of service, that are formed on a basis of a personal, social and cultural factors. At the second phase, consumer arrives to the online shop. The next phase covers all activities that user performs at the online shop before the actual purchase decision. This phase includes, for example goal setting, browsing and comparing of products. (Petre et al., 2006.) The phase of pre-purchase interactions is also the most significant in terms of product infor-mation. Because all online shop visits do not lead to a purchase decision, some visits stop at this stage. Even though a visit might not lead to purchase, this ex-perience with online shop will affect consumers later purchasing behavior.
The fourth phase in Petre’s et al. (2006) model covers all activities custom-er does to complete the purchase at the online shop. Activities at this stage are for example taking selected product to the ‘shopping bag’ and selecting pay-ment methods (Petre et al., 2006). This is often the last phase of the customer experience where a customer interacts with the online shops’ interface. After the purchase is completed customer can get the confirmation of order and ship-ping information, which are a part of the post-purchase stage. This stage ends when consumer receives ordered products and start consuming them (product / service consumption phase) (Petre et al., 2006). The final phase in the model consists of evaluation of the total user experience after all the phases are com-pleted. At this point, the customer compares this latest experience with their expectations in the online store and forms final assessment of the experience. This assessment ends the cycle of total customer experience and this experience will later affect shaping of following experiences with the online shop but also expectations towards other online shops. (Petre et al., 2006.)
As a conclusion to user experience formation in e-commerce, it can be ar-gued that user experience is a personal experience that evolves during different phases of e-shopping experience, starting with setting of expectations and end-ing with evaluation of total experience after using of the product. The experi-ence will then affect later experiences with the same or other online shop. It is however important to note that not all experiences with an online shop end with a purchase decision, even though positive experiences are linked to inten-tion to re-purchase from a website (Rose et al., 2011). Even positive experience might end with no purchase made and these experiences will still affect follow-ing experiences. This highlights the importance of observing the user experi-ence rather than unambiguous purchase intention, even though some argue that repurchase intention is an embodiment of customer loyalty (Zhang et al., 2011).
29
5 PRODUCT INFORMATION’S EFFECT ON USER EXPERIENCE
In e-commerce environment, the importance of product information is high-lighted (Bigne-Alcaniz et al., 2008), as the e-commerce environment lacks pres-ence of skilled salespersons offering their professional advice. That is why in-formation, that is accurate, informative, updated and relevant to customer's needs, forms a significant building block of an attractive e-commerce website (Cao et al., 2005).
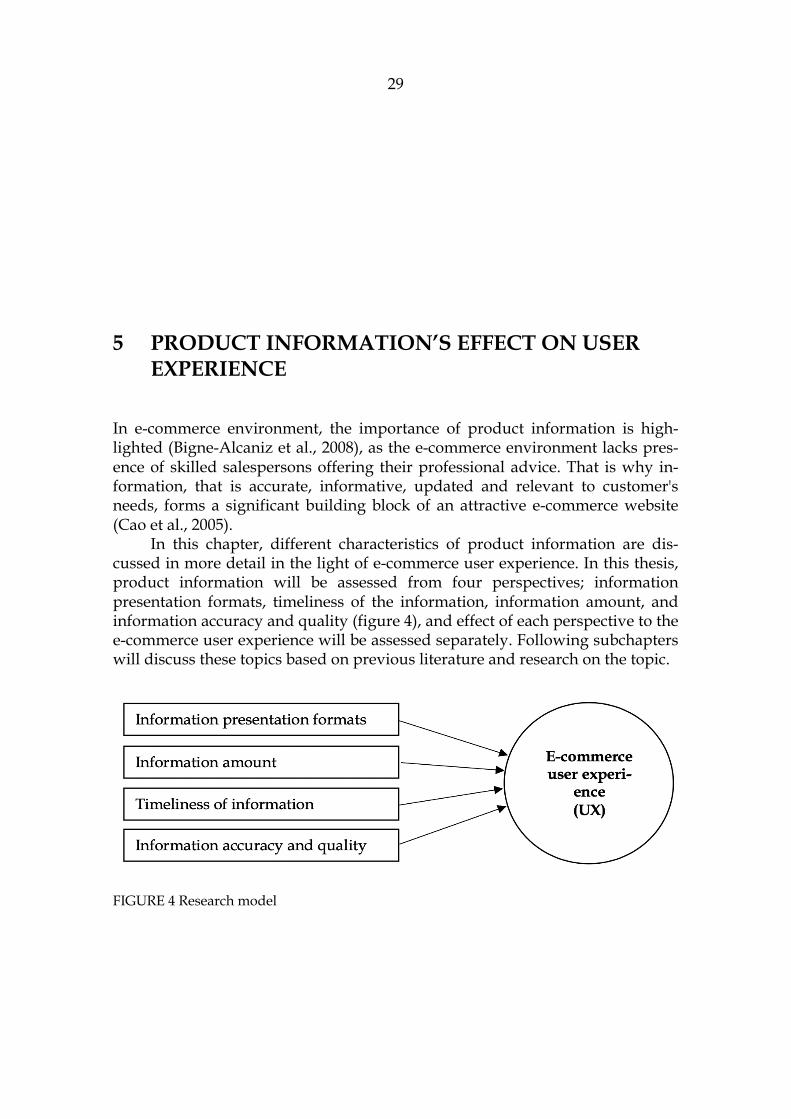
In this chapter, different characteristics of product information are dis-cussed in more detail in the light of e-commerce user experience. In this thesis, product information will be assessed from four perspectives; information presentation formats, timeliness of the information, information amount, and information accuracy and quality (figure 4), and effect of each perspective to the e-commerce user experience will be assessed separately. Following subchapters will discuss these topics based on previous literature and research on the topic.
FIGURE 4 Research model

30
5.1 Information types
Consumer's decision making on what product they like to buy and where to buy depends on various factors, like product pricing, vendor reputation, prod-uct availability and service quality (Manvi & Venkataram, 2005). In fact, to sup-port customer’s decision making, e-commerce retailers should provide compre-hensive details about the product. Typical product related information present-ed on a product page include product’s price, size and material (Lightner & Eastman, 2002).
One of the most researched information of a product is the price, and it has been seen to affect different aspects of customer’s actions on a website. Ex-trinsic product cues, like pricing, has been recognized to often play more im-portant role in perceived website quality and perceived product quality when compared to intrinsic product cues, like product's internal components and functionalities. (Wells et al., 2011.) Product pricing has also been seen as a criti-cal factor to encourage hedonic web browsing, that is focused more on fun and entertainment aspects of shopping (Park, Kim, Funches & Foxx, 2012). Clear presentation of product pricing has even been argued to reduce product related uncertainty (Luo et al., 2012). These different findings could suggest that prod-uct pricing also has an effect to the customer’s user experience of the e-commerce website.
In addition to the product pricing, other product information has been recognized to affect customer activities on e-commerce platform. In following subchapters, stock information’s, recommendations’ and product reviews’ ef-fect on user experience will be discussed in more detail.
5.1.1 Stock information
Product’s stock information is one specific type of information, that has been seen to affect customers shopping activities. For example, in a case where con-sumer finds a product they wish to purchase, accurate stocking information plays an important role. If a product appears to be in-stock, it is optimal for cus-tomer to purchase the product rather than continuing their search activities (Guan & Cheng, 2009). In another case, where the product that customer has selected is not currently available, the customer might decide turn to another e-commerce vendor, choose another similar product that is available, place a backorder, or go and buy the product from a brick-and-mortar store (Guan & Cheng, 2009). Even though, stock-out situation can lead to customer turning to another options, according to Fang and Salvendy’s (2003) customer-centered design rules, products that are currently out of stock should not be removed from the website. In matter of fact, stocking information has been recognized to play an important role in consumers' decision making (Guan & Cheng, 2009; Manvi & Venkataram, 2005) and presentation of product's availability can even reduce product related uncertainty (Luo et al., 2012). Hence it can likely affect the user experience of the e-commerce website.
31
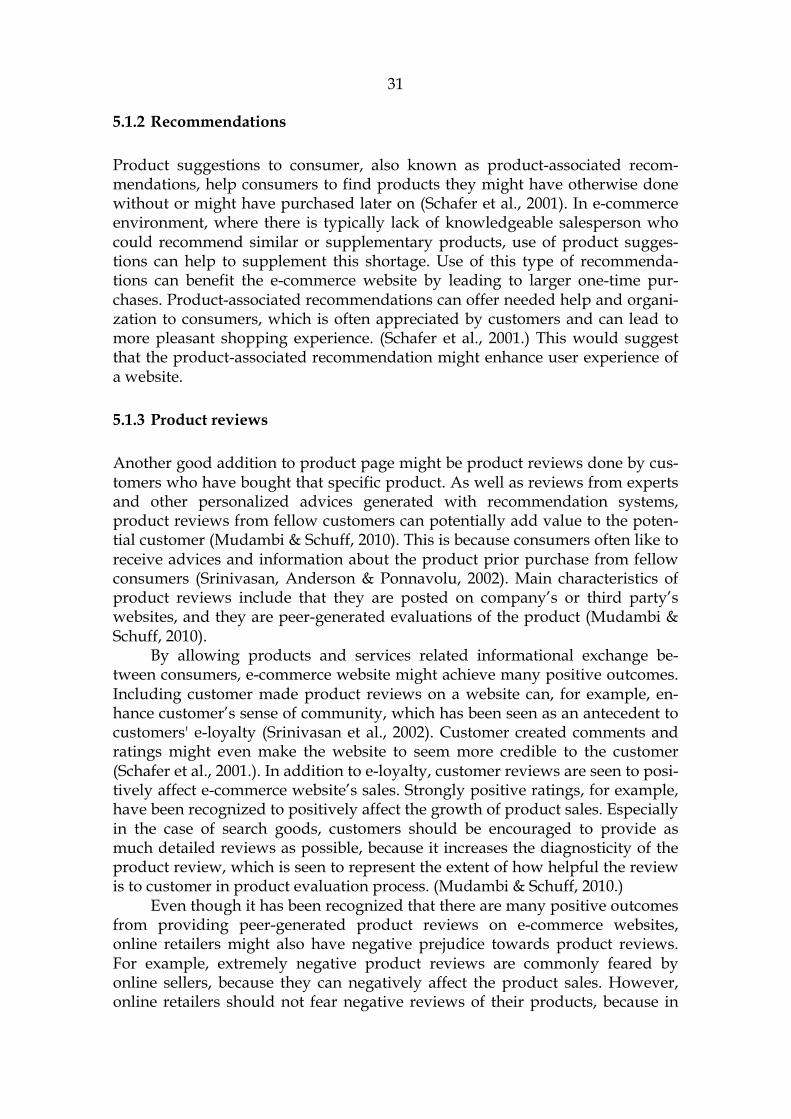
5.1.2 Recommendations
Product suggestions to consumer, also known as product-associated recom-mendations, help consumers to find products they might have otherwise done without or might have purchased later on (Schafer et al., 2001). In e-commerce environment, where there is typically lack of knowledgeable salesperson who could recommend similar or supplementary products, use of product sugges-tions can help to supplement this shortage. Use of this type of recommenda-tions can benefit the e-commerce website by leading to larger one-time pur-chases. Product-associated recommendations can offer needed help and organi-zation to consumers, which is often appreciated by customers and can lead to more pleasant shopping experience. (Schafer et al., 2001.) This would suggest that the product-associated recommendation might enhance user experience of a website.
5.1.3 Product reviews
Another good addition to product page might be product reviews done by cus-tomers who have bought that specific product. As well as reviews from experts and other personalized advices generated with recommendation systems, product reviews from fellow customers can potentially add value to the poten-tial customer (Mudambi & Schuff, 2010). This is because consumers often like to receive advices and information about the product prior purchase from fellow consumers (Srinivasan, Anderson & Ponnavolu, 2002). Main characteristics of product reviews include that they are posted on company’s or third party’s websites, and they are peer-generated evaluations of the product (Mudambi & Schuff, 2010).
By allowing products and services related informational exchange be-tween consumers, e-commerce website might achieve many positive outcomes. Including customer made product reviews on a website can, for example, en-hance customer’s sense of community, which has been seen as an antecedent to customers' e-loyalty (Srinivasan et al., 2002). Customer created comments and ratings might even make the website to seem more credible to the customer (Schafer et al., 2001.). In addition to e-loyalty, customer reviews are seen to posi-tively affect e-commerce website’s sales. Strongly positive ratings, for example, have been recognized to positively affect the growth of product sales. Especially in the case of search goods, customers should be encouraged to provide as much detailed reviews as possible, because it increases the diagnosticity of the product review, which is seen to represent the extent of how helpful the review is to customer in product evaluation process. (Mudambi & Schuff, 2010.)
Even though it has been recognized that there are many positive outcomes from providing peer-generated product reviews on e-commerce websites, online retailers might also have negative prejudice towards product reviews. For example, extremely negative product reviews are commonly feared by online sellers, because they can negatively affect the product sales. However, online retailers should not fear negative reviews of their products, because in

32
case of search goods (e.g. consumer electronics) extremely negative product reviews are in some cases seen to be less helpful than moderate or positive re-views (Mudambi & Schuff, 2010). In fact, in the case of search goods, average of the ratings is seen to affect more to new product sales than the volume of re-views (Cui et al., 2012).
5.2 Information presentation formats
When it has been decided what information about the product will be offered to consumer, the next step should be in assessing what are the best ways to pre-sent different types of information. Because e-commerce websites typically con-tain high amount of information, design of that information should be well de-liberated. As an example, information design, along with navigation and visual design, has been seen to have an impact to customer's trust and satisfaction (Cyr, 2008). Also, in their investigation of antecedents and outcomes of user ex-perience within online shops, Rose et al. (2012) found that when product infor-mation is communicated and presented in a way that suit the customers’ search process, it will enhance customers’ feelings of confidence and calm. However, there are also contrary observations about information design’s and format’s significance. For example, according to Xu, Benbasat and Cenfetelli (2013) in-formation format does not have a significant role in formation of information quality.
In their study, Won Jeong, Fiore, Niehm and Lorenz (2009) recognized that the level of product presentation features has an effect to four experience realms (4Es); entertainment, educational, escapist and esthetic. In the context of apparel websites, the product presentation formats were seen to include product pic-tures, picture enlargements, additional views on product’s backside and frontside, and views of apparel product on a model. It was found that, when product presentation features offer a rich sensory information and lifestyle-oriented details, consumers are more likely to have entertaining, escapist and esthetic experiences. (Won Jeong et al., 2009.)
Even though it is good to carefully plan the presentation of information, it is important to acknowledge that in information design, there is no one-size-fits-all solution available. People tend to have their own preferences and opin-ions on what is well designed and what is not. For example, Lee and Koubek (2010a) have stated, that user preference on how contents on the website should be presented or how information should be presented might be affected by us-er's own characteristics, like cognitive style or prior experiences. Ganguly, Dash, Cyr and Head (2010), on the other hand, have recognized the impact of differ-ent cultural values to trust and purchase intention in e-commerce environment. They found that, in assertive and quick decision making, logically presented product information help customers, who are high on masculinity. This degree of masculinity in the context of this study represented the level to which achievement, competition, assertiveness and performance are valued in a socie-ty. (Ganguly et al., 2010.)

33
In the context of this thesis three different presentation formats are recog-nized. These presentation formats are; textual information, visual and multime-dia presentations, and virtual product experiences. In following subchapters each of these presentation formats’ effect on user experience as suggested by prior literature will be discussed in more detail.
5.2.1 Textual information
Textual format is one of the most used way to present product related infor-mation. It is argued that textual information helps customers to understand specific details about the product and its importance in shopping experience is recognized in many studies. For example, in low information load condition, textual product presentations are seen to function better than other presentation formats as they enhance consumers’ confidence on decision making (Li, Wei, Tayi & Tan, 2016). Diagnostic textual product descriptions can also offer some level of security to consumers, because deviations from the actual product char-acteristics may give a legal basis for product misrepresentation (Dimonka et al., 2012). Lightner’s and Eastman’s (2002) study also argued that in e-commerce context, using of words result in higher satisfaction than pictures.
Because there are different ways to present textual information, these ways of presentations might affect user experience differently. In fact, selection between different textual information presentation forms, paragraph and sche-matic, should be done based on other available information and the infor-mation’s level of detail. For example, in cases, when there is no product picture available, consumers tend to pay more attention to textual information that is in paragraphs. Schematically presented textual product information, on the con-trary, can improve consumer's perceptions of information quality. (Blanco et al., 2010.) Schematic information can also make comparison between different products easier for the customer, and due to this, for example product’s meas-urements could be displayed in schematic form (Fang & Salvendy, 2003).
Though textual information’s effectiveness is recognized in many cases, enriching of textual information is often encouraged. As a matter of fact, cus-tomers tend to express preference for product information that include both words and pictures, rather than specifically selecting either one (Lightner & Eastman, 2002; Saari, Ravaja, Laarni, Turpeinen & Kallinen, 2004). According to Blanco et al. (2010) in cases where textual information is enriched, for example, with a product pictures, consumers tend to remember more information and consider the information to be easier to remember.
5.2.2 Visual and multimedia presentations
Another way to portray product information, is to use visual information and multimedia presentations, such as full product images, and product videos and audio (Dimoka et al., 2012; Manvi & Venkataram, 2005). Especially in a high information load conditions, visual-based online product presentations can
34
generate new information cues for customers, which might enhance their deci-sion-making confidence (Li et al., 2016). Using of visual presentation formats can also help products to be perceived as more tangible (Verhagen, Vonkeman & van Dolen, 2016).
In some cases, it has been even argued that visual presentation formats are superior for customers than textual formats. According to Manvi and Venkata-ram (2005) many of e-commerce websites' users prefer multimedia presenta-tions of product information over textual based presentations, when they are comparing products and making purchase decisions. Fang and Salvendy (2003) even state that full product pictures are necessary product information, because images provide visual cues and richer information than plain text. Missing product pictures might even raise a red flag to customer, since often sellers of bad products do not disclose detailed product pictures that could reveal product's imperfections (Dimonka et al., 2012).
Instead of presenting visuals information with only, for example, product pictures, it might be justified to use multiple visual presentation formats on a same product page. When compared with static pictures, videos with or with-out narration are often found to be more effective to portray products. Using of videos, rather than pictures, might help customers to understand the product and help users to build positive perceptions towards e-commerce website. (Jiang & Benbasat, 2007.) However, it should be also acknowledged that multi-media presentations might decrease website’s usability, since downloading times often tend to increase when using of multiple multimedia presentations (Manvi & Venkataram, 2005). If the website’s usability is decreased, it will often harm also the overall user experience.
5.2.3 Virtual product experiences
In order to make it easier to consumers to get familiar with the product prior purchase, online retailers may also include different types of virtual product experience technologies on their product pages. Virtual product experiences that offer a unique, but costly, way to get familiar with a product prior purchase, and can lead to higher perceived website diagnosticity than other presentation forms (Jiang & Benbasat, 2007). These presentation formats can especially help consumers to comprehend product’s experience attributes. In case of electronic products, these experience attributes can be for example different functional modes or describing how the product feels when its being used. (Jiang & Ben-basat, 2007.)
Using of virtual product experiences can benefit online retailers in differ-ent ways. For example, using of these interactive technologies can in many cas-es result in stronger purchase intention and reduced perceived risk (Kim & For-sythe, 2010). Using of these technologies has also been linked to enhanced product tangibility. For example, 360-spin rotation format has been seen to offer better sense of product tangibility than static pictures, but the best product tan-gibility was in this case achieved with virtual mirrors (Verhagen et al., 2016).
35
But, as mentioned earlier, using of virtual product experiences is costly to the e-commerce provider (Dimonka et al., 2012; Jiang & Benbasat, 2007). In ad-dition, it has been argued that videos can in most cases perform as well as vir-tual product experiences in terms of product learning and users are able to gain similar level of perceived and actual product understanding. In fact, in cases where product is more complex, visual and multimedia presentation formats and virtual product experience technologies are seen to be equally helpful in terms of actual product knowledge. (Jiang & Benbasat, 2007.) However, effec-tiveness of product visualization technologies might also differ between differ-ent product categories (Kim & Forsythe, 2010).
5.3 Information amount
The amount of information is another factor, that should be taken into consid-eration when creating a product page. It has been suggested by prior research that information amount, along with other factors, might affect users’ experi-ences about the website. For example, Keeney (1999) have suggested that in e-commerce website, product information and its accuracy should be maximized. Enhanced competitive advantage has also been linked to the amount of infor-mation. By differentiating itself from competitors regarding to the amount and quality of information, an e-commerce vendor might be able to gain significant competitive advantage (Bigne-Alcaniz et al., 2008).
It has been recognized, that rich product information is a significant ante-cedent of utilitarian value (Chiu et al., 2014). According to Chiu et al. (2014), rich product information along with broad product offerings are more signifi-cant generators of utilitarian value when compared to other utilitarian benefits; monetary savings and convenience. In addition to utilitarian benefits, hedonic properties along with perceived risk define repurchase intention. But utilitarian value is seen to be more prominent than hedonic value. (Chiu et al., 2014.) This would suggest that rich product information has also an important role in for-mation of customer’s repurchase intention and user experience.
In addition, information amount has been linked to the consumer satisfac-tion. According to Ballantine (2005) the amount of information, along with the interactivity, provided by the e-commerce website have a significant effect on consumer satisfaction. Szymanski and Hise (2000) also support this by stating that superior product information can impact satisfaction to a statically signifi-cant degree, but on the contrary, they argue that the practical significance of superior product information's effect to satisfaction is not that great. Ballantine (2005), however, suggests that the number of attributes per-product might posi-tively predict satisfaction, since in his research, the more attributes was provid-ed the higher the consumer satisfaction was.
E-commerce vendors are often encouraged to provide as much detail about the product as possible. For example, if the consumer feels that there are too little or missing product information, they might assume that the infor-mation is intentionally withheld from them (Dimoka et al., 2012). That might
36
then lead to assumption, that the missing information is negative (Dimoka et al., 2012). Even though, maximization of product information is often encouraged, it has also been argued that information beyond certain point can lead to cus-tomer’s feelings of sensory or information overload, which affect the level of satisfaction negatively (Ballantine, 2005). If customer feels that they are over-whelmed with information overload, their emotional state can be disrupted and they are not as likely to repeat purchase (Rose et al., 2012). Therefore, it is likely that also user experience can be negatively affected by information overload.
5.4 Timeliness of the information
It is also important to acknowledge, that information once provided about the product should be kept updated. For example, product’s availability and ship-ping costs and times are types of information, that should always be up to date. To highlight its importance, timeliness of the product information has been rec-ognized as an antecedent of user satisfaction (Lin, 2007; Zviran, Glezer & Avni, 2006). Supporting the importance of up-to-date information, information's time-liness is often portrayed as a constructor of information quality along with ac-curacy, usefulness and completeness. This information quality along with sys-tem quality and service quality are seen as antecedents of customer satisfaction. (Lin, 2007.) However, in their research Xu, Benbasat and Cenfetelli (2013) ar-gued that the completeness and accuracy of information play more significant role in information quality formation than currency of information. Thus, it seems that timeliness of the information is important yet less significant ante-cedent of user experience.
5.5 Information accuracy and quality
Information accuracy and quality are also factors, that are often linked to for-mation of satisfaction and user experience in e-commerce field of operation. For example, quality of information is seen as an antecedent to user satisfaction, perceived value and intention to reuse (Wang, 2008). High-quality product in-formation that is suited for customer's need is even argued to lead to higher levels of user satisfaction towards online retailer (Lin, 2007). Information accu-racy and completeness are also seen as strong predictors of trust and risk (Kim et al., 2008).
Thus, information attributes, such as accuracy and quality, have an im-portant role in formation of user satisfaction in e-commerce website and they have been incorporated into different models aiming to explain the formation of satisfaction. For example, the end-user computing instrument (EUCI) constructs on five measures of which three; presenting accurate information, using a clear presentation format and ensuring timeliness of information, can be seen to be related to product information (Zviran et al., 2006). Also model of 3Qs aiming to

37
explain website adoption acknowledges information quality’s (IQ) importance along with service quality (SQ) and system quality (SysQ) (Xu et al., 2013). In 3Qs model, perceived information quality, consists of information completeness, accuracy, format and currency. Supporting its importance to website, this quali-ty of information has been seen to have an impact to perceived service quality (SQ) and it has been even argued that high online service quality is almost im-possible to obtain without a high level of information quality. (Xu et al., 2013.)
It is also important to note that if consumer finds product information to be not accurate or poor quality, it might adversely affect the experience. In a situation where product information appears to be incomplete, consumers might either treat the missing information as negative or ignore descriptions that are missing valuable information (Dimonka et al., 2012). Customer's feel-ings of uncertainty towards a product plays an important role in formation of user satisfaction. This product-related uncertainty can be reduced by website design (clarity of product information, etc.), customer service (product availa-bility) and pricing. (Luo et al., 2012.) This again indicates the information accu-racy and quality to be important to positive user experience.
38
6 METHODOLOGY
In this chapter, the empirical research section of this master’s thesis will be pre-sented and discussed. First quick recap to research objectives and questions is taken, after which selected research method is reasoned. Then formation of the questionnaire is discussed in more detail. This chapter will be ended with de-scription of how the collected data will be analyzed to ensure reliability and validity of the conducted empirical research.
6.1 Research objective
The main aim of the study is to gather information on how product information provided in electronics selling e-commerce websites affect the websites’ user experience. While addressing this main research question, the focus is also to recognize different types of product information there are in modern e-commerce websites and how this product information is presented on online shops or in other words what types of presentation formats are used. By identi-fying different facets of product information, questions about product infor-mation’s effects on user experience will be evaluated. The aim of the empirical study is to answer following research question:
• How provided product information affects the user experience formation in e-commerce website?
Following supporting questions were then derived from the main research question:
• How different aspects of product information affect user experience? • Which product information are the most significant to the user?
To answer the research question, product information attributes and different aspects of user experience were separated and looked through individually. In
39
this thesis product information is divided into four attributes; information presentation formats, timeliness of the information, information amount, and information accuracy and quality. The aim is then to individually compare these four attributes to three constructs of user experience; attractiveness, pragmatic quality and hedonic quality. The objective is to test if any of the product information attributes has an effect to user experience. Following hy-potheses are formed to test different research settings:
• H1: Perceptions of used presentation formats positively influence web-site’s attractiveness;
• H2: Perceptions of used presentation formats positively influence web-site’s pragmatic qualities;
• H3: Perceptions of used presentation formats positively influence web-site’s hedonic qualities.
• H4: Perceived amount of information positively influences website’s at-tractiveness;
• H5: Perceived amount of information positively influences website’s pragmatic qualities;
• H6: Perceived amount of information positively influences website’s he-donic qualities.
• H7: Perceived timeliness of information positively influences website’s attractiveness;
• H8: Perceived timeliness of information positively influences website’s pragmatic qualities;
• H9: Perceived timeliness of information positively influences website’s hedonic qualities.
• H10: Perceived information accuracy and quality positively influences website’s attractiveness;
• H11: Perceived information accuracy and quality positively influences website’s pragmatic qualities;
• H12: Perceived information accuracy and quality positively influences website’s hedonic qualities.
Because the study is conducted in Finland, a decision was made to make a limi-tation to focus to electronics selling e-commerce websites that are well known in Finland. To gather as much participants as possible and to make the results more comparable, three most popular electronics selling e-commerce websites in Finland are selected to be subjects to investigation. These selected online shops are Verkkokauppa.com, Gigantti and Power (Tammilehto, 2019).
6.2 Research method
The main aim of the study was to better understand user experience formation in e-commerce environment, and especially what kind of role product infor-

40
mation has in it. To address the research aim and questions, quantitative ap-proach was chosen as the research method. More specifically, a survey research approach was taken in order to collect empirical data. In next subsections, quantitative research strategy and survey research as data collection method will be discussed in more detail.
6.2.1 Quantitative research
This study adopts quantitative research approach to answer the set research questions. Quantitative research strategy is often selected in order to verify or falsify either a relationship or hypothesis important to the conducted study (Neuman, 2011, p.166), and to build a theory that is deductive and largely causal (Neuman, 2011, p.174). Quantitative research strategy mainly focuses on understanding different causal connections (Hirsjärvi, Remes & Sajavaara, 2004, p.130).
Common functions in quantitative research include building conclusions of prior research, utilizing of existing theories, presenting hypothesis, and defi-nition of concepts (Hirsjärvi et al., 2004, p.131). From these functions, especially definition of the concepts tends to be rather challenging. Separation of theoretical concepts and spoken language can prove to be difficult, since research participant would often prefer using of spoken language that in research setting can lead to concepts being too ambiguous. (Hirsjärvi et al., 2004, p.141.)
Contrary to qualitative research strategies which are collecting for exam-ple words, sentences and symbols to gather soft data, quantitative research strat-egies collect hard data in the form of numbers (Neuman, 2011, p.165). Quantita-tive research also uses concepts that are in the form of distinct variables and the aim is to make procedures standard and repeatable, while qualitative approach utilizes concepts in form of themes, motifs, taxonomies, and generalizations to build either a causal or noncausal theory (Neuman, 2011, p.174).
Even though qualitative and quantitative research strategies are often compared to each other, they are complementary strategies that can be utilizedto same research side by side or one following the other (Hirsjärvi, Remes & Sajavaara, 2004, p,127). This study, however, utilizes solely quantitative researchstrategy.
6.2.2 Survey research as data collection method
The empirical data of the study is collected with a survey. Survey research is often used when the unit of observation is a person and the interest is to under-stand person’s opinions and attitudes (Hirsjärvi et al., 2004, p.174; Vilkka, 2007). For example, questions related to behavior, attitudes, characteristics, expecta-tions, self-classification, and knowledge can be asked with surveys. Surveys require careful planning and effort, but as reward, can provide accurate, relia-ble and valid data. (Neuman, 2011, p.309.) One of the surveys advantages is that it can be used to gather large amounts of empirical data. From a researcher’s

41
point of view, surveys can also be very effective, since they can save their time and effort. (Hirsjärvi et al., 2004, p.184.)
Surveys collect data with standardized methods and the respondents form a sample of specific population. Collecting data with standardized methods denote that one question is asked from all if the respondents and in exactly the same way. (Hirsjärvi et al., 2004, p.182.) In other words, every participant an-swer to same questions that are formatted identically, and the questions are asked in same order and in similar way (Vilkka, 2007).
There are several challenges when conducting a survey research. Different types of errors in survey research include coverage error, sampling error, measure-ment error, and nonresponse error (Ponto, 2015). These errors can be reduced with different strategies and by careful planning. For example, to avoid or reduce measurement error, it is suggested to use valid and reliable instruments, prior tested questions, user-friendly graphics, and visual characteristics (Ponto, 2015). Long response times are also a one major challenge of survey research (Vilkka, 2007). There is also some critique of surveys being too superficial and theoreti-cally modest (Hirsjärvi et al., 2004, p.184).
The survey research can be used with both quantitative and qualitative re-search strategies, or their combinations, depending on the used question types (Ponto, 2015). The most common data collection methods in survey research are questionnaires and interviews (Ponto, 2015). The empirical data for this study was collected with questionnaire using numerically rated items. The decision was made due to prior research, that has indicated that questionnaires work well in describing and evaluating experiences (Hassenzahl et al., 2010).
Forms of questionnaires can vary anywhere from paper form to electronic format and their combinations (Ponto, 2015). This study was conducted as web survey, which is one type of survey research. One of the web surveys ad-vantages is that it can be very fast and inexpensive to use. (Neuman, 2011, p.339.) Web-based survey’s challenges are often related to coverage, privacy and verification, and design. Coverage issues are related to unequal access to the Internet, which can lead to situation where some of the sample is out of the surveys reach. Privacy and verification issues, in turn, are related to the ques-tions of how respondent’s privacy is protected and how can be verified that re-spondent is who they claim to be, and they have responded only once. Design issues are linked for example to number of questions per page, using of pro-gress indicator, and survey’s visual appearance’s simplicity. (Neuman, 2011, p.340.)
6.3 Formation of questionnaire
As mentioned in previous section, the empirical data of the study was collected with survey research following a quantitative research strategy. A new ques-tionnaire was formed in order to assess product information and user experi-ence related questions. Though in the formation of the questionnaire, prior
42
studies about product information and user experience, and questions used in these studies were utilized to reduce risk of measurement error.
Researched population was formed of Finnish speaking individuals who have had experiences with one of the three most popular electronics selling e-commerce websites in Finland; Verkkokauppa.com, Gigantti or Power. Because the study was conducted in Finland to Finnish speaking individuals, a decision was made to provide the questionnaire only in Finnish language. Since the majority of the prior research was in English, questions that were utilized from these studies were translated in Finnish.
Since the study was interested on individual’s genuine user experiences, the respondents were given an option to choose which one of three e-commerce websites’ experiences they wanted to evaluate in the questionnaire. One re-spondent could evaluate only one e-commerce site in their response. Respond-ents were also free to choose any product page within the e-commerce website they had selected. It is however important to recognize that there are some chal-lenges when evaluating prior experiences. For example, if there is fairly long time passed after the experience, i.e. few years, it can be hard to the respondent to recall specific events and feelings from that experience (Neuman, 2011, p.317). That is why, in the questionnaire, respondents were encouraged to open the product page of their choice to another tab of their Internet browser as they were filling out the questionnaire.
The questionnaire was provided only online, even though it can lead to coverage error, since individuals without Internet devices are not able to partic-ipate (Neuman, 2011, p.340; Ponto, 2015). However, this decision was made be-cause the study was interested in individuals who had experiences with e-commerce websites, and therefore it was presumed that a member of this popu-lation would have access to Internet based questionnaire. The questionnaire was created with Google Forms which is an online survey tool. After the ques-tionnaire was tested and ready to be released, the link to the questionnaire was released and invitation to the survey was shared to multiple platforms. The in-vitation was released for example in few Facebook groups and to one student organization’s e-mailing list. Although, with the direct link to the survey, any-one could participate to the study.
Mainly four question types were used in the questionnaire; checkbox questions, multiple choice questions, Likert scale questions, and semantic dif-ferential scale questions. The study utilized mainly closed-ended questions that offers a fixed set of response options to asked question, from which a respond-ent can choose from (Neuman, 2011, p.323). The selection to use closed-ended questions was justified with the quantitative research approach, and with the need to compare answers among respondents (Farrell, 2016; Neuman, 2011, p.325). Closed-ended questions are also easier and quicker to answer and given response choices might help respondents to comprehend a question’s meaning better (Neuman, 2011, p.325). Participant’s year of birth was however asked with short answer field, that can be seen as open-ended question.
The questionnaire was divided roughly to four sections. The first parts of the questionnaire dealt with basic information about the participant (i.e. year of birth, gender), their prior experiences with electronics providing e-commerce

43
websites, and more specifically what experience they were describing in their response. About the prior experiences, respondent was asked, when was the last time they had searched product information about electronic product in online shop and had they ever purchased electronics online. These questions were both in multiple choice format, where participant had to select the best suited option. Questions where participant clarified what experience they were evaluating were, what online store are they evaluating (Verkkokauppa.com, Gigantti or Power) and whether the visit led to the purchase decision or not. At this section respondent was also asked to rate how important different product information is to them. In this question, product information was itemized to price, product size, package size, user’s manual, availability information, full product pictures, videos describing product’s use, shipping costs, “you might also like” recommendations, and product reviews. The importance of each in-formation was evaluated on 5-point Likert scale ranging from very insignificant to very significant. The second and third sections discussed questions about the product information on product page selected by participant and the total user experience about the e-commerce website. The structure of second and third sections will be discussed in more detail in the following subchapters.
The questionnaire ended with optional fourth section, where the partici-pant could fill out their contact information (i.e. name, e-mail address) to partic-ipate in a draw. Two gift cards to online shop selected by the participant were raffled to motivate potential participants to take part in the study. Participants were not required to submit any identifiable personal data, so it was possible to complete the questionnaire completely anonymously. After an answer was submitted by participant, it could not be modified later on.
6.3.1 Product information
The second section of the questionnaire was interested on how product infor-mation was presented on product page selected by participant and what were participant’s perceptions of the provided product information. First participants were asked to select all information presentation formats used on the product page. In this checkbox question, options varied from text in paragraph format, text in schematic format, full product pictures, video and audio presentations, to other virtual product information presentation formats. From these options the respondent could select all presentation formats used in the product page being evaluated.
After describing the used presentation formats, participants were asked to answer questions about the product information and their opinions about the provided information. Participant were asked to describe their level of agree-ment or disagreement with 19 statements about the product information. Agreement to the statements were analyzed with 5-point Likert scale, ranging from strongly disagree to strongly agree and where option in the middle repre-sented neither agree nor disagree. Within the statements, there were statements regarding information presentation formats, information amount, timeliness of the information, and information accuracy and quality. The statements used in

44
the questionnaire were gathered up from prior studies about the subject. Infor-mation presentation formats were evaluated with four statements (table 2), that evaluated the appropriateness and helpfulness of the used formats.
TABLE 2 Statements about information presentation formats
Statement Reference PF1 This website communicates information in an appropri-
ate format (Blanco et al., 2010)
PF2 This website is helpful for me to evaluate the product (Jiang & Benbasat, 2007) PF3 This website is helpful in familiarizing me with the
product (Jiang & Benbasat, 2007)
PF4 This website is helpful for me to understand the perfor-mance of the product
(Jiang & Benbasat, 2007)
The amount of the product information was evaluated with six statements (ta-ble 3). The statements varied from if there were enough details about the prod-uct to whether user felt that the provided information was complete.

45
TABLE 3 Statements about information amount
Statement Reference IA1 The store’s website provided adequate information (Devaraj et al., 2002) IA2 The online site provided sufficient information for the
product (Devaraj et al., 2002)
IA3 I thought this web site provided detailed information about the product featured
(Ballantine, 2005)
IA4 This web site provided a comprehensive list of the tech-nical specifications of the products featured
(Ballantine, 2005)
IA5 This web site provided information on a large number of product attributes for each of the products featured
(Ballantine, 2005)
IA6 Do you think you have received complete information both on basic facts and on full product details?
(Zviran et al., 2006)
Three statements focused solely to timeliness of the product information (table 4). With these statements, participant had to describe their agreement to wheth-er the information was timely and updated.
TABLE 4 Statements about timeliness of the information
Statement Reference IT1 This website provides timely information about the prod-
uct (Blanco et al., 2010)
IT2 The web site provides updated information (Cao et al., 2005) IT3 The web site provides timely information (Cao et al., 2005)
Product information’s accuracy and quality was evaluated with six statements (table 5). Provided information’s completeness, accuracy, reliability, selective-ness, comparativeness and level of quality were estimated with these state-ments, in order to understand whether the participant felt that they had re-ceived accurate and high-quality information about the product on the e-commerce website.

46
TABLE 5 Statements about information accuracy
Statement Reference AQ1 This website provides complete information about the
product (Blanco et al., 2010)
AQ2 This website provides accurate information about the product
(Blanco et al., 2010)
AQ3 This website provides reliable information about the product
(Blanco et al., 2010)
AQ4 This website provides selective information for the pur-chase choice
(Blanco et al., 2010)
AQ5 This website provides comparative information between products
(Blanco et al., 2010)
AQ6 The web site provides high quality information (Cao et al., 2005)
The order of the 19 statements was shuffled in the questionnaire, so that state-ments belonging to same category were not presented one after the other. The respondent had to express their agreement or disagreement to each of state-ments in order to move to the next section of the questionnaire and to complete the questionnaire.
6.3.2 User experience
To measure selected websites’ user experience, this study utilized the user ex-perience questionnaire (UEQ) developed to measure user experience quantita-tively (Schrepp, Hinderks & Thomaschewski, 2014). The user experience ques-tionnaire was created in 2005 (Schrepp, 2015), and it can be used for any types of interactive product to quickly assess its user experience (Rauschenberger, Schrepp, Pérez Cota, Olschner & Thomaschewski, 2013; Schrepp, Hinderks & Thomaschewski, 2017a). It has been used for example to online shops and ser-vices, business applications and household appliances (Schrepp et al., 2017a). The user experience questionnaire in this form is described to be a reliable and valid measure for user experience, which is easy to apply (Laugwitz, Held & Schrepp, 2008).
As like other similar user experience measuring questionnaires, the UEQ measures respondent’s subjective attitude towards a product or service (Hin-derks, Schrepp, Mayo, Escalona & Thomaschewski, 2019). The user experience questionnaire measures six scales; attractiveness, perspicuity, efficiency, dependabil-ity, stimulation, and novelty. Of these scales, perspicuity, efficiency and dependabil-ity aim to measure user experience’s pragmatic quality aspects. Hedonic aspects are measured with stimulation and novelty scales. Attractiveness on opposite is a pure valence dimension. (Schrepp et al., 2014.) The six scales of the UEQ are measured with a 26-item questionnaire (Laugwitz et al., 2008). The UEQ has the form of a semantic differential scale (Rauschenberger et al., 2013), and each item is of the questionnaire consists of a pair of terms with their opposite meanings (i.e. good – bad) (Schrepp et al., 2017). Each item is evaluated with seven-stage
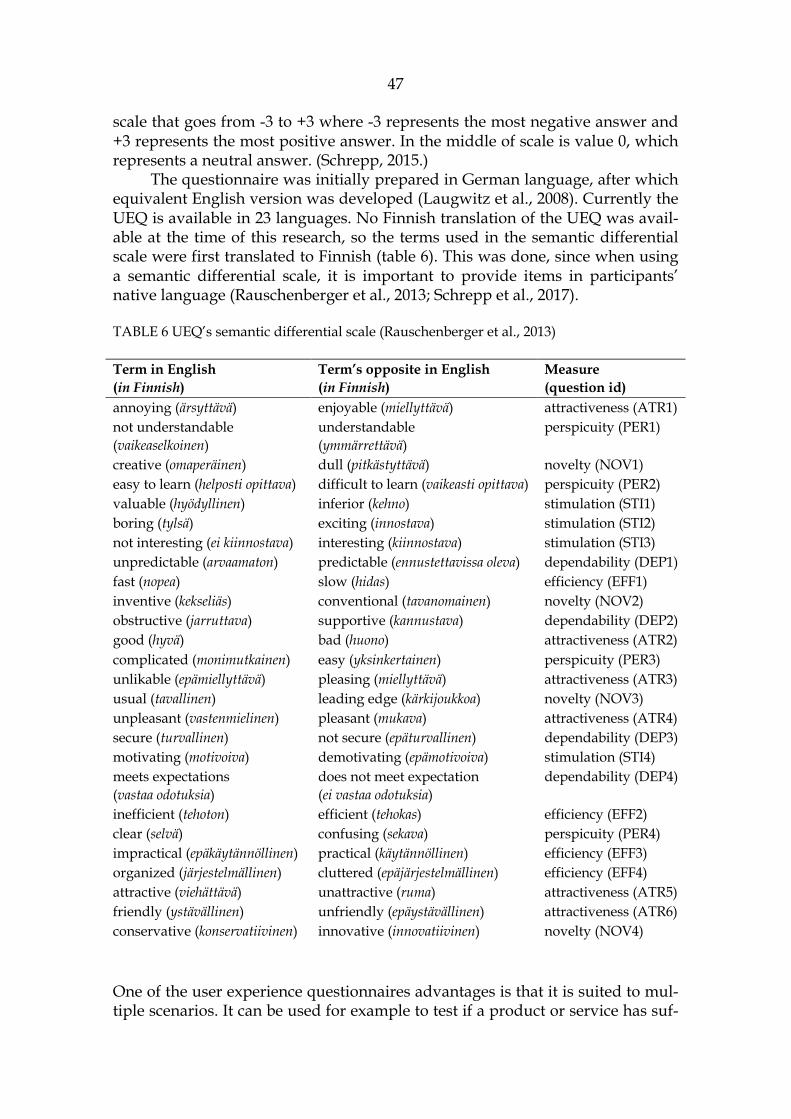
47
scale that goes from -3 to +3 where -3 represents the most negative answer and +3 represents the most positive answer. In the middle of scale is value 0, which represents a neutral answer. (Schrepp, 2015.)
The questionnaire was initially prepared in German language, after which equivalent English version was developed (Laugwitz et al., 2008). Currently the UEQ is available in 23 languages. No Finnish translation of the UEQ was avail-able at the time of this research, so the terms used in the semantic differential scale were first translated to Finnish (table 6). This was done, since when using a semantic differential scale, it is important to provide items in participants’ native language (Rauschenberger et al., 2013; Schrepp et al., 2017).
TABLE 6 UEQ’s semantic differential scale (Rauschenberger et al., 2013)
Term in English (in Finnish)
Term’s opposite in English (in Finnish)
Measure (question id)
annoying (ärsyttävä) enjoyable (miellyttävä) attractiveness (ATR1) not understandable (vaikeaselkoinen)
understandable (ymmärrettävä)
perspicuity (PER1)
creative (omaperäinen) dull (pitkästyttävä) novelty (NOV1) easy to learn (helposti opittava) difficult to learn (vaikeasti opittava) perspicuity (PER2) valuable (hyödyllinen) inferior (kehno) stimulation (STI1) boring (tylsä) exciting (innostava) stimulation (STI2) not interesting (ei kiinnostava) interesting (kiinnostava) stimulation (STI3) unpredictable (arvaamaton) predictable (ennustettavissa oleva) dependability (DEP1) fast (nopea) slow (hidas) efficiency (EFF1) inventive (kekseliäs) conventional (tavanomainen) novelty (NOV2) obstructive (jarruttava) supportive (kannustava) dependability (DEP2) good (hyvä) bad (huono) attractiveness (ATR2) complicated (monimutkainen) easy (yksinkertainen) perspicuity (PER3) unlikable (epämiellyttävä) pleasing (miellyttävä) attractiveness (ATR3) usual (tavallinen) leading edge (kärkijoukkoa) novelty (NOV3) unpleasant (vastenmielinen) pleasant (mukava) attractiveness (ATR4) secure (turvallinen) not secure (epäturvallinen) dependability (DEP3) motivating (motivoiva) demotivating (epämotivoiva) stimulation (STI4) meets expectations (vastaa odotuksia)
does not meet expectation (ei vastaa odotuksia)
dependability (DEP4)
inefficient (tehoton) efficient (tehokas) efficiency (EFF2) clear (selvä) confusing (sekava) perspicuity (PER4) impractical (epäkäytännöllinen) practical (käytännöllinen) efficiency (EFF3) organized (järjestelmällinen) cluttered (epäjärjestelmällinen) efficiency (EFF4) attractive (viehättävä) unattractive (ruma) attractiveness (ATR5) friendly (ystävällinen) unfriendly (epäystävällinen) attractiveness (ATR6) conservative (konservatiivinen) innovative (innovatiivinen) novelty (NOV4)
One of the user experience questionnaires advantages is that it is suited to mul-tiple scenarios. It can be used for example to test if a product or service has suf-

48
ficient user experience, but also to compare service’s user experience to direct competitor in the market (Schrepp et al., 2014). This enabled using only one us-er experience measurement tool to both evaluate e-commerce websites sepa-rately and comparison of user experiences between websites. Another reason why UEQ was selected was that it does not require much effort from the partic-ipants and reading the instructions and filling out the questionnaire takes only approximately 3-5 minutes (Schrepp et al., 2014). The UEQ also provides detailed information and feedback of all six measured aspects of user experience; attractiveness, perspicuity, efficiency, dependability, stimulation, and novelty (Schrepp, Hinderks & Thomaschewski, 2017b).
6.4 Analysing the data
Data analyzing process in this study started with removing any identifiable in-formation from the data. In principle, participants were not required to submit any identifiable personal data, so it was possible to complete the questionnaire completely anonymously. But if respondent took part to the draw, respondent’s name and e-mail address were collected. Any contact information respondents had provided to participate in the draw was removed from the data straight after the draw, and all answers were analyzed anonymously.
The process to analyze gathered data, followed phases presented by Hirsjärvi et al. (2004, p.209). First data was checked to identify clear errors and if there were missing any information (Hirsjärvi et al., 2004, p.210). However, in the questionnaire a respondent had to answer all questions in order to move on to following section of the questionnaire or to complete the survey. This also meant that, because web-based surveys check the entered responses at the time of response, in practice, there could not be any questions left plank. However, the data had to be look through for possible outliers, which had to be removed from the data. Every response was checked for any clear incorrectness, and clear outlier responses were dismissed (Hirsjärvi et al., 2004, p.209).
Second phase as suggested by Hirsjärvi et al. (2004, p.210), was to com-plete gathered information. This phase was not conducted in the context of this study, because respondents could complete the questionnaire completely anon-ymously, which made any follow-up questions impossible to be asked. Also, since every question required an answer from respondent, no empty responses appeared in the data.
At the third phase, the data was organized (Hirsjärvi et al., 2004, p.210). Raw data was systematically organized into a format used by a statistic soft-ware. This process is also known as coding of the data. (Neuman, 2011, p.383.) Coding procedure consisted of assigning numeric values to different answers (Neuman, 2011, p.384). For example, in Likert scale questions strongly disagree was coded as 1 and strongly agree as 5. After the third phase, the data was looked over to make deductions.
The data was analyzed with IBM’s SPSS Statistics program (version 24). To analyze results specifically from the user experience questionnaire, Excel tool

49
for data analysis provided by the questionnaire’s creators was also utilized, and the benchmark for the UEQ was utilized (Schrepp et al., 2017a). The benchmark for UEQ developed by Schrepp et al. (2017a) allows comparing the results of one product or service to a large set of other products like business applications, development tools, web shops and mobile applications. Use of the benchmark is helpful in situations where the user experience questionnaire applied for the first time and there is no prior data to compare the results to. In fact, use of the UEQ benchmark was justified in this study since the UEQ was applied for the first time in this context, and there were no results from previous evaluations available to use for comparison. However, it is important to note that there is only one benchmark data set available for all types of products and there is not a data set specifically for online shops. Since there might be differences between different products and services, comparison of the results of questionnaire and the benchmark is done with cautious. (Schrepp et al., 2017a.)
50
7 RESULTS
This chapter represents the results gathered from the online questionnaire. At first, overview of the respondents will be presented, followed with separate insight to product information results and results of user experience question-naire. The results chapter will be finished with comparison of product infor-mation factors and user experience responses to find out if there is a correlation between them.
7.1 Overview of the respondents
With the developed online questionnaire, a total of 93 responses were collected. When data was checked, one respondent was rejected due to every Likert scale and semantic scale question being answered with the middle option. No other respondent did not seem alarming. After the one outlier was removed, data was coded and analysed with the remaining 92 responses.
Respondents of the questionnaire were divided into three groups depend-ing on their age. From the respondents, 37 percent were 25 years old or under. The biggest age group were 26– to 50-year-olds, since they represented 56,5 percent of all the responses. 6,5 percent of the respondents were over 50 years old. The mean age of the respondent was 31,77 years, where the youngest re-spondent was 16 years old and the oldest was 60 years old. Gender distribution was also surprisingly even due to half of the respondents being females and other half being males. None of the respondents identified their gender as other.
Most of the respondents, 64,1 percent, had searched information during a month and 29 respondents, which represented 31,5 percent, had searched in-formation within half a year. Only with 4,4 percent of the respondents, more than half a year had elapsed from last time they had searcher information about electronic product.
From the three online shops being investigated, most of the respondents chose to evaluate their experience with Verkkokauppa.com. Verkkokauppa.com received 58,7 percent of all responses, Gigantti received 26,1 percent of respons-

51
es and Power received 15,2 percent of all responses. When measured on net sales, Verkkokauppa.com has currently been the biggest online shop in Finland, followed by Gigantti and Power (Tammilehto, 2019), which can explain the no-ticed variation. More detailed division of responses between online shops and respondent gender division are presented in following table (table 7).
TABLE 7 Respondent gender distribution
Verkkokauppa.com Gigantti Power TOTAL male 28 13 5 46 female 26 11 9 46 TOTAL 54 (58,7 %) 24 (26,1 %) 14 (15,2 %) 92
Within evaluated experiences, altogether 64,1 percent led to purchase decision and 35,9 percent did not lead to purchase. From the purchase decisions, 38 were made in Verkkokauppa.com, 14 in Gigantti, and 7 in Power. From the results can be derived, that the respondents were fairly familiar with browsing and purchasing electronic products from online providers, since 92,4 percent of the respondents had purchased electronics online.
7.2 Product information results
This section will take an overlook to responses of product information related questions of the questionnaire. At first, results about significant product infor-mation to respondents will be gone through, after which used product infor-mation presentation formats per website will be assessed. At the end, responses to product information statements will be looked through and evaluated per e-commerce site.
7.2.1 Significant product information
At the questionnaire respondents estimated how significant they find selected product information types. From the results can be seen that information’s sig-nificance often varies between respondents and information that other finds to be insignificant, the other finds very significant. However, also common pat-terns can be found from the results. For example, pricing related information (product price and shipping costs) were either slightly significant or very signif-icant to over 82 percent of the respondents. Product availability was also highly important to most of the respondent, and its significance received the highest mean of all evaluated information. Product pictures (88,1 percent) and product reviews (84,8 percent) were also found to be either slightly or very important to most of the respondents.
The results also suggest that some product information is found to be in-significant by major part of e-commerce customers. For example, package size
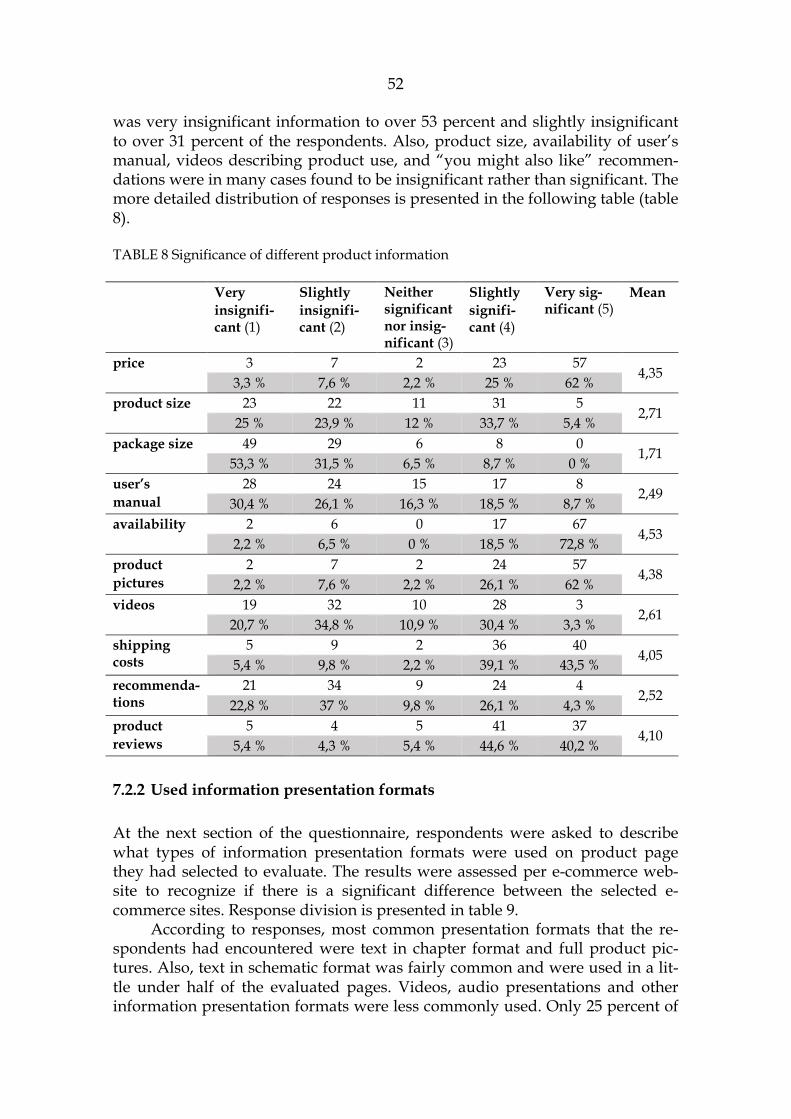
52
was very insignificant information to over 53 percent and slightly insignificant to over 31 percent of the respondents. Also, product size, availability of user’s manual, videos describing product use, and “you might also like” recommen-dations were in many cases found to be insignificant rather than significant. The more detailed distribution of responses is presented in the following table (table 8).
TABLE 8 Significance of different product information
Very insignifi-cant (1)
Slightly insignifi-cant (2)
Neither significant nor insig-nificant (3)
Slightly signifi-cant (4)
Very sig-nificant (5)
Mean
price 3 7 2 23 57 4,35
3,3 % 7,6 % 2,2 % 25 % 62 % product size 23 22 11 31 5
2,71 25 % 23,9 % 12 % 33,7 % 5,4 %
package size 49 29 6 8 0 1,71
53,3 % 31,5 % 6,5 % 8,7 % 0 % user’s manual
28 24 15 17 8 2,49
30,4 % 26,1 % 16,3 % 18,5 % 8,7 % availability 2 6 0 17 67
4,53 2,2 % 6,5 % 0 % 18,5 % 72,8 %
product pictures
2 7 2 24 57 4,38
2,2 % 7,6 % 2,2 % 26,1 % 62 % videos 19 32 10 28 3
2,61 20,7 % 34,8 % 10,9 % 30,4 % 3,3 %
shipping costs
5 9 2 36 40 4,05
5,4 % 9,8 % 2,2 % 39,1 % 43,5 % recommenda-tions
21 34 9 24 4 2,52
22,8 % 37 % 9,8 % 26,1 % 4,3 % product reviews
5 4 5 41 37 4,10
5,4 % 4,3 % 5,4 % 44,6 % 40,2 %
7.2.2 Used information presentation formats
At the next section of the questionnaire, respondents were asked to describe what types of information presentation formats were used on product page they had selected to evaluate. The results were assessed per e-commerce web-site to recognize if there is a significant difference between the selected e-commerce sites. Response division is presented in table 9.
According to responses, most common presentation formats that the re-spondents had encountered were text in chapter format and full product pic-tures. Also, text in schematic format was fairly common and were used in a lit-tle under half of the evaluated pages. Videos, audio presentations and other information presentation formats were less commonly used. Only 25 percent of
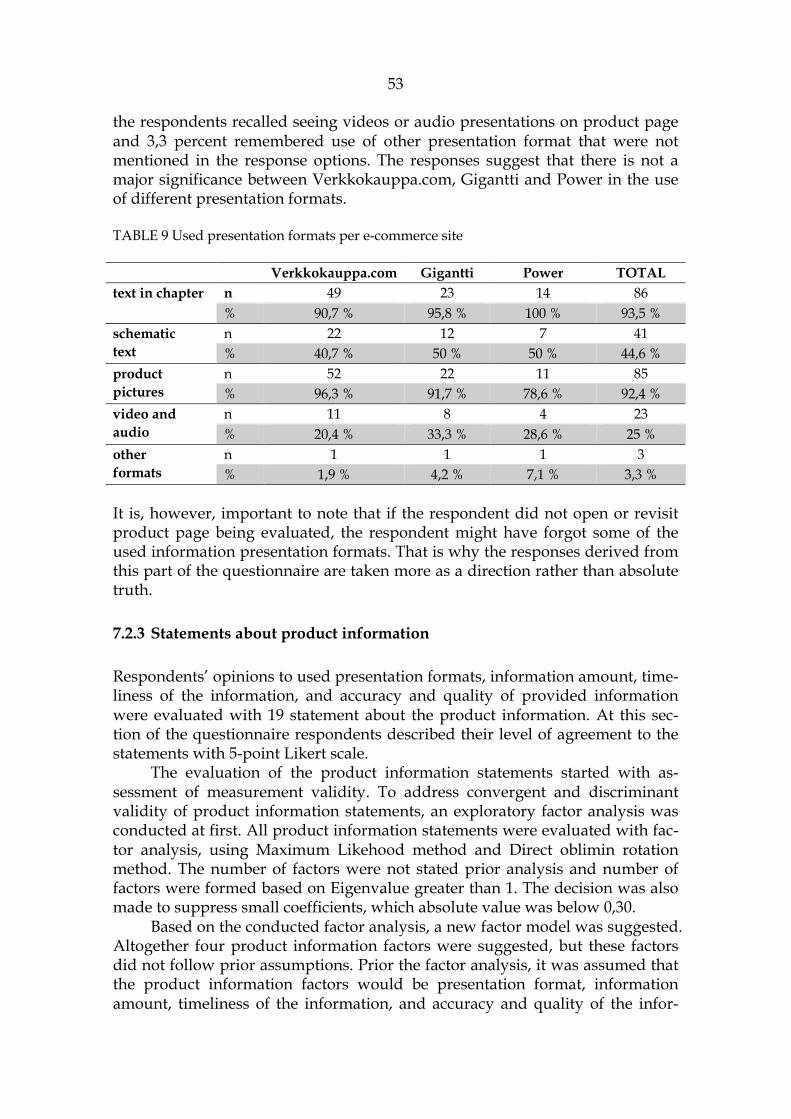
53
the respondents recalled seeing videos or audio presentations on product page and 3,3 percent remembered use of other presentation format that were not mentioned in the response options. The responses suggest that there is not a major significance between Verkkokauppa.com, Gigantti and Power in the use of different presentation formats.
TABLE 9 Used presentation formats per e-commerce site
Verkkokauppa.com Gigantti Power TOTAL text in chapter n 49 23 14 86
% 90,7 % 95,8 % 100 % 93,5 % schematic text
n 22 12 7 41 % 40,7 % 50 % 50 % 44,6 %
product pictures
n 52 22 11 85 % 96,3 % 91,7 % 78,6 % 92,4 %
video and audio
n 11 8 4 23 % 20,4 % 33,3 % 28,6 % 25 %
other formats
n 1 1 1 3 % 1,9 % 4,2 % 7,1 % 3,3 %
It is, however, important to note that if the respondent did not open or revisit product page being evaluated, the respondent might have forgot some of the used information presentation formats. That is why the responses derived from this part of the questionnaire are taken more as a direction rather than absolute truth.
7.2.3 Statements about product information
Respondents’ opinions to used presentation formats, information amount, time-liness of the information, and accuracy and quality of provided information were evaluated with 19 statement about the product information. At this sec-tion of the questionnaire respondents described their level of agreement to the statements with 5-point Likert scale.
The evaluation of the product information statements started with as-sessment of measurement validity. To address convergent and discriminant validity of product information statements, an exploratory factor analysis was conducted at first. All product information statements were evaluated with fac-tor analysis, using Maximum Likehood method and Direct oblimin rotation method. The number of factors were not stated prior analysis and number of factors were formed based on Eigenvalue greater than 1. The decision was also made to suppress small coefficients, which absolute value was below 0,30.
Based on the conducted factor analysis, a new factor model was suggested. Altogether four product information factors were suggested, but these factors did not follow prior assumptions. Prior the factor analysis, it was assumed that the product information factors would be presentation format, information amount, timeliness of the information, and accuracy and quality of the infor-
54
mation. The new factors, however, were formed from different set of product information statements and only statements related to information timeliness loaded all to same factor. In fact, based on this factor analysis, four new product information themes were recognized; information timeliness and reliability (ITR), information sufficiency (IS), information’s level of detail (ILD), and prod-uct evaluation (PE). The first factor, information’s timeliness and reliability, was built on statements that handled how up to date the information was and how reliable and selective the information was to make a purchase decision. The second factor was named to information sufficiency, since the statements linked to this factor varied from information’s adequacy, sufficiency and completeness, to information presentation format’s appropriateness. The third factor, infor-mation’s level of detail, was built on statements assessing how detailed, com-prehensive and accurate the information was and were there a large number of product attributes featured. The last factor was then built on statements that described how helpful the information was to evaluate and understand the product and were there comparative information between products, and that is why this factor was named as product evaluation. According to the conducted factor analysis, these four factors are able to explain 62 % of variables’ variance.
The reliability of this new factor model was next evaluated to estimate how well the questions assigned to same category succeed to measure the same factor. The reliability of each new factor was evaluated with Cronbach’s alpha. From the reliability analysis was checked, if it was suggested that factor’s Cronbach’s alpha value would increase significantly if one item was deleted or if correlation between variables was noticeably low. In this case, procedure would have been repeated without that item until the Cronbach’s alpha value of the factor was acceptable. (Heikkilä, 2014a.) However, there was no need to remove any of the items at this stage. The four new factors along with their con-structs and Cronbach’s alpha values are presented in following table (table 10).

55
TABLE 10 Product information factors presented in rotated factor analysis
Factor 1 – ITR Factor 2 – IS Factor 3 – ILD Factor 4 – PE Cronbach’s alpha 0,856 0,889 0,884 0,604 PF3 0,375 IT1 0,419 IT2 0,733 IT3 0,873 AQ3 0,454 AQ4 0,404 PF1 0,563 IA1 0,855 IA2 0,817 IA6 0,611 AQ1 0,786 AQ6 0,453 IA3 0,506 IA4 0,760 IA5 0,785 AQ2 0,592 PF2 0,363 PF4 0,395 AQ5 0,490
According to Heikkilä (2014b, 179), value of Cronbach’s alpha is between [0,1] and the higher the value is, the higher the reliability is. It is recommended that alpha values should be over 0,7, even though there is no unambiguous limit (Heikkilä, 2014b, 179). In the context of this study, information timeliness and reliability (ITR), information sufficiency (IS) and information’s level of detail (ILD) received alpha values over 0,85, which suggests that the grouped ques-tions are closely related. Statements grouped to product evaluation (PE) re-ceived Cronbach value 0,604 that is slightly under the recommendation, but this set of items was still accepted to further analyzation of the data. After grouping of the items, an average variable was formed of each set of items. Average vari-ables of each set of statements were then used to assess and explain correlations between different research settings.
To further evaluate responses on product information statements and user experience, the data was split into three different datasets in SPSS program based on the chosen e-commerce site. The average variables formed at earlier phase were evaluated per e-commerce site to address possible differences be-tween websites. According to the responses, the respondents were almost equally satisfied with information timeliness and reliability (ITR), information sufficiency (IS), and information’s level of detail (ILD). The factor of product evaluation (PE) received the smallest mean values in each website when com-pared to other product information factors. However, the information’s help-
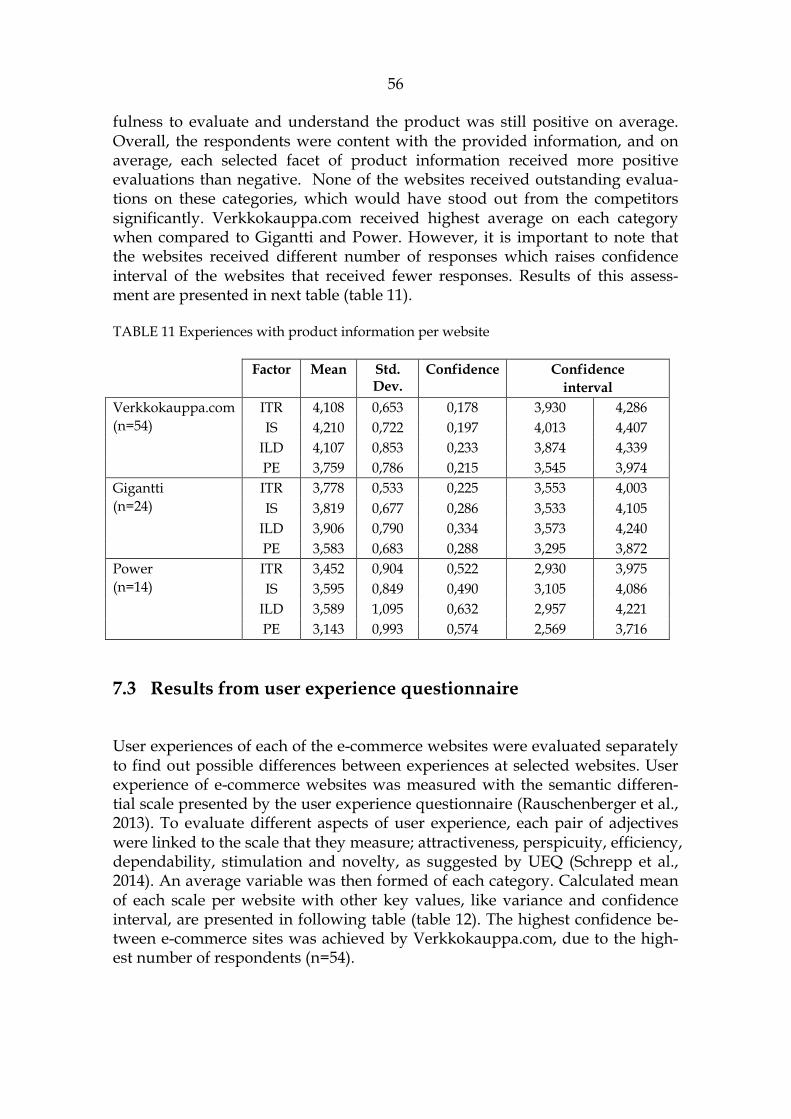
56
fulness to evaluate and understand the product was still positive on average. Overall, the respondents were content with the provided information, and on average, each selected facet of product information received more positive evaluations than negative. None of the websites received outstanding evalua-tions on these categories, which would have stood out from the competitors significantly. Verkkokauppa.com received highest average on each category when compared to Gigantti and Power. However, it is important to note that the websites received different number of responses which raises confidence interval of the websites that received fewer responses. Results of this assess-ment are presented in next table (table 11).
TABLE 11 Experiences with product information per website
Factor Mean Std. Dev.
Confidence Confidence interval
Verkkokauppa.com (n=54)
ITR 4,108 0,653 0,178 3,930 4,286 IS 4,210 0,722 0,197 4,013 4,407
ILD 4,107 0,853 0,233 3,874 4,339 PE 3,759 0,786 0,215 3,545 3,974
Gigantti (n=24)
ITR 3,778 0,533 0,225 3,553 4,003 IS 3,819 0,677 0,286 3,533 4,105
ILD 3,906 0,790 0,334 3,573 4,240 PE 3,583 0,683 0,288 3,295 3,872
Power (n=14)
ITR 3,452 0,904 0,522 2,930 3,975 IS 3,595 0,849 0,490 3,105 4,086
ILD 3,589 1,095 0,632 2,957 4,221 PE 3,143 0,993 0,574 2,569 3,716
7.3 Results from user experience questionnaire
User experiences of each of the e-commerce websites were evaluated separately to find out possible differences between experiences at selected websites. User experience of e-commerce websites was measured with the semantic differen-tial scale presented by the user experience questionnaire (Rauschenberger et al., 2013). To evaluate different aspects of user experience, each pair of adjectives were linked to the scale that they measure; attractiveness, perspicuity, efficiency, dependability, stimulation and novelty, as suggested by UEQ (Schrepp et al., 2014). An average variable was then formed of each category. Calculated mean of each scale per website with other key values, like variance and confidence interval, are presented in following table (table 12). The highest confidence be-tween e-commerce sites was achieved by Verkkokauppa.com, due to the high-est number of respondents (n=54).

57
TABLE 12 User experience constructs per website
Mean Std. Dev Variance Confidence Confidence interval Verkkokauppa.com attractiveness 1,417 0,767 0,59 0,204 1,212 1,621 perspicuity 1,449 0,958 0,92 0,256 1,193 1,705 efficiency 1,435 0,931 0,87 0,249 1,187 1,684 dependability 1,519 0,725 0,53 0,193 1,325 1,712 stimulation 1,162 0,870 0,76 0,232 0,930 1,394 novelty 0,042 1,077 1,16 0,287 -0,246 0,329 Gigantti attractiveness 0,903 0,804 0,65 0,322 0,581 1,225 perspicuity 0,990 1,062 1,13 0,425 0,565 1,414 efficiency 1,063 0,998 1,00 0,399 0,663 1,462 dependability 1,135 0,737 0,54 0,295 0,841 1,430 stimulation 0,771 0,630 0,40 0,252 0,519 1,023 novelty -0,208 0,783 0,61 0,313 -0,521 0,105 Power attractiveness 0,952 0,690 0,48 0,361 0,591 1,314 perspicuity 0,750 1,144 1,31 0,599 0,151 1,349 efficiency 0,679 0,922 0,85 0,483 0,196 1,162 dependability 1,071 0,823 0,68 0,431 0,640 1,502 stimulation 0,875 0,939 0,88 0,492 0,383 1,367 novelty -0,304 0,761 0,58 0,398 -0,702 0,095 * Confidence intervals (p=0.05) per scale
According to the UEQ benchmark, that allows comparing the results of one product or service to a large set of other products like business applications, development tools, web shops and mobile applications (Schrepp et al., 2017a), all evaluated websites placed near on average. When compared with the benchmark, Verkkokauppa.com received above average scores in attractiveness, perspicuity, efficiency and stimulation. Dependability in Verkkokauppa.com was better than 75 percent of the benchmark, which makes it evaluated as good. However, the site’s novelty placed in the range of the 25 percent worst results. Also, Gigantti and Power’s novelty placed on the same ‘bad’ sector. Gigantti’s results with attractiveness, perspicuity, dependability and stimulation placed on below average scale of the benchmark, and only its efficiency received above average mean. Of the three websites, Power received the worst scores. Its attrac-tiveness, perspicuity, efficiency, dependability and stimulation were below av-erage, but to keep in mind, Power also had the least amount of responses which might be reflected in the results. It is also important to note, that there is only one benchmark data set to all types of products and services, which makes the proper comparison of scale measurement rather difficult (Schrepp et al., 2017a).
To assess if there are significant differences between the websites’ user ex-periences, two sample T-Test with 0,5 Alpha level was used. No significant dif-ference was found between Gigantti and Power regarding any of the six scales. Comparison of Verkkokauppa.com and Gigantti, however, suggest that these
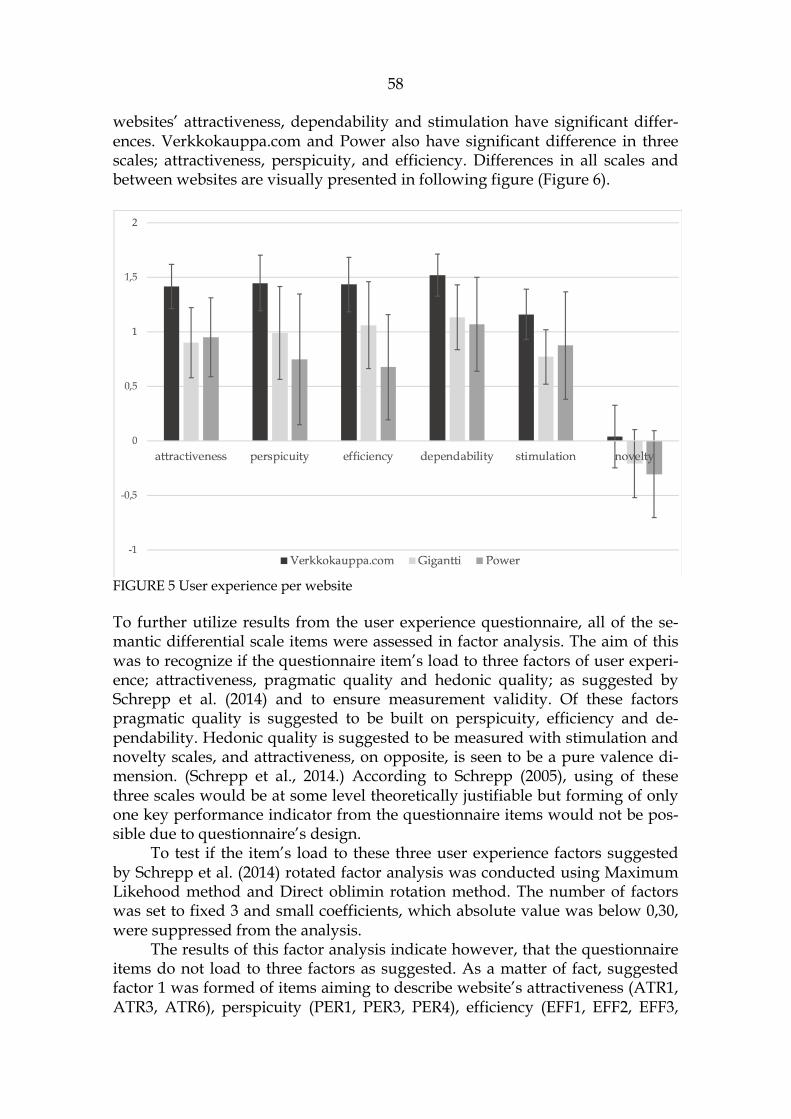
58
websites’ attractiveness, dependability and stimulation have significant differ-ences. Verkkokauppa.com and Power also have significant difference in three scales; attractiveness, perspicuity, and efficiency. Differences in all scales and between websites are visually presented in following figure (Figure 6).
FIGURE 5 User experience per website
To further utilize results from the user experience questionnaire, all of the se-mantic differential scale items were assessed in factor analysis. The aim of this was to recognize if the questionnaire item’s load to three factors of user experi-ence; attractiveness, pragmatic quality and hedonic quality; as suggested by Schrepp et al. (2014) and to ensure measurement validity. Of these factors pragmatic quality is suggested to be built on perspicuity, efficiency and de-pendability. Hedonic quality is suggested to be measured with stimulation and novelty scales, and attractiveness, on opposite, is seen to be a pure valence di-mension. (Schrepp et al., 2014.) According to Schrepp (2005), using of these three scales would be at some level theoretically justifiable but forming of only one key performance indicator from the questionnaire items would not be pos-sible due to questionnaire’s design.
To test if the item’s load to these three user experience factors suggested by Schrepp et al. (2014) rotated factor analysis was conducted using Maximum Likehood method and Direct oblimin rotation method. The number of factors was set to fixed 3 and small coefficients, which absolute value was below 0,30, were suppressed from the analysis.
The results of this factor analysis indicate however, that the questionnaire items do not load to three factors as suggested. As a matter of fact, suggested factor 1 was formed of items aiming to describe website’s attractiveness (ATR1, ATR3, ATR6), perspicuity (PER1, PER3, PER4), efficiency (EFF1, EFF2, EFF3,
59
EFF4), and dependability (DEP4). The second factor was formed of attractive-ness (ATR5), dependability (DEP2), stimulation (STI2, STI3, STI4), and novelty (NOV1, NOV2, NOV3, NOV4) scales. The third suggested factor was formed of items describing attractiveness (ATR2), perspicuity (PER2), dependability (DEP3) and stimulation (STI1), and all of these items loaded negatively in this factor. This factor analysis formed of three factors, was able to explain 51% of variables’ variance. So, according to this factor analysis, it would not be mean-ingful to use the suggested three factors in further evaluation of research ques-tions in this study.
To see if the 26 items of UEQ load better to two factors instead, similar fac-tor analysis was conducted again but the number of factors was set to fixed 2. This factor analysis, in fact, followed better the model of the user experience questionnaire, since major of the items belonging to attractiveness and pragmat-ic quality loaded to the first factor and most of the suggested hedonic quality items loaded to the second factor. The questionnaire item’s ATR4 (unpleasant – pleasant) and DEP1 (unpredictable –predictable), however loaded similarly to both of the factors, so factor analysis was conducted again without these two items. Some items also loaded to different factor than assumed, and in fact, ATR5 (attractive – unattractive) and DEP2 (obstructive – supportive) items loaded to the second factor containing hedonic quality factors and STI1 (valua-ble – inferior) loaded to the first factor. But following the UEQ’s model, the first factor was named as Attractiveness and pragmatic quality and the second factor was named as Hedonic quality. According to this last factor analysis, these two factors are able to explain 46 % of variables’ variance.
The reliability of this new two factor model was next evaluated with Cronbach’s alpha to estimate how well the items assigned to these two factors succeed to measure the same factor. According to this analysis factor 1, attrac-tiveness and pragmatic quality, received alpha value 0,925 and factor 2 received value 0,85, which suggest high reliability. Since high reliability of both new fac-tors were suggested, average variable was formed of each set of items to further analysis. The two new user experience factors along with their items and Cronbach’s alpha values are presented in following table (table 13).
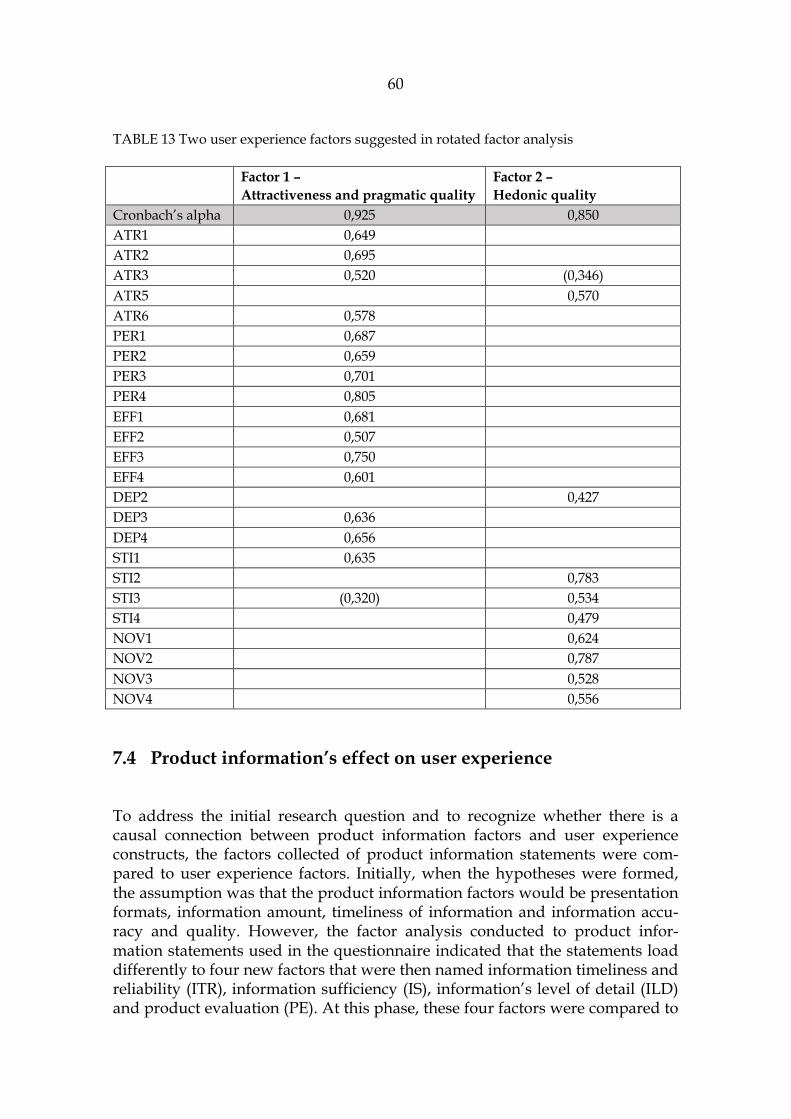
60
TABLE 13 Two user experience factors suggested in rotated factor analysis
Factor 1 – Attractiveness and pragmatic quality
Factor 2 – Hedonic quality
Cronbach’s alpha 0,925 0,850 ATR1 0,649 ATR2 0,695 ATR3 0,520 (0,346) ATR5 0,570 ATR6 0,578 PER1 0,687 PER2 0,659 PER3 0,701 PER4 0,805 EFF1 0,681 EFF2 0,507 EFF3 0,750 EFF4 0,601 DEP2 0,427 DEP3 0,636 DEP4 0,656 STI1 0,635 STI2 0,783 STI3 (0,320) 0,534 STI4 0,479 NOV1 0,624 NOV2 0,787 NOV3 0,528 NOV4 0,556
7.4 Product information’s effect on user experience
To address the initial research question and to recognize whether there is a causal connection between product information factors and user experience constructs, the factors collected of product information statements were com-pared to user experience factors. Initially, when the hypotheses were formed, the assumption was that the product information factors would be presentation formats, information amount, timeliness of information and information accu-racy and quality. However, the factor analysis conducted to product infor-mation statements used in the questionnaire indicated that the statements load differently to four new factors that were then named information timeliness and reliability (ITR), information sufficiency (IS), information’s level of detail (ILD) and product evaluation (PE). At this phase, these four factors were compared to

61
website’s attractiveness and pragmatic quality, and hedonic quality to check if there is any correlation between selected items. Results of the correlation analy-sis are presented in following table (table 14), where the research model is com-pleted with Pearson’s correlation coefficients and their p-values.
TABLE 14 Correlation between research items
UX variable Information variable Correlation Sig. (p)
Attractiveness and pragmatic quality
ITR 0,351*** 0,000 IS 0,421*** 0,000 ILD 0,258** 0,007 PE 0,397*** 0,000
Hedonic quality
ITR 0,208* 0,023 IS 0,259** 0,006 ILD 0,110 0,149 PE 0,376*** 0,000
N= 92 (* p < 0.05, ** p < 0.01, *** p < 0.001)
These results suggest that there, in fact, exists a correlation between some of the product information attributes and facets of user experience. The impact’s sig-nificance was next analyzed with regression analyses. Each factor of user expe-rience was handled separately with all product information attributes. In fact, two separate linear regression analyses were conducted to the two user experi-ence factors; attractiveness and pragmatic quality, and hedonic quality. In these analyses, respondents’ age and gender were entered as control variables, while the four factors of product information were entered as explanatory variables.
The first linear regression analysis, where website’s attractiveness and pragmatic quality was entered as dependent variable, received adjusted R Square value 0,176 from which can be derived that the model’s coefficient of determination is nearly 18 % of the sample. Durbin-Watson value of 2,010 sug-gests that there is no autocorrelation in the sample. According to ANOVA model’s f-value is 4,243 and p-value is 0,001, this model is seen as statistically significant. The regression analysis indicated that out of all control and explana-tory variables only information sufficiency (IS) and product evaluation (PE) has a statistically significant impact to website’s attractiveness and pragmatic quali-ty. In this model, information sufficiency received beta coefficient value of 0,349 (p < 0.05) and product evaluation’s beta coefficient value was 0,268 (p < 0.05). Results of the first regression analysis are presented in following table (table 15).
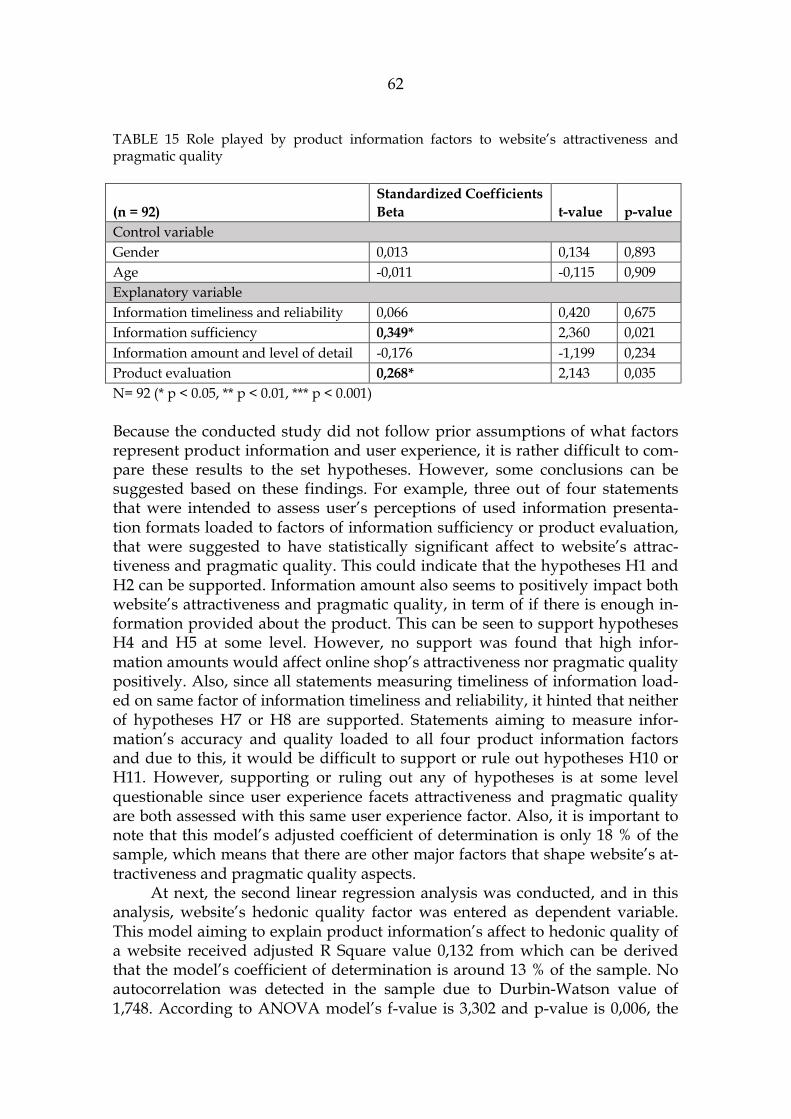
62
TABLE 15 Role played by product information factors to website’s attractiveness and pragmatic quality
(n = 92) Standardized Coefficients Beta t-value p-value
Control variable Gender 0,013 0,134 0,893 Age -0,011 -0,115 0,909 Explanatory variable Information timeliness and reliability 0,066 0,420 0,675 Information sufficiency 0,349* 2,360 0,021 Information amount and level of detail -0,176 -1,199 0,234 Product evaluation 0,268* 2,143 0,035 N= 92 (* p < 0.05, ** p < 0.01, *** p < 0.001)
Because the conducted study did not follow prior assumptions of what factors represent product information and user experience, it is rather difficult to com-pare these results to the set hypotheses. However, some conclusions can be suggested based on these findings. For example, three out of four statements that were intended to assess user’s perceptions of used information presenta-tion formats loaded to factors of information sufficiency or product evaluation, that were suggested to have statistically significant affect to website’s attrac-tiveness and pragmatic quality. This could indicate that the hypotheses H1 and H2 can be supported. Information amount also seems to positively impact both website’s attractiveness and pragmatic quality, in term of if there is enough in-formation provided about the product. This can be seen to support hypotheses H4 and H5 at some level. However, no support was found that high infor-mation amounts would affect online shop’s attractiveness nor pragmatic quality positively. Also, since all statements measuring timeliness of information load-ed on same factor of information timeliness and reliability, it hinted that neither of hypotheses H7 or H8 are supported. Statements aiming to measure infor-mation’s accuracy and quality loaded to all four product information factors and due to this, it would be difficult to support or rule out hypotheses H10 or H11. However, supporting or ruling out any of hypotheses is at some level questionable since user experience facets attractiveness and pragmatic quality are both assessed with this same user experience factor. Also, it is important to note that this model’s adjusted coefficient of determination is only 18 % of the sample, which means that there are other major factors that shape website’s at-tractiveness and pragmatic quality aspects.
At next, the second linear regression analysis was conducted, and in this analysis, website’s hedonic quality factor was entered as dependent variable. This model aiming to explain product information’s affect to hedonic quality of a website received adjusted R Square value 0,132 from which can be derived that the model’s coefficient of determination is around 13 % of the sample. No autocorrelation was detected in the sample due to Durbin-Watson value of 1,748. According to ANOVA model’s f-value is 3,302 and p-value is 0,006, the
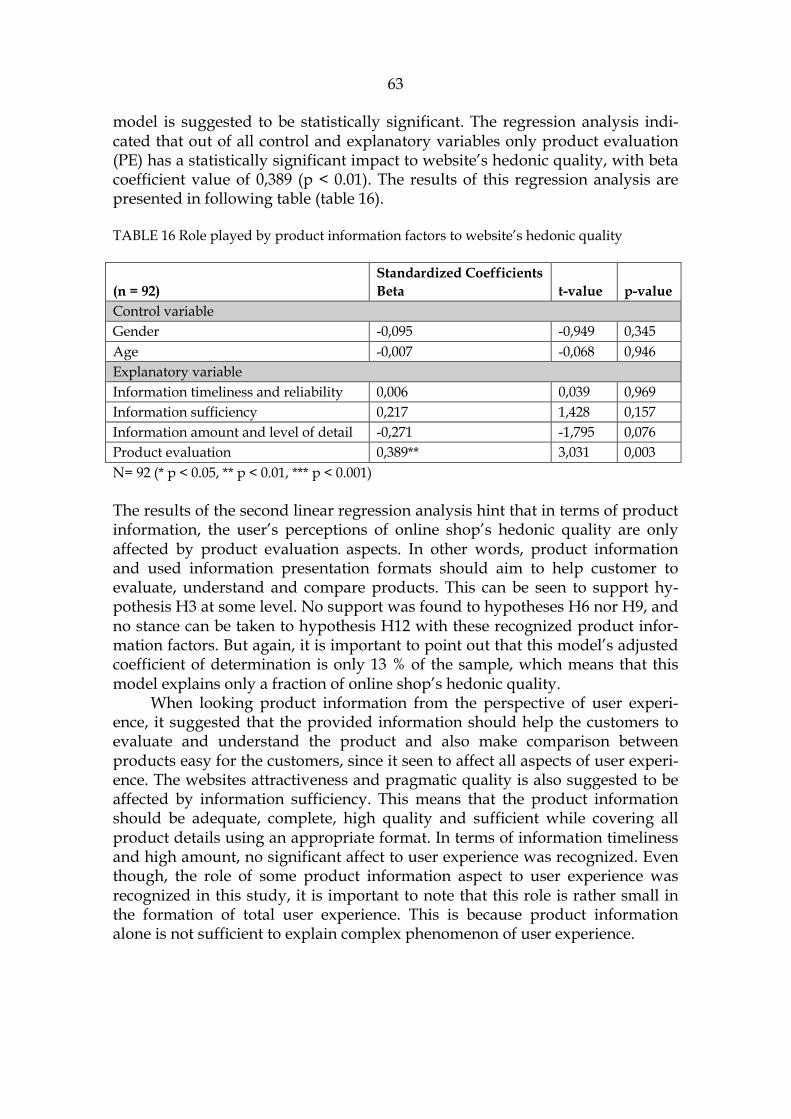
63
model is suggested to be statistically significant. The regression analysis indi-cated that out of all control and explanatory variables only product evaluation (PE) has a statistically significant impact to website’s hedonic quality, with beta coefficient value of 0,389 (p < 0.01). The results of this regression analysis are presented in following table (table 16).
TABLE 16 Role played by product information factors to website’s hedonic quality
(n = 92) Standardized Coefficients Beta t-value p-value
Control variable Gender -0,095 -0,949 0,345 Age -0,007 -0,068 0,946 Explanatory variable Information timeliness and reliability 0,006 0,039 0,969 Information sufficiency 0,217 1,428 0,157 Information amount and level of detail -0,271 -1,795 0,076 Product evaluation 0,389** 3,031 0,003 N= 92 (* p < 0.05, ** p < 0.01, *** p < 0.001)
The results of the second linear regression analysis hint that in terms of product information, the user’s perceptions of online shop’s hedonic quality are only affected by product evaluation aspects. In other words, product information and used information presentation formats should aim to help customer to evaluate, understand and compare products. This can be seen to support hy-pothesis H3 at some level. No support was found to hypotheses H6 nor H9, and no stance can be taken to hypothesis H12 with these recognized product infor-mation factors. But again, it is important to point out that this model’s adjusted coefficient of determination is only 13 % of the sample, which means that this model explains only a fraction of online shop’s hedonic quality.
When looking product information from the perspective of user experi-ence, it suggested that the provided information should help the customers to evaluate and understand the product and also make comparison between products easy for the customers, since it seen to affect all aspects of user experi-ence. The websites attractiveness and pragmatic quality is also suggested to be affected by information sufficiency. This means that the product information should be adequate, complete, high quality and sufficient while covering all product details using an appropriate format. In terms of information timeliness and high amount, no significant affect to user experience was recognized. Even though, the role of some product information aspect to user experience was recognized in this study, it is important to note that this role is rather small in the formation of total user experience. This is because product information alone is not sufficient to explain complex phenomenon of user experience.
64
8 DISCUSSION AND CONCLUSION
This chapter will conclude the thesis. Results from the conducted empirical study will be first analyzed and discussed and compared with prior literature. Secondly, reliability and validity of the conducted research will be discussed. After this, limitations of the study will be discussed, and further lanes of re-search are suggested. This chapter and the thesis will be ended with conclusion and summary of the thesis.
8.1 Discussion
It has been speculated that e-commerce’s role in markets will continue to grow in future. It is estimated that e-commerce will still keep growing steadily (Kim et al., 2008). To stand out from the growing competition, online shops should form a clear e-commerce strategy and focus on improving the user experience, especially when positive user experience is seen to enhance customer’s loyalty (Kujala et al., 2011) and negative user experience can lead to user’s decision to stop using the online shop temporarily or even permanently (Garrett, 2010). Improvement practices aiming to evolve user experience can, in best cases, lead to continuous brand differentiation and competitive advantage of the online store (Rose et al., 2012).
This thesis was conducted to have a better insight to e-commerce product information and how it affects the overall user experience of an online shop. E-commerce websites selling electronics online were selected as a subject of the research. The conducted empirical study offered a good insight to consumers’ perceptions on product information presented on e-commerce website and the main findings of the study will be discussed in this section.
As an answer to the question: “Which product information are the most signif-icant to the user?” some of the earlier studies have proposed different set of in-formation that should be included on a website. For example, Fang and Sal-vendy (2003) have pointed out that at least product information should include product’s quantity in storage, product related charges, similar other products,

65
full product pictures, size information and descriptions that are accurate, con-sistent and detailed. Prior literature also suggested that, concerning product information, good e-commerce websites have three common attributes: detailed and accurate descriptions, pictures of full product and easy comparison of dif-ferent products (Fang & Salvendy, 2003). The findings of the study mainly sup-port these findings of prior research. According to the conducted study, when looking for information about electronic products online, the respondents found the pricing related information (product price and shipping costs), avail-ability of product, full product pictures, and product reviews being the most important to them. However, product package size, product size, availability of user’s manual, videos describing product use, and “you might also like” rec-ommendations were in many cases found to be rather insignificant to the con-sumers.
In the context of this thesis, it was recognized that product information can be presented with textual information, visual and multimedia presentations, and virtual product experiences. Of these three formats textual information is the most commonly used and it can be presented either with paragraph or schematic form (Blanco et al., 2010). Textual format is typically used to describe product’s search attributes, like product weight, size and warranty policies (Jiang & Benbasat, 2007). Visual and multimedia presentations, on the other hand are often used in a high information load conditions, since they can gen-erate new information cues for customers (Li et al., 2016) and they are seen as richer information than plain text (Fang & Salvendy, 2003). Of these three, the least common information presentation format is virtual product experiences. Sparse use of virtual product experience is often explained by its price, since using of the format can be rather costly to the e-commerce provider (Dimonka et al., 2012; Jiang & Benbasat, 2007). However, prior literature suggests, that using of virtual product experiences can in many cases result in stronger pur-chase intention and reduced perceived risk (Kim & Forsythe, 2010). Supporting prior literature, both textual, and visual and multimedia presentations were used mainly in evaluated product pages. No significant difference was found in the use of presentation formats between selected online shops.
To answer supportive research question “How different aspects of product in-formation affect user experience?” and to better understand concept of product information, initially, the aim was to assess product information from four dif-ferent viewpoints; information presentation formats, timeliness of information, information amount and information accuracy and quality. The aim was then to compare these four aspects to three suggested constructs of user experience; attractiveness, pragmatic quality and hedonic quality, to address if there is any causal connection between the selected items. However, conducted factor anal-yses indicated another factor structure to both product information and user experience in the context of this study. Due to this, ultimately product infor-mation was looked from four different viewpoints; information timeliness and reliability, information sufficiency, information’s level of detail and product evaluation. These four aspects were then compared to two recognized con-structs of user experience; attractiveness and pragmatic quality, and hedonic quality.

66
When respondents’ perceptions on used presentation formats were com-pared to different constructs of user experience, it was suggested that using of well-suited presentation formats that help customers to evaluate, understand and compare products affect all aspects of user experience, supporting hypoth-eses H1, H2 and H3. In other words, information presentation effects all web-site’s attractiveness, pragmatic quality and hedonic quality. This can be seen to support Dimonka’s et al. (2012) online vendors advise that online retailers should exploit the different formats to showcase product description.
Prior literature has also suggested that information amount affects con-sumer’s attitudes towards a website. It has been advised that amount of prod-uct information should be maximized (Keeney, 1999) since the number of at-tributes per-product might positively predict satisfaction (Ballantine, 2005). It has also been suggested that if the consumer feels that there are too little or missing product information, they might assume that the information is inten-tionally withheld from them and that missing information would be negative (Dimoka et al., 2012). However, information beyond certain point might lead to feelings of sensory or information overload, which can negatively affect the lev-el of satisfaction (Ballantine, 2005). Results of this study indicate that in fact, product information that is perceived to be sufficient, complete and high quali-ty supports online shop’s attractiveness and pragmatic quality, which would support hypotheses H4 and H5 at some level. Yet on contrary to prior theories, no statistically significant effect was found between high information amounts and user experience. Also, no support was found to hypothesis H6, since no significant effect between information amount and hedonic quality of online shop was experienced.
According to prior research, timeliness of the information is another im-portant factor of product information. Referring to how up to date the infor-mation is, information timeliness has been recognized as an antecedent of user satisfaction in prior studies (Lin, 2007; Zviran et al., 2006). However, compari-son of respondents’ perceptions on timeliness of information to aspects of user experience in this study imply that neither factors of user experience are signifi-cantly affected by the information timeliness. That is why no support was found to hypotheses H7, H8 nor H9.
The fourth and final aspect of product information selected to this study was the accuracy and quality of information. Even though there are also other drivers to accuracy and quality, it was suggested by prior studies that it is built on previously mentioned aspects of information, like information timeliness, accuracy, usefulness and completeness (Lin, 2007). According to Xu et al. (2013), quality of information has been seen to have an impact, for example, to per-ceived service quality and it has been stated that high online service quality is almost impossible to obtain without a high level of information quality. In this study, statements aiming to measure information’s accuracy and quality loaded to all four product information factors and due to this, it is difficult to support or rule out any hypotheses (H10, H11 or H12) related to information accuracy and quality. Yet, the statement assessing user’s perception on information’s lev-el of quality was linked to product information factor of information sufficiency, which effect to website’s attractiveness and pragmatic quality was recognized.

67
This can be seen to insinuate that information quality might have some level of affect to user experience.
Of the four factors of product information, product evaluation played the most significant role in formation of user experience. This highlights the prod-uct information’s main function to help customers to evaluate, understand and compare products. However, the effect of product evaluation to overall user experience appears not to be great. Also, information sufficiency was seen to impact user experience through website’s attractiveness and pragmatic quality. In fact, product information that is perceived to be adequate, complete, high quality, and which is presented with appropriate presentation formats, is seen to affect website’s attractiveness and pragmatic quality most when compared to other researched product information factors. Yet, the effect is still minor in formation of total user experience. In this research, no significant affect was found between user experience factors and information timeliness and reliabil-ity, and information amount and level of detail.
So, to answer the initial research question “How provided product infor-mation affects the user experience formation in e-commerce website?”, product infor-mation’s role in user experience and user satisfaction formation is recognized to be important. Especially the role of product information ability to help custom-ers to evaluate, understand and compare products is highlighted. Also, product information that is perceived to be adequate, complete, high quality, and which is presented with appropriate presentation formats, is seen to support website’s attractiveness and pragmatic quality along with product evaluation aspects. From the practical point of view, the study suggests that e-commerce vendors should pay attention to product information they provide. Providing enough descriptive information without overwhelming consumers is a significant job of the vendor. Rich, complete and informative product information help to ease customer’s uncertainty towards product and its attributes (Dimoka et al., 2012).
To conclude, the aim of this thesis was not to try to explain user experi-ence formation only with product information aspects. In fact, it is important to keep in mind that website’s user experience cannot be only explained with dif-ferent aspects of product information. Instead, the aim of this study was to un-derstand if the product information plays a role in user experience formation in e-commerce environment and in case it does, what aspects play the most signif-icant role in it. The results of conducted study suggest that some researched aspects of product information impact the formation of user experience on an online shop, but magnitude of the effect is rather small. This finding supports Szymanski and Hise’s (2000) research where was found that superior product information can impact satisfaction to a statically significant degree, but it was argued that the practical significance of superior product information's effect to satisfaction is not great. These findings can be explained by complex nature of the user experience. As prior literature has suggested, in online shops user ex-perience evolves during time and it is affected by user’s attitudes, prior experi-ences and expectations that rise before, during and after the actual shopping experience (Petre et al., 2006; Roto et al., 2011). Attributes on a product page represent only a fragment of big picture, from which the user experience is built on.

68
8.2 Research reliability and validity
To ensure that the findings of this study’s would be applicable to practice, reli-ability and validity of the research were considered in various phases of the thesis process. Research reliability refers to how well the measurements can be replicated and how well the research gives not random results (Hirsjärvi et al., 2004; Vilkka, 2007). In the context of this study, reliability was assessed with statistical methods. For example, when forming mean variables for each prod-uct information attribute, the Cronbach alpha values were calculated to ensure that they were either over or close acceptable limit. Also, the results and key figures derived from regression analysis were carefully weighed before draw-ing any conclusions.
Research validity, on other hand, refers to how well the selected instru-ments measure thing that they are supposed to measure (Hirsjärvi et al, 2004; Vilkka, 2007). To ensure that the conducted research would give valid results, the planning of initial research questions and questionnaire was done carefully. Prior studies done in similar topics were utilized in order to find instruments that have been suggested to operate well in measuring the intended things. Al-so, the user experience questionnaire was selected to this study as user experi-ence measurement method instead of creating a completely new tool, because it is a well-documented and tested tool that helps to ensure better validity to the study. Even though prior studies and models were utilized to build the empiri-cal section of this thesis, selected items’ convergent and discriminant validity was evaluated with exploratory factor analyses using Maximum Likehood method and Direct oblimin rotation method. These analyses indicated different type of factor structure to both user experience and product information. This might be a hint that there are still some shortcomings in theories. However, these differences between theories and the results of this thesis might also be explained by small sample size of the empirical study.
All though, several steps were taken to ensure research reliability and va-lidity, small size of the conducted empirical study might overshadow reliability of the research. There were altogether 92 accepted responses in the data analysis phase, while it has been advised to collect at least 100 responses in cases where data will be analyzed with statistical program (Vilkka, 2007).
8.3 Limitations and future research
As in every study, there are some limitations to consider when evaluating the results and findings of this study. The recognized limitations of the study are discussed in this subchapter in more detail. In addition, further lanes of re-search are suggested at the end if this section.
Perhaps the biggest limitations of the empirical study lie in the size of the obtained material. For example, Vilkka (2007) has suggested that there should be at least 100 observation units, when the data is analyzed with statistical pro-

69
gram. The number of observation units in this study was 92, which was little under the suggested limit. Also, the number of responses per website was une-qual, which can make the comparison of the websites rather difficult. For ex-ample, Power received 14 responses, which represents only little over 25 per-cent of Verkkokauppa.com’s responses. Vilkka (2007) suggested that when the aim is to compare results between different groups, at least 30 observation units should be obtained per group. Only Verkkokauppa.com received responses over this limit, so the comparison between selected e-commerce sites was done with cautious.
Another limitation of the conducted empirical study can also lie in the de-cision to use 5-point Likert scales, where the respondents were forced to select from few choices. Using of bigger scale, i.e. giving respondents more choices, might have helped to showcase respondent’s experiences more precisely. (Sauro & Dumas, 2009.)
It is also important to note that the study was carried out in Finland and there were only Finnish e-commerce websites as subject of evaluation, which makes the results be applicable only in this geographical location. In addition to this, the aim of the study was to understand product information’s significance in e-commerce websites that are selling electronic to consumers. Because there might be differences between different product groups, i.e. clothing, furniture and books, the results of this study are only applicable to electronics selling websites.
Counterbalancing the limitations of the conducted study, the study suc-ceeded to gather responses from various groups of subjects. The responses were obtained from several different age groups as the youngest respondent was 16 years old and the oldest was 60 years old. Also, the gender distribution of the respondents was even, and each e-commerce website’s experience was evaluat-ed by nearly equal amount of female and male respondents.
To better understand the product information’s effect on user experience, more research should be carried out in the future. For example, the results of this study should be questioned or confirmed by more extensive research done with higher number of respondents. Future research could also address possi-ble national differences, by taking an international approach to the study. An-other possible lane of research could also be to investigate if different product groups require different type of product information to help the formation of positive user experience. Regardless, more research about the topic of product information in e-commerce environment are encouraged to be carried out to guide e-commerce providers to allocate their resources on information that is the most significant to their consumers.
8.4 Conclusion
The aim of this thesis was to understand different aspects of product infor-mation in online environment and how these affect the formation of user expe-rience in e-commerce website. Especially, the interest was in online vendors
70
that sell electronic products to consumers (B2C) on their website. The study was conducted in Finland and the three most popular electronics selling online shops were selected as subjects of this study.
To address the set research questions, a literature review and an empirical research was conducted. At first literature review was conducted to understand important concepts and to gather information on prior research done on the topic. Based on the literature review, the empirical part of study was planned. The empirical section of this study was carried out as quantitative research and a survey approach was taken. The data was collected with online questionnaire that was available for all. This questionnaire was completed by 93 respondents, of which one response was rejected before the collected data was analyzed. The data was then analyzed with statistical program.
The findings of this research mainly support earlier research done on the topic. Consumers tend to give prominence to pricing related information, product availability, full product pictures, and product reviews when they are browsing electronic products on online shops. The role of product’s package size, actual product size, availability of user’s manual, videos describing prod-uct use and “you might also like” recommendations availability appeared to be less significant to the consumers.
In the context of this study, product information was at first looked from four aspects; information presentation formats, timeliness of the information, information amount, and information accuracy and quality. The aim was then to contrast these aspects to user experience constructs; attractiveness, pragmatic quality and hedonic quality, used in the user experience questionnaire. Howev-er, conducted factor analyses indicated different factor structure to both prod-uct information and user experience in the study. Attributable to this, product information was ultimately looked from four different viewpoints; information timeliness and reliability, information sufficiency, information’s level of detail and product evaluation. These four new aspects were then compared to two recognized constructs of user experience; attractiveness and pragmatic quality, and hedonic quality.
This comparison of product information aspects and facets of user experi-ence indicated that product information has an effect to how attractive the web-site is seen and how its pragmatic and hedonic quality is perceived. Particularly, product information’s ability to help customers to evaluate, understand and compare products is emphasized, due to its impact to all researched aspects of user experience. Also, adequate, complete, and high-quality product infor-mation, which is presented using appropriate presentation formats, is seen to support website’s attractiveness and pragmatic quality along with product evaluation aspects. Altogether, the findings suggest that product information plays an important role in the formation of overall user experience of a website. However, the effect of individual product information attribute such as product evaluation, plays only a minor role in development of total user experience in e-commerce website, since its effect does not appear to be great. This is because product information alone is not sufficient to explain complex phenomenon of user experience. Yet, if online shop’s aim is to maximize their user experience, significance of product information cannot be underestimated.
71
REFERENCES
Ballantine, P. W. (2005). Effects of interactivity and product information on consumer satisfaction in an online retail setting. International Journal of Retail & Distribution Management, 33(6), 461-471.
Battarbee, K. & Koskinen, I. (2005). Co-experience: user experience as interaction. CoDesign, 1(1), 5-18.
Bigne-Alcaniz, E., Ruiz-Mafé, C., Aldás-Manzano, J. & Sanz-Blas, S. (2008). Influence of online shopping information dependency and innovativeness on internet shopping adoption. Online Information Review, 32(5), 648-667.
Bilgihan, A., Okumus, F., Nusair, K. & Bujisic, M. (2014). Online experiences: flow theory, measuring online customer experience in e-commerce and managerial implications for the lodging industry. Information Technology & Tourism, 14(1), 49-71.
Blanco, C. F., Sarasa, R. G., & Sanclemente, C. O. (2010). Effects of visual and textual information in online product presentations: looking for the best combination in website design. European Journal of Information Systems, 19(6), 668-686.
Bonastre, L., & Granollers, T. (2014). A set of heuristics for user experience evaluation in e-commerce websites. In 7th International Conference on Advances in Computer-Human Interactions (27-34). IARIA.
Cao, M., Zhang, Q. & Seydel, J. (2005). B2C e-commerce web site quality: an empirical examination. Industrial Management & Data Systems, 105(5), 645-661.
Chiu, C. M., Wang, E. T., Fang, Y. H. & Huang, H. Y. (2014). Understanding customers' repeat purchase intentions in B2C e-commerce: the roles of utilitarian value, hedonic value and perceived risk. Information Systems Journal, 24(1), 85-114.
Chou, Y. C., Chuang, H. H. C. & Shao, B. B. (2016). The impact of e-retail characteristics on initiating mobile retail services: A modular innovation perspective. Information & Management, 53(4), 481-492.
Cui, G., Lui, H. K. & Guo, X. (2012). The effect of online consumer reviews on new product sales. International Journal of Electronic Commerce, 17(1), 39-58.
Cyr, D. (2008). Modeling web site design across cultures: relationships to trust, satisfaction, and e-loyalty. Journal of Management Information Systems, 24(4), 47-72.

72
DeLone, W. H. & McLean, E. R. (2004). Measuring e-commerce success: Applying the DeLone & McLean information systems success model. International Journal of Electronic Commerce, 9(1), 31-47.
Devaraj, S., Fan, M. & Kohli, R. (2002). Antecedents of B2C channel satisfaction and preference: validating e-commerce metrics. Information systems research, 13(3), 316-333.
Dimoka, A., Hong, Y. & Pavlou, P. A. (2012). On product uncertainty in online markets: Theory and evidence. Management Information Systems Quarterly, 36(2), 395-426.
Duch-Brown, N., Grzybowski, L., Romahn, A. & Verboven, F. (2017). The impact of online sales on consumers and firms: Evidence from consumer electronics. International Journal of Industrial Organization, 52, 30-62.
Fang, X. & Salvendy, G. (2003). Customer-centered rules for design of e- commerce web sites. Communications of the ACM, 46(12), 332-336.
Farrell, S. (2016). Nielsen Norman Group website: Open-ended vs. closed-ended questions in user research. Retrieved (March 23, 2020) from https://www.nngroup.com/articles/open-ended-questions.
Flavián, C., Guinalíu, M. & Gurrea, R. (2006). The role played by perceived usability, satisfaction and consumer trust on website loyalty. Information & Management, 43(1), 1-14.
Garrett, J. J. (2010). Elements of user experience, the: user-centered design for the web and beyond. The United States of America: Pearson Education.
Ganguly, B., Dash, S. B., Cyr, D. & Head, M. (2010). The effects of website design on purchase intention in online shopping: the mediating role of trust and the moderating role of culture. International Journal of Electronic Business, 8(4-5), 302-330.
Guan, H. L. & Cheng, B. D. (2009). Analysis on the consumer's online information search behavior. In 2009 International Conference on E-Business and Information System Security (1-4). IEEE.
Hassenzahl, M. (2003). The thing and I: understanding the relationship between user and product. In M. A. Blythe, K. Overbeeke, A. F. Monk & P. C. Wright (Eds.), Funology : From Usability to Enjoyment (31-42). Dordrecht: Kluwer Academic Publishers.
Hassenzahl, M., Diefenbach, S. & Göritz, A. (2010). Needs, affect, and interactive products–Facets of user experience. Interacting with computers, 22(5), 353-362.
73
Hassenzahl, M. & Tractinsky, N. (2006). User experience – a research agenda. Behaviour & information technology, 25(2), 91-97.
Heikkilä, T. (2014a). Tilastollinen tutkimus website: Reliabiliteettikerroin Cronbachin alpha. Retrieved (April 3, 2020) from http://www.tilastollinentutkimus.fi/5.SPSS/Reliabiliteetti.pdf
Heikkilä, T. (2014b). Tilastollinen tutkimus. (9th edition). Helsinki: Edita.
Hinderks, A., Schrepp, M., Mayo, F. J. D., Escalona, M. J. & Thomaschewski, J. (2019). Developing a UX KPI based on the user experience questionnaire. Computer Standards & Interfaces, 65, 38-44.
Hirsjärvi, S., Remes, P. & Sajavaara, P. (2004). Tutki ja kirjoita. (10th edition). Helsinki: Tammi.
Hoehle, H. & Venkatesh, V. (2015). Mobile application usability: Conceptualization and instrument development. Management Information Systems Quarterly, 39(2), 435-472.
International Organization for Standardization. (1998). Ergonomic requirements for office work with visual display terminals (VDTs) - part 11: Guidance on usability (ISO/DIS Standerd No. 9241). Geneva, Switzerland: International Organization for Standardization (ISO).
International Organization for Standardization (2010). Ergonomics of human system interaction - part 210: Human-centred design for interactive systems (ISO/DIS Standerd No. 9241). Geneva, Switzerland: International Organization for Standardization (ISO).
Jiang, Z. & Benbasat, I. (2007). The effects of presentation formats and task complexity on online consumers' product understanding. Management Information Systems Quarterly, 31(3), 475-500.
Keeney, R. L. (1999). The value of Internet commerce to the customer. Management science, 45(4), 533-542.
Kim, E. B. & Eom, S. B. (2002). Designing effective cyber store user interface. Industrial Management & Data Systems, 102(5), 241-251.
Kim, D. J. Ferrin, D. L. & Rao, H. R. (2008). A trust-based consumer decision-making model in electronic commerce: The role of trust, perceived risk, and their antecedents. Decision support systems, 44(2), 544-564.
Kim, J. & Forsythe, S. (2010). Factors affecting adoption of product virtualization technology for online consumer electronics shopping. International Journal of Retail & Distribution Management, 38(3), 190-204.

74
Konradt, U., Wandke, H., Balazs, B. & Christophersen, T. (2003). Usability in online shops: scale construction, validation and the influence on the buyers’ intention and decision. Behaviour & Information Technology, 22(3), 165-174.
Kujala, S., Roto, V., Väänänen-Vainio-Mattila, K., Karapanos, E. & Sinnelä, A. (2011). UX Curve: A method for evaluating long-term user experience. Interacting with Computers, 23(5), 473-483.
Laugwitz, B., Held, T. & Schrepp, M. (2008). Construction and evaluation of a user experience questionnaire. In Symposium of the Austrian HCI and Usability Engineering Group (63-76). Springer, Berlin, Heidelberg.
Law, E. L. C., Roto, V., Hassenzahl, M., Vermeeren, A. P. & Kort, J. (2009). Understanding, scoping and defining user experience: a survey approach. In Proceedings of the SIGCHI conference on human factors in computing systems (CHI ’09) (719-728). Association for Computing Machinery, New York, NY, USA.
Law, E. L. C., van Schaik, P. & Roto, V. (2014). Attitudes towards user experience (UX) measurement. International Journal of Human-Computer Studies, 72(6), 526-541.
Lee, S. & Koubek, R. J. (2010a). The effects of usability and web design attributes on user preference for e-commerce web sites. Computers in Industry, 61(4), 329-341.
Lee, S. & Koubek, R. J. (2010b). Understanding user preferences based on usability and aesthetics before and after actual use. Interacting with Computers, 22(6), 530-543.
Li, M., Wei, K. K., Tayi, G. K. & Tan, C. H. (2016). The moderating role of information load on online product presentation. Information & Management, 53(4), 467-480.
Lightner, N. J. & Eastman, C. M. (2002). User preference for product information in remote purchase environments. Journal of Electronic Commerce Research, 3(3), 174-186.
Limayem, M., Khalifa, M. & Frini, A. (2000). What makes consumers buy from Internet? A longitudinal study of online shopping. IEEE Transactions on Systems, Man, and Cybernetics-Part A: Systems and Humans, 30(4), 421- 432.
Lin, H. F. (2007). The impact of website quality dimensions on customer satisfaction in the B2C e-commerce context. Total Quality Management and Business Excellence, 18(4), 363-378.
Lindgaard, G. & Dudek, C. (2003). What is this evasive beast we call user satisfaction?. Interacting with computers, 15(3), 429-452.
75
Luo, J., Ba, S. & Zhang, H. (2012). The effectiveness of online shopping characteristics and well-designed websites on satisfaction. Management Information Systems Quarterly, 36(4), 1131-1144.
Manvi, S. S. & Venkataram, P. (2005). An intelligent product-information presentation in E-commerce. Electronic Commerce Research and Applications, 4(3), 220-239.
Mudambi, S. M. & Schuff, D. (2010). What makes a helpful review? A study of customer reviews on Amazon. com. Management Information Systems Quarterly, 34(1), 185-200.
Neuman, W. L. (2011). Social research methods: Qualitative and quantitative approaches (7th edition). Boston (Mass.): Allyn & Bacon/Pearson.
Palmer, J. W. (2002). Web site usability, design, and performance metrics. Information systems research, 13(2), 151-167.
Park, E. J., Kim, E. Y., Funches, V. M. & Foxx, W. (2012). Apparel product attributes, web browsing, and e-impulse buying on shopping websites. Journal of Business Research, 65(11), 1583-1589.
Pavlou, P. A & Fygenson, M. (2006). Understanding and predicting electronic commerce adoption: An extension of the theory of planned behavior. Management Information Systems Quarterly, 30(1), 115-143.
Petre, M., Minocha, S. & Roberts, D. (2006). Usability beyond the website: an empirically-grounded e-commerce evaluation instrument for the total customer experience. Behaviour & Information Technology, 25(2), 189-203.
Ponto, J. (2015). Understanding and evaluating survey research. Journal of the advanced practitioner in oncology, 6(2), 168-171.
Rauschenberger, M., Schrepp, M., Pérez Cota, M., Olschner, S. & Thomaschewski, J. (2013). Efficient measurement of the user experience of interactive products. How to use the user experience questionnaire (UEQ). Example: Spanish language version. International Journal of Artificial Intelligence and Interactive Multimedia, 2(1), 39-45.
Rose, S., Clark, M., Samouel, P. & Hair, N. (2012). Online customer experience in e-retailing: an empirical model of antecedents and outcomes. Journal of Retailing, 88(2), 308-322.
Rose, S., Hair, N. & Clark, M. (2011). Online customer experience: A review of the business-to-consumer online purchase context. International Journal of Management Reviews, 13(1), 24-39.
Roto, V., Law, E., Vermeeren, A. P. O. S. & Hoonhout, J. (2011). User Experience White Paper: Bringing clarity to the concept of user experience. Result

76
from Dagstuhl Seminar on Demarcating User Experience. September 15-18, 2010.
Saari, T., Ravaja, N., Laarni, J., Turpeinen, M. & Kallinen, K. (2004). Psychologically targeted persuasive advertising and product information in e-commerce. In Proceedings of the 6th international conference on Electronic commerce (245-254).
Sauro, J. & Dumas, J. S. (2009). Comparison of three one-question, post-task usability questionnaires. In Proceedings of the SIGCHI conference on human factors in computing systems (1599-1608). Association for Computing Machinery, New York, NY, USA.
Schafer, J. B., Konstan, J. A. & Riedl, J. (2001). E-commerce recommendation applications. Data mining and knowledge discovery, 5(1-2), 115-153.
Schrepp, M. (2015). User experience questionnaire handbook. All you need to know to apply the UEQ successfully in your project. Retrieved (February 10, 2020) from https://www.ueq-online.org
Schrepp, M., Hinderks, A. & Thomaschewski, J. (2014). Applying the user experience questionnaire (UEQ) in different evaluation scenarios. In International Conference of Design, User Experience, and Usability (383-392). Springer, Cham.
Schrepp, M., Hinderks, A. & Thomaschewski, J. (2017a). Construction of a Benchmark for the User Experience Questionnaire (UEQ). International Journal of Interactive Multimedia & Artificial Intelligence, 4(4), 40-44.
Schrepp, M., Hinderks, A. & Thomaschewski, J. (2017b). Design and Evaluation of a Short Version of the User Experience Questionnaire (UEQ-S). International Journal of Interactive Multimedia & Artificial Intelligence, 4(6), 103-108.
Srinivasan, S. S., Anderson, R. & Ponnavolu, K. (2002). Customer loyalty in e-commerce: an exploration of its antecedents and consequences. Journal of retailing, 78(1), 41-50.
Szymanski, D. M. & Hise, R. T. (2000). E-satisfaction: an initial examination. Journal of retailing, 76(3), 309-322.
Tammilehto, P. (2019, March 15). Markkinointi&Mainonta website: Verkkokauppa.com on nettomyynniltään Suomen suurin verkkokauppa. Retrieved (March 19, 2020) from https://www.marmai.fi/uutiset/verkkokauppacom-on-nettomyynniltaan-suomen-suurin-verkkokauppa/25e3c6f8-9390-3574-9902-9fec1062dafb

77
Tarasewich, P., Nickerson, R. C. & Warkentin, M. (2002). Issues in mobile e-commerce. Communications of the association for information systems, 8(1), 41-64.
Torkzadeh, G. & Dhillon, G. (2002). Measuring factors that influence the success of Internet commerce. Information Systems Research, 13(2), 187- 204.
Tractinsky, N., Katz, A. S. & Ikar, D. (2000). What is beautiful is usable. Interacting with computers, 13(2), 127-145.
Verhagen, T., Vonkeman, C. & van Dolen, W. (2016). Making online products more tangible: the effect of product presentation formats on product evaluations. Cyberpsychology, Behavior, and Social Networking, 19(7), 460-464.
Vilkka, H. (2007). Tutki ja mittaa: määrällisen tutkimuksen perusteet. Helsinki: Tammi.
Wang, Y. S. (2008). Assessing e-commerce systems success: a respecification and validation of the DeLone and McLean model of IS success. Information Systems Journal, 18(5), 529-557.
Wells, J. D., Valacich, J. S. & Hess, T. J. (2011). What signal are you sending? How website quality influences perceptions of product quality and purchase intentions. Management Information Systems Quarterly, 35(2), 373-396.
Won Jeong, S., Fiore, A. M., Niehm, L. S. & Lorenz, F. O. (2009). The role of experiential value in online shopping: The impacts of product presentation on consumer responses towards an apparel web site. Internet Research, 19(1), 105-124.
Xiao, B. & Benbasat, I. (2011). Product-related deception in e-commerce: a theoretical perspective. Management Information Systems Quarterly, 35(1), 169-196.
Xu, J., Benbasat, I. & Cenfetelli, R. T. (2013). Integrating service quality with system and information quality: an empirical test in the e-service context. Management Information Systems Quarterly, 37(3), 777-794.
Zhang, Y., Fang, Y., Wei, K. K., Ramsey, E., McCole, P. & Chen, H. (2011). Repurchase intention in B2C e-commerce – A relationship quality perspective. Information & Management, 48(6), 192-200.
Zviran, M., Glezer, C. & Avni, I. (2006). User satisfaction from commercial web sites: The effect of design and use. Information & management, 43(2), 157-178.
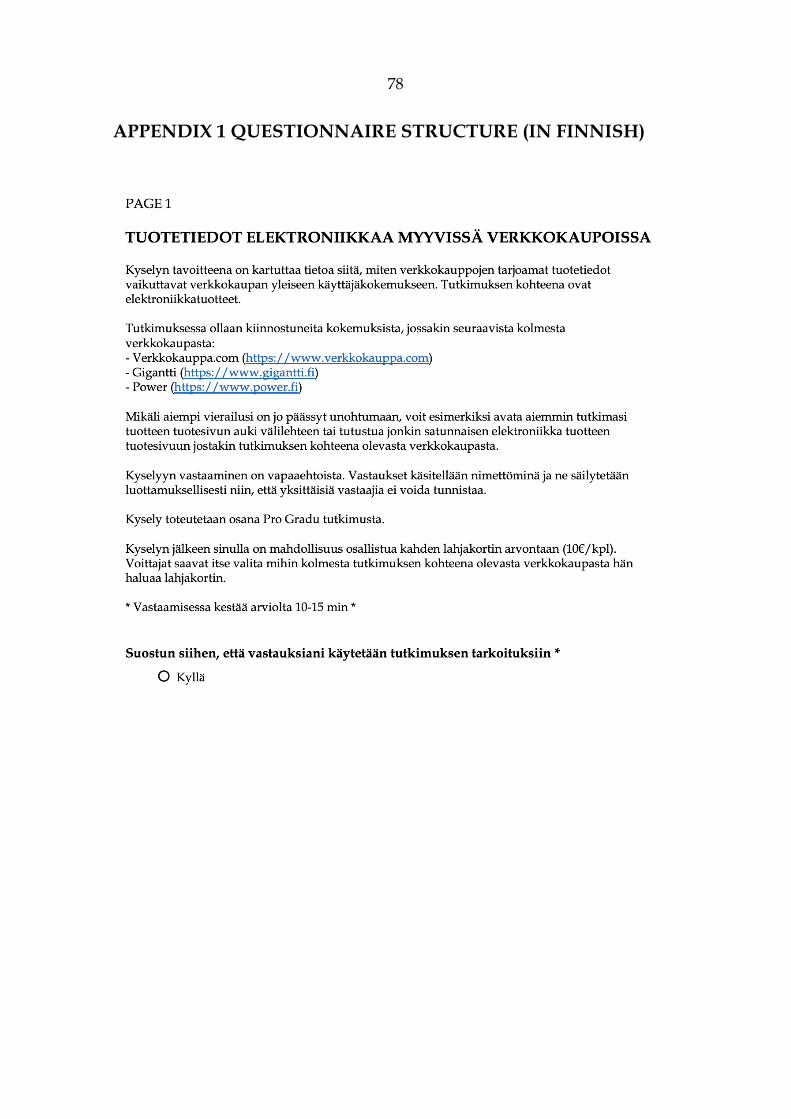
78
APPENDIX 1 QUESTIONNAIRE STRUCTURE (IN FINNISH)
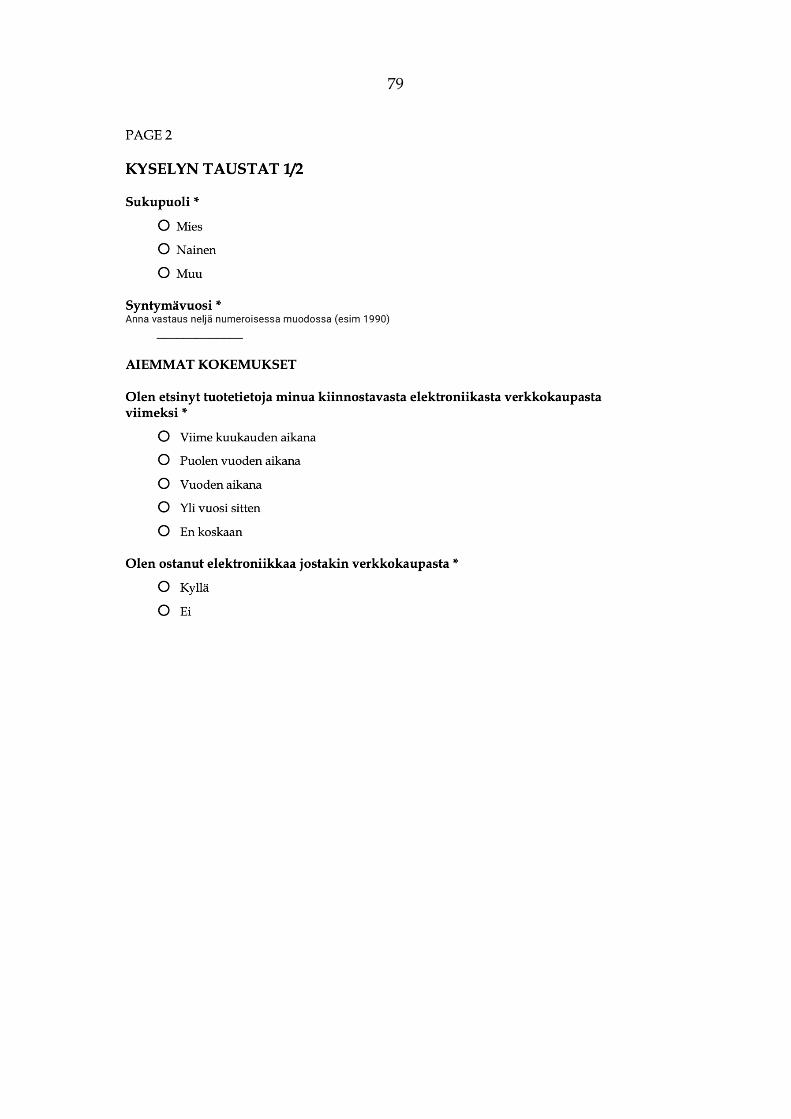
79

80
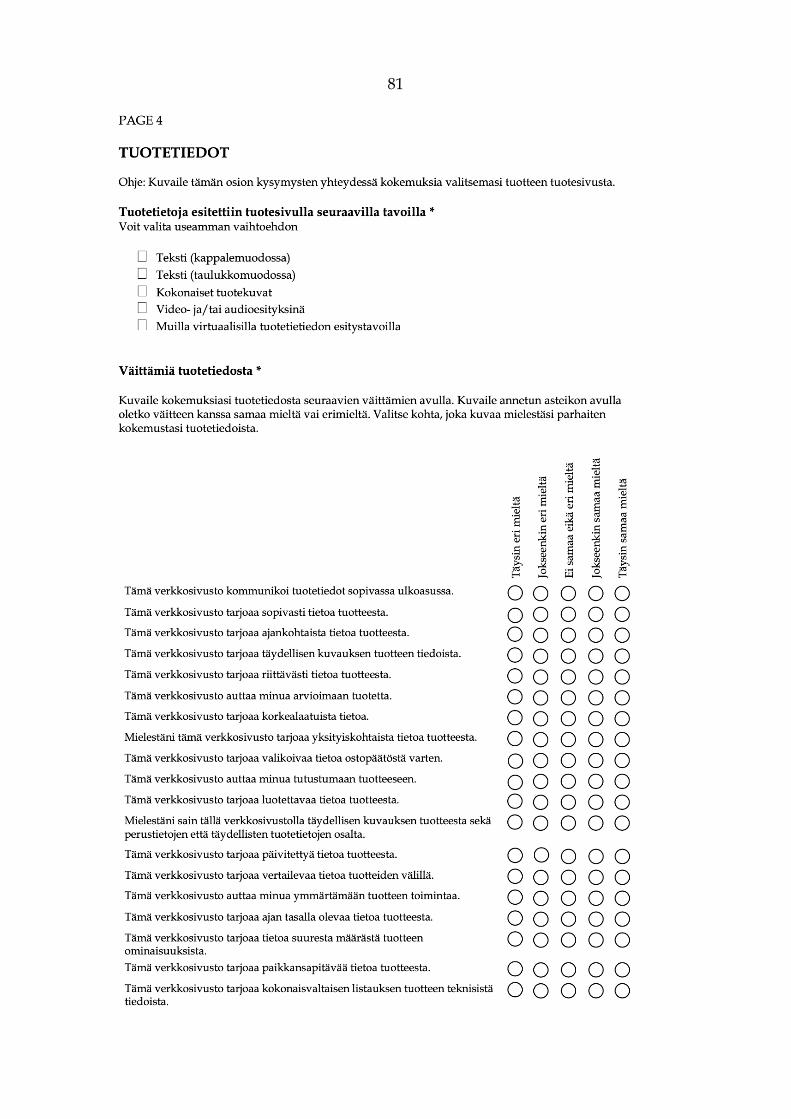
81
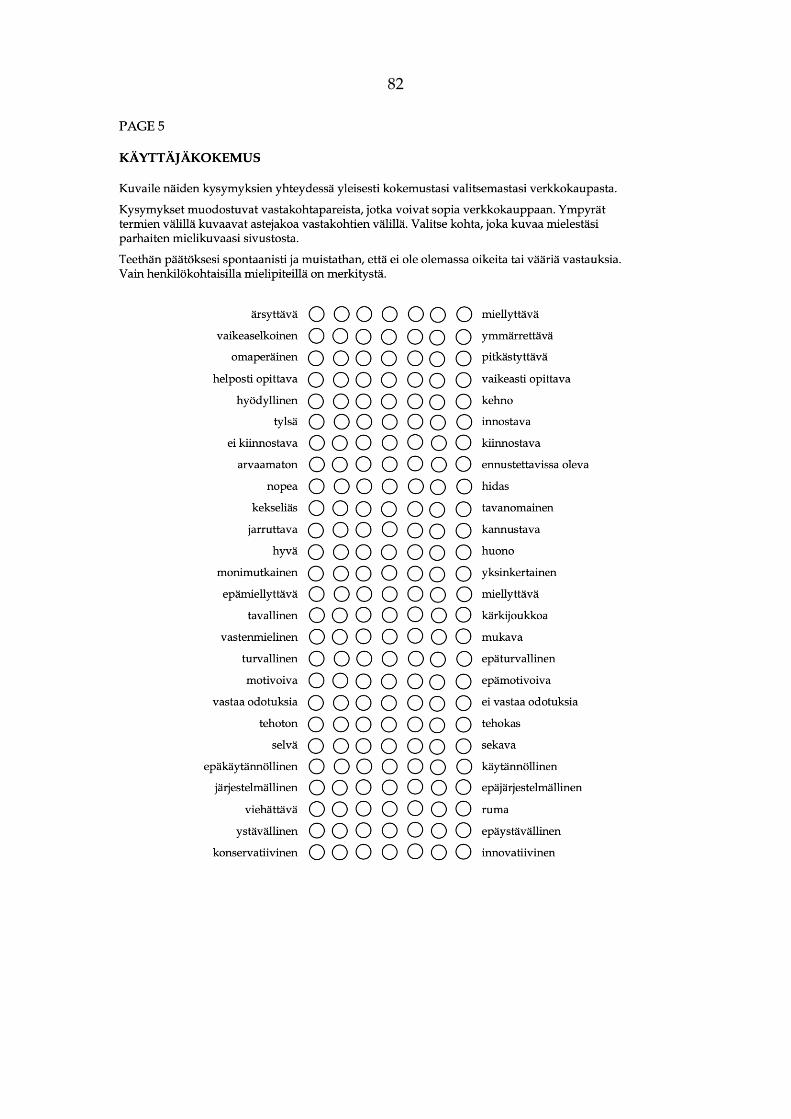
82

83
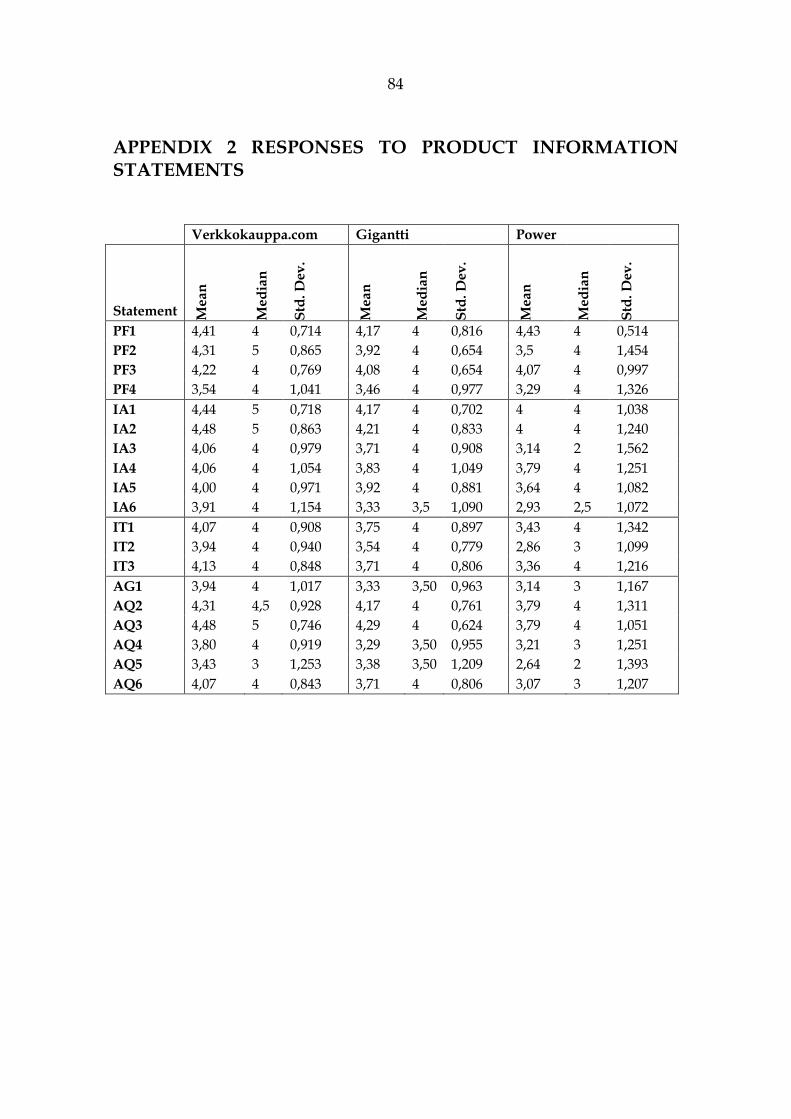
84
APPENDIX 2 RESPONSES TO PRODUCT INFORMATION STATEMENTS
Verkkokauppa.com Gigantti Power
Statement Mea
n
Med
ian
Std.
Dev
.
Mea
n
Med
ian
Std.
Dev
.
Mea
n
Med
ian
Std.
Dev
.
PF1 4,41 4 0,714 4,17 4 0,816 4,43 4 0,514 PF2 4,31 5 0,865 3,92 4 0,654 3,5 4 1,454 PF3 4,22 4 0,769 4,08 4 0,654 4,07 4 0,997 PF4 3,54 4 1,041 3,46 4 0,977 3,29 4 1,326 IA1 4,44 5 0,718 4,17 4 0,702 4 4 1,038 IA2 4,48 5 0,863 4,21 4 0,833 4 4 1,240 IA3 4,06 4 0,979 3,71 4 0,908 3,14 2 1,562 IA4 4,06 4 1,054 3,83 4 1,049 3,79 4 1,251 IA5 4,00 4 0,971 3,92 4 0,881 3,64 4 1,082 IA6 3,91 4 1,154 3,33 3,5 1,090 2,93 2,5 1,072 IT1 4,07 4 0,908 3,75 4 0,897 3,43 4 1,342 IT2 3,94 4 0,940 3,54 4 0,779 2,86 3 1,099 IT3 4,13 4 0,848 3,71 4 0,806 3,36 4 1,216 AG1 3,94 4 1,017 3,33 3,50 0,963 3,14 3 1,167 AQ2 4,31 4,5 0,928 4,17 4 0,761 3,79 4 1,311 AQ3 4,48 5 0,746 4,29 4 0,624 3,79 4 1,051 AQ4 3,80 4 0,919 3,29 3,50 0,955 3,21 3 1,251 AQ5 3,43 3 1,253 3,38 3,50 1,209 2,64 2 1,393 AQ6 4,07 4 0,843 3,71 4 0,806 3,07 3 1,207

85
APPENDIX 3 RESPONSES TO UEQ
Verkkokauppa.com Gigantti Power
Mea
n
Med
ian
Std.
Dev
.
Mea
n
Med
ian
Std .
Dev
.
Mea
n
Med
ian
Std.
Dev
.
Attractiveness ATR1 1,85 2 0,810 1,17 1 1,049 1,14 1 1,099 ATR2 1,76 2 1,098 1,13 1 1,035 1,43 2 1,158 ATR3 1,56 2 1,022 0,67 1 1,049 0,86 1 1,167 ATR4 1,39 1,5 0,998 1,08 1 0,881 1,00 1 0,961 ATR5 0,52 0,5 1,299 0,33 0,5 0,963 0,21 0 1,369 ATR6 1,43 1 0,944 1,04 1 1,122 1,07 1 0,917
Perspicuity PER1 1,72 2 1,204 1,33 1 1,090 0,71 1 1,490 PER2 1,59 2 1,339 1,13 1,5 1,329 0,79 1 1,251 PER3 0,96 1 1,273 0,50 1 1,319 0,79 1 1,369 PER4 1,52 2 1,299 1,00 1,5 1,504 0,71 1 1,383
Efficiency EFF1 1,52 2 1,145 1,04 1,5 1,160 0,79 0,5 1,369 EFF2 1,41 2 1,237 0,88 1 1,116 0,50 0,5 1,160 EFF3 1,48 2 1,177 1,38 2 1,345 0,93 1 0,917 EFF4 1,33 2 1,318 0,96 1 1,429 0,50 1 1,345
Dependability DEP1 1,20 1,5 1,323 0,83 1 1,167 1,14 1,5 1,167 DEP2 0,72 1 1,071 0,25 0 0,944 0,57 0,5 1,158 DEP3 2,15 2 1,071 1,75 2 0,897 1,21 2 1,805 DEP4 2,00 2 0,869 1,71 2 1,160 1,36 1,5 0,929
Stimulation STI1 1,94 2 1,140 1,42 2 1,213 1,57 1,5 1,342 STI2 0,56 1 1,239 0,33 0,5 1,049 0,57 1 1,342 STI3 1,15 1 1,172 0,71 1 1,042 0,43 0 1,158 STI4 1,00 1 1,166 0,63 1 0,770 0,93 1 1,072
Novelty NOV1 0,28 0 1,036 0,33 0 0,816 -0,07 0 0,917 NOV2 -0,74 -1 1,580 -1,00 -1 1,180 -1,14 -1 1,027 NOV3 0,78 1 1,574 -0,17 0 1,465 0,00 0 1,710 NOV4 -0,15 0 1,235 0,00 0 1,022 0,00 0 1,177