e-commerce in the nordics 2016 - postnord.com … · e-commerce in the nordics 2016. ... don’t...
TRANSCRIPT

E-commerce in the Nordics 2016

Foreword: Delivery—an important part of the e-commerce experience .............................................................................................................3
Overview: Nordic e-commerce summarized.............................................................................................................................................................4
Outlook: Logistics as a competitive advantage ........................................................................................................................................................6
Nordic e-commerce in 2015: E-commerce tops EUR 17 billion .............................................................................................................................9
E-commerce from abroad: One in four of online purchases are cross-border ...............................................................................................10
Digital and physical interplay: Multichannel buying processes ........................................................................................................................ 12
Deliveries: Options are more important than speed ............................................................................................................................................. 14
Returns: A convenient return process is important ................................................................................................................................................16
Interview: “No matter what you do, make sure you have a good offering as your foundation” .................................................................18
>> Spotlight on Sweden ......................................................................................................................................................................................................................20Denmark .................................................................................................................................................................................................................... 24Norway ...................................................................................................................................................................................................................... 28Finland ........................................................................................................................................................................................................................32
Detailed results ............................................................................................................................................................................................................. 36
PostNord—your e-commerce partner................................................................................................................................................................... 42
Contents
>> For the eighth year running, PostNord has conducted a study on the Nordic e-commerce market entitled E-commerce in the Nordics.
This year’s report is based on online interviews conducted by TNS Sifo during each quarter of 2015. The interviews were conducted with a nationally-representative sample of private individuals aged 18-79 years in Sweden, Denmark, Norway, and Finland, respectively. It should be noted that not all of the questions included in the report were asked during each quarter.
The survey was carried out using TNS Sifo’s online panel, with the following numbers of respondents per country and quarter:
Since the survey was conducted online, the findings are representative of the portion of the population with access to the Internet. Some questions were asked during one quarter only, and are therefore reported on a quarterly basis in tables and graphs.
E-commerce is defined in this report as the sale of physical products over the Internet (online). These products are then delivered to the consumer’s home or to a distribution point, or are picked up by the consumer at a store, warehouse, or distribution site. Accordingly, the online purchase of services (e.g., streaming services) is not included in the definition used in this report, nor are online sales between private individuals or between companies.
PostNord also publishes the E-barometer survey in Sweden, and in Denmark, we are the main sponsor of the Danish E-commerce Association’s (FDIH) E-commerce Analysis. Those reports are based on a different methodology and, therefore, are not fully comparable with this report.
*Danish E-commerce Association
About this report
Q1 Q2 Q3 Q4 Average
Sweden 1,084 1,122 1,106 1,106 1,105
Denmark 1,163 1,205 1,193 1,149 1,178
Norway 1,408 1,191 821 1,124 1,136
Finland 1,252 1,180 1,380 1,281 1,273

Nordic residents have increasingly high expectations concerning e-commerce. For example, fast, convenient deliveries have become something that most people
now take for granted. Nowadays, Nordic consumers are looking for an increasingly higher degree of precision and flexibility. They want to know when, where, and how a parcel will be delivered. They even want to be able to change the delivery address and time while the parcel is in transit. As a logistics partner, PostNord helps its customers to build competitive e-commerce offerings, not least of all by meeting parcel recipients’ changing needs.
This year, PostNord is publishing its eighth annual E-commerce in the Nordics report. We publish these reports because we are convinced that understanding consumer needs is the key to successful e-commerce. The report reveals that, although the Nordic countries have much in common, they also differ markedly in some respects, especially in connection with deliveries. In this year’s report, PostNord’s panel of experts and Anders Halvarsson (founder of NetOnNet and member of the boards of directors for Ellos, Junkyard, and Scandinavian Photo) share their tips, advice, and predictions for the future. We also reveal that, in total, Nordic consumers made online purchases worth significantly more than those reported last year. In fact, in 2015, Nordic residents made online purchases totaling more than EUR 17 billion.
PostNord is constantly developing its offering. For example, in 2015 we upgraded our mobile solutions and increased transparency to provide consumers with better information about deliveries and their mail items.
We know that delivery is an important part of the e-commerce experience and that smooth, flexible deliveries make more people want to buy online more of the time. We are the obvious choice as logistics partner for e-commerce shipments to, from, and within the Nordic region. We know the market better than anyone else. What’s more, we also have the region’s broadest distribution network and a comprehensive offering in the area of customer communication. By publishing the E-commerce in the Nordics report, we aim to share our specialized expertise and experience with you.
Håkan Ericsson President and Group CEO PostNord
Delivery—an important part of the e-commerce experience
Håkan Ericsson, Pres-ident and Group CEO of PostNord
>> Foreword
“Smooth, flexible deliveries make more people want to buy online more of the time.”

>> Overview
An average quarter in 2015...
Norwegians made the greatest number of purchases from abroad.
The Finns came in second in this category by a very narrow margin. In both countries, around half of all those who made online purchases
did so from foreign retailers.
The Danes have specific expectations concerning
deliveries.
Swedes showed the greatest interest in making online purchases from mobile
platforms. One in five made purchases using their cell
phone and just as many made purchases from tablets.
Read more on page 28 Read more on page 24 Read more on page 20
Aged 18-79 years
Refers to people who made online purchases
*
**
Sweden
NORWAY
3.0 million consumers made online purchases
81% Percentage of the
population*
369 EUR Average amount spent per person**
Sweden
SWEDEN
5.2 million consumers made online purchases
75% Percentage of the
population*
313 EUR Average amount spent per
person**
Sweden
FINLAND
2.6 million consumers made online purchases
66% Percentage of the
population*
249 EUR Average amount spent per
person**
Sweden
DENMARK
3.1 million consumers made online purchases
75% Percentage of the
population*
291 EUR Average amount spent per
person**
4

>> Overview
>> Nordic e-commerce 2015 (total Q1-Q4, EUR billions)Calculated based on the respondents in each country’s average response to the question “What total amount do you estimate that you have spent purchasing products online in the past three months?” (Base: Have made purchases online during the quarter)
6.5
3.6
4.4
2.6
The percentage of the Nordic population (aged 18-79 years) that shops online during an average quarter.
75
billion Euro—the total amount that Nordic consumers spent shopping online during 2015.17
The percentage of sales made up of online purchases from foreign retailers. 25
Nordic e-commerce summarized
5

Logistics as a competitive advantage
In PostNord’s 2015 survey, consumers responded that their primary reasons for shopping online are that they feel that the range is better than in physical stores, that goods are often cheaper, and that they can shop at a time that is convenient for them. That doesn’t mean that physical channels have had their day, however.
“Today’s consumers place the same expectations on physical and digital commerce alike. Ultimately, this means we will need to integrate these channels to a greater extent than we do currently,” explains Kristin Anfindsen, E-commerce Development Manager at PostNord Norway.
It’s a matter of being accessible in the way that consumers want. Whether or not this is achieved physically or digitally has become less important. Arne Andersson, Nordic E-commerce Specialist at PostNord, adds:
“More and more e-retailers are also establishing physical stores, often to satisfy shoppers’ demand for accessibility. In the future, the interplay between the physical and digital channels will develop and become even more sophisticated. It is a matter of getting the interface to feel the same across all channels, for example—in the physical store, on the computer, and on the cell phone.”
It is also clear that it is increasingly important that the logistics partner is able to meet the increasing demands for information and flexibility in the delivery phase. Recipients expect to receive information about where their parcel is and when it will be delivered. Moreover, recipients increasingly want to be able to change the delivery address and time while the parcel is in transit. For e-retailers, the ability to offer this kind of customized delivery now comprises a competitive advantage.
Nordic e-commerce is blossoming. The experts on PostNord’s e-commerce panel, who have tracked the current trends in the market, point to everyday commodities as one future growth area. They also agree that the channel used is becoming less and less important. The most important thing is having a flexible and accessible online store and a logistics partner who can deliver parcels in the way the customer prefers.
>> Outlook
6

There are also other delivery trends that our panel of experts predicts that we will see in the Nordic countries in the future:
“We will see more e-retailers differentiating between outright returns and exchanges. That is to say, exchanging sizes or colors might be free of charge, whereas returning an item outright might not,” says Jouni Lamberg, Vice President of Sales, Marketing & E-Commerce at PostNord Finland.
The e-commerce of tomorrow will also offer other kinds of goods, according to the panel. Purchases of daily commodities and pharmacy items are increasing, for example. E-commerce related to foodstuffs—both services offering prepacked grocery bags as well as online solutions for regular grocery shopping—is growing rapidly.
“While sales of daily commodities have grown very strongly in recent years, the category remains small. On the other hand, we’re seeing greater maturity among consumers, with more people daring to try these services, which is the key to the category’s growth. Once they’ve tried it, many people realize that it’s quite convenient not to have to carry heavy grocery bags home and that it saves time,” explains Carin Blom, E-commerce Expert at PostNord Sweden.
Some e-commerce players in other countries have successfully combined different goods categories. For example, in the UK, Sainsbury’s and Argos have joined forces to deliver both retail and daily items to consumers.
The UK is viewed by many as a leader when it comes to e-commerce and omnichannel; areas where the British are leading the trend.
“One contributing factor in the UK’s position as a strong e-commerce nation, both in the past and today, is its language. Their e-commerce was international from the start,” says Carsten Dalbo Pedersen, Head of E-commerce & Logistics at PostNord Denmark.
Consumers who make online purchases from international retailers are most often attracted by the price. In a scenario where the Nordic currencies weaken against the British pound and US dollar, consumers will gradually look to other countries and continents.
“As soon as we see the pound and the dollar increase in value, Nordic purchases from these countries decline. Price is a major factor. Nordic consumers already make some of their online purchases from countries like China, and the number doing so will grow. Both the range and lower prices attract shoppers. To put it simply, we’re curious about what’s available,” says Arne Andersson.
For those wanting to launch e-commerce enterprises in the Nordic countries, the experts have some practical advice to give:
“The old ‘Be global, act local’ cliché still applies,” says Jouni Lamberg. “Some people don’t want to use consultants or specialists because they cost money, despite the fact that they can provide the insight needed to be successful in foreign markets. It’s a mistake not to make use of local expertise,” he adds.
“Have a cross-border strategy from the outset; that is, a strategy that can be rolled out in multiple countries,” says Carsten Dalbo Pedersen. “That said, it’s also important to have a specific strategy for customer experience in each country,” he adds.
“Time is a precious commodity for today’s consumers, so it’s important to offer convenient solutions. Make an effort to simplify things, to provide relevant information and flexible payment solutions, and to give the customer the opportunity to choose when and how their goods will be delivered,” says Carin Blom.
“Provide information in the right language and various payment solutions and delivery options. In Denmark, consumers like home deliveries, and in Norway, they prefer to use the service points,” Kristin Anfindsen explains.
The experts
Arne Andersson Nordic E-commerce Specialist, PostNord, adviser and public speaker
Carsten Dalbo Pedersen Head of E-commerce & Logistics, PostNord Denmark
Kristin Anfindsen E-commerce Development Manager, PostNord Norway
Jouni Lamberg Vice President of Sales, Marketing & E-Commerce, PostNord Finland
Carin Blom E-commerce Expert, PostNord Sweden
“Time is a precious commodity for today’s consumers, so it’s important to offer convenient solutions.”
Carin Blom, E-commerce Expert, PostNord Sweden
7

>> Nordic e-commerce in 2015
8

E-commerce tops EUR 17 billion
Swedes the biggest online shoppers E-commerce in the Nordic countries continued to grow in 2015, reaching a total value of EUR 17.1 billion, up from EUR 15.4 billion in 2014. The Swedes were the region’s largest shopping group, spending EUR 6.5 billion in total. The Norwegians recorded the highest amount spent per capita, EUR 369 per quarter and person who purchased something online. The main reason why Nordic consumers buy goods online is that e-commerce allows them to shop when it suits them. Many people also consider shopping online to be cheaper than shopping in physical stores and feel that they have access to a larger and better selection. Time-savings and the convenience factor also drive online shopping.
Similar preferences in goods purchasedAcross all the Nordic countries, the most popular product categories are clothing and footwear, and media (including books, films, and video games). Home electronics is another category of products that Nordic consumers tend to buy online, as well as
health and beauty products. For Swedes, health and beauty products are the third most popular category of goods purchased, in contrast to the other Nordic countries, where home electronics is the third most popular category after clothing and footwear, and media.
>> Nordic e-commerce in 2015
Continued growth>> Nordic e-commerce 2015
(total Q1-Q4, EUR billions)Calculated based on the respondents in each country’s average response to the question “What total amount do you estimate that you have spent purchasing products online in the past three months?” (Base: Have made purchases online during the quarter)
6.5
3.6
4.4
2.6
Sweden Denmark Norway Finland
The Nordics combined17.1
0 1,000 2,000 3,000 4,000 5,000 6,000
Clothing/footwear
Media
Home electronics
Health/beauty
Sport/leisure articles
Children’s goods/toys
Car/boat/motorcycle accessories
1,475 915 940 867
Clothing/footwear and media dominate >> Number of consumers who have shopped online
in the product categories below (average Q1-Q4, in thousands)Calculated based on responses to the question “What types of goods have you bought online in the past three months?” (Base: Have made purchases online during the quarter)
Sweden Denmark Norway Finland
1,539 644 701 506
2,083 1,156 1,089 1,084
2,238 993 1,126 972
673473 522401
556372
231
184
362
186
194
204
Why do Nordic consumers shop online? >> What is the single biggest advantage of
buying goods online instead of in a traditionalstore? (Q4, %)Base: Have made purchases online during the quarter
35%
30%
20%
25%
15%
10%
0%
5%
I can shop when it suits me
Cheaper Largerand better selection
Saves time
More convenient
Sweden Denmark Norway Finland
24
31 31
2624
1920
27
17
12
16
22
12
910
8
17
87
5
9

One in four online purchases are cross-border
UK is no. 1A full 25 percent of e-commerce trading was from international sellers. The Norwegians and Swedes spent the largest total amount, while the consumers most eager to make purchases from abroad were found in Norway and Finland, where nearly half of everyone that made online purchases reported that they also have made international purchases. In Denmark, the corresponding figure is 36 percent and in Sweden, 32 percent. Nordic consumers prefer to make their cross-border purchases from the UK, followed by Germany, the US, and China. Within the Nordic region, consumers overwhelmingly made most of their cross-border purchases from Swedish retailers.
Same product categories as for domestic commerceNordic consumers purchase goods from online international retailers in the same categories as they do from domestic online retailers. Clothing and footwear, followed by home electronics and media, are the most popular categories. Broken
down by nationality, Swedes and Finns prefer to buy clothing online, whereas Norwegians and Danes prefer to purchase home electronics and media to almost the same degree.
Five countries dominate — from where Nordic consumers shop when they make online purchases from international retailers*
>> E-commerce from abroad
Norwegians lead the field >> Online purchases from abroad
(total Q1-Q4, EUR billions)Calculated based on the respondents in each country’s average response to the question “What total amount do you estimate that you have spent purchasing products online from international sites in the past three months?” (Base: Have purchased goods online from abroad during the quarter)
1.3
0.81.3
0.9
Sweden Denmark Norway Finland
The Nordics combined
4.2
17%**
25%
2%**
7%**
*Responses to the
question “From which
foreign countries have
you purchased goods
online in the past three
months?”
(Nordics, average Q1-Q4,
%) Base: Have purchased
goods online from abroad
during the quarter.
**Refers to all Nordic
consumers who
purchased goods online
from abroad, except for
those residing in the
respective country.
36%
23%
1%**
23%
10

>> E-commerce from abroad
0 200 400 600 800 1,000 1,200 1,400 1,600 1,800 2,000
Clothing/footwear
Home electronics
Media
Health/beauty
Sport/leisure articles
Car/boat/motorcycle accessories
Children’s goods/toys
Clothing and footwear clear favorites >> Number of people who purchased goods online from abroad in each product category
(average Q1-Q4, thousands)Calculated based on the question “Which goods have you purchased online from abroad during the past three months?” (Base: Have purchased goods online from abroad during the quarter)
Sweden Denmark Norway Finland
513 299 431 481
283 232 348 290
230 249 352 229
177 131 259 143
193 154 157 166
140 64 86 96
74 64 97 54
“The domestic market’s relative maturity is what drives international commerce. The Swedish range has been good. Finland’s, Norway’s, and Denmark’s domestic alternatives haven’t been as good, which has made local consumers more eager to buy online from foreign retailers.”
Carsten Dalbo Pedersen, Head of E-commerce & Logistics, PostNord Denmark
0% 10% 20% 30% 40% 50% 60%
Denmark
Norway
Nordics
Sweden
Finland
Almost as common in Finland as in Norway >> Have you purchased goods online from abroad at any time during the past three months?
(average Q1-Q4, %)Base: Have made purchases online during the quarter
Sweden Denmark Norway Finland
40%
32%
36%
50%
49%
11

>>Digital and physical interplay
Multichannel buying processes
Boundaries are disappearingToday, a large proportion of physical commerce in-cludes digital elements. During an average quarter, half of all survey respondents say that they have done research online prior to purchasing goods in a physical store. The leading product category within which this kind of purchase is made is home electronics, especially in Norway and Finland. It is less common for the purchasing process to occur by consumers who test goods in a physical store before making a purchase online. Sweden leads this trend, with nearly one in five respondents there stating that they have made purchases this way. Clothing and footwear are clear favorites for this type of purchase.
E-commerce using mobile devicesDanish and Norwegian consumers show a clear preference for making online purchases on tablets, as opposed to via cell phones. The difference between these two platforms is significantly less pronounced in Finland, and, in Sweden, an equal number of consumers use both platforms. For an e-retailer to be successful, it is crucial that they investigate how consumers prefer to shop within a particular product category and to adapt their offering accordingly.
“Consumers don’t distinguish between channels anymore. It’s just as common to make purchases from digital stores as it is from physical stores.”
Arne Andersson Nordic E-commerce Specialist, PostNord
More online purchases made via tablets than cell phones >> Which devices have you used to buy goods online
in the past three months? (average Q1, Q2, Q4, %)Base: Have made purchases online during the quarter
30%
20%
25%
15%
10%
0%
5%
Tablet Cell phone
Nordics Sweden Denmark Norway Finland
16
21
12
16
12
1 in 5The proportion of Swedish online shoppers who make purchases via their cell phone during an average quarter.
An equal number make purchases via tablets.
21 21
25 24
15
12

>> Digital and physical interplay
Do research online —buy in-store
Nordic consumers’ top three product categories for purchases of this kind*
0 1000 2000 3000 4000 5000 6000
Clothing/footwear
Media
Home electronics
Health/beauty
Sport/leisure articles
Children’s goods/toys
17,2 25,3 4,5 13,2
Clothing/footwear and media dominate >> Number of consumers who made purchases in the product categories below (average Q1-Q4, thousands)
Sweden Denmark Norway Finland
17,2 25,3 4,5 13,2
17,2 25,3 4,5 13,2
17,2 25,3 4,5 13,2
17,2 25,3 4,5 13,2
17,2 25,3 4,5 13,2
17,2 25,3 4,5 13,2
Research in-store —buy online
Do in-store research —buy online
Nordic consumers’ top three product categories for purchases of this kind*
*Responses to the question “In the past three months, which types of products have you first done research on online before purchasing them in a store?” (Q4, %); Base: Have done research on a product online before making an in-store purchase. “Top three” refers to the largest categories, based on a weighted average for the Nordics as a whole.
1. Home electronicsSweden: 41%Denmark: 30%Norway: 48%Finland: 48%
2. Clothing and footwearSweden: 26%Denmark: 22%Norway: 23%Finland: 26%
3. MediaSweden: 17%Denmark: 19%Norway: 19%Finland: 20%
*Responses to the question “In the past three months, which types of products have you first looked at/tried in a store before purchasing them online?” (Q4, %); Base: Have done in-store research on a product before making an online purchase. “Top three” refers to the largest categories, based on a weighted average for the Nordics as a whole.
1. Clothing and footwearSweden: 45%Denmark: 42%Norway: 38%Finland: 53%
2. Home electronicsSweden: 17%Denmark: 23%Norway: 22%Finland: 32%
3. Sport and leisure articlesSweden: 13%Denmark: 14%Norway: 18%Finland: 25%
Multichannel buying processes
0% 10% 20% 30% 40% 50% 60%
Denmark 42%
>> In the past three months, have you done research on a product online before purchasing it in a store? (average Q1, Q2, Q4, %)Base: Have made purchases online during the quarter
Norway 51%
Nordics 49%
Sweden 54%
Finland 45%
0% 10% 20% 30% 40% 50% 60%
Denmark 9%
>> In the past three months, have you first looked at/tried a product in a store before purchasing it online? (average Q1, Q2, Q4, %)Base: Have made purchases online during the quarter
Norway 12%
Nordics 12%
Sweden 17%
Finland 9%
13

3.4The average number of business days Danes are willing to wait for delivery of a mail item ordered online. Danes have the highest expectations concerning fast deliveries of all Nordic residents.
>> Deliveries
14

Options are more important than speed
Difference in preferences—local adaptation neededThere are major differences in how Nordic consum-ers prefer to have their mail items delivered. Danes have high expectations concerning fast deliveries and value the option to have goods delivered to their workplace, to a parcel machine, or to their home during daytime hours. Swedes and Norwegians have similar preferences when it comes to delivery time and prefer to have parcels delivered to their home mailboxes, or alternatively, to pick them up from a partner outlet. Finnish consumers are the most patient and prefer to pick up their parcels from partner outlets.
The average Nordic consumer’s tolerance level for delivery times (number of business days)*:
Nordics: 3.9 Sweden: 3.9 Denmark: 3.4 Norway: 4.1 Finland: 4.4
*Mean values based on the responses shown in the diagram above.
Finns are the most patient >> When ordering a product online, what are your
expectations concerning delivery time; i.e. how many days are you willing to wait, at most, to receive your goods? (Q1, %)Base: Have made purchases online during the quarter
80%
50%
70%
30%
20%
0%
10%
Nordics Sweden Denmark Norway Finland
1-2 days 6 days or more3-5 days
60%
40%
>> Deliveries
13 13
23
8 711 8
6
13
19
68
72
62
70
67
0% 10% 20% 30% 40% 50% 60% 70% 80% 90% 100%
Nordics
Sweden
Denmark
Norway
Finland
Varying preferences concerning delivery method>> When you purchase a product online and have the opportunity to choose how it will be delivered, how
do you generally prefer to receive it? (Q1, %)Base: Have made purchases online during the quarter
Delivered to my workplace Delivered to my home during the daytime when I am at home Pick it up myself from a partner outlet/service point From a parcel machine that is open 24 hours
9% 4% 19% 1% 20% 9% 15% 22%
2% 3% 10% 1% 48% 31% 2% 3%
1% 3% 11% 3% 48% 14% 13% 6%
4% 4% 8% 2% 52% 25% 2% 4%
4% 3% 12% 2% 43% 21% 7% 8%
Delivered to my home in the evening when it suits me, even if it costs extra Pick it up myself from a physical store or warehouse To my mailbox by the mail carrier Other, unsure, don’t know
15
>> Returns
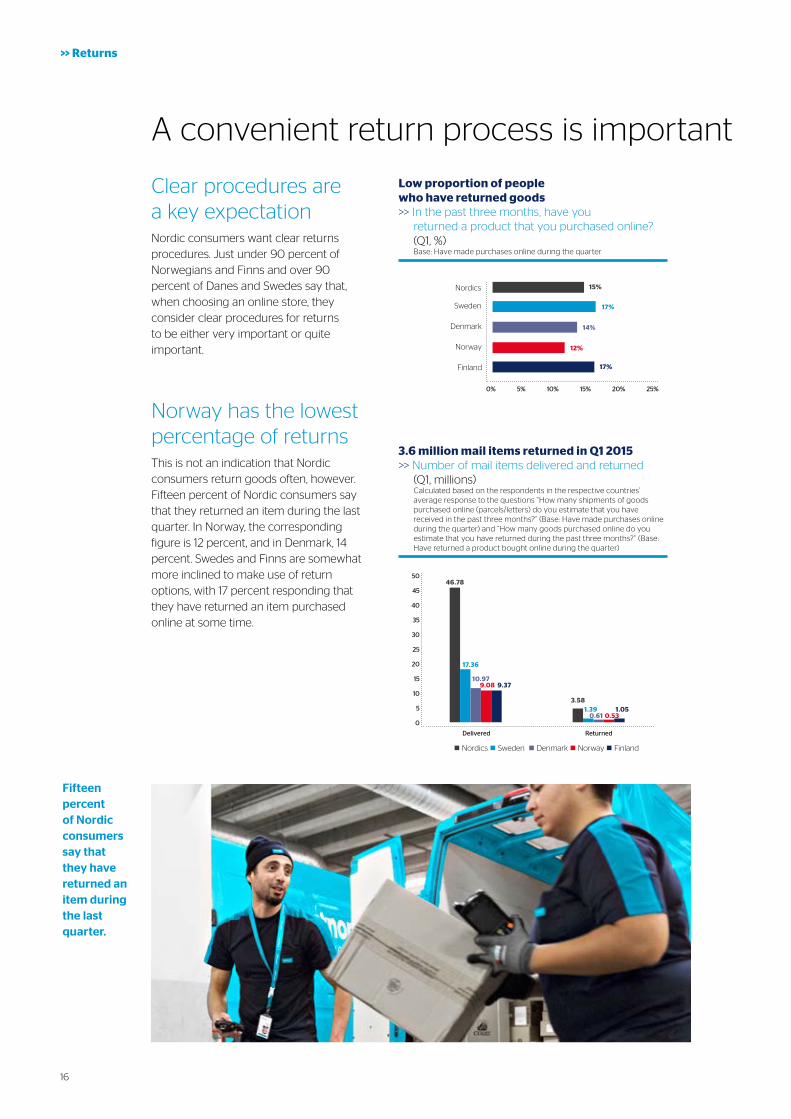
A convenient return process is important
3.6 million mail items returned in Q1 2015 >> Number of mail items delivered and returned
(Q1, millions)Calculated based on the respondents in the respective countries’ average response to the questions “How many shipments of goods purchased online (parcels/letters) do you estimate that you have received in the past three months?” (Base: Have made purchases online during the quarter) and “How many goods purchased online do you estimate that you have returned during the past three months?” (Base: Have returned a product bought online during the quarter)
50
40
45
35
25
0
20
Delivered Returned
Nordics Sweden Denmark Norway Finland
46.78
17.36
10.979.37
5
10
15
30
9.08
3.581.39
0.611.05
0.53
Clear procedures are a key expectationNordic consumers want clear returns procedures. Just under 90 percent of Norwegians and Finns and over 90 percent of Danes and Swedes say that, when choosing an online store, they consider clear procedures for returns to be either very important or quite important.
Norway has the lowest percentage of returns This is not an indication that Nordic consumers return goods often, however. Fifteen percent of Nordic consumers say that they returned an item during the last quarter. In Norway, the corresponding figure is 12 percent, and in Denmark, 14 percent. Swedes and Finns are somewhat more inclined to make use of return options, with 17 percent responding that they have returned an item purchased online at some time.
0% 5% 10% 15% 20% 25%
Denmark
Low proportion of people who have returned goods >> In the past three months, have you
returned a product that you purchased online? (Q1, %)Base: Have made purchases online during the quarter
Norway
Nordics
Sweden
Finland
15%
17%
14%
12%
17%
Fifteen percent of Nordic consumers say that they have returned an item during the last quarter.
16

>> Returns
Returns process is important when Nordic consumers choose online stores
Clear returns procedures are more important than free returns
>> How important are the following in connection with delivery when you decide which online store/site you will buy a product from? That clear information is provided about returns procedures (Q2, %)Base: Have made purchases online during the quarter
60%
50%
30%
40%
20%
10%
0%
Very important Quite important
Not very important Not important at all
Nordics Sweden Denmark Norway Finland
5552
48
43
50
37 39 38
43
39
6 810 11
8
1 02 21
>> How important are the following in connection with delivery when you decide which online store/site you will buy a product from? That returns are free of charge (Q2, %)Base: Have made purchases online during the quarter
60%
50%
30%
40%
20%
10%
0%
Very important Quite important
Not very important Not important at all
Nordics Sweden Denmark Norway Finland
47
42 414444
4036 36
3838
1015 17
1414
1
43
22
36%The percentage of Norwegians who shop online and have never returned a shipment. In Sweden, the figure is 33% and in Denmark, 32%.*
*No data are available for Finland due to differences
in how the question was asked.
17

“No matter what you do, make sure you have a good offering as your foundation”
Tell us about your background in Nordic e-commerce.
I got my start with NetOnNet in 1999, where I stayed for many years. Though we didn’t realize it at the time, we were in the process of developing what would later come to be called “omnichannel.” That is, full integration among the channels. Today, I mostly work with e-commerce at the board level of corporate management. In reality, though, my background is as a generalist. I don’t see myself first and foremost as an e-retailer or e-commerce expert, but as a retailer who sells online.
You have experience working in a number of different goods segments. What common success factors do you see among these?
What they have in common is that they are all based
on commerce and commerciality. No matter what you do, you must have a good offering as your foundation. Otherwise, you won’t succeed as either a retailer or an e-retailer. Once you’ve established yourself, it’s a matter of being able to deliver on your customers’ orders in an efficient way. In e-commerce, one clear success factor is having well-organized logistics, order flow, and customer service. It’s different from physical stores, where you don’t generally receive orders for goods other than those already in the store, and so can better get away with deficiencies in your logistics system, for example.
In your opinion, what are the biggest simi-larities and differences between the Nordic countries?
At the basic level, I see a number of similarities and differences. Sweden stands out because its larger population means a bigger market in which you can
Anders Halvarsson is the industry guru who founded NetOnNet and who currently sits on the boards of directors for Ellos, Junkyard, and Scandinavian Photo. Anders has solid and extensive experience within Nordic e-commerce. He knows how things should be done, what works, and what to prioritize. In an interview with Anders, PostNord took the opportunity to ask him about his view on the future of e-commerce and what pieces of advice he would like to give to current and prospective e-retailers.
>> Interview
18

more quickly build up a critical mass of consumers. It seems to me that Swedish sites invest a little more in the technology and revamp themselves a little more often. You can also see differences in how often Nordic consumers buy from international sites. This has nothing to do with the consumers’ maturity, though, but has more to do with the domestic range, where a bigger market like Sweden’s has more to offer. In terms of price level, the average prices in Norwegian online stores tend to be a little higher, though that’s mostly because they more often choose premium products, not because of a greater willingness to pay. In principle, price awareness is the same across the Nordics.
What are the biggest changes that e-com-merce has undergone in recent years?
Hands down, the biggest change is the shift to purchasing on mobile devices. This opens up new opportunities, but also leads to increased costs for e-retailers initially, because they have to adapt to the platform. It’s not necessarily enough to develop a responsive version of your desktop site. From an international perspective, I see examples where apps are starting to play a bigger role.
What trends do you see on the deliveries side?
Deliveries must be fast and convenient. That’s a clear expectation from the customers’ side. But the scramble for ever-faster deliveries that we saw a few years ago seems to be dying down. In the companies I’m involved in, we’re instead starting to see delivery precision become more important than speed. There’s no point in offering home delivery if there’s no one at home, for example. If you can improve precision from “sometime between 10 AM and 5 PM on Thursday,” to “sometime between 12 PM and 2
PM,” then you can compete with physical stores. I think delivery precision will be a success factor in the future.
Nowadays, both physical and digital elements are often involved when making a purchase. How do you think this interplay will develop in the future?
I think we’re going to see some altered concepts in physical commerce. But just what that will mean is something you can really only speculate about. Above all, I think that the development will be different in different industries. The Swedish retailer Webhallen is an example of a successful, somewhat new concept in its segment. At the same time, I see more and more online stores offering goods that can’t be examined physically, and that this can also work very well. Daniel Wellington watches are one example of this trend.
What does a company need to do to establish a successful e-commerce offering in the Nordic market?
The most important thing is to do your homework. I see a relatively large number of fundamental mistakes. One clear example is payment solutions: If you set up in Denmark and don’t offer the opportunity to pay using Dankort, you eliminate a large group of potential buyers. It’s good to have a local presence, but if you do your homework well enough, it’s not strictly necessary. I think it’s more important not to run up too large an overhead in each country. When it comes to offerings, I think you should start narrow, with a focused range. Many fail because their ranges are a little too large. Instead of widening out in your home market, you can go international.
Anders’ advice to businesses wanting to establish online stores in the Nordic region:Have a competitive offering
Do your homework on each individual market
Start narrow with a focused range
Adapt your online store to suit mobile devices
Ensure you have well-organized logistics, order flow, and customer service.
>> Interview
19

Car/boat/motorcycle accessories
» Population (18-79 years)
» Percentage of population with access to the Internet
» Percentage of population who shop online at least once a year1
» Percentage of population who shop online at least once a month1
» Percentage of population who buy online from international retailers2
» Average purchase amount per online shopper, per quarter (EUR)
» Average maximum number of business days consumers are prepared to wait for deliveries 3
7,262,665
95%
87%
37%
32%
313
3.9
Sweden
>> Spotlight on Sweden
1 Average Q1, Q2, Q4; Base: Entire population aged 18-79 years2 Average Q1-Q4; Base: Have made purchases online during the quarter3 Q120

Media is the most popular category Swedes like to shop online and media is their favorite category of goods for online purchases, followed by clothing and footwear. They also like to buy health and beauty products and home electronics online. Swedes make online purchases for an average of EUR 313 per quarter and 37 percent say that they shop online at least once a month. A full 87 percent say that they shop online at least once a year. The proportion of Swedish consumers who purchase goods online from abroad is 32 percent. Of all Nordic residents, Swedes are the most interested in omnichannel commerce. Fifty-four percent say that they have done research online before making their purchase in a physical store. Seventeen percent say that they
have done the reverse by examining a product in-store before purchasing it online.
UK stores are no. 1Swedes’ favorite international e-commerce destinations are the UK and Germany. Thirty-four and 27 percent, respectively, of those who have made online purchases from abroad say that they have bought from these countries. A significant proportion of Swedish consumers also buy from the US and China. Within the Nordic region, Swedes buy most from Denmark. Denmark is one of Sweden’s top five most popular countries to buy from, although it lags a long way behind the top four countries on the list.
The largest e-commerce nation
Car/boat/motorcycle accessories
Children’s goods/toys
Sport/leisure articles
Home electronics
Health/beauty
Clothing/footwear
Media 43%
0% 10% 20% 30% 40% 50%
Total amount Swedes estimate spending on online purchases in 2015 (EUR bn):
6.5* Of which, purchases from abroad:
20%
40%
30%
13%
11%
29%
7%
>> Spotlight on Sweden
Percentage who did research online before buying in-store
54% Percentage who did in-store research before buying online
17%
$Top five most popular countries from which Swedes buy
UK – 34% Germany – 27% USA – 24% China – 24% Denmark – 7%
Responses to the question “From which foreign countries have you purchased goods online in the past three months?” (average Q1-Q4); Base: Have purchased goods online from abroad during the quarter
Responses to the question: “In the past three months, have you first done research online about a product that you later bought in a store?” and “In the past three months, have you first looked at/tried out a product in a store that you then bought online?” (Both averages Q1, Q2, Q4); Base: Have made purchases online during the quarter
*Unlike the E-barometer survey, this figure refers to Swedish consumers’ e-commerce consumption both within Sweden and abroad. The E-barometer measures Swedish businesses’ sales and, as such, does not include Swedes’ e-commerce consumption from foreign retailers.
>> What types of goods have you bought online in the past three months? (average Q1-Q4, %)Base: Have made purchases online during the quarter
21

Debit cards and invoices are the preferred payment options
Most Swedes make online purchases at least once per quarter, although nearly as many shop online once a month. Nine percent say that they shop online 2-3 times a month and two percent say that they do so every week.
Debit cards and invoices are the most popular payment options. The second most popular payment method is direct payment via a bank. PayPal, Payson, and similar services are used less frequently; only seven percent say that they prefer to pay using these services.
Swedes are relatively patient. On average, they are content to wait 3.9 days to have their goods delivered. The largest proportion of like-minded consumers, 32 percent, want their goods delivered within three business days, while a full 27 percent are happy to wait five days. Just over ten percent say that they are content to wait two and four business days, respectively.
Never
Once a year
Once every six months
Once a quarter
Once a month
2-3 times a month
Every week 2%
0% 5% 10% 15% 30%
9%
25%
11%
11%
27%
6%
The majority buy once a quarter or once a month >> Approximately how often do you buy goods online? (average Q1, Q2, Q4, %)
Base: Entire population aged 18-79 years
20% 25%
Less often 7%
“Retailers must realize how important the cell phone is in Swedes’ purchasing process these days. We’re moving more and more between different channels, and it’s a matter of creating a seamless buying journey if you don’t want to lose customers to the competition.”
Carin Blom, E-commerce Expert, PostNord Sweden
>> Spotlight on Sweden
22

Invoices are as popular as card payments>> Which of the following methods do you prefer when paying for a product purchased online? (Q4, %)
Base: Have made purchases online during the quarter
100%90%0% 10% 20% 30% 40% 50% 60% 70% 80%
Debit or credit card Invoice Direct payment via bank PayPal, Payson, or similar COD Other, unsure, don’t know
35% 35% 19% 7% 1% 1%
Three-day limit for most people >> When you order a product online, what are your expectations concerning the delivery time; i.e. what is
the maximum number of days you are prepared to wait to receive your goods? (Q1, %)Base: Have made purchases online during the quarter
100%90%0% 10% 20% 30% 40% 50% 60% 70% 80%
One business day Two business days Three business days Four business days Five business days Six business days or more Other, unsure, don’t know
32% 27%12% 13% 8% 7%1%
>> Spotlight on Sweden
23

» Population (18-79 years)
» Percentage of population with access to the Internet
» Percentage of population who shop online at least once a year1
» Percentage of population who shop online at least once a month1
» Percentage of population who buy online from international retailers2
» Average purchase amount per online shopper, per quarter (EUR)
» Average maximum number of business days that consumers are prepared to wait for deliveries3
4,250,412
97%
88%
40%
36%
291
3.4
Denmark
>> Spotlight on Denmark
1 Average Q1, Q2, Q4; Base: Entire population aged 18-79 years2 Average Q1-Q4; Base: Have made purchases online during the quarter3 Q124

Clothing and footwear are no. 1A high proportion of Danish consumers—89 percent—shop online at least once a year. Those who shop online spend an average of EUR 291 per quarter, which is somewhat less than Swedes and Norwegians. The proportion of Danish consumers who purchase goods from international online stores is 36 percent. Clothing and footwear is Danes’ favorite goods category when they shop online. Like their Nordic neighbors, Denmark’s three favorite goods categories are clothing and footwear, media, and home electronics.
Buying from Sweden is commonDanes make most of their international online purchases from the UK. Almost half of all Danes who have bought goods online from abroad—46 percent—have bought from the UK. Germany comes in at a solid second, while the US and China share third place. When it comes to shopping online in the Nordic region, Sweden is the Danes’ favorite marketplace.
A small but mature e-commerce nation
Car/boat/motorcycle accessories
Children’s goods/toys
Sport/leisure articles
Health/beauty
Home electronics
Media
Clothing/footwear 37%
0% 10% 20% 30% 40% 50%
Total amount Danes estimate spending on online purchases in 2015(EUR bn):
3.6 Of which, purchases from abroad:
22%
32%
30%
15%
12%
21%
6%
>> Spotlight on Denmark
Percentage who did research online before buying in-store
42% Percentage who did in-store research before buying online
9%
$Top five most popular countries from which Danes buy
UK – 46% Germany – 30% USA – 18% China – 18% Sweden – 13%
Responses to the question “From which foreign countries have you purchased goods online in the past three months?” (average Q1-Q4); Base: Have purchased goods online from abroad during the quarter
Responses to the question: “In the past three months, have you first done research online about a product that you later bought in a store?” and “In the past three months, have you first looked at/tried out a product in a store that you then bought online?” (both averages Q1, Q2, Q4); Base: Have made purchases online during the quarter
>> Which types of goods have you bought online in the past three months? (average Q1-Q4, %)Base: Have made purchases online during the quarter
25

Danes are the most impatient
Forty percent of Denmark’s population buys goods online at least once a month. Eighty-nine percent say that they shop online at least once a year. Denmark ranks highest in the percentage of Nordic consumers who shop online more than once a year.
There is a strong preference among Danish consumers to pay using cards: 83 percent prefer this method of payment. A much smaller percentage prefers to use PayPal, Payson, or similar services. Equal numbers prefer to pay COD or by invoice.
Danes are prepared to wait an average of 3.4 days for their deliveries, making them the least patient among Nordic residents. Twenty-one percent want their goods delivered within two business days, while 14 percent say that they are willing to wait five business days.
Never
Once a year
Once every six months
Once a quarter
Once a month
2-3 times a month
Every week 2%
0% 5% 10% 15% 30%
12%
26%
15%
7%
26%
5%
Largest proportion of Nordic residents who shop online more than once a year >> Approximately how often do you buy goods online? (average Q1, Q2, Q4, %)
Base: Entire population aged 18-79 years
20% 25%
Less often 6%
“Home deliveries are a long-standing tradition in Denmark. That’s the way it’s always been, and home deliveries are what consumers have expected. In recent years, however, service points have become more prominent. So, things are changing.”
Carsten Dalbo Pedersen, Head of E-commerce & Logistics, PostNord Denmark
>> Spotlight on Denmark
26

Card payments clearly dominant>> Which of the following methods do you prefer when paying for a product purchased online? (Q4, %)
Base: Have made purchases online during the quarter
100%90%0% 10% 20% 30% 40% 50% 60% 70% 80%
Debit or credit card Invoice Direct payment via bank PayPal, Payson, or similar COD Other, unsure, don’t know
83% 6% 4% 3%
Highest expectations concerning delivery times >> When you order a product online, what are your expectations concerning the delivery time, i.e. what is
the maximum number of days you are prepared to wait to receive your goods? (Q1, %)Base: Have made purchases online during the quarter
100%90%0% 10% 20% 30% 40% 50% 60% 70% 80%
One business day Two business days Three business days Four business days Five business days Six business days or more Other, unsure, don’t know
36% 14%21% 12% 6% 8%2%
>> Spotlight on Denmark
4% 1%
27

» Population (18-79 years)
» Percentage of population with access to the Internet
» Percentage of population who shop online at least once a year1
» Percentage of population who shop online at least once a month1
» Percentage of population who buy online from international retailers2
» Average purchase amount per online shopper, per quarter (EUR)
» Average maximum number of business days consumers are prepared to wait for deliveries3
3,819,761
97%
85%
39%
50%
369
4.1
Norway
>> Spotlight on Norway
1 Average Q1, Q2, Q4; Base: Entire population aged 18-79 years2 Average Q1-Q4; Base: Have made purchases online during the quarter3 Q128

Media is no. 1 In Norway, 85 percent of consumers say that they shop online at least once a year. Norwegians spend more per person on online shopping than their Nordic counterparts—EUR 369 per person and quarter on average. Fifty percent have made online purchases from abroad. Like their Swedish neighbors, Norwegians most like to purchase media when shopping online. Clothing and footwear are also popular. As with the rest of the Nordic region, home electronics and health and beauty products are also among Norwegians’ favorite purchases.
Germany is less popularAmong international markets, Norwegians prefer to buy online from the UK, as do Swedes and Danes. China and the US are also popular, as is Sweden. Twenty percent of Norwegians who have bought from foreign online vendors have bought goods from Sweden. Thirteen percent have purchased goods online from Denmark or Germany, making Germany less popular among Norwegian shoppers than it is among their Nordic neighbors.
Spend most online per capita
Car/boat/motorcycle accessories
Children’s goods/toys
Sport/leisure articles
Health/beauty
Home electronics
Clothing/footwear
Media 38%
0% 10% 20% 30% 40% 50%
Total amount Norwegians estimate spending on online purchases in 2015(EUR bn):
4.4 Of which, purchases from abroad:
29%
37%
32%
18%
8%
24%
7%
>> Spotlight on Norway
Proportion who did research online before buying in-store
51% Proportion who did in-store research before buying online
12%
$Top five most popular countries from which Norwegians buy
UK – 38% USA – 36% China – 31% Sweden – 20% Germany/Denmark – 13%
Responses to the question “From which foreign countries have you purchased goods online in the past three months?” (average Q1-Q4); Base: Have purchased goods online from abroad during the quarter
Responses to the question: “In the past three months, have you first done research online about a product that you later bought in a store?” and “In the past three months, have you first looked at/tried out a product in a store that you then bought online?” (both averages Q1, Q2, Q4); Base: Have made purchases online during the quarter
>> What types of goods have you bought online in the past three months? (average Q1-Q4, %)Base: Have made purchases online during the quarter
29

The largest percentage who shop online more than once a month
Twenty-five percent of Norwegian consumers shop online at least once a quarter, and a full 85 percent say that they buy online at least once a year. Sixteen percent buy more than once a month; the highest proportion among the Nordic countries.
The majority of Norwegians—59 percent—prefer to pay using debit cards. Sixteen percent say that they prefer to receive an invoice. An equally large percentage say that they prefer to pay using PayPal, Payson, or a similar service, which is the largest proportion among the surveyed countries.
Norwegians are willing to wait 4.1 business days to receive their parcels. Twenty-six percent say that they prefer to receive their mail items within two business days, while 25 percent are prepared to wait five business days.
Never
Once a year
Once every six months
Once a quarter
Once a month
2-3 times a month
Every week 2%
0% 5% 10% 15% 30%
14%
22%
14%
7%
25%
6%
Largest percentage of Nordic consumers who shop online more than once a month >> Approximately how often do you buy goods online? (average Q1, Q2, Q4, %)
Base: Entire population aged 18-79 years
20% 25%
Less often 9%
“Historically, Norway has enjoyed strong exchange rate development, which has contributed to its strong purchasing power. Foreign online stores have also been increasingly successful in adapting their sites to accommodate the Norwegian language and currency.”
Kristin Anfindsen, E-commerce Development Manager, PostNord Norway
>> Spotlight on Norway
30

59% 16% 16%
PayPal and similar services are more popular than in other countries>> Which of the following methods do you prefer when paying for a product purchased online? (Q4, %)
Base: Have made purchases online during the quarter
100%90%0% 10% 20% 30% 40% 50% 60% 70% 80%
Debit or credit card Invoice Direct payment via bank* PayPal, Payson, or similar COD Other, unsure, don’t know
Almost as many draw the line at five as at three business days >> When you order a product online, what are your expectations concerning the delivery time, i.e. what is
the maximum number of days you are prepared to wait to receive your goods? (Q1, %)Base: Have made purchases online during the quarter
100%90%0% 10% 20% 30% 40% 50% 60% 70% 80%
One business day Two business days Three business days Four business days Five business days Six business days or more Other, unsure, don’t know
26% 25%7% 19% 13% 10%1%
>> Spotlight on Norway
1% 9%
*Alternative unavailable.
31

» Population (18-79 years)
» Percentage of population with access to the Internet
» Percentage of population who shop online at least once a year1
» Percentage of population who shop online at least once a month1
» Percentage of population who buy online from international retailers2
» Average purchase amount per online shopper, per quarter (EUR)
» Average maximum number of business days consumers are prepared to wait for deliveries 3
4,118,784
97%
79%
18%
49%
249
4.4
Finland
>> Spotlight on Finland
1 Average Q1, Q2, Q4; Base: Entire population aged 18-79 years2 Average Q1-Q4; Base: Have made purchases online during the quarter3 Q132

The largest buyers of clothing and footwear among Nordic consumersSeventy-nine percent of Finns shop online at least once a year, which is a somewhat lower percentage than among their Nordic neighbors. Conversely, the proportion of consumers who buy goods online from abroad is high in Finland — a full 49 percent. Each Finnish consumer spends an average of EUR 249 per quarter on e-commerce. Finland’s shopping preferences are similar
to those of the other Nordic countries, except that the car, boat, and motorcycle accessory category is somewhat more popular in Finland than elsewhere in the Nordics.
Germany is no. 1 When it comes to shopping abroad, Finnish consumers’ preferences differ from the rest of the Nordic region. Germany is the Finns’ favorite country to buy from, with the UK in second place. It is interesting to note that, in Finland, it is more popular to buy from Sweden than from the US.
Large percentage who purchase online from abroad
Children’s goods/toys
Car/boat/motorcycle accessories
Sport/leisure articles
Health/beauty
Home electronics
Media
Clothing/footwear 41%
0% 10% 20% 30% 40% 50%
Total amount Finns estimate spending on online purchases in 2015(EUR bn):
2.6 Of which, purchases from abroad:
33%
37%
33%
15%
8%
19%
7%
>> Spotlight on Finland
Percentage who did research online before buying in-store
45% Percentage who did in-store research before buying online
9%
$Top five most popular countries from which Finns buy
Germany – 31% UK – 27% China – 20% Sweden – 19% USA – 15%
Responses to the question “From which foreign countries have you purchased goods online in the past three months?” (average Q1-Q4); Base: Have purchased goods online from abroad during the quarter
Responses to the question: “In the past three months, have you first done research online about a product that you later bought in a store?” and “In the past three months, have you first looked at/tried out a product in a store that you then bought online?” (both averages Q1, Q2, Q4); Base: Have made purchases online during the quarter
>> What types of goods have you bought online in the past three months? (average Q1-Q4, %)Base: Have made purchases online during the quarter
33

Four out of ten shop online once a year
Thirty-seven percent say that they shop online at least once per quarter. A lower proportion, nine percent, shop online once a month. Overall, the percentage of Finnish consumers who shop online more than once a month is lower than in the other Nordic countries.
The majority of Finns prefer to pay using a debit card or via invoice, although many others prefer to pay directly via a bank. Ten percent like to use PayPal, Payson, or similar services.
On average, Finns are willing to wait up to 4.4 business days for their parcels. Thirty-two percent say that they are prepared to wait five business days for their deliveries. A full 19 percent are willing to wait for shipments for six business days or more, which is the highest proportion among the surveyed countries.
Never
Once a year
Once every six months
Once a quarter
Once a month
2-3 times a month
Every week 2%
0% 5% 10% 15% 30%
7%
9%
16%
27%
19%
4%
Most consumers buy only once a year >> Approximately how often do you buy goods online? (average Q1, Q2, Q4, %)
Base: Entire population aged 18-79 years
20% 25%
Less often 17%
“Finnish consumers are looking for lower prices and a broader range when they shop online. That’s why the proportion of purchases from abroad is high.”
Jouni Lamberg, Vice President Sales, Marketing & E-Commerce, PostNord Finland
>> Spotlight on Finland
34

>> Spotlight on Finland
Cards, invoices, and direct payments are preferred>> Which of the following methods do you prefer when paying for a product purchased online? (Q4, %)
Base: Have made purchases online during the quarter
100%90%0% 10% 20% 30% 40% 50% 60% 70% 80%
Debit or credit card Invoice Direct payment via bank PayPal, Payson, or similar COD Other, unsure, don’t know
36%
The most patient Nordic consumers >> When you order a product online, what are your expectations concerning the delivery time, i.e. what is
the maximum number of days you are prepared to wait to receive your goods? (Q1, %)Base: Have made purchases online during the quarter
100%90%0% 10% 20% 30% 40% 50% 60% 70% 80%
One business day Two business days Three business days Four business days Five business days Six business days or more Other, unsure, don’t know
1%
19% 29% 10% 3% 3%
6% 20% 15% 32% 19% 8%
35

Detailed results
>> Detailed results
Basic data
Population (18-79 years) in the Nordic countries Source: Statistics Sweden, Statistics Norway, Statistics Denmark, Statistics Finland, 2014
Sweden 7,262,665
Denmark 4,250,412
Norway 3,819,761
Finland 4,118,784
Percentage of population with access to the InternetSource: Internet World Stats, 2015/PostNord
Sweden 95%
Denmark 97%
Norway 97%
Finland 97%
Population (18-79 years) with access to the InternetCalculated as the country’s population aged 18-79 years, multiplied by the country’s Internet penetration
Sweden 6,899,532
Denmark 4,122,900
Norway 3,705,168
Finland 3,995,220
Total e-commerce during 2015 (total Q1-Q4)
Calculated based on the respondents in each country’s average response to the question “What total amount do you estimate that you have spent purchasing products online in the past three months?”
Base: Have made purchases online during the quarter
Sweden Denmark Norway Finland Nordics
Total, national currency SEK 61,391 m DKK 26,971 m NOK 38,786 m EUR 2,608 m -
Total, EUR EUR 6,494 m EUR 3,614 m EUR 4,378 m EUR 2,608 m EUR 17,094 m
Average per person and quarter, EUR EUR 313 EUR 291 EUR 369 EUR 249 -
How often Nordic residents shop online (average Q1, Q2, Q4)
Approximately how often do you buy goods online?
Base: Entire population aged 18-79 years Sweden Denmark Norway Finland Nordics
Every week 2% 2% 2% 2% 2%
2-3 times a month 9% 12% 14% 7% 10%
Once a month 25% 26% 22% 9% 21%
Once a quarter 27% 26% 25% 19% 25%
Once every six months 11% 15% 14% 16% 14%
Once a year 11% 7% 7% 27% 13%
Less often 7% 6% 9% 17% 9%
Never 6% 5% 6% 4% 5%
Unsure, don’t know 0% 1% 1% 0% 0%
36

>> Detailed results
Main advantage of shopping online (Q4)
Which is the single most important advantage of purchasing goods online as opposed to in a traditional store?
Base: Have made purchases online during the quarter Sweden Denmark Norway Finland Nordics
I can shop when it suits me 24% 31% 31% 26% 27%
Cheaper 24% 19% 20% 27% 23%
Larger and better range 17% 12% 16% 22% 17%
Saves time 12% 9% 10% 8% 10%
More convenient 17% 8% 7% 5% 11%
Other, unsure, don’t know 6% 21% 15% 12% 12%
Categories of goods bought by Nordic online shoppers (average Q1-Q4)
Which types of goods have you purchased online during the past three months? (Multiple answers possible)
Base: Have made purchases online during the quarter Sweden Denmark Norway Finland Nordics
Clothing/footwear 40% 37% 37% 41% 39%
Home electronics 29% 30% 32% 33% 30%
Media 43% 32% 38% 37% 38%
Car/boat/motorcycle accessories 7% 6% 7% 8% 7%
Children’s goods/toys 11% 12% 8% 7% 10%
Sport/leisure articles 13% 15% 18% 15% 15%
Health/beauty 30% 21% 24% 19% 24%
Percentage of people who shop online from abroad (average Q1-Q4)
Have you purchased goods online from abroad at any time during the past three months? By “abroad” is meant that you per-ceive the online store’s domicile to be outside of your country and/or that the delivery comes from another country. (Percentage who answered yes)
Base: Have made purchases online during the quarter Sweden Denmark Norway Finland Nordics
Yes 32% 36% 50% 49% 40%
Total e-commerce from abroad (total Q1-Q4)
Calculated based on the respondents in each country’s average response to the question “What total amount do you estimate that you have spent purchasing products online from international sites in the past three months? By ‘international sites’ is meant that you perceive the online store’s domicile to be outside of your country and/or that the delivery comes from another country.”
Base: Have purchased goods online from abroad during the quarter
Sweden Denmark Norway Finland Nordics
Total, national currency SEK 12,000 m DKK 6,029 m NOK 11,406 m EUR 861 m -
Total, EUR EUR 1,270 m EUR 808 m EUR 1,287 m EUR 861 m EUR 4,226 m
Categories of goods bought by Nordic online shoppers from abroad (average Q1-Q4)
Which types of goods have you purchased online from abroad during the past three months? (Multiple answers possible)
Base: Have purchased goods online from abroad during the quarter Sweden Denmark Norway Finland Nordics
Clothing/footwear 31% 27% 29% 38% 31%
Home electronics 17% 21% 23% 23% 20%
Media 14% 22% 24% 18% 19%
Car/boat/motorcycle accessories 9% 6% 6% 8% 7%
Children’s goods/toys 5% 6% 7% 4% 5%
Sport/leisure articles 12% 14% 11% 13% 12%
Health/beauty 11% 12% 17% 11% 12%
37

>> Detailed results
Nordic consumers’ favorite foreign countries to buy from online (average Q1-Q4)
From which foreign countries have you purchased goods online in the past three months? By “foreign country” is meant the country that you perceive to be the online store’s country of domicile. (Multiple answers possible)
Base: Have purchased goods online from abroad during the quarter Sweden Denmark Norway Finland Nordics
United Kingdom 34% 46% 38% 27% 36%
USA 24% 18% 36% 15% 23%
Germany 27% 30% 13% 31% 25%
China 24% 18% 31% 20% 23%
Sweden - 13% 20% 19% 17%*
Denmark 7% - 13% 3% 7%*
Norway 2% 1% - 2% 2%*
Finland 1% 0% 0% - 1%*
*These weighted averages exclude the country in question and, as such, reflect the relevant percentage of consumers in the other Nordic countries.
Percentage of people who have shopped online using mobile devices (average Q1, Q2, Q4)
Which devices have you used to purchase goods online in the past three months? (Multiple answers possible)
Base: Have made purchases online during the quarter Sweden Denmark Norway Finland Nordics
Cell phone 21% 12% 16% 12% 16%
Tablet 21% 25% 24% 15% 21%
Proportion of people who first looked at/tried out a product in a store that they then bought online (average Q1, Q2, Q4)
During the past quarter, have you first looked at/tried out a product in a store and later bought it online? (Percentage who answered yes)
Base: Have made purchases online during the quarter Sweden Denmark Norway Finland Nordics
Yes 17% 9% 12% 9% 12%
Categories of goods purchased online in this way (average Q1-Q4)
In the past three months, which types of products have you first looked at/tried in a store before purchasing them online? (Multiple answers possible)
Base: Have purchased goods online from abroad during the quarter Sweden Denmark Norway Finland Nordics
Clothing/footwear 45% 42% 38% 53% 45%
Home electronics 17% 23% 22% 32% 22%
Media 15% 11% 11% 16% 14%
Car/boat/motorcycle accessories 2% 1% 1% 10% 3%
Children’s goods/toys 4% 0% 2% 5% 3%
Sport/leisure articles 13% 14% 18% 25% 17%
Health/beauty 12% 10% 11% 3% 9%
Percentage of people who first researched a product online before purchasing it in a physical store (average Q1, Q2, Q4)
In the past three months, have you first done research online about a product that you later bought in a store? (Percentage who answered yes)
Base: Have made purchases online during the quarter Sweden Denmark Norway Finland Nordics
Yes 54% 42% 51% 45% 49%
38

>> Detailed results
Categories of goods purchased online in this way (Q4)
In the past three months, which types of products have you first done research on online before purchasing them in a store? (Multiple answers possible)
Base: In the past three months, have first done research online about a product which was then purchased in a store
Sweden Denmark Norway Finland Nordics
Clothing/footwear 26% 22% 23% 26% 25%
Home electronics 41% 30% 48% 48% 41%
Media 17% 19% 19% 20% 18%
Car/boat/motorcycle accessories 4% 7% 5% 12% 7%
Children’s goods/toys 7% 10% 8% 10% 8%
Sport/leisure articles 11% 13% 24% 17% 15%
Health/beauty 15% 12% 11% 16% 14%
Expectations concerning delivery time (Q1)
When you order a product online, what are your expectations concerning the delivery time; i.e. how many days are you willing to wait, at most, to receive your goods?
Base: Have made purchases online during the quarter Sweden Denmark Norway Finland Nordics
One business day 1% 2% 1% 1% 1%
Two business days 12% 21% 7% 6% 12%
Three business days 32% 36% 26% 20% 29%
Four business days 13% 12% 19% 15% 14%
Five business days 27% 14% 25% 32% 25%
Six business days or more 8% 6% 13% 19% 11%
Unsure, don’t know 7% 8% 10% 8% 8%
Average number of days 3.9 3.4 4.1 4.4 3.9
Preferred delivery methods (Q1)
When you purchase a product online and have the opportunity to choose how it will be delivered, how do you generally prefer to receive it?
Base: Have made purchases online during the quarter Sweden Denmark Norway Finland Nordics
I want it delivered to my workplace 2% 9% 4% 1% 4%
I want it delivered to my home in the evening when it suits me, even if it costs extra
3% 4% 4% 3% 3%
I want it delivered to my home when I am at home during the day
10% 19% 8% 11% 12%
I want to collect it myself from the online store’s physical store or warehouse
1% 1% 2% 3% 2%
I want to collect it myself from my local partner outlet/service point
48% 20% 52% 48% 43%
I want it delivered to my mailbox by the mail carrier 31% 9% 25% 14% 21%
I want to collect it myself from a parcel machine that is open 24 hours
2% 15% 2% 13% 7%
I want it delivered to my address, e.g. left in my garage - 18% - - -
Unsure, don’t know 3% 4% 4% 6% 4%
39
>> Detailed results
Preferred payment methods (Q4)
Which of the following methods do you prefer when paying for a product purchased online?
Base: Have made purchases online during the quarter Sweden Denmark Norway Finland Nordics
Debit card or credit card 35% 83% 59% 36% 50%
Invoice 35% 4% 16% 29% 23%
Direct payment via a bank 19% 1% - 19% 11%
PayPal, Payson, or similar 7% 6% 16% 10% 9%
COD 1% 4% 1% 3% 2%
Other, unsure, don’t know 1% 3% 9% 3% 3%
Percentage of people who have returned a shipment (Q1)
In the past three months, have you returned a product that you bought online? (Percentage who answered yes)
Base: Have made purchases online during the quarter Sweden Denmark Norway Finland Nordics
Yes 17% 14% 12% 17% 15%
Importance of clear returns procedures (Q2)
How important is the following in connection with delivery when you decide which online store/site you will buy a product from? That clear information is given on procedures for returns
Base: Have made purchases online during the quarter Sweden Denmark Norway Finland Nordics
Very important 55% 52% 48% 43% 50%
Quite important 37% 39% 38% 43% 39%
Not very important 6% 8% 10% 11% 8%
Not important at all 1% 0% 2% 2% 1%
Unsure, don’t know 1% 1% 3% 2% 2%
The importance of free returns (Q2)
How important is the following in connection with delivery when you decide which online store/site you will buy a product from? That returns are free of charge
Base: Have made purchases online during the quarter Sweden Denmark Norway Finland Nordics
Very important 44% 47% 42% 41% 44%
Quite important 40% 40% 36% 36% 38%
Not very important 13% 10% 15% 17% 14%
Not important at all 1% 1% 4% 3% 2%
Unsure, don’t know 2% 2% 3% 2% 2%
40

>> Detailed results
41

PostNord—your e-commerce partner
PostNord is the leading supplier of communication and logistics solutions to, from, and within the Nordic region. We also manage the postal service to households and businesses in Sweden and Denmark. Through our expertise and strong distribution network, we are laying the groundwork for tomorrow’s communication, e-commerce, and logistics in the Nordic region. In 2015, the PostNord group had 35,000 employees and sales of around SEK 40 billion.
PostNord is both the largest and preferred choice of partner for e-commerce in the Nordic market. Our comprehensive offering includes a host of services within products distribution, marketing, and customer communication.
We make everyday life easier for e-commerce companies. With a coordinated, Nordic-customized service offering within logistics and the broadest distribution network in the region, we help bring e-retailers and end-customers closer together. PostNord has around 6,000 distribution points evenly spread across Sweden, Denmark, Norway, and Finland. In Sweden and Denmark, our mail carriers also visit every household and business each business day.
PostNord is also active beyond the Nordic region through its subsidiary company Direct Link, which offers distribution solutions to countries all over the world. Direct Link helps e-commerce companies from around the globe to do business in the Nordic market by offering everything from market analysis and direct marketing to fulfilment, products distribution, and returns processing.
Find out more at www.postnord.com and www.directlink.com.
>> PostNord and e-commerce
42

For further information, contact
Sweden Carin Blom E-mail: [email protected] Tel.: +46 73 030 41 87
Denmark Carsten Dalbo Pedersen E-mail: [email protected] Tel.: +45 33 61 48 28
Norway Kristin Anfindsen E-mail: [email protected] Tel.: +47 99 77 05 71
Finland Jouni Lamberg E-mail: [email protected] Tel.: +358 10 572 8080
Nordic region Olof Källgren Phone: +46 761 18 43 40 Email: [email protected] Arne Andersson Phone: +46 73 079 05 52 Email: [email protected]
Germany Direct Link Worldwide GmbH Phone: +49 (0) 6155 89790 20 Email: [email protected]
UK Direct Link Worldwide Ltd Phone: +44 (0) 20 8707 4400 Email: [email protected]
USA Direct Link Worldwide Inc Phone: +1 (908) 289-0703 Email: [email protected]
Hong Kong Direct Link Worldwide Company Ltd Phone: +85 2 2850 4183 Email: [email protected]
Singapore Direct Link Worldwide Company Ltd Phone: +65 6 745-0773 Email: [email protected]
Australia Direct Link Worldwide Company Ltd Phone: +612 9550 0500 Email: [email protected]
Other countries Direct Link Group Sweden Phone: +46 (0) 10 436 00 00 Email: [email protected]
Media Emma Riblom E-mail: [email protected] Tel.: +46 10 437 98 40
Photos/Cover PostNord, Getty Images, Sven Schlager, Bench Accounting, Thomas Lefebvre, William Iven, Josh Felise, Josefin Brosche Hagsgård, David Marcu, Maliha Mannan and Paulina Westerlind
