e c o m Сейран Минасян o n i armecomonitoring t o...
TRANSCRIPT

A
r
m
e
c
o
m
o
n
i
t
o
r
i
n
g
Мониторинг поверхностных вод в Армении и его дальнейшее развитие.
Сейран Минасян
ARMECOMONITORING
09 November, 2012, Yerevan, Armenia
29, Komitas, 0012, Yerevan
Tel: (+37410) 266196, [email protected]

A
r
m
e
c
o
m
o
n
i
t
o
r
i
n
g
-
Ministry of Nature Protection RA
«Environmental Impact Monitoring Center » (Armecomonitoring) GNCO MNP RA
QC/QA group
2 specialists
3 Analytical groups Spectrophotometric Analytical groups: Total 8 specialists
4 specialists Water analysis
Chromatographic Analytical groups: Total 5 specialists
Water analysis
Physica-chemical Analytical groups: Total 7 specialists
Water analysis
Soil Monitoring Program Precepitat Monitoring
Programm Air Monitring Program Surface Water
Monitoring Program Manager
Information Department 3 specialists
Hydromorphological Monitoring Group Contract until 31.12.2012
2 specialist
Hydrobiological Monitoring Group
Contract until 31.12.2012 5 specialist
Director Armecomonitoring
Financial Department
Procurement Department
Vice Director Comercial Sector
Vice Director Scientific and
Development sector
Technical and Engenering group
4 specialists

Water Quality Monitoring in Armenia
Armecomonitoring Six primary River Basin management areas, 14 River Basin
50 Rivers, 6 Lakes and dams
Observation points-140
Sample Frequencies 7-12
Total Number of Samples in Year-1300-1500
Water quality parameters 45-60
95% of sampling, transport, pre-treatment and analysis by ISO standards
A
r
m
e
c
o
m
o
n
i
t
o
r
i
n
g

Date base
In Situ, YSI-560, WTW
3401 Spectrophotometrical, Shimadzu 1650
Gas Chromatograph
Varyan 3870,
Information group
BOD, COD, Si, NO2
-NO3-, NH4+,
Chlorinated pesticide, Oli
Metals, ICP MS ELAN 9000 Anions- DIONIX 1000
(NO3-PO4
- , SO4-, Cl-, Br- )
Water monitoring program Manager
Physic-chemistry
DO, DO%, pH, Conductivity,
TDS, T
, ,

WFD PRIORITY SUBSTANCES (organic micropolutants) 33 OTHER SPECIFIC POLLUTANTS 8 Microbiological and biological parameters 1(12) Radioactivity 2 Other specific parameters 7
The new Surface Water Qulity Standarts in Armena Parameter (group) 104 (115)
Oxygen regime 4 Termal condition 1 Salinity 5 Nutrients 9 Acidification 2 Other parameters 5 Metalls (Metalls dissolved and total13) 28
Government of Armenia Resolution No 75-N of January 27, 2011 On Definitation of Water Quality Norms for Each Water Basin Management
Area, Taking Into Consideration the Peculiarities of the Territory

6
Comparison of MACs and background concentrations
DO, Al, B, V, Cu, Si
Background concentration > MAC I group
BOD5, pH, Cr Background concentration ~ MAC II group
COD, TDS, SS, P, NH4
+, NO2-, NO3
-, PO4
3-, Zn, As, Cd, Pb, Ni, Mo, Mn, Co, Fe, Ca, Mg, Ba, K, Na,
Se, Cl-, SO42-
Background concentration < MAC III group

A
r
m
e
c
o
m
o
n
i
t
o
r
i
n
g
Water quality parameters
MAC for fish
life
Statistical method Maximum concentration method
Meghri Voghji Geghi Vorotan Meghri Voghji Geghi Vorotan
BOD5, mgO2/l 3 2.41 2.69 2.23 2.28 2.21 2.33 2.13 2.31
CODCr, mgO2/l 30 13.54 11.14 11.27 10.34 13.33 12.26 11.49 10.88
NH4-N, mg/l 0.39 0.03 0.02 0.02 0.02 0.1 0.06 0.12 0.18
NO2-N, mg/l 0.024 0.009 0.005 0.006 0.007 0.014 0.007 0.011 0.009
NO3-N, mg/l 9 0.63 0.19 0.21 0.33 1.27 0.21 0.46 0.54
Zn (total), ug/l 10 2 3 1 2 4 5 3 5
Cu (tot.), ug/l 1 4 4 2 2 5 5 2 4
Cr (total), ug/l 1 0. 5 0. 5 0.5 0.5 1.16 0. 80 0. 82 0. 9
Cd (tot.), ug/l 5 0. 04 0. 1 0. 04 0. 01 0. 05 0. 20 0. 06 0. 02
Pb (total), ug/l 10 0.2 0.1 0.1 0.1 0.3 0.2 0.3 0.3
Ni (total), ug/l 10 0.6 0.8 0.5 0.5 1 3.5 0.8 0.6
Mn (tot.), ug/l 10 4 4 5 4 9.1 4.5 12 5
V (total), ug/l 1 1 0.4 1 8 1.3 0.6 1.5 10
Co (tot.), ug/l 10 0.1 0.1 0.1 0.15 0.2 0.1 0.2 0.15
Fe (total), ug/l 50 0.07 0.03 0.06 0.09 0.21 0.06 0.24 0.14
B (total), ug/l 18 90 32 16 5 126 67 24 5

A
r
m
e
c
o
m
o
n
i
t
o
r
i
n
g
IWRM Academy Training Course, 12-14 April, 2012, Tsaghkadzor, Armenia
2
1
4
5
3
7
1
1ug/l=0.2” As (total), мкг/л 0.89 20 50 100 >100

Groups of pollutants identified according to MACs and new norms (Meghri River example)
Site no Sampling site
Groups of pollutants identified
according to MACs
Index method based on II class of the new
system
(MAC∼Value II class)
Assessment of chemical sta of the
new system tus
319 source
SS, NH4+, Al, Mn,
BOD5, NO2-, Cu, Zn, V,
Cr, Se, B
SS, NH4+, Al, Mn
Water quality class II
89 Above
Meghri city
SS, NH4+, Mn, Al, BOD5,
Cu, Zn, V, Cr, Se, B SS, Al, Mn, Fe, SO4
2-, NH4
+, Cl-, Na,NO3-
SS, Al, Mn, Fe, SO42-,
90 River mouth
SS, NH4+, Al, Mn, BOD5,
NO2-, Cu, Zn, V, Cr, Se,
B
SS, SO42-, Al, Mn, Fe,
Cl-, Na, NO3-, P, NH4
+, NO2
-
SS, Al, Mn, Fe, SO42-,
Clarification of group of pollutants
Clarification of pressure nature and factors Clarification of measures
to improve the quality Water quality
management is improved and becomes more efficient

A
r
m
e
c
o
m
o
n
i
t
o
r
i
n
g
Do the estimated values for the biological quality elements meet reference conditions?
Do the physico-chemical conditions meet high status?
Do the hydro-morphological conditions meet high status?
Do the estimated values for the biological quality elements deviate only slightly from reference conditions?
Classify as high status
Do the physico-chemical conditions (a) ensure ecosystem functioning and (b) meet the EQSs for specific pollutants?
Classify on the basis of the biological deviation from reference conditions
Is the deviation moderate?
Classify as good status
Classify as bad status
Is the deviation major?
Classify as poor status
Classify as moderate status
Yes Yes Yes
No
No
Yes
Yes
Yes
Yes
No
Greater
No No
EU Guidance 10 [EU, 2003]
Классификация для статуса поверхностных водных объектов в соответствии с РВД

Proposal for location and type of monitoring stationsProposal for location and type of monitoring stations: Operational : Operational monmon..: Surveillance : Surveillance monmon. yearly. yearly
: Surveillance : Surveillance monmon..every 3every 3rdrd yearyear
: Reference : Reference monmon..
19a19a
: Transport : Transport monmon. .
1212A
77
991010
TT
1111
88
44
55
66
3322
A : Indicates which parameters that : Indicates which parameters that are included in the operational are included in the operational monmon..
D
E
E
C
C
ECC
DA
B11
17a17a
17b17b
17c17c
19b19b 2222
2323
252527272424
26262828
2929
3131
3030
1818
3232
3333 3434
3535
3636
2121 2020
3939
1515
32a32a
EU Tacis Project: Trans-Boundary River Management Phase III for the Kura River basin – Armenia, Georgia, Azerbaijan

WFD The Water Quality Elements for Rivers

The Water Quality Elements for Rivers
20 September, Yerevan,

Phytoplankton
EU Tacis Project: Trans-Boundary River Management Phase III for the Kura River basin – Armenia, Georgia, Azerbaijan

Beatis11
Chironomidae_pupa-04
Ecdyonurus9
Tipula12

HYDROMORPHOLOGICAL QUALITY ELEMENTS
Continuity Number, location and possibility to cross barriers, Accessibility/connectivity to fish
Hydrological regime Water level Discharge, current of velocity
Morphological conditions Variation of depth and width of river Structure and substrate of the river bed Structure of the riparian zone


Category Parameter SSU1 SSU2 SSU3 SSU4 SSU5 SU Score L R L R L R L R L R
1 Channel 1.1 Channel sinuosity 1.2 Channel type 1.3 Channel shortening Channel planform score, CPS: (1.1+1.2+1.3)/3
2 In-stream 2.1 Bed elements1)
BA/IS/RI/RA/RO/SP
BA/IS/RI/RA/RO/SP
BA/IS/RI/RA/RO/SP
BA/IS/RI/RA/RO/SP
BA/IS/RI/RA/RO/SP
2.2 Substrate2)
BE/BO/CO/GR/SA/CD
BE/BO/CO/GR/SA/CD
BE/BO/CO/GR/SA/CD
BE/BO/CO/GR/SA/CD
BE/BO/CO/GR/SA/CD
MD/CL/PE
MD/CL/PE
MD/CL/PE
MD/CL/PE
MD/CL/PE
2.3 Variation in width3) W: S: W: S: W: S: W: S: W: S:
2.4 Flow types4) FF/CH/CA/BS/US/RP/UP
FF/CH/CA/BS/US/RP/UP
FF/CH/CA/BS/US/RP/UP
FF/CH/CA/BS/US/RP/UP
FF/CH/CA/BS/US/RP/UP
SM/NO SM/NO SM/NO SM/NO SM/NO 2.5 Large woody debris5) Number: Number: Number: Number: Number:
2.6 Artificial bed features Instream feature score, IFS: (2.1+2.2+2.3+2.4+2.5+2.6)/6
3 Bank and riparian
3.1 Riparian vegetation 3.2 Bank stabilisation 3.3 Bank profile Bank and riparian score, BRS: (3.1+3.2+3.3)/3
4 Floodplain 4.1 Flooded area 4.2 Natural vegetation Floodplain score, FPS: (4.1+4.2)/2
Hydromorphological Quality Score (CPS+IFS+BRS+FPS)/4
Hydromorphology - Joint Field Surveys – KURA III ASSESSMENT FORM – Structural features Stream / River name: Site name: Date: Surveyor:
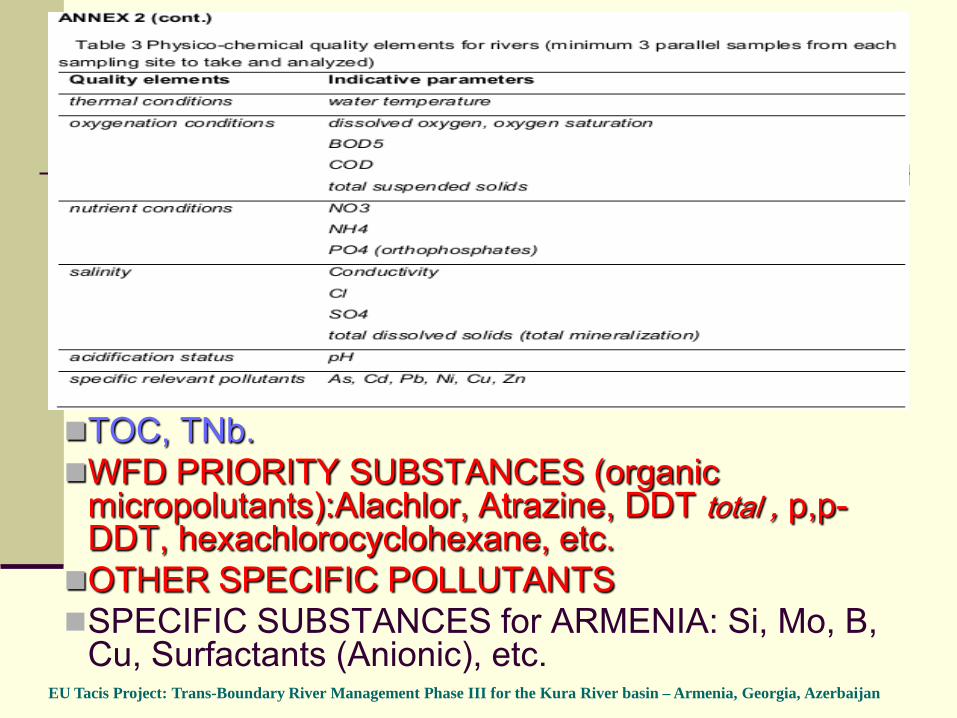
TOC, TNb. WFD PRIORITY SUBSTANCES (organic
micropolutants):Alachlor, Atrazine, DDT total , p,p-DDT, hexachlorocyclohexane, etc. OTHER SPECIFIC POLLUTANTS SPECIFIC SUBSTANCES for ARMENIA: Si, Mo, B,
Cu, Surfactants (Anionic), etc. EU Tacis Project: Trans-Boundary River Management Phase III for the Kura River basin – Armenia, Georgia, Azerbaijan

EU Tacis Project: Trans-Boundary River Management Phase III for the Kura River basin – Armenia, Georgia, Azerbaijan

Tbilisi, 1 March 2012 21
QA/QC in laboratory analysis
9.60
9.80
10.00
10.20
10.40
10.60
10.80
11.00
Average
Upper control level
Upper warning level
Lowe control level
Lower warning level
Con
c., m
g/l
Chloride
6.00
7.00
8.00
9.00
10.00
11.00
12.00
Average
Upper control level
Upper warninglevel
Lowe control level
Lower warninglevel Con
c., µ
mg/
l
Cu

Workshop on WFD Assessment and Monitoring Training;29-31 October, 2012; Batumi, Georgia
Performance of Laboratory Parameter Laboratory 1 Laboratory 2 Laboratory 3
1st 2nd 3rd 4th 1st 2nd 3rd 4th 1st 2nd 3rd 4th Ammonium
Nitrate Nitrite N/A N/
A N/A
Orthophosphate
Heavy metals As N/
A N/A
N/A
N/A
Cd N/A
N/A
N/A
N/A
Cu Ni Pb Zn
Results from four inter-laboratory testing exercises. EU Kura project. Armenia, Georgia, Azerbaijan

A
r
m
e
c
o
m
o
n
i
t
o
r
i
n
g
Water quality analysis
Annual monitoring expences
Implementation of water quality goals
EXCELLENT
GOOD
MODERATE
POOR
BAD
Water quality basic parameters
Including heavy metal parameters
Including specific organic parameters (WFD)
A
r
m
e
c
o
m
o
n
i
t
o
r
i
n
g
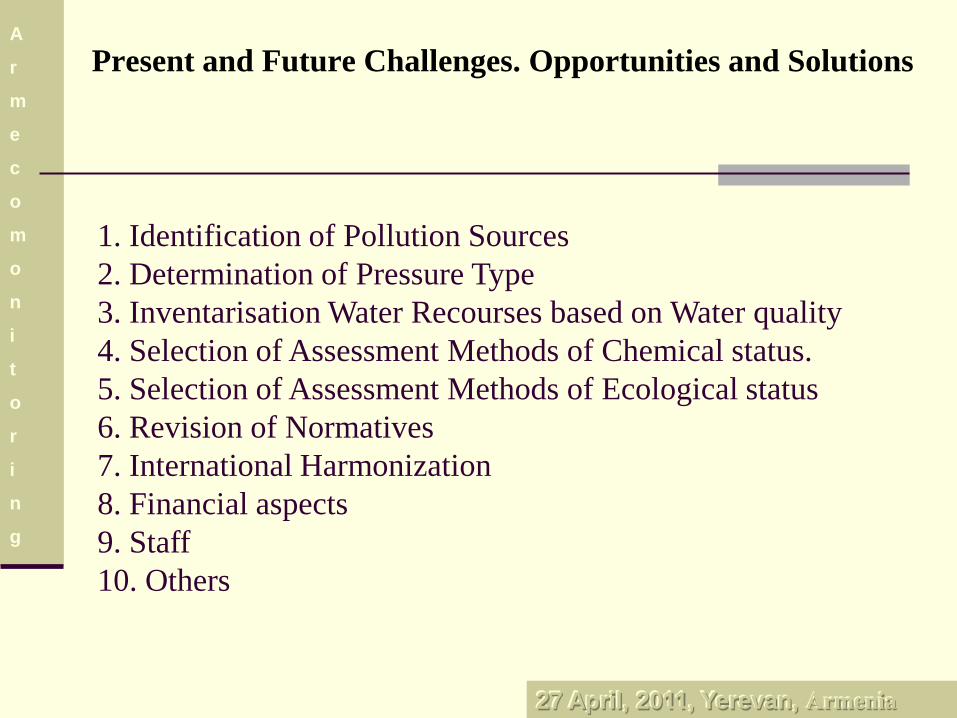
Present and Future Challenges. Opportunities and Solutions
1. Identification of Pollution Sources 2. Determination of Pressure Type 3. Inventarisation Water Recourses based on Water quality 4. Selection of Assessment Methods of Chemical status. 5. Selection of Assessment Methods of Ecological status 6. Revision of Normatives 7. International Harmonization 8. Financial aspects 9. Staff 10. Others
27 April, 2011, Yerevan, Armenia
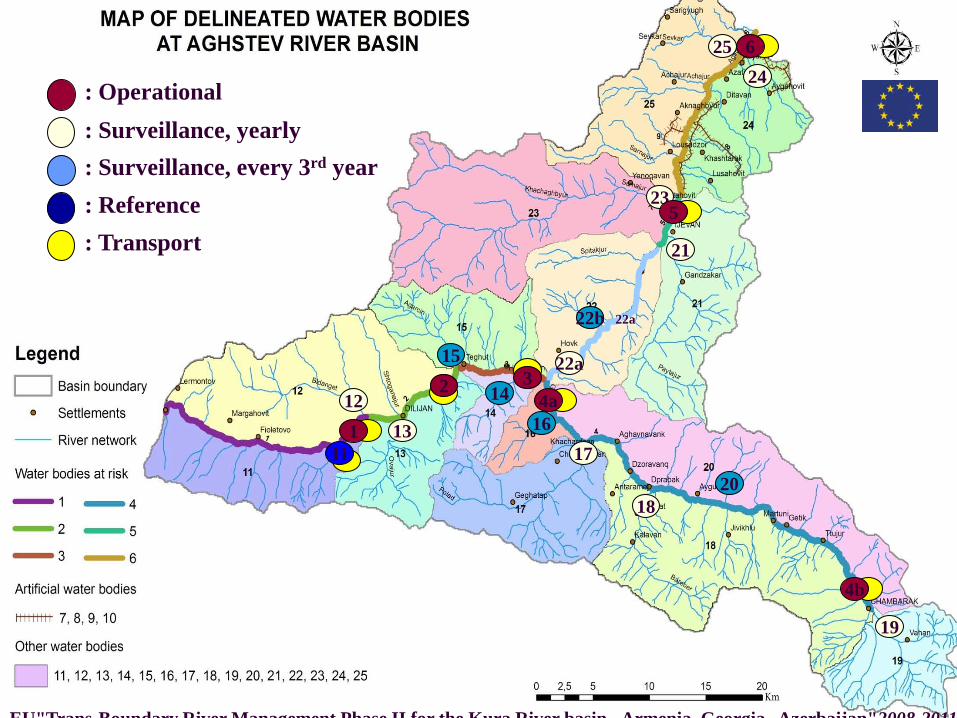
22a
12 13
14
23
22a
22b
15
19
18 20
17 16
21
: Operational
: Surveillance, yearly
: Surveillance, every 3rd year
: Transport
6
: Reference
25 24
5
4b
4a 3 2
1 11
EU"Trans Boundary River Management Phase II for the Kura River basin Armenia Georgia Azerbaijan"2008 2011

Water Quality Monitoring in Armenia
Armecomonitoring Six primary River Basin management areas,
95% of sampling, transport, pre-treatment and analysis by ISO standards
A
r
m
e
c
o
m
o
n
i
t
o
r
i
n
g

+ Biological + Hydromorphological
Chemical
Biological + Chemical + Hydromorphological
WFD Monitoring
Presence
Development
130% 117000
33400 150400 Euro
30% 100%
Frequency for hydrobiological monitoring 4 times every year

THANK YOU FOR YOUR ATTENTION!
Workshop on WFD Assessment and Monitoring Training;29-31 October, 2012; Batumi, Georgia

A
r
m
e
c
o
m
o
n
i
t
o
r
i
n
g
0.000
0.005
0.010
0.015
0.020
0.025
0.030
0.035
0.040
0.045
0.050
0.055
0.060
3-4.
01.2
010
12-1
3.01
.201
0 17
-19.
01.2
010
25-2
6.01
.201
0 27
.01.
2010
28
-29.
01.2
010
11-1
2.02
.201
0 22
.02.
2010
24
-25.
02.2
010
25-2
6.02
.201
0 4.
03.2
010
18.0
3.20
10
30-3
1.03
.201
0 2-
3.04
.201
0 3-
4.04
.201
0 7-
8.04
.201
0 8.
04.2
010
10.0
4.20
10
11.0
4.20
10
19.0
4.20
10
22.0
4.20
10
23-2
4.04
.201
0 24
-25.
04.2
010
25.0
4.20
10
27-2
8.04
.201
0 28
.04.
2010
29
.04.
2010
30
.04-
1.05
.201
0 02
-03.
05.2
010
03.0
5.20
10
04.0
5.20
10
05.0
5.20
10
06.0
5.20
10
08.0
5.20
10
09.0
5.20
10
10.0
5.20
10
11-1
2.05
.201
0 17
.05.
2010
19
.05.
2010
20
-21.
05.2
010
21.0
5.20
10
22-2
3.05
.201
0 28
.05.
2010
30
-31.
05.2
010
16-1
7.06
.201
0 19
-20.
06.2
010
02.0
7.20
10
14.0
7.20
10
15.0
7.20
10
16-1
7.07
.10
17.0
7.20
10
22-2
3.07
.201
0 23
-24.
07.2
010
24.0
7.20
10
7.08
.201
0 11
.08.
2010
26
.08.
2010
8.
07.2
010
8.11
.201
0 8.
26.2
010
01.1
0.20
10
01.1
0.20
10
02.1
0.20
10
03.1
0.20
10
04.1
0.20
10
05.1
0.20
10
06.1
0.20
10
08.1
0.20
10
11.1
0.20
10
14.1
0.20
10
15.1
0.20
10
16.1
0.20
10
17.1
0.20
10
21.1
0.20
10
25.1
0.20
10
29.1
0.20
10
30.1
0.20
10
12.1
2.20
10
13.1
2.20
10
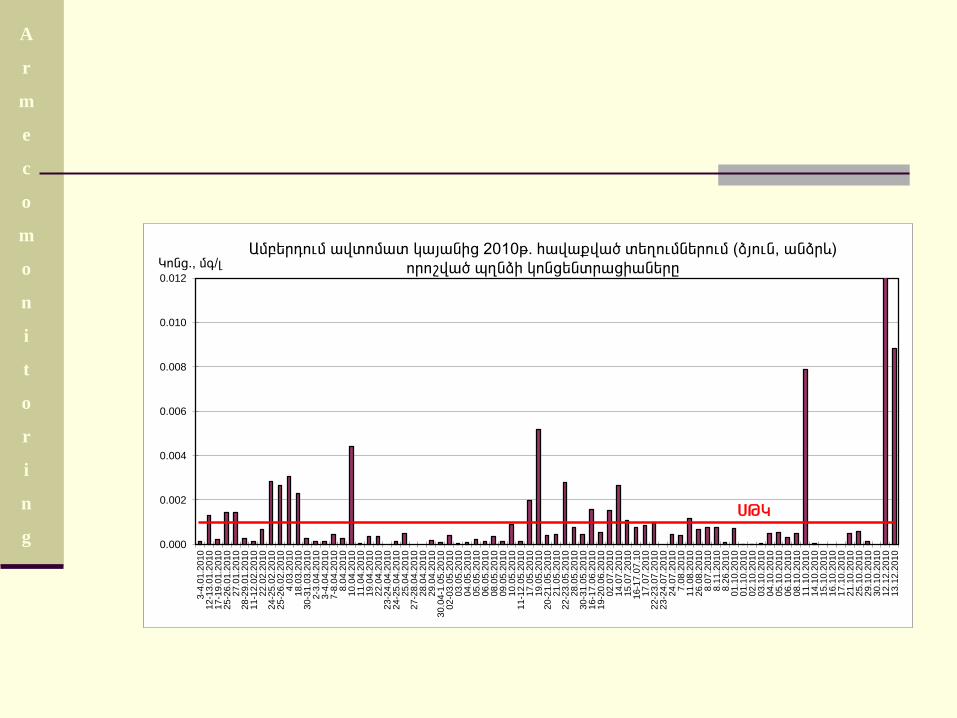
²Ùµ»ñ¹áõÙ ³íïáÙ³ï ϳ۳ÝÇó 2010Ã. ѳí³ùí³Í ï»ÕáõÙÝ»ñáõÙ (ÓÛáõÝ, ³ÝÓñ¨) áñáßí³Í óÇÝÏÇ ÏáÝó»Ýïñ³ódzݻñÁ ÎáÝó., Ù·/É
êÂÎ
A
r
m
e
c
o
m
o
n
i
t
o
r
i
n
g 0.000
0.002
0.004
0.006
0.008
0.010
0.012
3-4.
01.2
010
12-1
3.01
.201
0 17
-19.
01.2
010
25-2
6.01
.201
0 27
.01.
2010
28
-29.
01.2
010
11-1
2.02
.201
0 22
.02.
2010
24
-25.
02.2
010
25-2
6.02
.201
0 4.
03.2
010
18.0
3.20
10
30-3
1.03
.201
0 2-
3.04
.201
0 3-
4.04
.201
0 7-
8.04
.201
0 8.
04.2
010
10.0
4.20
10
11.0
4.20
10
19.0
4.20
10
22.0
4.20
10
23-2
4.04
.201
0 24
-25.
04.2
010
25.0
4.20
10
27-2
8.04
.201
0 28
.04.
2010
29
.04.
2010
30
.04-
1.05
.201
0 02
-03.
05.2
010
03.0
5.20
10
04.0
5.20
10
05.0
5.20
10
06.0
5.20
10
08.0
5.20
10
09.0
5.20
10
10.0
5.20
10
11-1
2.05
.201
0 17
.05.
2010
19
.05.
2010
20
-21.
05.2
010
21.0
5.20
10
22-2
3.05
.201
0 28
.05.
2010
30
-31.
05.2
010
16-1
7.06
.201
0 19
-20.
06.2
010
02.0
7.20
10
14.0
7.20
10
15.0
7.20
10
16-1
7.07
.10
17.0
7.20
10
22-2
3.07
.201
0 23
-24.
07.2
010
24.0
7.20
10
7.08
.201
0 11
.08.
2010
26
.08.
2010
8.
07.2
010
8.11
.201
0 8.
26.2
010
01.1
0.20
10
01.1
0.20
10
02.1
0.20
10
03.1
0.20
10
04.1
0.20
10
05.1
0.20
10
06.1
0.20
10
08.1
0.20
10
11.1
0.20
10
14.1
0.20
10
15.1
0.20
10
16.1
0.20
10
17.1
0.20
10
21.1
0.20
10
25.1
0.20
10
29.1
0.20
10
30.1
0.20
10
12.1
2.20
10
13.1
2.20
10
²Ùµ»ñ¹áõÙ ³íïáÙ³ï ϳ۳ÝÇó 2010Ã. ѳí³ùí³Í ï»ÕáõÙÝ»ñáõÙ (ÓÛáõÝ, ³ÝÓñ¨) áñáßí³Í åÕÝÓÇ ÏáÝó»Ýïñ³ódzݻñÁ ÎáÝó., Ù·/É
êÂÎ
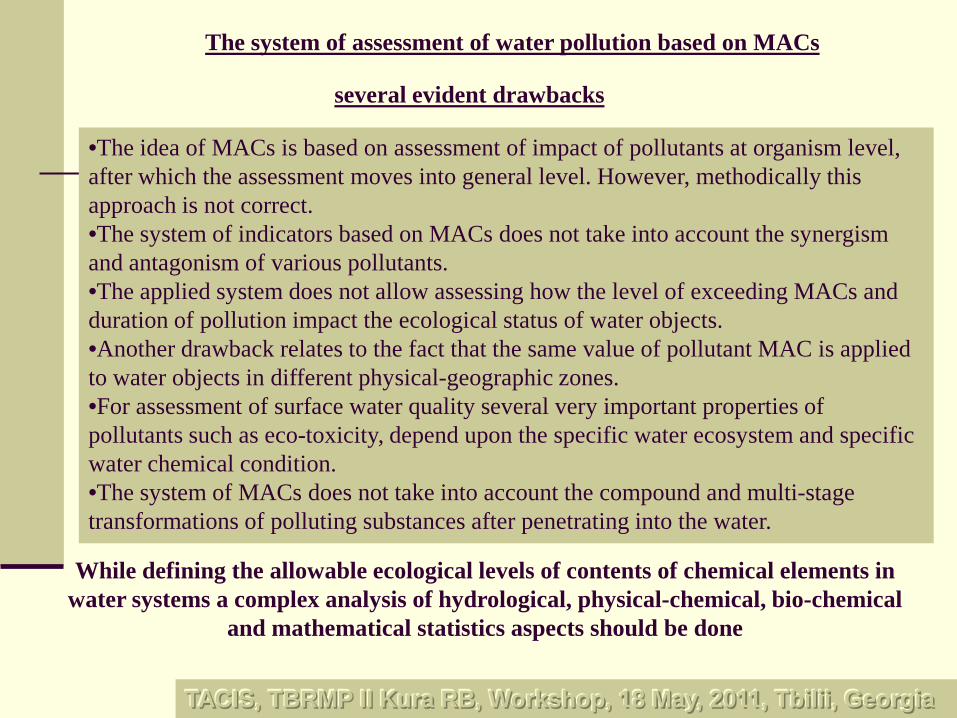
•The idea of MACs is based on assessment of impact of pollutants at organism level, after which the assessment moves into general level. However, methodically this approach is not correct. •The system of indicators based on MACs does not take into account the synergism and antagonism of various pollutants. •The applied system does not allow assessing how the level of exceeding MACs and duration of pollution impact the ecological status of water objects. •Another drawback relates to the fact that the same value of pollutant MAC is applied to water objects in different physical-geographic zones. •For assessment of surface water quality several very important properties of pollutants such as eco-toxicity, depend upon the specific water ecosystem and specific water chemical condition. •The system of MACs does not take into account the compound and multi-stage transformations of polluting substances after penetrating into the water.
While defining the allowable ecological levels of contents of chemical elements in water systems a complex analysis of hydrological, physical-chemical, bio-chemical
and mathematical statistics aspects should be done
The system of assessment of water pollution based on MACs
several evident drawbacks
TACIS, TBRMP II Kura RB, Workshop, 18 May, 2011, Tbilii, Georgia