e biz 110427 061 slide¬e revised - advantest
TRANSCRIPT
Advantest CorporationAdvantest Corporation
Information MeetingInformation Meeting
April 27, 2011April 27, 2011
HaruoHaruo MatsunoMatsunoRepresentative DirectorRepresentative Director
President and CEOPresident and CEO

All Rights Reserved - Advantest Corporation3 2011/4/27
Returned to profitability for the first time in 3 years
Financial Results for Fiscal 2010

All Rights Reserved - Advantest Corporation4 2011/4/27
(¥B)
FY
Results
FY 2010
Y on Y(%)
Q on Q(%)
ResultsGuidance
(as of Jan.)
4Q3Q2Q1Q Guidance
(as of Jan.)
Non-operating Income
Orders
Income before Tax
Cost of Sales
Gross Profit
Operating Income
Backlog
Net Income
Sales
15.3
3.5
5.8
-
6.5
-
-
100.0
95.0
29.6
3.25.6
-0.56.1
48.551.1
99.6109.0
+46.1
-
-
-
-
+86.9
+87.4
+87.2
+60.9
+63.3
-
-59.5
-
-13.2
+57.3
29.6
-0.1
0.5
0.3
0.2
11.3
10.8
22.1
33.6
15.3
0.2
0.7
-
0.5
-
-
22.5
19.6
18.2
0.7
1.0
-0.2
1.2
11.9
13.5
25.4
21.3
22.3
1.8
2.5
-0.4
2.9
13.7
14.9
28.6
23.3
27.6
0.8
1.6
-0.2
1.8
11.6
11.9
23.5
30.8
FY 2009
-11.5
-9.9
1.7
-11.6
25.9
27.3
53.2
20.3
67.7
-20.1
-5.3
-87.0
Summary of ResultsSummary of Results
○ Results for FY2010:
・Orders 109 billion yen,improved by a significant 61% year-on-year.4Q orders were especially strong, led by non-memory testers.
・Sales 99.6 billion yen,also up a significant 87% year-on-year,despite a slight drop-off in 2H, following the 2Q peak,as the DRAM market softened.
・Operating Income 6.1 billion yen・Net Income 3.2 billion yen
○ Advantest returned to profitability in FY2010 for the first timein 3 years.
・Backlog 29.6 billion yenIncreased significantly from 2010 Q4 by order increase
○ Due to the unclear visibility beyond 2011 Q1, Advantest has not announced guidance for FY2011 at this time. Forecasts will be announced as available.

All Rights Reserved - Advantest Corporation5 2011/4/27
0
(¥B)
30.8
21.6
5.8
3.7
FY20092Q 4Q1Q 3Q
FY20101Q
33.633.6
26.2
4.8
3.74Q4Q
23.3
17.1
3.73.02Q
21.3
11.6
6.5
3.63Q
11.6
7.4
1.72.5
14.418.7
23.0
7.7
4.7
2.9
12.1
4.4
3.4
15.3
4.0
4.2
+80%
FY20100
(¥B)
76.5
20.8
109.0109.0
FY200914.0
Memory14.5
Non-Memory28.0
Memory30.8
Non-Memory45.7
67.7
42.5
14.813.0
+40%
Semiconductor & Component Test Systems
MechatronicsSystems
Services, Support & Other
Note: Intersegment transactions have been eliminated from totals
Orders Orders by Business Segmentby Business Segment
○ FY2010 Orders by Business Segment:
○ Semiconductor and Component Test Systems:・76.5 billion yen, up 80% from the previous fiscal year
・Non-Memory Testers・The T2000 for MPU saw strong orders.
・Memory testers・Supported by strong PC DRAM order in 1H, while mobile
DRAM demand growth picked up in 2H.
○ Mechatronics Systems:・20.8 billion yen, up 40% from the previous fiscal year
・Orders for device interfaces tracked robust tester orders.
・Test handler demand in the analog segment was healthy.

All Rights Reserved - Advantest Corporation6 2011/4/27
0
(¥B)
2Q 4Q1Q 3Q 4Q4Q
33.633.6
88.8 %88.8 %
3.8
4.8
9.1
6.6
5.2
1Q
30.883.5 %83.5 %
5.1
7.6
3.02.3
8.7
2Q
23.374.3 %74.3 %
6.0
4.1
1.43.0
5.8
3Q
21.367.8 %67.8 %
6.8
3.3
2.6
5.8
1.7
FY2009 FY2010
4.1 3.01.1
4.1
Japan
Americas
South KoreaTaiwanChina
Others
11.614.4
18.723.0
82.2 %82.2 %79.2 %79.2 %
81.2 %81.2 %
79.0 %79.0 %
1.9
1.42.11.5
2.1
2.6
3.02.6
4.60.61.3
2.3
3.52.04.2
3.81.14.1
4.8
6.9
5.11.32.12.8
FY20100
(¥B)
21.7
109109..00
FY2009
16.1
19.8
21.4
17.7+150%Americas
+62%Japan
80.1 %80.1 %
12.3
6.4
80.2 %80.2 %
6767..7713.412.916.0
7.211.8
Overseas Orders as % of Total Orders
Orders Orders by Regionby Region
○ FY2010 Orders by Region:
・Orders from the Americas, Japan, and other regions increased.
○ Americas:・16.1 billion yen, up 150% from the previous fiscal year,
driven by the T2000 for MPU test
○ Japan:・21.7 billion yen, up 62% from the previous year,
driven by mobile DRAM memory tester demand growth

All Rights Reserved - Advantest Corporation7 2011/4/27
(¥B)
22.122.1
15.1
4.4
3.7
23.5
15.8
4.0
3.9
28.6
20.2
5.7
3.3
25.4
18.2
4.4
3.3
FY2009 FY2010
FY20100
(¥B)
69.3
18.5
99.699.6
32.611.2
53.2
FY200911.8 14.2
Memory12.4
Non-Memory20.2
Memory30.0
Non-Memory39.3
+113%
7.6
11.212.9
21.5
4.11.42.2
7.1
2.12.7
7.2
3.9
2.9
14.2
3.8
4.0
Note: Intersegment transactions have been eliminated from totals
Semiconductor & Component Test Systems
MechatronicsSystems
Services, Support & Other
Sales Sales by Business Segmentby Business Segment
02Q 4Q1Q 3Q 4Q4Q1Q 2Q 3Q
○ FY2010 Sales by Business Segment:
○ Semiconductor and Component Test Systems:・69.3 billion yen, up 113% from the previous fiscal year
・Sales of non-memory testers in the MPU and MCU segmentswere robust.
・Memory tester sales also doubled from the previous fiscal yearon increasing mobile and PC DRAM capex.

All Rights Reserved - Advantest Corporation8 2011/4/27
0
(¥B)
4Q4Q
56
23.578.7 %78.7 %
5.0
5.5
4.3
2.72.3
28.682.5 %82.5 %
5.0
7.7
1.72.6
7.1
22.122.15.6
4.0
2.7
3.1
4.8
74.8 %74.8 %25.473.2%73.2%
6.8
3.6
2.6
4.8
5.6
2Q 4Q1Q 3Q 1Q 2Q 3QFY2009 FY2010
3.7 4.52.0
1.9
Japan
Americas
South KoreaTaiwanChina
Others
74.0 %74.0 %
7.6
11.212.9
80.0 %80.0 %
21.5
76.7%76.7%
75.9 %75.9 %
2.01.3 0.9
0.41.11.9
2.72.01.11.9
2.11.4
3.0
2.1
3.30.61.3
2.6
4.3
4.9
7.5
1.8
1.91.1
FY20100
(¥B)22.499.699.6
FY2009
9.3
20.8
21.8
13.2
12.053.2
4.9
10.312.8
8.5
77.5 %77.5 %
77.5%77.5%
4.712.1
+160%
+101%
South Korea
China
Overseas Sales as % of Total Sales
Sales Sales by Regionby Region
○ FY2010 Sales by Region:
・Sales in all regions increased
・Sales growth in the East Asia region, where most memorychips are manufactured, was especially marked.

All Rights Reserved - Advantest Corporation9 2011/4/27
(¥B)
FY2009 FY2010
11.1
0.20.21.8
9.8
2.9
10.8
1.2
10.7
FY2009 FY2010Gross Profit Ratio 48.7% 48.6 %Operating Expenses 37.5 42.4Operating Income -11.6 6.1
8.8
-4.5
9.3 9.3
-3.5 -5.0
10.1
1.41.4
● ● ●46.8%47.9%49.3%
51.0%●
Operating Expenses
Operating Income
Operating Expenses and IncomeOperating Expenses and IncomeGross Profit Ratio
(¥B)0
2Q 4Q1Q 3Q 4Q4Q1Q 2Q 3Q
○ FY2010 Operating Income / Gross Profit Ratio / Operating Expenses
・Gross Profit Ratio:48.6%, flat from the previous fiscal year
・Operating Expenses:Tracked sales growth at 42.4 billion yen, up 13% from the previous fiscal year
・Operating Income 6.1 billion yen, an improvement of 17.7 billion yenover the previous fiscal year
○ Advantest returned to profitability in FY2010.

All Rights Reserved - Advantest Corporation10 2011/4/27
0
(¥B)
FY2009
2Q 4Q1Q 3Q
FY20104Q4Q
5.65.6
1Q
4.9
1.71.70.3 1.11.11.0
25.2%25.2%
21.0 %21.0 %
2Q
5.418.9 %18.9 %
1.01.0
3Q
5.320.8 %20.8 %
0.81.1
FY2009 FY2010R&D Expenses 17.9 21.2CapEx 3.4 3.8Depreciation 4.3 4.2
(¥B)
4.457.9 %57.9 %
4.338.6 %38.6 %
0.30.9 1.0
0.8
4.332.9 %32.9 %
1.21.3
4.922.9%22.9%
1.11.1
Depreciation
R&D Expenses
CapEx
R&D Expenses as % of Total Sales
R&D Expenses/R&D Expenses/CapExCapEx/Depreciation/Depreciation
○ FY2010 R&D Expenses:・21.2 billion yen, up 18% from the previous fiscal year
・As a technology company, Advantest is committed toa consistent level of R&D investment.
○ CapEx:・3.8 billion yen, restrained to approximately the same level
as the previous fiscal year
・Investment primarily went to facility upgrades for enhanced R&D and production efficiency.
All Rights Reserved - Advantest Corporation11 2011/4/27
0
(¥B)
23.5
180.3180.3
88.0
3.0
31.9
11.2
22.715.9
188.7
106.9
16.6
32.9
12.1
4.3
19.7
187.3
100.6
19.5
32.0
11.5
4.0
25.1
183.0
89.3
22.2
32.0
11.0
3.4
25.7
183.2
87.2
24.2
31.6
11.1
3.4
Cash & Cash Equivalents+ Short-termInvestments
TradeReceivables
Inventories
Property,Plant & Equipment
Other Assets
Other Current Assets
Mar. 31‘10
Jun. 30‘10
Sep. 30‘10
Dec. 31‘10
Mar. 31Mar. 31‘‘1111
Balance Sheet Balance Sheet AssetsAssets
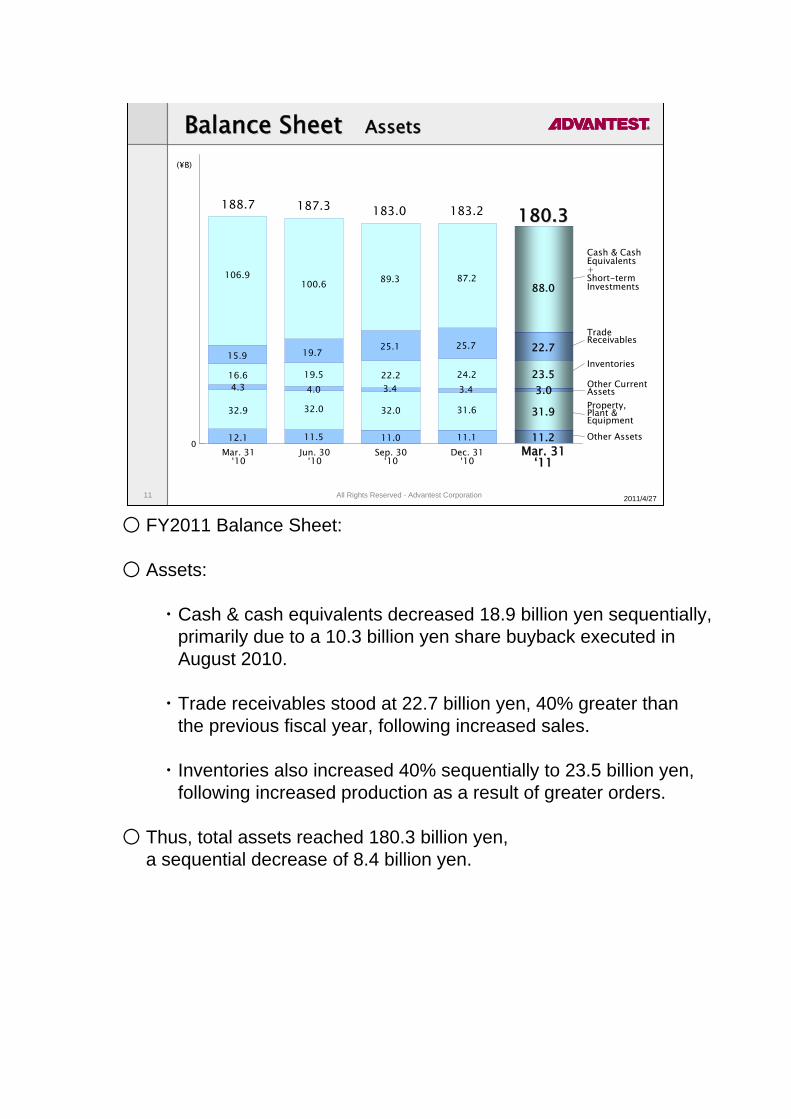
○ FY2011 Balance Sheet:
○ Assets:
・Cash & cash equivalents decreased 18.9 billion yen sequentially,primarily due to a 10.3 billion yen share buyback executed inAugust 2010.
・Trade receivables stood at 22.7 billion yen, 40% greater thanthe previous fiscal year, following increased sales.
・Inventories also increased 40% sequentially to 23.5 billion yen,following increased production as a result of greater orders.
○ Thus, total assets reached 180.3 billion yen, a sequential decrease of 8.4 billion yen.

○ FY2011 Balance Sheet:
○ Liabilities & Equity:
・Equity was 138.1 billion yen, a decrease of 12.1 billion yensequentially, primarily due to the share buyback executed inAugust 2010.
・Equity-to-assets ratio:down 3 points from the previous fiscal year to 76.6%
This completes our discussion of financial results for FY2010.
All Rights Reserved - Advantest Corporation12 2011/4/27
0
187.3
74.6
9.414.0
16.4
40.5
32.4
188.7
77.3
10.611.4
16.5
40.5
32.4
(¥B)
180.3180.312.811.7
17.7
40.6
32.4
65.1
183.0
65.3
10.817.5
16.5
40.5
32.4
183.2
64.4
10.816.3
18.7
40.6
32.4
(¥B)
Equity
Equity-to-Assets Ratio
Mar. 31‘10
Jun. 30‘10
Sep. 30‘10
Dec. 31‘10
Mar. 31Mar. 31‘‘1111
CommonStock
Retained Earnings and others
Capital Surplus
OtherCurrentLiabilitiesNon-currentLiabilities
TradeAccountsPayable
Balance Sheet Balance Sheet Liabilities & EquityLiabilities & Equity
78.7%147.5
75.0%137.4
79.6%150.2
76.6%75.5%138.1138.2
All Rights Reserved - Advantest Corporation13 2011/4/27
FY2011 OutlookEntering a New Growth PhaseEntering a New Growth PhaseLeveraging Existing StrengthsLeveraging Existing Strengths

All Rights Reserved - Advantest Corporation14 2011/4/27
FY2011FY2011 Principal PoliciesPrincipal Policies
11 Improve Semiconductor Tester Market ShareImprove Semiconductor Tester Market Share
22 Further Improve ProfitabilityFurther Improve Profitability
33 Cultivate New Businesses for Consistent GrowthCultivate New Businesses for Consistent Growth
・Memory Testers
・Non-Memory Testers
Maintain Dominant Share
Exploit Growing T2000 Coverage to Gain Share
・Conversion of design assets into shorter R&D lead times
・Procurement optimization and a globalized manufacturing structure
・Lower production costs, ongoing administrativecost control efforts
○ In FY 2010, memory tester revenues were slightly weaker thanexpected, owing to the slowdown in the PC market and softeningDRAM prices. However, non-memory tester revenues were robust,contributing to solid results for Advantest overall.
○ In FY2011, the global economy is expected to grow at a healthypace, despite uncertainty linked to the economic impact of the Great Eastern Japan Earthquake.Advantest sees a business environment conducive to further growth.
○ The second half of this presentation will outline our principal policiesfor the coming fiscal year.
All Rights Reserved - Advantest Corporation15 2011/4/27[Source: Advantest]
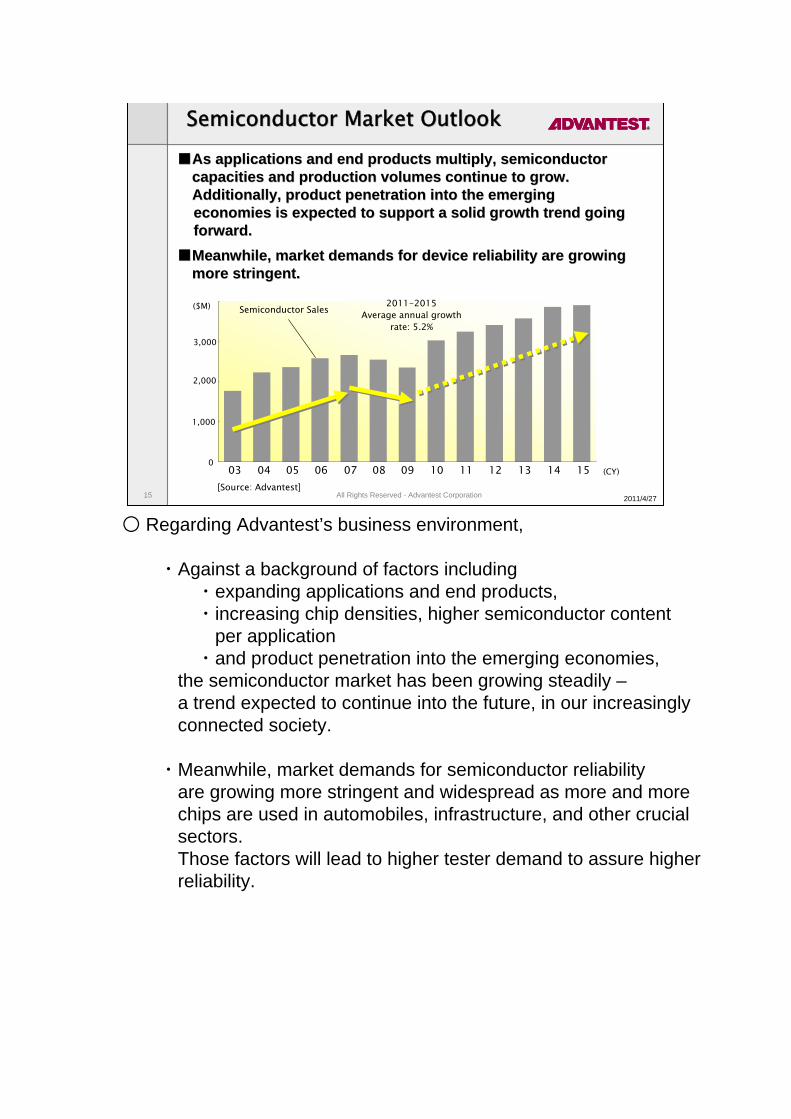
■■As applications and end products multiply, semiconductorAs applications and end products multiply, semiconductorcapacities and production volumes continue to grow. capacities and production volumes continue to grow. Additionally, product penetration into the emergingAdditionally, product penetration into the emergingeconomies is expected to support a solid growth trend going economies is expected to support a solid growth trend going forward.forward.
■■Meanwhile, market demands for device reliability are growingMeanwhile, market demands for device reliability are growingmore stringent.more stringent.
半導体生産個数
08 09 (CY)10 11 12 13 1403 05 06 07
($M)
04 15
2011-2015Average annual growth
rate: 5.2%
Semiconductor Sales
3,000
2,000
1,000
0
Semiconductor Market OutlookSemiconductor Market Outlook
○ Regarding Advantest’s business environment,
・Against a background of factors including・expanding applications and end products,・increasing chip densities, higher semiconductor content
per application・and product penetration into the emerging economies,
the semiconductor market has been growing steadily –a trend expected to continue into the future, in our increasinglyconnected society.
・Meanwhile, market demands for semiconductor reliabilityare growing more stringent and widespread as more and morechips are used in automobiles, infrastructure, and other crucialsectors.Those factors will lead to higher tester demand to assure higherreliability.

All Rights Reserved - Advantest Corporation16 2011/4/27
0
1000
2000
3000
4000
5000
0
10
20
30
40
50
■■The semiconductor tester market recovered sharply in 2010. The semiconductor tester market recovered sharply in 2010. Gradual growth is predicted to continue.Gradual growth is predicted to continue.
06 07(CY)
Advantest revenues (100M yen, calendar year base)
[Source: Advantest]08
($M)
Semiconductor market drivers Semiconductor market drivers include:include:
・・expanding adoption of expanding adoption of smartphonessmartphones and other and other handheld devices, and handheld devices, and demand for better demand for better performanceperformance(higher speed, more memory capacity)(higher speed, more memory capacity)
・・the further development ofthe further development ofautomotive electronicsautomotive electronics
・・tighter energy efficiencytighter energy efficiencystandardsstandards
Advantest has product Advantest has product presence in each of these presence in each of these growth areas, and expects growth areas, and expects them to drive nearthem to drive near--term term revenue growth.revenue growth.
09 10 11 12 13
Diversifying applications
Pale blue : world memory tester salesDark blue: world non-memory tester sales (%)
Advantest share (estimated)
Demand driven by PCs, consumer electronics
Semiconductor Tester Market Semiconductor Tester Market OverViewOverView
○ Our view of the semiconductor tester market is as follows:
・The graph shows global semiconductor tester revenuescompared with Advantest’s revenues and market share.
・For the last few years, the memory tester market in particularhas been shrinking. However, it recovered sharply in 2010.
・From 2011, although forecasts remain uncertain, gradual growth is expected.
○ Our strategy going forward is to reinforce our presence in high-growth segments to expand our market share, which weconsider crucial to revenue growth.

17
■■Focus on communications, CMOS image sensors (CIS),Focus on communications, CMOS image sensors (CIS),automotive, and power management ICs (PMIC)automotive, and power management ICs (PMIC)
[Source: Advantest]
2010 World Non2010 World Non--Memory Tester SalesMemory Tester Sales((approx. US$2,400 millionapprox. US$2,400 million))By ApplicationBy Application
In FY2010 Advantest In FY2010 Advantest developed solutions with developed solutions with superlative costsuperlative cost--performance for the performance for the communications, communications, automotive / PMIC, and automotive / PMIC, and CIS segments. CIS segments.
In FY2011, we will strive In FY2011, we will strive to improve our market to improve our market share by leveraging these share by leveraging these highly competitive new highly competitive new products.products.
Consumer
15%
Communication
45%
Automotive,Specific
20%
DataProcessing
20%
FY2011Focus Areas
Automotive IC Solution (T2000 IPS)CMOS Image Sensor Solution (T2000 ISS)
New T2000 Modules Launched(1GDM、DPS90A、GPWGD)
Improve Share
Improve Share
2010 Advantest Share (estimate)2010 Advantest Share (estimate)
NonNon--Memory Test Systems:Memory Test Systems:Improve ShareImprove Share
○ In the non-memory tester market, we continue to seek share growth.
・We estimate that our current share of the non-memory tester market is slightly
less than 20%.
○ As the graph shows, we have struggled to gain share incommunications ICs and the automotive and specialty IC testersegments.
・In FY2010, we developed and launched an array of highlycompetitive solutions targeting these markets, with superiorcost performance.
・In FY2011, Advantest will strive to improve market share byleveraging our new products in the communications, automotive and power management, and CMOS image sensormarkets.

All Rights Reserved - Advantest Corporation18 2011/4/27
■■FY2011 DRAM tester demand expected to be robust, FY2011 DRAM tester demand expected to be robust, led by mobile DRAMled by mobile DRAM
2010 2011 2012 2013
DRAM for PCs production volume estimates(100 million units, 1Gb equivalent)
[ Source: Advantest]
Average annual
growth rate+30%
DRAMfor PCs
86 110147
191
●●
●
●
Mobile DRAM tester demand is Mobile DRAM tester demand is expected to grow significantly, as expected to grow significantly, as device production volumes are device production volumes are increasing, test times are growing increasing, test times are growing longer, and device speeds are longer, and device speeds are improving. improving.
Advantest has launched highAdvantest has launched high--speed speed memorymemory testers complying these testers complying these trends ahead of our competitors, trends ahead of our competitors, positioning us to maintain positioning us to maintain superiority and further improve our superiority and further improve our share in this market.share in this market.
2010 2011 2012 2013
Mobile DRAM production volume estimates(100 million units, 1Gb equivalent)
[ Source: Advantest]
Average annual
growth rate
Mobile DRAM
+47%
●
●
●
●
9
1722
29
T5503T5385
Memory Test Systems:Memory Test Systems:Maintain SuperiorityMaintain Superiority
○ In the memory tester market, Advantest aims to maintain andfurther grow its currently dominant share.
・The memory tester market is presently driven by increasingdemand for mobile DRAM for portable applications such assmartphones and tablet PCs.
・Mobile DRAM production volumes are expected toexpand by 3 times (1Gb equivalent) in the 2010-2013 period.
・A notable characteristic of mobile DRAM is that test timesare relatively long compared to PC DRAM.
・Furthermore, as mobile DRAM speeds improve, it is increasingly crucial for memory testers to supportboth volume production and high-speed test requirements.
○ Advantest’s products lead the industry in throughput,unmatched by any products available from our competitors.We will aim to improve our share of the memory market on thesuperiority of our products.
All Rights Reserved - Advantest Corporation19 2011/4/27
・・Conversion of design assets into shorterConversion of design assets into shorterR&D lead timesR&D lead times
・・Procurement optimization and a globalized Procurement optimization and a globalized manufacturing structure manufacturing structure
・・Lower production costs, ongoing Lower production costs, ongoing administrative cost control effortsadministrative cost control efforts
Further Improve ProfitabilityFurther Improve Profitability■■With faster responses and a more streamlined structure, With faster responses and a more streamlined structure,
Advantest is boosting its ability to align operations in real Advantest is boosting its ability to align operations in real time with the changing business environment.time with the changing business environment.
○ Advantest’s drive to improve profitability continues.
○ In parallel with expanding sales, we consistently strive to boostprofitability through kaizen measures:
・R&D: we are striving to enhance our response to customerneeds by converting our rich stock of design assets into shorterdevelopment lead times
・Production: optimization of our procurement operations is contributing to lower costs, while globalization of ourmanufacturing structure will enable us to respond to customerneeds faster
・Meanwhile, the entire Advantest Group is united in striving toexpand earnings and prevent opportunity losses, as profitability kaizen efforts continue.

○ Advantest is also cultivating new businesses:
○ Multiple projects are currently underway. A full explanation of eachwould take more time than we have today, but in brief, last fiscal year,we recorded contributions from the following projects:
・Probe cards・CDSEM metrology・Terahertz 3D imaging & analysis・NAND Flash Memory Testers
○ In fiscal 2011, Advantest will continue to reinforce its support ofnew business development projects to ensure consistent futuregrowth.
All Rights Reserved - Advantest Corporation20 2011/4/27
■■Multiple ongoing projects cover a broad spectrum of Multiple ongoing projects cover a broad spectrum of business opportunities. Advantest plans to solidify itsbusiness opportunities. Advantest plans to solidify itsfoothold in each of these markets in FY2011.foothold in each of these markets in FY2011.
NPX
Cultivating New Business Cultivating New Business for Consistent Growthfor Consistent Growth
Probe CardsNow in use by a major manufacturer.Flexibly support a variety of devices.Expanded sales foreseen.
CD-SEMIndustry-leading CD-SEMmeasurement system,indispensable for next-generationphotomask metrology at advanced nodes.
3D Imaging & Analysis SystemAdopted by a major automotive firm, currently being marketed in additional industries
NAND Flash Memory testerCurrently under development

All Rights Reserved - Advantest Corporation21 2011/4/27
■■Goal : Cumulative profitability over the threeGoal : Cumulative profitability over the three--year year span of the initiative (FY2009 span of the initiative (FY2009 -- FY2011)FY2011)
Corporate Initiative: Corporate Initiative: ““1000 Days1000 Days””
○ Our corporate initiative “1000 Days” was launched in July 2009.
・To achieve the initiative’s goal of cumulative profitability overthree years,
・every Advantest group employee, under the slogan of the7 “S”s, is instructed to treat each day as precious, andstrive for kaizen improvements with a medium-term vision.
・Employees have already submitted and carried out morethan 1,000 kaizen proposals on their own initiative.
○ In FY2010, Advantest returned to profitability. We will seek furtherrevenue and earnings growth in FY2011, the final year of thiscorporate initiative.

○ On March 11th, the Great Eastern Japan Earthquake and tsunamistruck the Tohoku region.
・Advantest suffered minimal direct impact:・Even our facilities in Sendai – a heavily damaged area – were
once more operational by the end of April.・Disruptions to our supply chain had a limited impact on FY2010
revenues.
・However, many of our suppliers are located in the Tohoku andnorthern Kanto regions.It is still unclear how deeply our procurement will be affected.
・An emergency procurement structure has been set up to ensuresupply and production capacity sufficient to meet our customers’needs.
・Concerning forecasted energy shortages in the coming months,Advantest will respond as needed with flexible measures, takinginto consideration the needs of society overall.
All Rights Reserved - Advantest Corporation22 2011/4/27
Details of Impact
・No employees were injured. Damage to facilities was light.Facilities in Gunma and Saitama Prefectures resumed operations immediately after the quake. Facilities in the city of Sendai, Miyagi Prefecture, were reopened by the end of April.
・Disruptions to Advantest’s supply chain had a slight impact on Fy2010 revenues.
Measures Currently In Place
・An emergency procurement structure is being established in cooperation with our suppliers.
・Alternatives are being sought for components not readily available in thenear term.
・Additional work shifts during the summer season and adjustment of employee vacation schedules are being considered.
⇒ While taking into account the changing situation and the needs of society, Advantest is striving to ensure sufficient production capacityand meet all shipment deadlines.
■■Advantest suffered little damage.Advantest suffered little damage.In future, extra effort will be put into securing production In future, extra effort will be put into securing production capacity and meeting shipment schedules.capacity and meeting shipment schedules.
Impact of the Great EasternImpact of the Great EasternJapan EarthquakeJapan Earthquake
All Rights Reserved - Advantest Corporation23 2011/4/27All Rights Reserved - Advantest Corporation23 2011/4/27
Advantest expresses heartfelt condolencesAdvantest expresses heartfelt condolencesto the victims and the bereaved survivorsto the victims and the bereaved survivorsof the Great Eastern Japan Earthquake.of the Great Eastern Japan Earthquake.
We pray for a speedy recovery in the regionsWe pray for a speedy recovery in the regionsaffected by this tragedy.affected by this tragedy.

NOTE ・Prepared in accordance with US GAAP・Cautionary Statement with Respect to Forward-Looking StatementsThis presentation contains “forward-looking statements” that are based on Advantest's current expectations, estimates and projections. These statements include, among other things, a discussion of Advantest’s business strategy, outlook and expectations as to market and business developments, production and capacity plans. These forward-looking statements can be identified by use of forward-looking terminology are subject to known and unknown risks, uncertainties and other factors that may cause Advantest’s actual results, levels of activity, performance or achievements to be materially different from those expressed or implied by such forward-looking statements. These factors include: (i) changes in demand for the products and services produced and offered by Advantest’s customers, including semiconductors, communications services and electronic goods; (ii) circumstances relating to Advantest’s investment in technology, including its ability to develop in a timely fashion products that meet the changing needs of semiconductor manufacturers and communications network equipment and component makers and service providers; (iii) significant changes in the competitive environment in the major markets where Advantest purchases materials, components and supplies for the production of its products or where its products are produced, distributed or sold; and (iv) changes in economic conditions, currency exchange rates or political stability in the major markets where Advantest procures materials, components and supplies for the production of its principal products or where its products are produced, distributed or sold. A discussion of these and other factors which may affect Advantest’s actual results, levels of activity, performance or achievements is contained in the “Operating and Financial Review and Prospects”, “Key Information - Risk Factors” and “Information on the Company” sections and elsewhere in Advantest’s annual report on Form 20-F, which is on file with the United States Securities and Exchange Commission.