dynamics of the informal sector in hanoi and ho chi minh
TRANSCRIPT
General Statistics Office
Dynamics of the informal sector in Hanoi and Ho Chi Minh City 2007-2009
Main findings of the Household business & Informal sector
survey (HB&IS)
GSO-ISS/IRD-DIAL project
December 2010
THE WORLD BANK
Pub
lic D
iscl
osur
e A
utho
rized
Pub
lic D
iscl
osur
e A
utho
rized
Pub
lic D
iscl
osur
e A
utho
rized
Pub
lic D
iscl
osur
e A
utho
rized
Pub
lic D
iscl
osur
e A
utho
rized
Pub
lic D
iscl
osur
e A
utho
rized
Pub
lic D
iscl
osur
e A
utho
rized
Pub
lic D
iscl
osur
e A
utho
rized
2
Dynamics of the informal sector in Hanoi and Ho Chi Minh City 2007-2009 Main findings of the Household business & Informal sector survey (HB&IS)
GSO-ISS/IRD-DIAL project1
Introduction In 2007, the General Statistics Office (GSO) launched a joint research program with the French Institute of Research for Development (IRD), to measure and analyse the informal sector in Vietnam. Two kinds of surveys were conducted in 2007: a national labour force survey (LFS), which, in a first for Vietnam, classified labour by institutional sector, separating out the informal sector; two specific surveys, in Hanoi and Ho Chi Minh City (HCMC), which were grafted onto the LFS2007 to find out more about the characteristics of household businesses (HBs) in general and especially the informal sector (HB&IS2007). These surveys have been extensively analyzed, and the full results edited in a book (Cling et al., 2010a). Two years later, this successful experience has been re-conducted, with the additional objectives to consolidate the methodology and to assess the impact of the global crisis on the labour market in general and the informal economy in particular. Late 2009, the LFS was implemented again nationwide, including the information on the informal sector on behalf of the project, while the HB&IS survey was replicated in the two provinces (Hanoi and HCMC), with two sub-samples: one panel sample of the HBs already surveyed in 2007 (1,011 completed HB’s questionnaires in Hanoi and 1,020 in HCMC), and one new sample of HBs identified in the LFS2009 (787 HBs in Hanoi and 1,254 in HCMC). In the remainder of this paper, formal non-farm unincorporated enterprises are called formal household businesses (FHBs) and informal non-farm unincorporated enterprises are called informal household businesses (IHBs). This paper presents the main findings (both methodological and analytical) of these two rounds of surveys as regards the informal sector in Hanoi and HCMC. In the context of the global crisis, it looks at the dynamics of the informal sector between 2007 and 2009. Taking advantage of this unique survey protocol, the first part investigates the macro dynamics comparing the two representative cross sections, while the second focuses on the micro dynamics drawn from the panel component. Transitions between formal and informal sector are explored. The third part aims at analyzing the perception of HBs' heads to assess the impact of the crisis. Then, the last section explores the changes as regards the problems faced by HBs, their interaction with the State and their outlook. In the conclusion, we determine some of the implications of the findings in terms of economic policies. This report can be usefully complemented by two companion papers: the first one presents the adjustment of the labour market and the informal economy nationwide, based on the LFS2007 & 2009 (Nguyen et al., 2010); the second one is a policy brief on the impact of the crisis on the informal sector in Hanoi and HCMC (Cling et al., 2010b).
The informal sector dynamics from a macro perspective This section aims at providing the main striking points as regards the dynamics of the informal sector between 2007 and 2009. It focuses on the evolution of the main economic aggregates as well as on some structural changes. It should be stressed that the interpretation of the results is not an easy task for different reasons: - First, given the limited knowledge up to now on the dynamics of the informal sector, it is difficult to identify the changes resulting from the natural trend of this sector in the absence of crisis and those due to the impact of the crisis;
1 This report has been written by Nguyễn Hữu Chí and Nguyễn Thị Thu Huyền (GSO), and Axel Demenet, Mireille Razafindrakoto and François Roubaud (IRD-DIAL) with the collaboration of Đào Ngọc Minh Nhung and Đinh Bá Hiến (GSO). The 2009 surveys (HB&IS) were funded by the World Bank and the IRD. We would like to thank Kirsty Mason (DFID) and Valerie Kozel for their support. Special thanks are addressed to Constance Torelli (INSEE), who contributed actively to data cleaning and analysis of the results.
3
- Second, it is difficult to make comparison over time for Hanoi province since the administrative boundaries have changed in August 2008. The absorption of the neighbouring province of Ha Tay and some neighbouring districts, whose characteristics are not the same as in the "old Hanoi", have entailed some structural changes; - Third, given the heterogeneity of the informal sector with the existence of businesses of different size, undertaking different types of activities and driven by different motivations (Cling et al., 2010a), changes at the macro level fail to reflect different dynamics specific to each sector or each group of HBs; - Last, the dynamics at the macro level is the result of the combination of three types of changes: the exit of some HBs which have stopped their activities, the arrivals (creation) of new HBs, and the dynamics of the HBs already operational in 2007 and which still exist. The second part of this paper, focused on the panel data, provides insights on the evolution observed among already existing HBs in 2007. The analysis will take stock of the changes and provide some first explanation of the global trend. In-depth analysis will be necessary to get a more detailed and precise picture of the different phenomena at stake. The big picture: the informal sector is still predominant
The informal sector, still the leading job provider in Hanoi and HCMC. The LFS2009 counted 3,326,000 (main) jobs in Hanoi and 3,670,000 in HCMC (see Table A1 in annex). Of this total, the informal sector represents 32% of total employment in Hanoi and 34% in HCMC (respectively 57% and 41% of private non-farm jobs). This makes the informal sector the number one employer in both cities. Between 2007 and 2009, the number of jobs in the informal sector increased by 56,000 in Hanoi (+6%) and by 206,000 in HCMC (+19%). For HCMC, the informal sector gained 1 percentage point between 2007 and 2009, and contributes for 40% of net jobs creation. In Hanoi, the situation is more delicate, as the boundaries of the province changed in 2008, approximately doubling its size. While, as expected, the new province is significantly more “informalized”, the evolution of the “old one” (fixed boundaries) presents a slight 1.5 points decrease in the share of the informal sector in the labour force (a figure which should be taken with caution, as the survey has not been designed at this level of inference). It nevertheless grew in numbers and is still the first employer. Furthermore, if we restrict to the jobs created in 2009, the contribution of the informal sector is at the front line with around 30% in both cities, hand in hand with domestic enterprises. An increasing number of production units. The total number of informal household businesses (IHBs) comes to 725,000 in Hanoi in 2009, and the corresponding figure in HCMC is 967,000. With the extension of the administrative frontier of Hanoi province, the number of informal HBs has been multiplied by 2.3 from 2007 to 2009. If we consider the new boundaries of Hanoi, the growth of the number of informal HBs is estimated at 23%.2 In HCMC, the demographic growth of the informal HBs is estimated at 29% within the two-year period. With this quite rapid growth pace, the persistence and dynamism of this sector cannot be denied. However, without any comparable figures from another time period or from other similar countries, the diagnosis which can be made is limited. On the one hand, this evolution could just result from the usual rhythm of expansion of the informal sector given the demographic growth of the population in the cities. It even could have been slowed down by the lower growth of the economy in general and the contraction of demand. On the other hand, the informal sector could evolve in a countercyclical way compared to the rest of the economy. The increase in the multi-activity rate from 2007 to 2009 which is observed from the LFS (Nguyen et al.,
2 We can compute from the LFS an estimate of the evolution of employment, as well as of the number of HBs, both in “new” and “old” Hanoi. As regards the HB&IS survey, we can only make a comparison for “old” Hanoi, as the 2007 HB&IS survey was only conducted on this restricted area. Overall, caution is required on the interpretation of the results on “old” Hanoi from the 2009 LFS and HB&IS survey, given the small sample size.
4
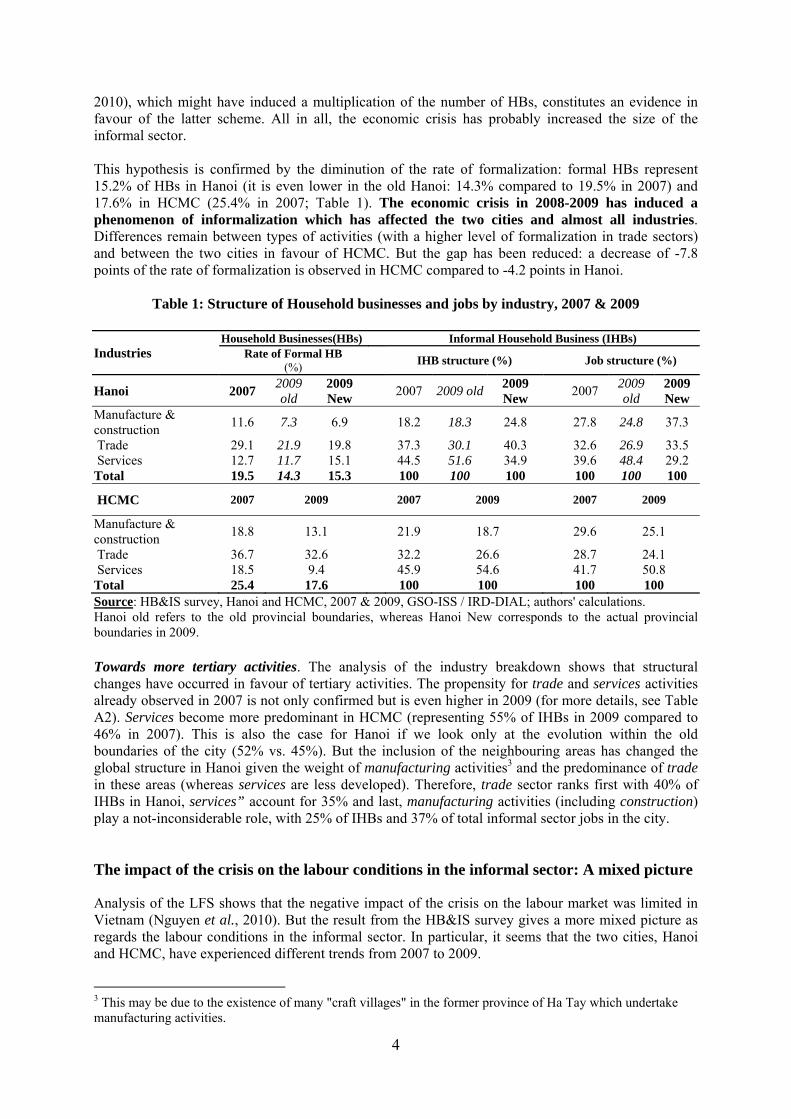
2010), which might have induced a multiplication of the number of HBs, constitutes an evidence in favour of the latter scheme. All in all, the economic crisis has probably increased the size of the informal sector. This hypothesis is confirmed by the diminution of the rate of formalization: formal HBs represent 15.2% of HBs in Hanoi (it is even lower in the old Hanoi: 14.3% compared to 19.5% in 2007) and 17.6% in HCMC (25.4% in 2007; Table 1). The economic crisis in 2008-2009 has induced a phenomenon of informalization which has affected the two cities and almost all industries. Differences remain between types of activities (with a higher level of formalization in trade sectors) and between the two cities in favour of HCMC. But the gap has been reduced: a decrease of -7.8 points of the rate of formalization is observed in HCMC compared to -4.2 points in Hanoi.
Table 1: Structure of Household businesses and jobs by industry, 2007 & 2009
Industries Household Businesses(HBs) Informal Household Business (IHBs)
Rate of Formal HB (%)
IHB structure (%)
Job structure (%)
Hanoi 2007 2009 old
2009 New
2007 2009 old2009 New
2007
2009 old
2009 New
Manufacture & construction
11.6 7.3 6.9
18.2 18.3 24.8
27.8 24.8 37.3
Trade 29.1 21.9 19.8 37.3 30.1 40.3 32.6 26.9 33.5 Services 12.7 11.7 15.1 44.5 51.6 34.9 39.6 48.4 29.2 Total 19.5 14.3 15.3 100 100 100 100 100 100
HCMC 2007 2009
2007 2009
2007 2009
Manufacture & construction
18.8 13.1
21.9 18.7
29.6 25.1
Trade 36.7 32.6 32.2 26.6 28.7 24.1 Services 18.5 9.4 45.9 54.6 41.7 50.8 Total 25.4 17.6 100 100 100 100 Source: HB&IS survey, Hanoi and HCMC, 2007 & 2009, GSO-ISS / IRD-DIAL; authors' calculations. Hanoi old refers to the old provincial boundaries, whereas Hanoi New corresponds to the actual provincial boundaries in 2009. Towards more tertiary activities. The analysis of the industry breakdown shows that structural changes have occurred in favour of tertiary activities. The propensity for trade and services activities already observed in 2007 is not only confirmed but is even higher in 2009 (for more details, see Table A2). Services become more predominant in HCMC (representing 55% of IHBs in 2009 compared to 46% in 2007). This is also the case for Hanoi if we look only at the evolution within the old boundaries of the city (52% vs. 45%). But the inclusion of the neighbouring areas has changed the global structure in Hanoi given the weight of manufacturing activities3 and the predominance of trade in these areas (whereas services are less developed). Therefore, trade sector ranks first with 40% of IHBs in Hanoi, services” account for 35% and last, manufacturing activities (including construction) play a not-inconsiderable role, with 25% of IHBs and 37% of total informal sector jobs in the city.
The impact of the crisis on the labour conditions in the informal sector: A mixed picture
Analysis of the LFS shows that the negative impact of the crisis on the labour market was limited in Vietnam (Nguyen et al., 2010). But the result from the HB&IS survey gives a more mixed picture as regards the labour conditions in the informal sector. In particular, it seems that the two cities, Hanoi and HCMC, have experienced different trends from 2007 to 2009.
3 This may be due to the existence of many "craft villages" in the former province of Ha Tay which undertake manufacturing activities.
5
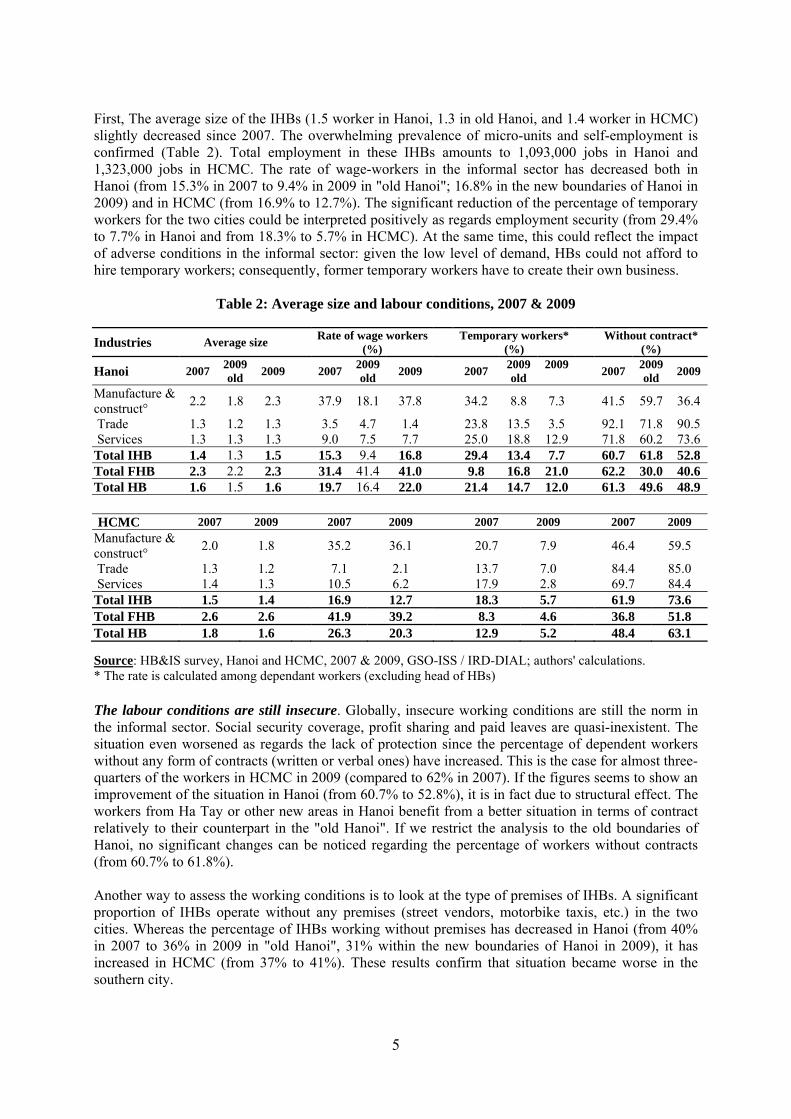
First, The average size of the IHBs (1.5 worker in Hanoi, 1.3 in old Hanoi, and 1.4 worker in HCMC) slightly decreased since 2007. The overwhelming prevalence of micro-units and self-employment is confirmed (Table 2). Total employment in these IHBs amounts to 1,093,000 jobs in Hanoi and 1,323,000 jobs in HCMC. The rate of wage-workers in the informal sector has decreased both in Hanoi (from 15.3% in 2007 to 9.4% in 2009 in "old Hanoi"; 16.8% in the new boundaries of Hanoi in 2009) and in HCMC (from 16.9% to 12.7%). The significant reduction of the percentage of temporary workers for the two cities could be interpreted positively as regards employment security (from 29.4% to 7.7% in Hanoi and from 18.3% to 5.7% in HCMC). At the same time, this could reflect the impact of adverse conditions in the informal sector: given the low level of demand, HBs could not afford to hire temporary workers; consequently, former temporary workers have to create their own business.
Table 2: Average size and labour conditions, 2007 & 2009
Industries Average size Rate of wage workers
(%) Temporary workers*
(%)
Without contract* (%)
Hanoi 2007 2009 old
2009 2007 2009 old
2009
2007 2009 old
2009 2007
2009 old
2009
Manufacture & construct°
2.2 1.8 2.3 37.9 18.1 37.8 34.2 8.8 7.3 41.5 59.7 36.4
Trade 1.3 1.2 1.3 3.5 4.7 1.4 23.8 13.5 3.5 92.1 71.8 90.5 Services 1.3 1.3 1.3 9.0 7.5 7.7 25.0 18.8 12.9 71.8 60.2 73.6 Total IHB 1.4 1.3 1.5 15.3 9.4 16.8 29.4 13.4 7.7 60.7 61.8 52.8 Total FHB 2.3 2.2 2.3 31.4 41.4 41.0 9.8 16.8 21.0 62.2 30.0 40.6 Total HB 1.6 1.5 1.6 19.7 16.4 22.0 21.4 14.7 12.0 61.3 49.6 48.9
HCMC 2007 2009 2007 2009 2007 2009 2007 2009 Manufacture & construct°
2.0 1.8 35.2 36.1 20.7 7.9 46.4 59.5
Trade 1.3 1.2 7.1 2.1 13.7 7.0 84.4 85.0 Services 1.4 1.3 10.5 6.2 17.9 2.8 69.7 84.4 Total IHB 1.5 1.4 16.9 12.7 18.3 5.7 61.9 73.6 Total FHB 2.6 2.6 41.9 39.2 8.3 4.6 36.8 51.8 Total HB 1.8 1.6 26.3 20.3 12.9 5.2 48.4 63.1
Source: HB&IS survey, Hanoi and HCMC, 2007 & 2009, GSO-ISS / IRD-DIAL; authors' calculations. * The rate is calculated among dependant workers (excluding head of HBs) The labour conditions are still insecure. Globally, insecure working conditions are still the norm in the informal sector. Social security coverage, profit sharing and paid leaves are quasi-inexistent. The situation even worsened as regards the lack of protection since the percentage of dependent workers without any form of contracts (written or verbal ones) have increased. This is the case for almost three-quarters of the workers in HCMC in 2009 (compared to 62% in 2007). If the figures seems to show an improvement of the situation in Hanoi (from 60.7% to 52.8%), it is in fact due to structural effect. The workers from Ha Tay or other new areas in Hanoi benefit from a better situation in terms of contract relatively to their counterpart in the "old Hanoi". If we restrict the analysis to the old boundaries of Hanoi, no significant changes can be noticed regarding the percentage of workers without contracts (from 60.7% to 61.8%). Another way to assess the working conditions is to look at the type of premises of IHBs. A significant proportion of IHBs operate without any premises (street vendors, motorbike taxis, etc.) in the two cities. Whereas the percentage of IHBs working without premises has decreased in Hanoi (from 40% in 2007 to 36% in 2009 in "old Hanoi", 31% within the new boundaries of Hanoi in 2009), it has increased in HCMC (from 37% to 41%). These results confirm that situation became worse in the southern city.
6
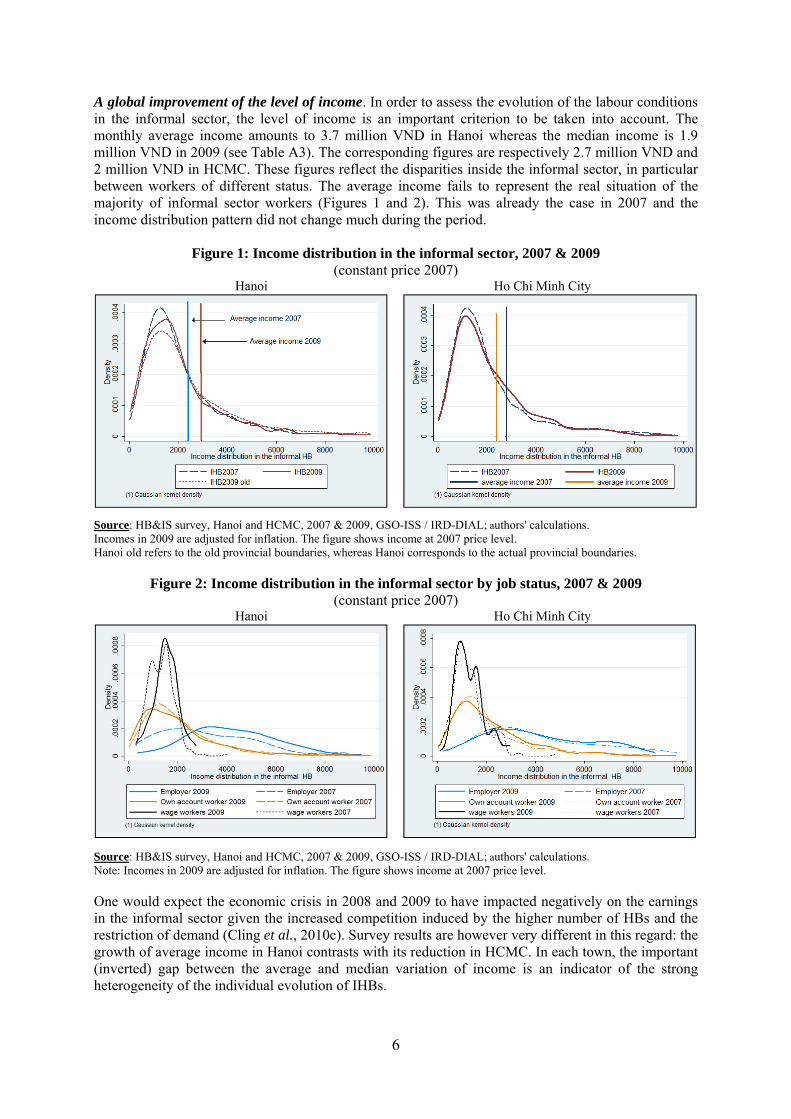
A global improvement of the level of income. In order to assess the evolution of the labour conditions in the informal sector, the level of income is an important criterion to be taken into account. The monthly average income amounts to 3.7 million VND in Hanoi whereas the median income is 1.9 million VND in 2009 (see Table A3). The corresponding figures are respectively 2.7 million VND and 2 million VND in HCMC. These figures reflect the disparities inside the informal sector, in particular between workers of different status. The average income fails to represent the real situation of the majority of informal sector workers (Figures 1 and 2). This was already the case in 2007 and the income distribution pattern did not change much during the period.
Figure 1: Income distribution in the informal sector, 2007 & 2009 (constant price 2007)
Hanoi Ho Chi Minh City
Source: HB&IS survey, Hanoi and HCMC, 2007 & 2009, GSO-ISS / IRD-DIAL; authors' calculations. Incomes in 2009 are adjusted for inflation. The figure shows income at 2007 price level. Hanoi old refers to the old provincial boundaries, whereas Hanoi corresponds to the actual provincial boundaries.
Figure 2: Income distribution in the informal sector by job status, 2007 & 2009 (constant price 2007)
Hanoi Ho Chi Minh City
Source: HB&IS survey, Hanoi and HCMC, 2007 & 2009, GSO-ISS / IRD-DIAL; authors' calculations. Note: Incomes in 2009 are adjusted for inflation. The figure shows income at 2007 price level. One would expect the economic crisis in 2008 and 2009 to have impacted negatively on the earnings in the informal sector given the increased competition induced by the higher number of HBs and the restriction of demand (Cling et al., 2010c). Survey results are however very different in this regard: the growth of average income in Hanoi contrasts with its reduction in HCMC. In each town, the important (inverted) gap between the average and median variation of income is an indicator of the strong heterogeneity of the individual evolution of IHBs.

7
In Hanoi, an impressive growth of the average level of income can be observed (+22% in real terms for old Hanoi). The slight decrease of the median income is mainly due to structural effect with the addition of HBs with lower income from Ha Tay and the neighbouring areas (Table 3). The evolution of the median income is also positive, even if the pace is less important, if the analysis is restricted to the "old Hanoi" (+3.3%). The employers and the own account workers are those who have benefited the most from this improvement. The remuneration of wage workers has also increased but this is mainly due to the better situation of these categories in the new areas of Hanoi (a decrease of -4% of the average earnings of the wage-workers and of -14% of the median is observed in the "old Hanoi"). More globally, the income growth pattern in this city is shared by the formal HBs and the growth trend is even stronger. It seems that the more efficient units managed to perform well during the period and pulled up the average in the HB sector.
Table 3: Average and median income real growth by industry and job status, 2007-2009
Hanoi Hanoi old HCMC
Industries Monthly average
Monthly median
Monthly average
Monthly median
Monthly average
Monthly median
Manufacturing & construction
-13.1% 0.8% 9.8% 13.3% 10.5% 16.9%
Trade 88.4% -1.9% 86.5% 14.2% 8.3% 19.1%
Services -14.7% -5.8% -6.5% -2.4% -16.9% 3.2%
Total IHB 17.0% -2.2% 21.7% 3.3% -3.5% 10.9%
Total FHB 72.9% 5.8% 176.9% 27.5% -16.5% -8.8%
Total 30.0% 0.8% 64.1% 10.0% -13.6% 8.6%
Hanoi Hanoi old HCMC
Job status Monthly average
Monthly median
Monthly average
Monthly median
Monthly average
Monthly median
Employer 19.6% 54.9% 39,2% 94,7% -11.5% -11.8%
Self account 30.5% -2.3% 27,0% 7,0% -2.4% 11.4%
Wage worker 12.6% 8.0% -4,0% -13,6% 2.8% 1.3%
Paid apprentice -0.4% 0.8% -2,0% -16,0% -31.3% -15.5%
Partner -30.9% 27.0% -41,8% 27,0% -0.6% 5.0%
Total IHB 17.0% -2.2% 21,7% 3,3% -3.5% 10.9%
Source: HB&IS survey, Hanoi and HCMC, 2007 & 2009, GSO-ISS / IRD-DIAL; authors' calculations. In Ho Chi Minh City, if we look at the evolution of the average income, the situation seems to have worsened in the informal sector from 2007 to 2009 (-3.5% in real terms). But the median income has clearly increased (+10.9%). Contrarily to Hanoi, the units with higher level of income (the bigger or the most efficient ones) tend to pull down the average income. It appears that they are the victims of the crisis. Besides, this hypothesis is confirmed by the clear negative trends observed in the formal HBs: the level of earnings in this segment has decreased (-16.5% in real terms for the average income and -8.8% for the median). For this city, the employers and, to a lower extent, the own account workers, are the categories which have suffered the most from the crisis (with the paid apprentices which represent a minor part of the workers), whereas the income of wage-workers has slightly improved (+2.8% for the average income and +1.3% for the median). As wage workers in the informal sector are paid at subsistence level, there is no margin for downward adjustment in time of crisis. It should be stressed that the evolution of the level of income results at least partly from an extension of already long working hours in Hanoi in 2009 compared to 2007 (from 49.3 to 51.5 hours per week if we restrict the analysis to "old Hanoi"; the working hours remain stable if the analysis is extended to new areas in 2009). In HCMC, if we exclude the services sector which stands as an exception with
8
lower working hours per week, a slight increase is also noticeable: +1.1 hours in average in the manufacturing IHBs ; +1.2 hours in the trade sector. The extremely high level reached by the formal HBs in HCMC reflects the difficulty faced by this segment (62.5 hours per week, which corresponds to an increase of +2,6 hours in average from 2007 to 2009). All in all, even if the level of income in the informal sector is still low, workers in this sector managed to adapt and avoid (or limit) the negative impact of the economic crisis on their earnings. Nonetheless, the question remains as regards the capacity of this sector to become more efficient in order to fill the gap between the formal and the informal sectors in terms of income in the absence of economic crisis. Economic performance of the informal sector
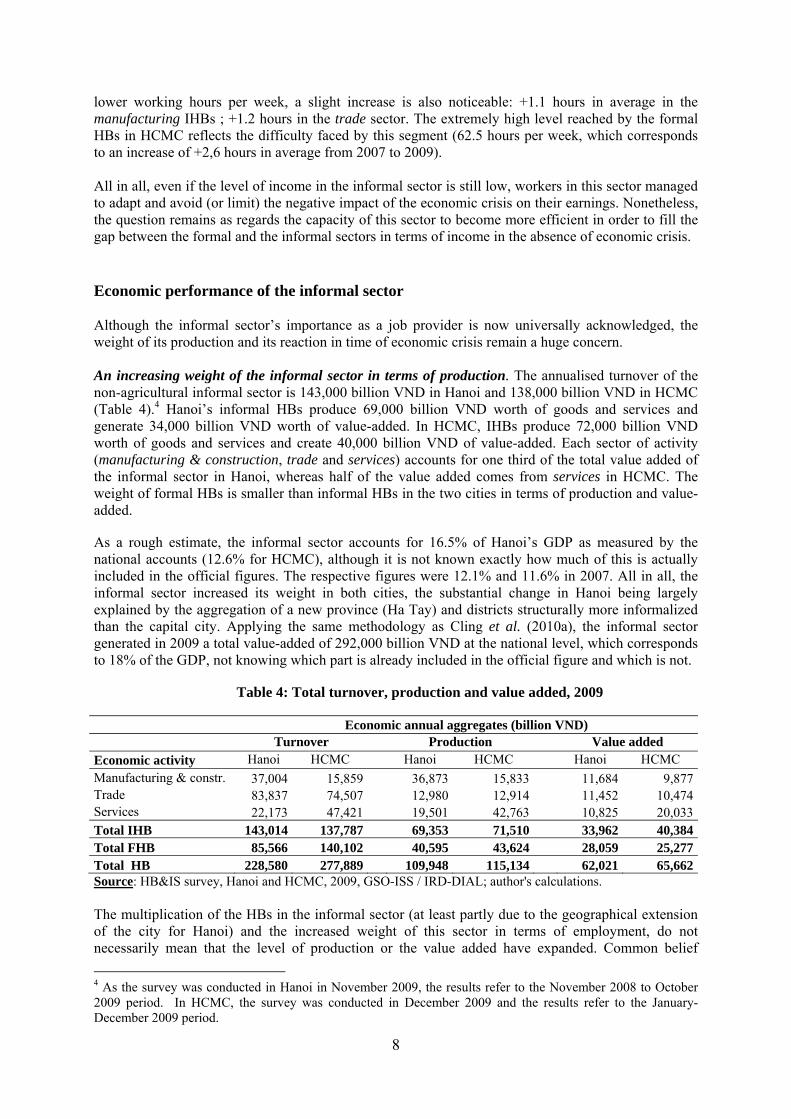
Although the informal sector’s importance as a job provider is now universally acknowledged, the weight of its production and its reaction in time of economic crisis remain a huge concern. An increasing weight of the informal sector in terms of production. The annualised turnover of the non-agricultural informal sector is 143,000 billion VND in Hanoi and 138,000 billion VND in HCMC (Table 4).4 Hanoi’s informal HBs produce 69,000 billion VND worth of goods and services and generate 34,000 billion VND worth of value-added. In HCMC, IHBs produce 72,000 billion VND worth of goods and services and create 40,000 billion VND of value-added. Each sector of activity (manufacturing & construction, trade and services) accounts for one third of the total value added of the informal sector in Hanoi, whereas half of the value added comes from services in HCMC. The weight of formal HBs is smaller than informal HBs in the two cities in terms of production and value-added. As a rough estimate, the informal sector accounts for 16.5% of Hanoi’s GDP as measured by the national accounts (12.6% for HCMC), although it is not known exactly how much of this is actually included in the official figures. The respective figures were 12.1% and 11.6% in 2007. All in all, the informal sector increased its weight in both cities, the substantial change in Hanoi being largely explained by the aggregation of a new province (Ha Tay) and districts structurally more informalized than the capital city. Applying the same methodology as Cling et al. (2010a), the informal sector generated in 2009 a total value-added of 292,000 billion VND at the national level, which corresponds to 18% of the GDP, not knowing which part is already included in the official figure and which is not.
Table 4: Total turnover, production and value added, 2009
Economic annual aggregates (billion VND) Turnover Production Value added Economic activity Hanoi HCMC Hanoi HCMC Hanoi HCMC Manufacturing & constr. 37,004 15,859 36,873 15,833 11,684 9,877Trade 83,837 74,507 12,980 12,914 11,452 10,474Services 22,173 47,421 19,501 42,763 10,825 20,033Total IHB 143,014 137,787 69,353 71,510 33,962 40,384Total FHB 85,566 140,102 40,595 43,624 28,059 25,277Total HB 228,580 277,889 109,948 115,134 62,021 65,662Source: HB&IS survey, Hanoi and HCMC, 2009, GSO-ISS / IRD-DIAL; author's calculations. The multiplication of the HBs in the informal sector (at least partly due to the geographical extension of the city for Hanoi) and the increased weight of this sector in terms of employment, do not necessarily mean that the level of production or the value added have expanded. Common belief
4 As the survey was conducted in Hanoi in November 2009, the results refer to the November 2008 to October 2009 period. In HCMC, the survey was conducted in December 2009 and the results refer to the January-December 2009 period.

9
usually states that, especially in a period of crisis, the global volume of production might have stagnated and a higher number of HBs and workers might be competing hardly to share the same global volume of demand. This is not the case in the two cities: the total amount of value added in Hanoi has doubled in real terms and the increase is +15% for HCMC (Table 5). The case of the formal HBs in HCMC stands out as an exception to this picture: the level of production and of value-added has fallen down in this segment (respectively -43.6% and -37.4%).
Table 5: Growth rates in real terms of the main economic aggregates, 2007-2009
Economic annual aggregates Production Value added Economic activity Hanoi* HCMC Hanoi* HCMC Manufacturing 143% 16.2% 156% 12.4% Trade 69% 7.6% 114% 6.1% Services 49% 28.5% 49% 22.3% Total IHB 93% 21.4% 97% 15.2% Total FHB 108% -43.6% 184% -37.4% Total HB 98% -15.5% 129% -12.9% Source: HB&IS survey, Hanoi and HCMC, 2007 & 2009, GSO-ISS / IRD-DIAL; authors' calculations. Note: * The scope of the survey has changed from 2007 to 2009 (given the extension of the administrative definition of Hanoi province). A global stagnation of the performance in the informal sector? It should be stressed that the positive change at the global level in the informal sector may reflect mainly the demographic trend. In order to get a comprehensive view of the performance of this sector, a closer look at the average and median level of value-added per production unit is necessary. The diagnosis is quite similar to what has been made previously with a mixed picture: a better performance in 2009 in Hanoi compared with the result in 2007 and a worst performance in HCMC. In Hanoi, there is no significant change of the average value added per unit (+0.6%) and the median value has slightly increased (+2.3%) if we restrict the analysis to "old Hanoi". The decrease observed in Hanoi (Table 6) is mainly due to structural effects, the IHBs in the new areas being less efficient than those of "old Hanoi". It is the performance of the trade sector which permitted to avoid a clear worsening of the situation. Since the formal HBs experienced an increase (+73%) of their value added per unit, the larger HBs (in terms of size or/and performance) managed to perform better than the smaller ones. In HCMC, the performance of informal and in particular of formal HBs has clearly worsened. The average amount of value added per unit has fallen down from 2007 to 2009 (-14.2% for the informal HBs and -26.6% for the formal ones). The stability of the median shows that it was the upper part of this sector (made up of the more efficient HBs) which bore the most the burden of the crisis. As in Hanoi, the IHBs in the trade sector, especially the small units, manage to perform better and to escape from this negative trend in HCMC. In Hanoi, it seems that restructuration has led to a higher performance: the labour productivity has increased (+16% from 2007 to 2009). The increased weight of the trade sector and the higher share of the wage bill at the expense of benefits in the value added in the manufacturing sector can explain the growth of income in the capital city. In HCMC, it is the performance of the small units -which represent the majority- which permits to limit the negative impact of the crisis on the income. In this city, the formal HBs have adjusted also in lowering their benefits in favour of a higher share of the wage bill.
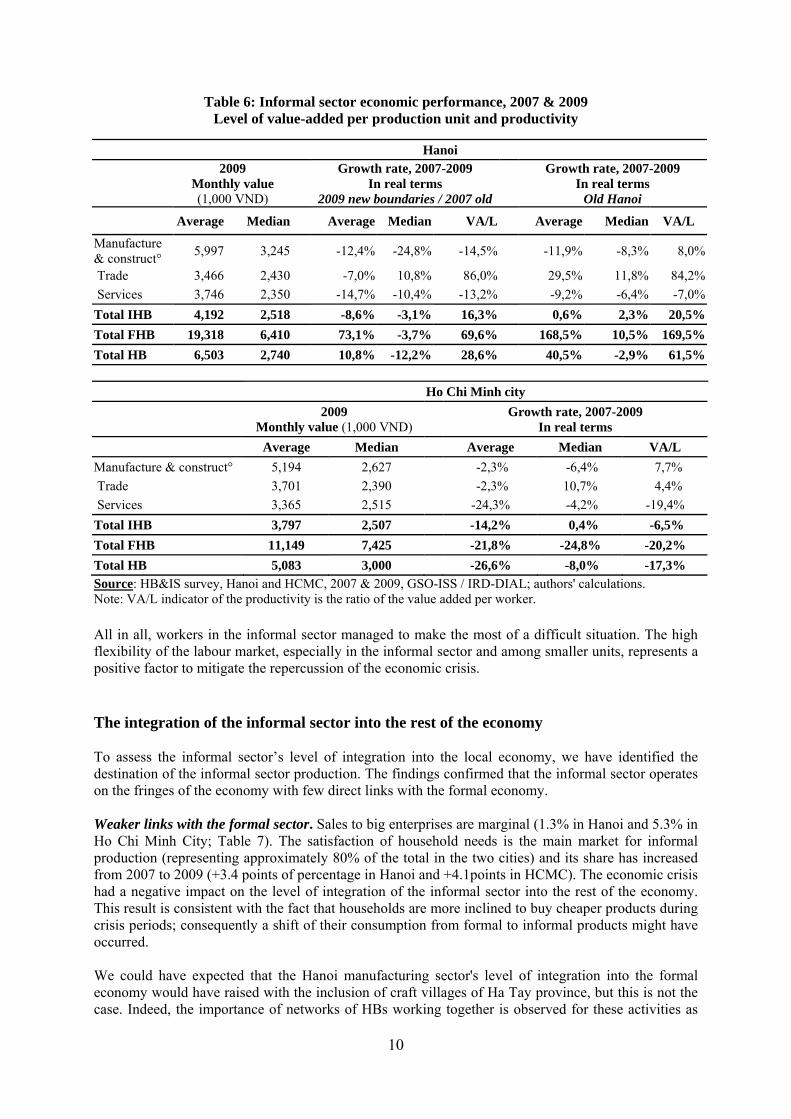
10
Table 6: Informal sector economic performance, 2007 & 2009 Level of value-added per production unit and productivity
Hanoi
2009
Monthly value (1,000 VND)
Growth rate, 2007-2009 In real terms
2009 new boundaries / 2007 old
Growth rate, 2007-2009 In real terms
Old Hanoi
Average Median Average Median VA/L Average Median VA/L
Manufacture & construct°
5,997 3,245 -12,4% -24,8% -14,5% -11,9% -8,3% 8,0%
Trade 3,466 2,430 -7,0% 10,8% 86,0% 29,5% 11,8% 84,2%
Services 3,746 2,350 -14,7% -10,4% -13,2% -9,2% -6,4% -7,0%
Total IHB 4,192 2,518 -8,6% -3,1% 16,3% 0,6% 2,3% 20,5%
Total FHB 19,318 6,410 73,1% -3,7% 69,6% 168,5% 10,5% 169,5%
Total HB 6,503 2,740 10,8% -12,2% 28,6% 40,5% -2,9% 61,5%
Ho Chi Minh city
2009
Monthly value (1,000 VND) Growth rate, 2007-2009
In real terms
Average Median Average Median VA/L
Manufacture & construct° 5,194 2,627 -2,3% -6,4% 7,7%
Trade 3,701 2,390 -2,3% 10,7% 4,4%
Services 3,365 2,515 -24,3% -4,2% -19,4%
Total IHB 3,797 2,507 -14,2% 0,4% -6,5%
Total FHB 11,149 7,425 -21,8% -24,8% -20,2%
Total HB 5,083 3,000 -26,6% -8,0% -17,3% Source: HB&IS survey, Hanoi and HCMC, 2007 & 2009, GSO-ISS / IRD-DIAL; authors' calculations. Note: VA/L indicator of the productivity is the ratio of the value added per worker. All in all, workers in the informal sector managed to make the most of a difficult situation. The high flexibility of the labour market, especially in the informal sector and among smaller units, represents a positive factor to mitigate the repercussion of the economic crisis. The integration of the informal sector into the rest of the economy To assess the informal sector’s level of integration into the local economy, we have identified the destination of the informal sector production. The findings confirmed that the informal sector operates on the fringes of the economy with few direct links with the formal economy.
Weaker links with the formal sector. Sales to big enterprises are marginal (1.3% in Hanoi and 5.3% in Ho Chi Minh City; Table 7). The satisfaction of household needs is the main market for informal production (representing approximately 80% of the total in the two cities) and its share has increased from 2007 to 2009 (+3.4 points of percentage in Hanoi and +4.1points in HCMC). The economic crisis had a negative impact on the level of integration of the informal sector into the rest of the economy. This result is consistent with the fact that households are more inclined to buy cheaper products during crisis periods; consequently a shift of their consumption from formal to informal products might have occurred. We could have expected that the Hanoi manufacturing sector's level of integration into the formal economy would have raised with the inclusion of craft villages of Ha Tay province, but this is not the case. Indeed, the importance of networks of HBs working together is observed for these activities as
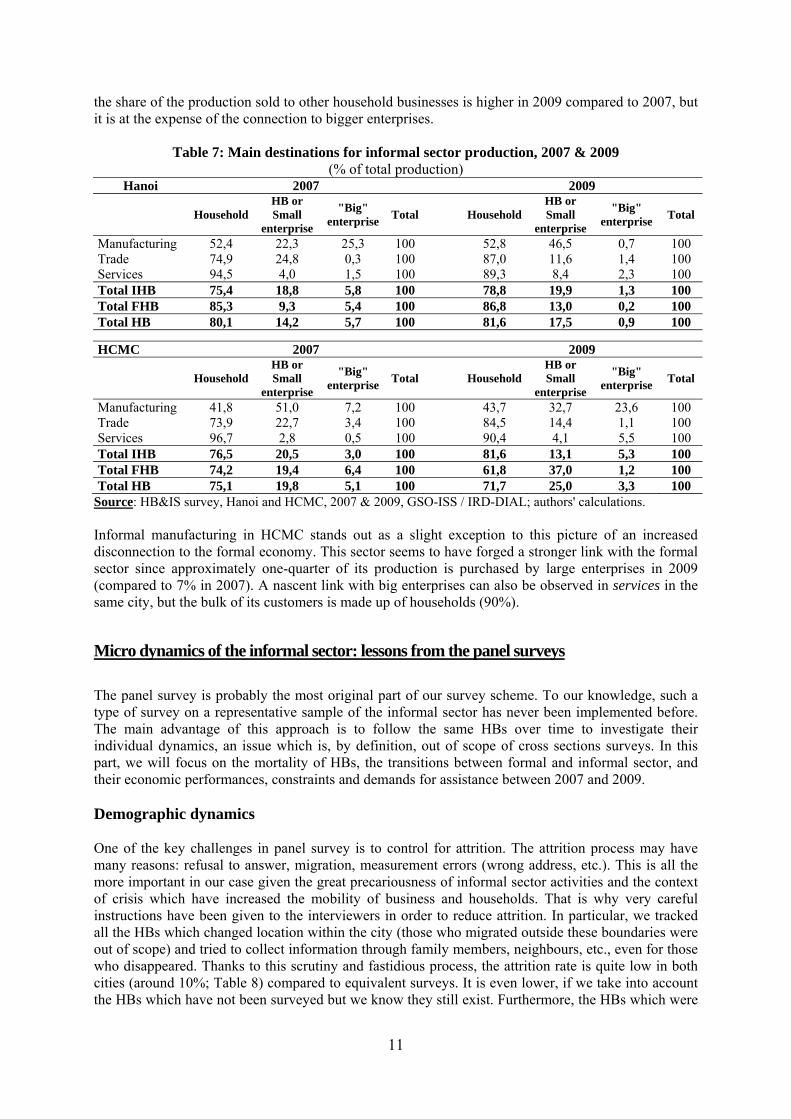
11
the share of the production sold to other household businesses is higher in 2009 compared to 2007, but it is at the expense of the connection to bigger enterprises.
Table 7: Main destinations for informal sector production, 2007 & 2009
(% of total production) Hanoi 2007 2009
Household
HB or Small
enterprise
"Big" enterprise
Total
HouseholdHB or Small
enterprise
"Big" enterprise
Total
Manufacturing 52,4 22,3 25,3 100 52,8 46,5 0,7 100 Trade 74,9 24,8 0,3 100 87,0 11,6 1,4 100 Services 94,5 4,0 1,5 100 89,3 8,4 2,3 100 Total IHB 75,4 18,8 5,8 100 78,8 19,9 1,3 100 Total FHB 85,3 9,3 5,4 100 86,8 13,0 0,2 100 Total HB 80,1 14,2 5,7 100 81,6 17,5 0,9 100
HCMC 2007 2009
Household HB or Small
enterprise
"Big" enterprise
Total
HouseholdHB or Small
enterprise
"Big" enterprise
Total
Manufacturing 41,8 51,0 7,2 100 43,7 32,7 23,6 100 Trade 73,9 22,7 3,4 100 84,5 14,4 1,1 100 Services 96,7 2,8 0,5 100 90,4 4,1 5,5 100 Total IHB 76,5 20,5 3,0 100 81,6 13,1 5,3 100 Total FHB 74,2 19,4 6,4 100 61,8 37,0 1,2 100 Total HB 75,1 19,8 5,1 100 71,7 25,0 3,3 100
Source: HB&IS survey, Hanoi and HCMC, 2007 & 2009, GSO-ISS / IRD-DIAL; authors' calculations.
Informal manufacturing in HCMC stands out as a slight exception to this picture of an increased disconnection to the formal economy. This sector seems to have forged a stronger link with the formal sector since approximately one-quarter of its production is purchased by large enterprises in 2009 (compared to 7% in 2007). A nascent link with big enterprises can also be observed in services in the same city, but the bulk of its customers is made up of households (90%).
Micro dynamics of the informal sector: lessons from the panel surveys
The panel survey is probably the most original part of our survey scheme. To our knowledge, such a type of survey on a representative sample of the informal sector has never been implemented before. The main advantage of this approach is to follow the same HBs over time to investigate their individual dynamics, an issue which is, by definition, out of scope of cross sections surveys. In this part, we will focus on the mortality of HBs, the transitions between formal and informal sector, and their economic performances, constraints and demands for assistance between 2007 and 2009. Demographic dynamics One of the key challenges in panel survey is to control for attrition. The attrition process may have many reasons: refusal to answer, migration, measurement errors (wrong address, etc.). This is all the more important in our case given the great precariousness of informal sector activities and the context of crisis which have increased the mobility of business and households. That is why very careful instructions have been given to the interviewers in order to reduce attrition. In particular, we tracked all the HBs which changed location within the city (those who migrated outside these boundaries were out of scope) and tried to collect information through family members, neighbours, etc., even for those who disappeared. Thanks to this scrutiny and fastidious process, the attrition rate is quite low in both cities (around 10%; Table 8) compared to equivalent surveys. It is even lower, if we take into account the HBs which have not been surveyed but we know they still exist. Furthermore, the HBs which were
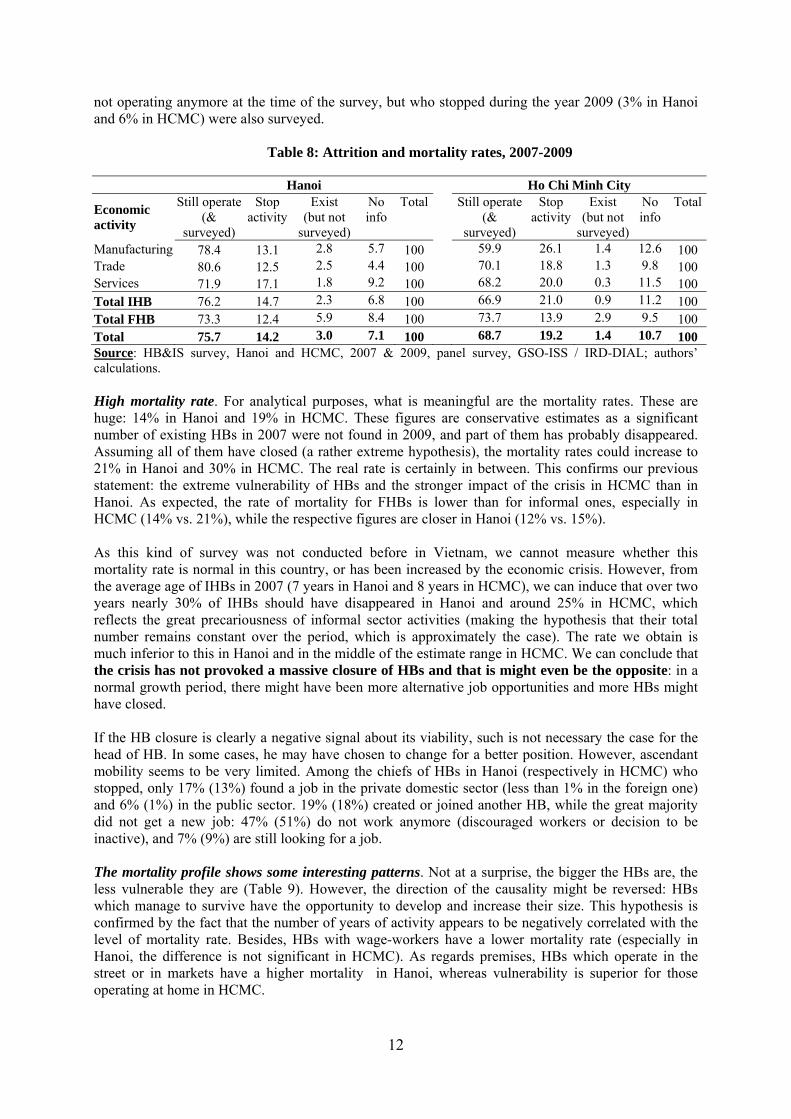
12
not operating anymore at the time of the survey, but who stopped during the year 2009 (3% in Hanoi and 6% in HCMC) were also surveyed.
Table 8: Attrition and mortality rates, 2007-2009
Hanoi Ho Chi Minh City
Economic activity
Still operate (&
surveyed)
Stop activity
Exist (but not
surveyed)
No info
Total Still operate (&
surveyed)
Stop activity
Exist (but not
surveyed)
No info
Total
Manufacturing 78.4 13.1 2.8 5.7 100 59.9 26.1 1.4 12.6 100 Trade 80.6 12.5 2.5 4.4 100 70.1 18.8 1.3 9.8 100 Services 71.9 17.1 1.8 9.2 100 68.2 20.0 0.3 11.5 100 Total IHB 76.2 14.7 2.3 6.8 100 66.9 21.0 0.9 11.2 100 Total FHB 73.3 12.4 5.9 8.4 100 73.7 13.9 2.9 9.5 100 Total 75.7 14.2 3.0 7.1 100 68.7 19.2 1.4 10.7 100 Source: HB&IS survey, Hanoi and HCMC, 2007 & 2009, panel survey, GSO-ISS / IRD-DIAL; authors’ calculations. High mortality rate. For analytical purposes, what is meaningful are the mortality rates. These are huge: 14% in Hanoi and 19% in HCMC. These figures are conservative estimates as a significant number of existing HBs in 2007 were not found in 2009, and part of them has probably disappeared. Assuming all of them have closed (a rather extreme hypothesis), the mortality rates could increase to 21% in Hanoi and 30% in HCMC. The real rate is certainly in between. This confirms our previous statement: the extreme vulnerability of HBs and the stronger impact of the crisis in HCMC than in Hanoi. As expected, the rate of mortality for FHBs is lower than for informal ones, especially in HCMC (14% vs. 21%), while the respective figures are closer in Hanoi (12% vs. 15%). As this kind of survey was not conducted before in Vietnam, we cannot measure whether this mortality rate is normal in this country, or has been increased by the economic crisis. However, from the average age of IHBs in 2007 (7 years in Hanoi and 8 years in HCMC), we can induce that over two years nearly 30% of IHBs should have disappeared in Hanoi and around 25% in HCMC, which reflects the great precariousness of informal sector activities (making the hypothesis that their total number remains constant over the period, which is approximately the case). The rate we obtain is much inferior to this in Hanoi and in the middle of the estimate range in HCMC. We can conclude that the crisis has not provoked a massive closure of HBs and that is might even be the opposite: in a normal growth period, there might have been more alternative job opportunities and more HBs might have closed. If the HB closure is clearly a negative signal about its viability, such is not necessary the case for the head of HB. In some cases, he may have chosen to change for a better position. However, ascendant mobility seems to be very limited. Among the chiefs of HBs in Hanoi (respectively in HCMC) who stopped, only 17% (13%) found a job in the private domestic sector (less than 1% in the foreign one) and 6% (1%) in the public sector. 19% (18%) created or joined another HB, while the great majority did not get a new job: 47% (51%) do not work anymore (discouraged workers or decision to be inactive), and 7% (9%) are still looking for a job. The mortality profile shows some interesting patterns. Not at a surprise, the bigger the HBs are, the less vulnerable they are (Table 9). However, the direction of the causality might be reversed: HBs which manage to survive have the opportunity to develop and increase their size. This hypothesis is confirmed by the fact that the number of years of activity appears to be negatively correlated with the level of mortality rate. Besides, HBs with wage-workers have a lower mortality rate (especially in Hanoi, the difference is not significant in HCMC). As regards premises, HBs which operate in the street or in markets have a higher mortality in Hanoi, whereas vulnerability is superior for those operating at home in HCMC.

13
Some differences also appear between Hanoi and HCMC. Globally, Services are more vulnerable in Hanoi whereas the mortality rate is higher in manufacturing and construction in HCMC. If we look into details, transportation and repair services as well as textiles seem to have a lower chance to survive in Hanoi. Wholesale trade, construction and repair services are the economic sectors which have suffered the most in HCMC.
Table 9: Mortality rate by type of HBs and HB’s head (% of HBs in 2007)
Type of HB Hanoi HCMC Head of HB Hanoi HCMC Type of premise Sex Outside 16.5 17.7 Male 15.6 18.0 Home 12.8 22.2 Female 13.0 20.1 Professional 13.7 15.0
Level of education Nb. year activity Primary 15.8 17.9 0-2 years 19.9 23.6 Lower secondary 11.4 21.9 3-4 years 18.3 21.3 Upper secondary 17.0 15.8 5-8 years 12.9 18.3 University 15.5 24.4 More than 8 years 10.0 16.4
Motivation in creating the HB Size Cannot find formal job 15.7 18.4 Self-employment 16.4 21.0 Cannot find job in HB 17.0 25.3 2-4 persons 10.8 16.8 Better income 12.5 20.8 5 persons or more 5.2 14.8 Independence 13.2 19.3
Family tradition 4.5 10.0 Wage-work Other 16.6 19.8 No wage-worker 15.0 19.3 With wage-worker 9.3 18.4 Total 14.2 19.2 Total 14.2 19.2
Source: HB&IS survey, Hanoi and HCMC, 2007 & 2009, panel survey, GSO-ISS / IRD-DIAL; authors’ calculations. If we now look at the characteristics of the HB’s heads, there are no clear links between the rate of mortality and the level of education of the HBs' head nor his/her apprenticeship. This result is due to the fact that well-educated or well-trained persons have less difficulty to move out and find jobs in the formal sector. Nevertheless, experience (longevity) and age of the head of HB appear to be correlated with the chance to survive. This observation could also stem from the higher propensity for the young to move from one job to another, hoping for better conditions. Finally, the motivation of the HB's head when launching his/her activity seems to have some influence on the mortality rate. Lower mortality rates are observed among HBs created by voluntary choice, in order to follow family tradition, or to a lesser extent to get more autonomy or a better income (and not by lack of choice). Transition between formal and informal sectors Many cases of formal HBs which became informal. While at the aggregate level, the respective shares of formal and informal HBs did not vary a lot, the dynamic picture shows significant transitions between sectors (Table 10). On the one hand, around one IHB out of ten got formalized, in both cities. On the other hand, 15% of FHBs in HCMC, and a huge 31% in Hanoi entered the informal sector. All in all, in two years more than 12% of the 2007 changed status, stressing the shortcomings of the usual static measures. Without any benchmark, it is difficult to assess these figures. However, one may reasonably assume that a part of this striking informalization process (especially in Hanoi) is due to the crisis. Surprisingly, it is more pronounced in the capital city where the impact of the crisis has been less severe.
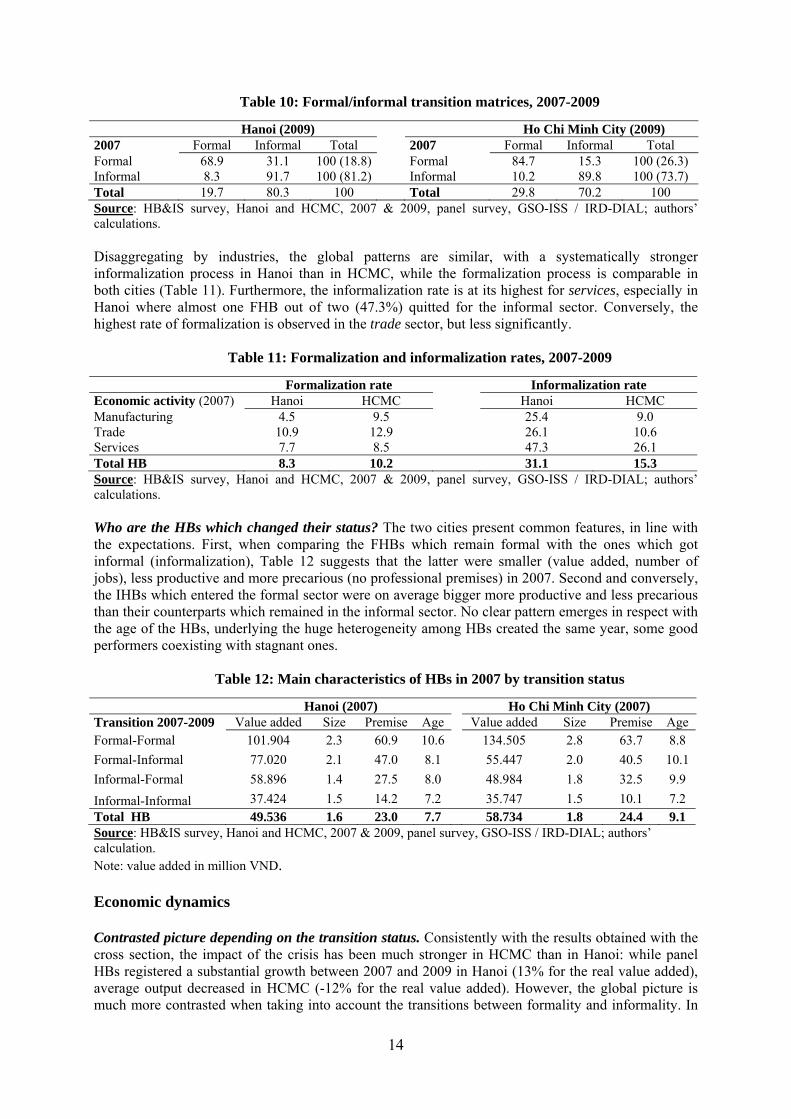
14
Table 10: Formal/informal transition matrices, 2007-2009
Hanoi (2009) Ho Chi Minh City (2009) 2007 Formal Informal Total 2007 Formal Informal Total Formal 68.9 31.1 100 (18.8) Formal 84.7 15.3 100 (26.3) Informal 8.3 91.7 100 (81.2) Informal 10.2 89.8 100 (73.7) Total 19.7 80.3 100 Total 29.8 70.2 100 Source: HB&IS survey, Hanoi and HCMC, 2007 & 2009, panel survey, GSO-ISS / IRD-DIAL; authors’ calculations. Disaggregating by industries, the global patterns are similar, with a systematically stronger informalization process in Hanoi than in HCMC, while the formalization process is comparable in both cities (Table 11). Furthermore, the informalization rate is at its highest for services, especially in Hanoi where almost one FHB out of two (47.3%) quitted for the informal sector. Conversely, the highest rate of formalization is observed in the trade sector, but less significantly.
Table 11: Formalization and informalization rates, 2007-2009
Formalization rate Informalization rate Economic activity (2007) Hanoi HCMC Hanoi HCMC Manufacturing 4.5 9.5 25.4 9.0 Trade 10.9 12.9 26.1 10.6 Services 7.7 8.5 47.3 26.1 Total HB 8.3 10.2 31.1 15.3 Source: HB&IS survey, Hanoi and HCMC, 2007 & 2009, panel survey, GSO-ISS / IRD-DIAL; authors’ calculations. Who are the HBs which changed their status? The two cities present common features, in line with the expectations. First, when comparing the FHBs which remain formal with the ones which got informal (informalization), Table 12 suggests that the latter were smaller (value added, number of jobs), less productive and more precarious (no professional premises) in 2007. Second and conversely, the IHBs which entered the formal sector were on average bigger more productive and less precarious than their counterparts which remained in the informal sector. No clear pattern emerges in respect with the age of the HBs, underlying the huge heterogeneity among HBs created the same year, some good performers coexisting with stagnant ones.
Table 12: Main characteristics of HBs in 2007 by transition status
Hanoi (2007) Ho Chi Minh City (2007) Transition 2007-2009 Value added Size Premise Age Value added Size Premise Age Formal-Formal 101.904 2.3 60.9 10.6 134.505 2.8 63.7 8.8
Formal-Informal 77.020 2.1 47.0 8.1 55.447 2.0 40.5 10.1
Informal-Formal 58.896 1.4 27.5 8.0 48.984 1.8 32.5 9.9 Informal-Informal 37.424 1.5 14.2 7.2 35.747 1.5 10.1 7.2 Total HB 49.536 1.6 23.0 7.7 58.734 1.8 24.4 9.1 Source: HB&IS survey, Hanoi and HCMC, 2007 & 2009, panel survey, GSO-ISS / IRD-DIAL; authors’ calculation. Note: value added in million VND. Economic dynamics Contrasted picture depending on the transition status. Consistently with the results obtained with the cross section, the impact of the crisis has been much stronger in HCMC than in Hanoi: while panel HBs registered a substantial growth between 2007 and 2009 in Hanoi (13% for the real value added), average output decreased in HCMC (-12% for the real value added). However, the global picture is much more contrasted when taking into account the transitions between formality and informality. In
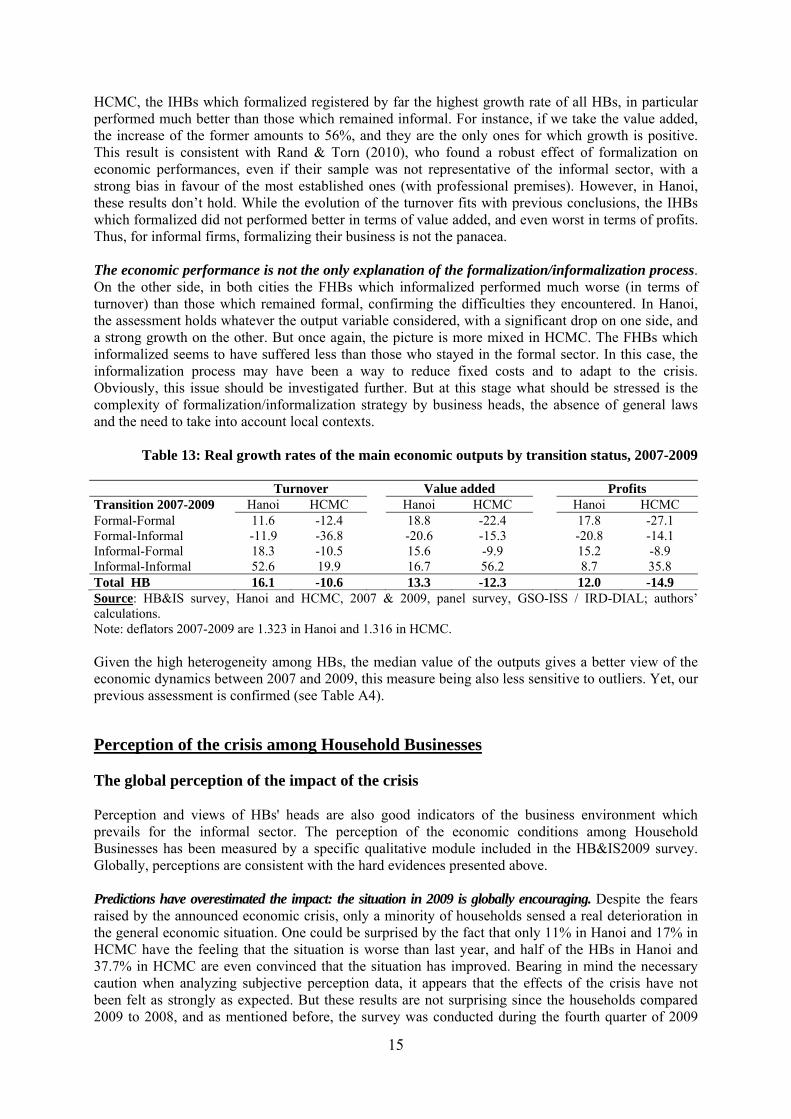
15
HCMC, the IHBs which formalized registered by far the highest growth rate of all HBs, in particular performed much better than those which remained informal. For instance, if we take the value added, the increase of the former amounts to 56%, and they are the only ones for which growth is positive. This result is consistent with Rand & Torn (2010), who found a robust effect of formalization on economic performances, even if their sample was not representative of the informal sector, with a strong bias in favour of the most established ones (with professional premises). However, in Hanoi, these results don’t hold. While the evolution of the turnover fits with previous conclusions, the IHBs which formalized did not performed better in terms of value added, and even worst in terms of profits. Thus, for informal firms, formalizing their business is not the panacea. The economic performance is not the only explanation of the formalization/informalization process. On the other side, in both cities the FHBs which informalized performed much worse (in terms of turnover) than those which remained formal, confirming the difficulties they encountered. In Hanoi, the assessment holds whatever the output variable considered, with a significant drop on one side, and a strong growth on the other. But once again, the picture is more mixed in HCMC. The FHBs which informalized seems to have suffered less than those who stayed in the formal sector. In this case, the informalization process may have been a way to reduce fixed costs and to adapt to the crisis. Obviously, this issue should be investigated further. But at this stage what should be stressed is the complexity of formalization/informalization strategy by business heads, the absence of general laws and the need to take into account local contexts.
Table 13: Real growth rates of the main economic outputs by transition status, 2007-2009
Turnover Value added Profits Transition 2007-2009 Hanoi HCMC Hanoi HCMC Hanoi HCMC Formal-Formal 11.6 -12.4 18.8 -22.4 17.8 -27.1 Formal-Informal -11.9 -36.8 -20.6 -15.3 -20.8 -14.1 Informal-Formal 18.3 -10.5 15.6 -9.9 15.2 -8.9 Informal-Informal 52.6 19.9 16.7 56.2 8.7 35.8 Total HB 16.1 -10.6 13.3 -12.3 12.0 -14.9 Source: HB&IS survey, Hanoi and HCMC, 2007 & 2009, panel survey, GSO-ISS / IRD-DIAL; authors’ calculations. Note: deflators 2007-2009 are 1.323 in Hanoi and 1.316 in HCMC. Given the high heterogeneity among HBs, the median value of the outputs gives a better view of the economic dynamics between 2007 and 2009, this measure being also less sensitive to outliers. Yet, our previous assessment is confirmed (see Table A4).
Perception of the crisis among Household Businesses The global perception of the impact of the crisis Perception and views of HBs' heads are also good indicators of the business environment which prevails for the informal sector. The perception of the economic conditions among Household Businesses has been measured by a specific qualitative module included in the HB&IS2009 survey. Globally, perceptions are consistent with the hard evidences presented above. Predictions have overestimated the impact: the situation in 2009 is globally encouraging. Despite the fears raised by the announced economic crisis, only a minority of households sensed a real deterioration in the general economic situation. One could be surprised by the fact that only 11% in Hanoi and 17% in HCMC have the feeling that the situation is worse than last year, and half of the HBs in Hanoi and 37.7% in HCMC are even convinced that the situation has improved. Bearing in mind the necessary caution when analyzing subjective perception data, it appears that the effects of the crisis have not been felt as strongly as expected. But these results are not surprising since the households compared 2009 to 2008, and as mentioned before, the survey was conducted during the fourth quarter of 2009

16
when the economy was already recovering. Considering the assessment of the prevailing situation –not comparing with 2008-, the percentage of pessimist HBs is strikingly weak with only 0.1 and 2% respectively in Hanoi and HCMC (see Table A5) describing the economic situation as “very bad”. Apparently, at the end of 2009, the crisis was behind.
Table 15: Assessment on the general economic in 2009 compared to 2008 (% of HBs)
Hanoi HCMC Economic activity Better Unchanged Worse Better Unchanged Worse Manufacturing 52.7 38.3 9.0 29.6 52.7 17.7 Trade 51.2 36.8 12.0 38.2 43.5 18.4 Services 40.7 49.3 10.0 38.1 46.4 15.5 Total IHB 47.9 41.6 10.5 36.5 46.8 16.7 Total FHB 54.9 34.3 10.8 43.1 41.3 15.6 Total HB 49.0 40.5 10.6 37.7 45.8 16.5 Source: HB&IS survey, Hanoi and HCMC, 2009, GSO-ISS / IRD-DIAL; authors’ calculations. Different impact depending on the city and the HBs' Status. Regarding both the comparison between years and the ad-hoc assessment, two distinctions are noticeable:
- On the one hand, between Hanoi and HCMC: the former is clearly less affected than the latter. We found at the same time less HBs in HCMC to feel an improvement and more HBs to feel deterioration with an average gap of 6 points.
- On the other hand, between FHBs and IHBs: our hypothesis was that the situation of the informal sector, globally less protected, could make it more sensitive to the crisis. Sticking to the measurement of perception, one can notice that less IHBs tend to feel an improvement (average difference of 7 percentage points).
Although subjective, information given by the measurement of perception is nevertheless useful to draw a general picture of the impact of the crisis, which seems to be weaker than expected. Exploring the data comparable with quantitative statistics appears as a necessary next step: if the situation in 2009 is perceived as better than in 2008, hard conditions are nevertheless a reality regarding some aspects. Impact on the workforce Limited effects on the labor quantity. The number of employees is low by nature among HBs with a prevalence of micro-units and self-employment. If we rely on the declaration of HBs' heads, the fluctuations are weak: the majority says that the size of their business did not change compared to 2008 (Table 16). This result is consistent with the quantitative findings of the HB&IS survey presented in the previous section and corroborates the results of the LFS: the negative impact of the crisis on the labor market was limited in Vietnam.
Table 16: Evolution of the number of employees (% of HBs)
Hanoi HCMC Economic activity Increased Decreased Balance (1) Increased Decreased Balance (1) Manufacturing 32.4 4.5 27.9 7.2 1.6 5.6 Trade 0.0 7.5 -7.5 0.0 0.0 0.0 Services 5.8 7.0 -1.2 5.8 6.2 -0.4 Total IHB 16.2 6.0 10.2 6.0 5.5 0.5 Total FHB 12.3 8.3 4.0 6.5 10.9 -4.4 Total HB 15.0 6.7 8.3 6.3 7.4 -1.1 Source: HB&IS survey, Hanoi and HCMC, 2009, GSO-ISS / IRD-DIAL; authors’ calculations.
(1) Increased-Decreased
17
On average, 15% of HBs in Hanoi have more employees while only 7% have fewer. The specific case of informal manufacturing in Hanoi can be highlighted with a relatively high proportion of units which have increased their size (32%). In HCMC, the HBs with a decreasing number of employees are as numerous as the ones which have extended their size (nearly 7%). The contrast between the two cities is once again noticeable. The balance (HBs which have increased its workforce- HBs which have reduced its size) shows a better performance of informal HBs compared to formal ones (10% vs. 4% in Hanoi and 0.5% vs. -4% in HCMC).
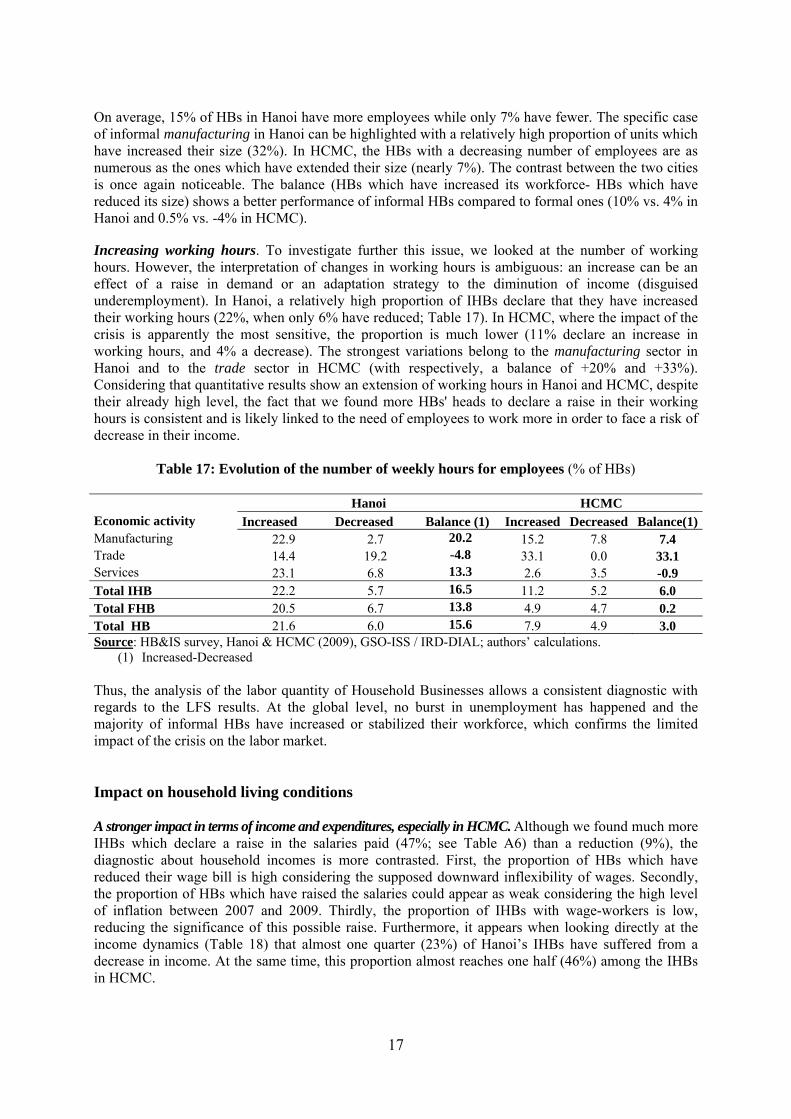
Increasing working hours. To investigate further this issue, we looked at the number of working hours. However, the interpretation of changes in working hours is ambiguous: an increase can be an effect of a raise in demand or an adaptation strategy to the diminution of income (disguised underemployment). In Hanoi, a relatively high proportion of IHBs declare that they have increased their working hours (22%, when only 6% have reduced; Table 17). In HCMC, where the impact of the crisis is apparently the most sensitive, the proportion is much lower (11% declare an increase in working hours, and 4% a decrease). The strongest variations belong to the manufacturing sector in Hanoi and to the trade sector in HCMC (with respectively, a balance of +20% and +33%). Considering that quantitative results show an extension of working hours in Hanoi and HCMC, despite their already high level, the fact that we found more HBs' heads to declare a raise in their working hours is consistent and is likely linked to the need of employees to work more in order to face a risk of decrease in their income.
Table 17: Evolution of the number of weekly hours for employees (% of HBs)
Hanoi HCMC Economic activity Increased Decreased Balance (1) Increased Decreased Balance(1) Manufacturing 22.9 2.7 20.2 15.2 7.8 7.4 Trade 14.4 19.2 -4.8 33.1 0.0 33.1 Services 23.1 6.8 13.3 2.6 3.5 -0.9 Total IHB 22.2 5.7 16.5 11.2 5.2 6.0 Total FHB 20.5 6.7 13.8 4.9 4.7 0.2 Total HB 21.6 6.0 15.6 7.9 4.9 3.0 Source: HB&IS survey, Hanoi & HCMC (2009), GSO-ISS / IRD-DIAL; authors’ calculations.
(1) Increased-Decreased Thus, the analysis of the labor quantity of Household Businesses allows a consistent diagnostic with regards to the LFS results. At the global level, no burst in unemployment has happened and the majority of informal HBs have increased or stabilized their workforce, which confirms the limited impact of the crisis on the labor market. Impact on household living conditions A stronger impact in terms of income and expenditures, especially in HCMC. Although we found much more IHBs which declare a raise in the salaries paid (47%; see Table A6) than a reduction (9%), the diagnostic about household incomes is more contrasted. First, the proportion of HBs which have reduced their wage bill is high considering the supposed downward inflexibility of wages. Secondly, the proportion of HBs which have raised the salaries could appear as weak considering the high level of inflation between 2007 and 2009. Thirdly, the proportion of IHBs with wage-workers is low, reducing the significance of this possible raise. Furthermore, it appears when looking directly at the income dynamics (Table 18) that almost one quarter (23%) of Hanoi’s IHBs have suffered from a decrease in income. At the same time, this proportion almost reaches one half (46%) among the IHBs in HCMC.
18
Table 18: Evolution of the household income (% of HB’s heads)
Hanoi HCMC Economic activity Increased Decreased Balance (1) Increased Decreased Balance (1) Manufacturing 46.2 19.7 26.5 11.7 41.1 -29.4 Trade 35.3 24.0 11.3 9.7 52.1 -42.4 Services 25.3 24.9 0.4 10.6 44.0 -33.4 Total IHB 34.5 23.3 11.3 10.6 45.6 -35.0 Total FHB 28.7 29.7 -1.0 14.8 36.7 -21.9 Total HB 33.6 24.2 9.4 11.3 44.1 -32.8 Source: HB&IS survey, Hanoi and HCMC, 2009, GSO-ISS / IRD-DIAL; authors’ calculations.
(1) Increased-Decreased Even if some distance has to be kept considering the imprecision of qualitative (subjective) data to measure changes in income, these results tend to prove the reality of the crisis, particularly hard in HCMC. The contrast between the two cities is consistent with previous findings. However, one can perceive, thanks to the qualitative information, the degree of severity with which the crisis has been felt: even in Hanoi, where a growth of income has been shown, one out of four IHBs in trade and services declare a fall of household's income. Beside the fact that the average evolution hides heterogeneous situations, another explanation could be could be the underestimation of inflation by official data; between 2007 and 2009, the total consumer price index increased by 28% while the price of staple food products (rice and grain) increased by 54%; as the weight of these products in the consumer price index (around 10%) is much inferior to their weight in the total budget of poor people, deflating income by the official index probably overestimates incomes of the informal sector. Cut in food expenditures and reduction of savings. Consumption measures confirm the previous results and allow us: first, to stress again the specificity of HCMC, where the crisis has been acute (37% of informal households declare they had to reduce their food expenditures; Table 19); second, to underline the stronger reaction of the informal sector, where the percentage of households who cut their expenditures is systematically higher –and significant even in Hanoi. It is interesting to point out that health and education budgets are less elastic when it comes to reducing expenditures; however, the relatively high proportion (17%) of informal households who had to reduce health spending in HCMC is still a strong signal, and the relative fragility of the informal sector appears clearly as the percentages are almost twice higher than in the formal one. Regarding the gap between quantitative evolution and perception, another indication comes from the decrease in savings: the number of informal households who have reduced their savings exceeds the number of households with the opposite trend (the balance is +26 points in Hanoi and +43 points in HCMC; see Table A7). This phenomenon reveals a probable fall of the savings level. Interestingly, the decrease in savings did not turn into more debt, probably because the possibilities to borrow were very limited.
Table 19: Households having to cut expenditures in 2009 (% of HB’s heads)
Economic activity Food Health Education Other
Hanoi HCMC Hanoi HCMC Hanoi HCMC Hanoi HCMC Manufacturing 7.6 29.6 7.4 13.0 5.5 5.1 15.3 28.1 Trade 7.6 38.3 8.5 15.6 7.0 7.9 13.4 19.9 Services 12.9 38.5 6.3 18.6 4.7 6.6 16.0 26.0 Total IHB 9.5 36.8 7.5 16.7 5.8 6.7 14.8 24.8
Total FHB 5.9 18.4 5.8 8.2 4.9 4.3 5.9 18.7
Total HB 8.9 33.6 7.2 15.2 5.7 6.3 13.4 23.7 Source: HB&IS survey, Hanoi and HCMC, 2009, GSO-ISS / IRD-DIAL; authors’ calculations.
19
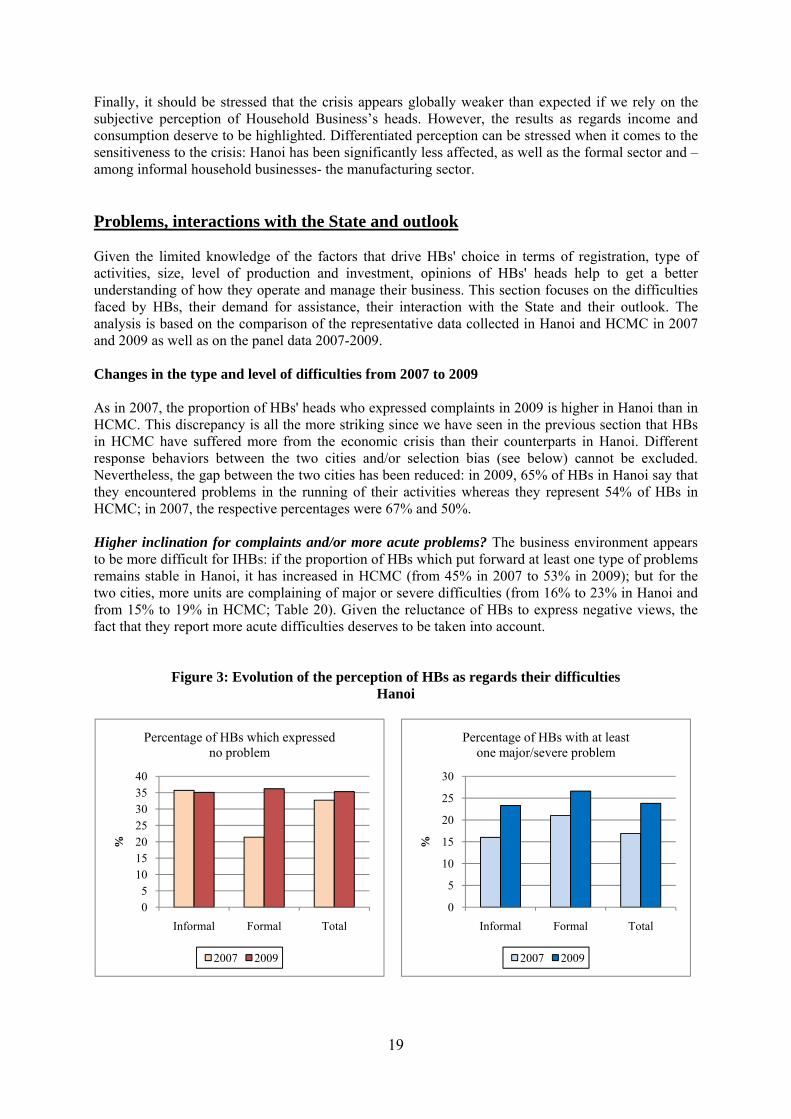
Finally, it should be stressed that the crisis appears globally weaker than expected if we rely on the subjective perception of Household Business’s heads. However, the results as regards income and consumption deserve to be highlighted. Differentiated perception can be stressed when it comes to the sensitiveness to the crisis: Hanoi has been significantly less affected, as well as the formal sector and –among informal household businesses- the manufacturing sector. Problems, interactions with the State and outlook Given the limited knowledge of the factors that drive HBs' choice in terms of registration, type of activities, size, level of production and investment, opinions of HBs' heads help to get a better understanding of how they operate and manage their business. This section focuses on the difficulties faced by HBs, their demand for assistance, their interaction with the State and their outlook. The analysis is based on the comparison of the representative data collected in Hanoi and HCMC in 2007 and 2009 as well as on the panel data 2007-2009. Changes in the type and level of difficulties from 2007 to 2009 As in 2007, the proportion of HBs' heads who expressed complaints in 2009 is higher in Hanoi than in HCMC. This discrepancy is all the more striking since we have seen in the previous section that HBs in HCMC have suffered more from the economic crisis than their counterparts in Hanoi. Different response behaviors between the two cities and/or selection bias (see below) cannot be excluded. Nevertheless, the gap between the two cities has been reduced: in 2009, 65% of HBs in Hanoi say that they encountered problems in the running of their activities whereas they represent 54% of HBs in HCMC; in 2007, the respective percentages were 67% and 50%. Higher inclination for complaints and/or more acute problems? The business environment appears to be more difficult for IHBs: if the proportion of HBs which put forward at least one type of problems remains stable in Hanoi, it has increased in HCMC (from 45% in 2007 to 53% in 2009); but for the two cities, more units are complaining of major or severe difficulties (from 16% to 23% in Hanoi and from 15% to 19% in HCMC; Table 20). Given the reluctance of HBs to express negative views, the fact that they report more acute difficulties deserves to be taken into account.
Figure 3: Evolution of the perception of HBs as regards their difficulties Hanoi
05
10152025303540
Informal Formal Total
%
Percentage of HBs which expressed no problem
2007 2009
0
5
10
15
20
25
30
Informal Formal Total
%
Percentage of HBs with at least one major/severe problem
2007 2009
20
Ho Chi Minh City
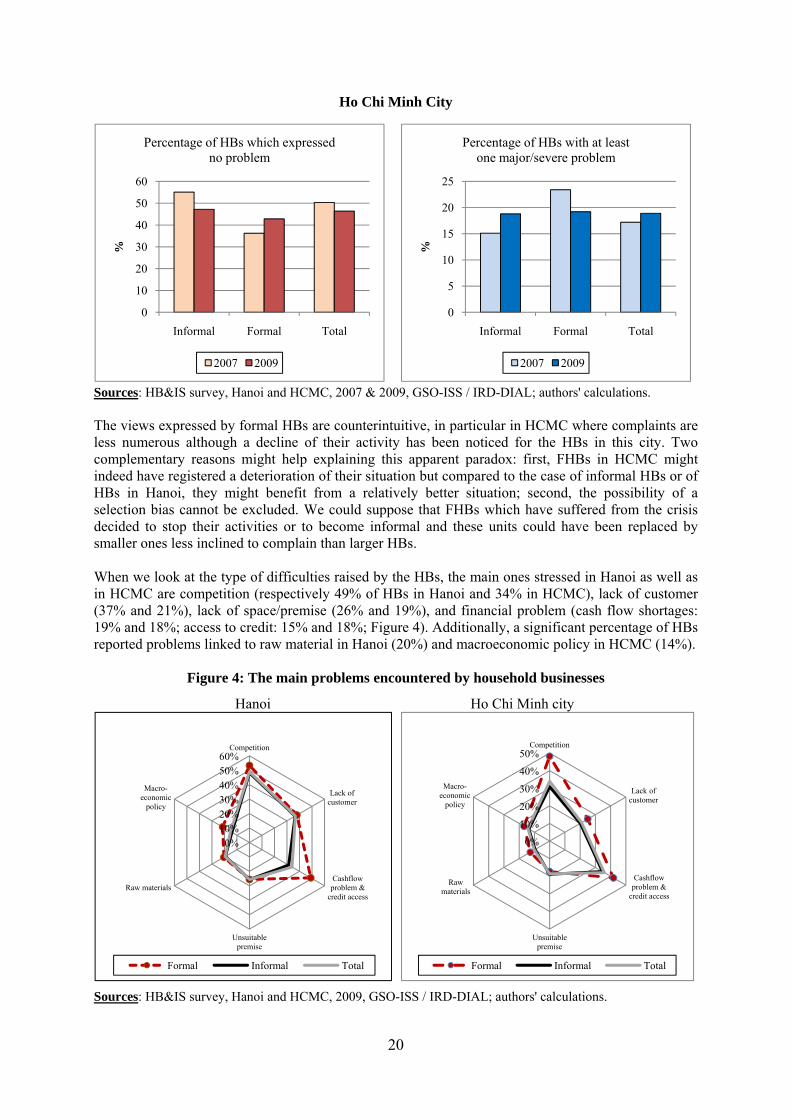
Sources: HB&IS survey, Hanoi and HCMC, 2007 & 2009, GSO-ISS / IRD-DIAL; authors' calculations. The views expressed by formal HBs are counterintuitive, in particular in HCMC where complaints are less numerous although a decline of their activity has been noticed for the HBs in this city. Two complementary reasons might help explaining this apparent paradox: first, FHBs in HCMC might indeed have registered a deterioration of their situation but compared to the case of informal HBs or of HBs in Hanoi, they might benefit from a relatively better situation; second, the possibility of a selection bias cannot be excluded. We could suppose that FHBs which have suffered from the crisis decided to stop their activities or to become informal and these units could have been replaced by smaller ones less inclined to complain than larger HBs. When we look at the type of difficulties raised by the HBs, the main ones stressed in Hanoi as well as in HCMC are competition (respectively 49% of HBs in Hanoi and 34% in HCMC), lack of customer (37% and 21%), lack of space/premise (26% and 19%), and financial problem (cash flow shortages: 19% and 18%; access to credit: 15% and 18%; Figure 4). Additionally, a significant percentage of HBs reported problems linked to raw material in Hanoi (20%) and macroeconomic policy in HCMC (14%).
Figure 4: The main problems encountered by household businesses
Hanoi Ho Chi Minh city
Sources: HB&IS survey, Hanoi and HCMC, 2009, GSO-ISS / IRD-DIAL; authors' calculations.
0
10
20
30
40
50
60
Informal Formal Total
%
Percentage of HBs which expressed no problem
2007 2009
0
5
10
15
20
25
Informal Formal Total
%
Percentage of HBs with at least one major/severe problem
2007 2009
0%10%20%30%40%50%60%
Competition
Lack of customer
Cashflow problem &
credit access
Unsuitable premise
Raw materials
Macro-economic
policy
Formal Informal Total
0%
10%
20%
30%
40%
50%Competition
Lack of customer
Cashflow problem &
credit access
Unsuitable premise
Raw materials
Macro-economic
policy
Formal Informal Total
21
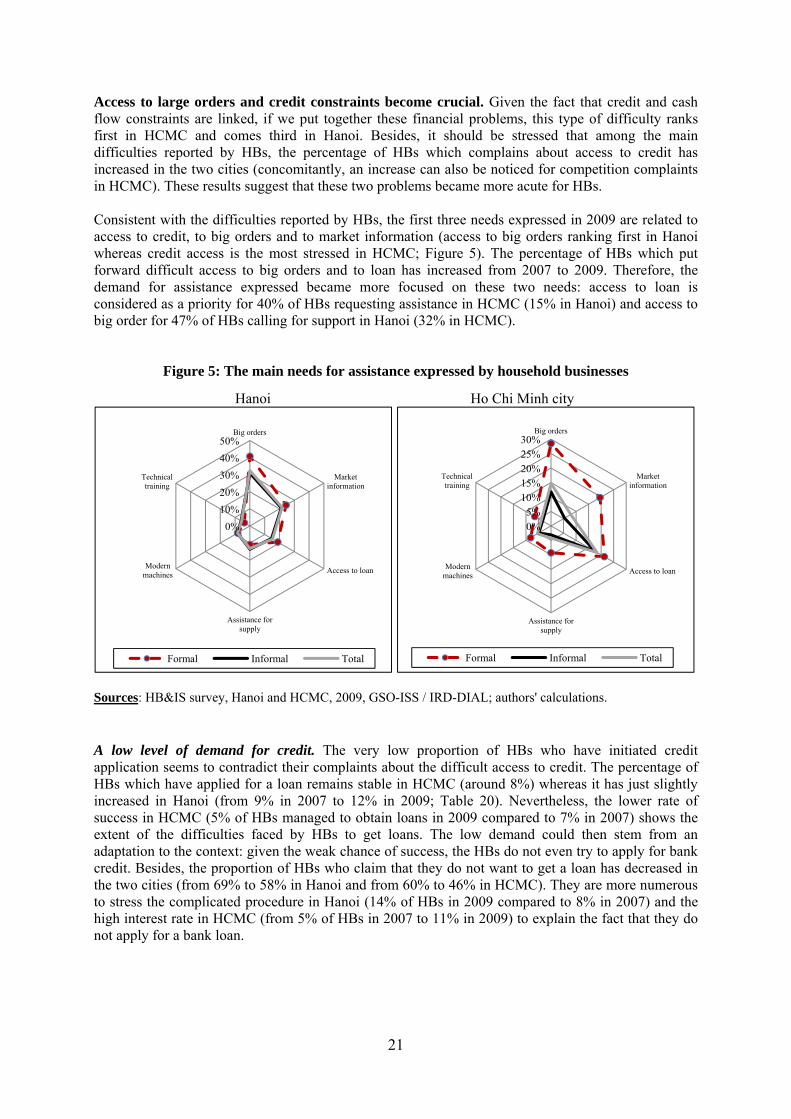
Access to large orders and credit constraints become crucial. Given the fact that credit and cash flow constraints are linked, if we put together these financial problems, this type of difficulty ranks first in HCMC and comes third in Hanoi. Besides, it should be stressed that among the main difficulties reported by HBs, the percentage of HBs which complains about access to credit has increased in the two cities (concomitantly, an increase can also be noticed for competition complaints in HCMC). These results suggest that these two problems became more acute for HBs. Consistent with the difficulties reported by HBs, the first three needs expressed in 2009 are related to access to credit, to big orders and to market information (access to big orders ranking first in Hanoi whereas credit access is the most stressed in HCMC; Figure 5). The percentage of HBs which put forward difficult access to big orders and to loan has increased from 2007 to 2009. Therefore, the demand for assistance expressed became more focused on these two needs: access to loan is considered as a priority for 40% of HBs requesting assistance in HCMC (15% in Hanoi) and access to big order for 47% of HBs calling for support in Hanoi (32% in HCMC).
Figure 5: The main needs for assistance expressed by household businesses
Hanoi Ho Chi Minh city
Sources: HB&IS survey, Hanoi and HCMC, 2009, GSO-ISS / IRD-DIAL; authors' calculations. A low level of demand for credit. The very low proportion of HBs who have initiated credit application seems to contradict their complaints about the difficult access to credit. The percentage of HBs which have applied for a loan remains stable in HCMC (around 8%) whereas it has just slightly increased in Hanoi (from 9% in 2007 to 12% in 2009; Table 20). Nevertheless, the lower rate of success in HCMC (5% of HBs managed to obtain loans in 2009 compared to 7% in 2007) shows the extent of the difficulties faced by HBs to get loans. The low demand could then stem from an adaptation to the context: given the weak chance of success, the HBs do not even try to apply for bank credit. Besides, the proportion of HBs who claim that they do not want to get a loan has decreased in the two cities (from 69% to 58% in Hanoi and from 60% to 46% in HCMC). They are more numerous to stress the complicated procedure in Hanoi (14% of HBs in 2009 compared to 8% in 2007) and the high interest rate in HCMC (from 5% of HBs in 2007 to 11% in 2009) to explain the fact that they do not apply for a bank loan.
0%
10%
20%
30%
40%
50%Big orders
Market information
Access to loan
Assistance for supply
Modern machines
Technical training
Formal Informal Total
0%5%
10%15%20%25%30%
Big orders
Market information
Access to loan
Assistance for supply
Modern machines
Technical training
Formal Informal Total

22
Table 20: Informal sector applications for bank loans and bank loans taken out
Have applied for a
loan (%)
Get a loan (%)
Reasons why you did not apply for a bank loan in 2009 (%)
2007 2009 2007 2009 Too
compli-cated
Too high interest
rate
Collateral asked too
high
Does not correspond
to needs
Do not want to
get a loan Hanoi Manufacturing 16.0 13.8 16.0 10.6 14.4 7.5 1.9 2.0 59.0 Trade 8.6 9.5 5.5 6.8 16.2 7.8 3.9 2.7 56.8 Services 3.8 6.2 2.3 4.6 10.2 8.6 5.6 2.4 63.5 Total IHB 7.8 9.4 6.0 7.0 13.7 8.0 4.0 2.4 59.7 Total FHB 14.4 27.7 11.6 25.2 13.0 5.7 0.9 1.8 49.5 Total HB 9.1 12.2 7.1 9.7 13.6 7.6 3.5 2.3 58.1 Ho Chi Minh City Manufacturing 6.4 3.7 4.9 1.8 15.6 7.1 14.1 4.8 52.8 Trade 4.7 9.2 3.9 7.1 18.1 9.2 15.1 3.9 38.7 Services 5.6 5.2 3.6 2.6 12.8 14.1 15.9 2.0 46.4 Total IHB 5.5 6.0 4.0 3.6 14.7 11.5 15.3 3.0 45.5 Total FHB 16.7 17.0 15.5 10.0 13.8 6.4 10.6 2.7 47.7 Total HB 8.3 7.9 6.9 4.7 14.6 10.6 14.5 3.0 45.9 Sources: HB&IS survey, Hanoi and HCMC, 2007 & 2009, GSO-ISS / IRD-DIAL; authors' calculations. Access to loan can push formalization process. The access to credit is all the more crucial for HBs as it seems to be a condition which can help them to formalize their activity. The analysis from the panel data shows that a significantly higher percentage of the informal HBs in 2007 who managed to become formal in 2009 have obtained a loan in 2007 compared with their counterparts which remained informal (11% compared to 7% in Hanoi; Table 21). A quite significant proportion of this group which has recently formalized their activity managed also to get credit in 2009 (16% in Hanoi and 15% in HCMC, these proportion being higher than the corresponding figure for formal HBs which were already formal in 2007).
Table 21: Applications for bank loans and bank loans taken out by transition status (%) panel data 2007-2009
Hanoi HCMC 2007 2009 2007 2009
Applied for a loan
Obtained a loan
Applied for a loan
Obtained a loan
Applied for a loan
Obtained a loan
Applied for a loan
Obtained a loan
Formal-formal 18.4 15.3 15.3 14.2 18.8 17.9 17.6 12.1
Formal-informal 11.0 9.8 8.6 3.8 8.6 8.6 12.3 7.0
Informal-formal 14.3 11.1 20.7 15.6 10.3 4.3 17.1 14.8
Informal-informal 8.6 6.6 8.0 6.1 6.2 4.8 9.0 5.6
Total HB 10.4 8.2 9.9 7.7 9.4 7.9 11.7 7.8
Sources: HB&IS survey, Hanoi and HCMC, 2007 & 2009, GSO-ISS / IRD-DIAL; authors' calculations. The quasi-inexistence of support structure. The informal sector seems to be left to its own device: not only does the informal sector not have access to the banks, but it has no formal alternative (public or private institutions). Microfinance institutions, the main instrument for obtaining financing for micro-units over the world, are still ineffective in Vietnam. Less than 2% of IHBs in Hanoi (3% in HCMC) said they had received loans from this type of institution, even if 21% of IHBs in Hanoi (15% in HCMC) had heard about this type of institution.

23
Besides, no other support structures exist, whether public or private, to provide assistance with technical and accounts training, capacity building, market access, information, etc. In Hanoi, only 5% of HBs know the existence of support structures other than micro-finance institutions and less than 1% has contact with these structures (the corresponding figures are 7% and 2% respectively in HCMC). HBs did not benefit from the support measures adopted within the Stimulus Package launched by the Government in 2009. We could have expected that these measures would have targeted and provided assistance to the informal sector where end up most of the laid-off workers, or new entrants on the labour market who did not find jobs in the formal sector. But the impact of these measures is far behind expectations. The public support policies failed to reach the informal sector: less than 3% of HBs have been provided with loans with a subsidized interest rate in 2009 (Table 22); only 3% in Hanoi and 4% in HCMC have benefited from a financial support at Têt; and the proportion of HBs which received grant from the Popular Committee is negligible (1% in Hanoi and 2% in HCMC).
Table 22: Public support received by HBs during the economic crisis (%)
Cheap loan Grant at Têt Grant from the Popular
Committee Other
Hanoi HCMC Hanoi HCMC Hanoi HCMC Hanoi HCMC Total IHB 1.3 3.0 3.0 4.5 0.9 1.8 0.4 1.4
Total FHB 3.6 0.7 1.3 3.3 0.7 0.8 - 0.2
Total HB 1.7 2.6 2.7 4.3 0.9 1.6 0.3 1.2 Source: HB&IS survey, Hanoi and HCMC, 2009, GSO-ISS / IRD-DIAL; authors’ calculations. Interaction between the informal sector and the State The informal sector ultimately seems to be ignored by the State: no specific public support policy tries to target this sector in Vietnam. This state of fact could be understandable if the existence of the informal sector stemmed from a strategy to escape deliberately the legislation as stated by the "legalist" school of thought (De Soto, 1989). Indeed, it seems that HBs want to manage by themselves and rely on their resourcefulness. The decrease in the percentage of informal HBs which expressed demand for assistance is one striking evidence (from 67% in 2007 to 49% in 2009 in Hanoi and from 46% to 44% in HCMC). But again, these findings might be interpreted as an adaptation to the context. The hypothesis which put forward IHBs' strategy to evade State legislation is rejected since only a tiny minority of IHBs (less than 2%) openly refuses all cooperation with the State. Moreover, a not-inconsiderable proportion of IHBs (15% in Hanoi and 19% in HCMC) even say that they are willing to get a business licence.
Table 23: Reasons for IHBs not to be registered
% Total IHB
Reasons why not registered
Too compli-cated
Too expensive
Registra-tion in
progress
Not Com- pulsory
Don’t know if have to register
Don’t want to co-operate with state
Other Total
Hanoi 2007 1.7 0.6 0.9 72.0 17.7 2.3 4.8 100 Hanoi 2009 2.8 0.3 0.5 75.7 14.1 1.1 5.4 100
HCMC 2007 0.8 1.5 1.2 79.1 7.3 0.1 10.0 100 HCMC 2009 1.7 0.5 0.6 76.7 14.1 0.6 5.6 100
Sources: HB&IS survey, Hanoi and HCMC, 2007 & 2009, GSO-ISS / IRD-DIAL; authors' calculations. Unclear registration legislation. The main reason why informal HBs are not registered is related to their ignorance of their legal obligations (Table 23). In 2009, around 76% of IHBs believe that registration is not compulsory and 14% assert that they do not know if they need to register. Cling et
24
al. (2010a) showed that a great majority of them might fall under the obligation to register their activity if the legislation were strictly enforced. But the applied criteria which determines whether a HB has to register or not is fuzzy. Therefore, the fact that almost no IHBs (less than 1%) know the threshold above which HBs have to register is not a surprise. Even among the formal HBs, only a minority claims that they know the registration legislation (10% of FHBs in Hanoi and 20% in HCMC), and their knowledge appears to be limited since the magnitude of the registration threshold that they put forward varies substantially (from 2 million to 15 million per month). Towards more incentives to register their activity? The views of the formal HBs put forward the potential advantages of registration. The vast majority recognises that being registered is positive: only 5% consider that there is no advantage in being registered (Table 24). According to the formal HBs, the main benefit of registration is to avoid corruption (57% in Hanoi and 68% in HCMC). The two other advantages, although way behind the first, are access to better locations and access to loan. The analysis of the panel data tends to confirm the possibility of concrete advantages of registration. The views of informal HBs in 2007 who became formal in 2009 stand out clearly from the opinion of those who remain informal (for example in Hanoi: 26% stress the easier access to loan vs. 11% for their counterpart who remain informal; 43% underline the fact that they are less victim of corruption vs. 19% for those who remain informal; and only 2% consider that there is no advantage of being registered see Table A8). The point of views of formal HBs (based on the cross section) is shared to a lower extent by the informal HBs. But the main positive point which deserves to be underlined is the decrease in percentage of the IHBs which consider that registration brings no advantage (from 45% in 2007 to 30% in 2009 in Hanoi and from 49% to 36% in HCMC). They are more numerous in 2009 to stress the possibility of an easier access to loan, and higher chance to win contracts with large firms. It seems that HBs are more aware of effective or potential advantages of registration. This trend advocates for an increased effort in terms of information and the design of specific measures which put forward concrete incentives for informal HBs to register.
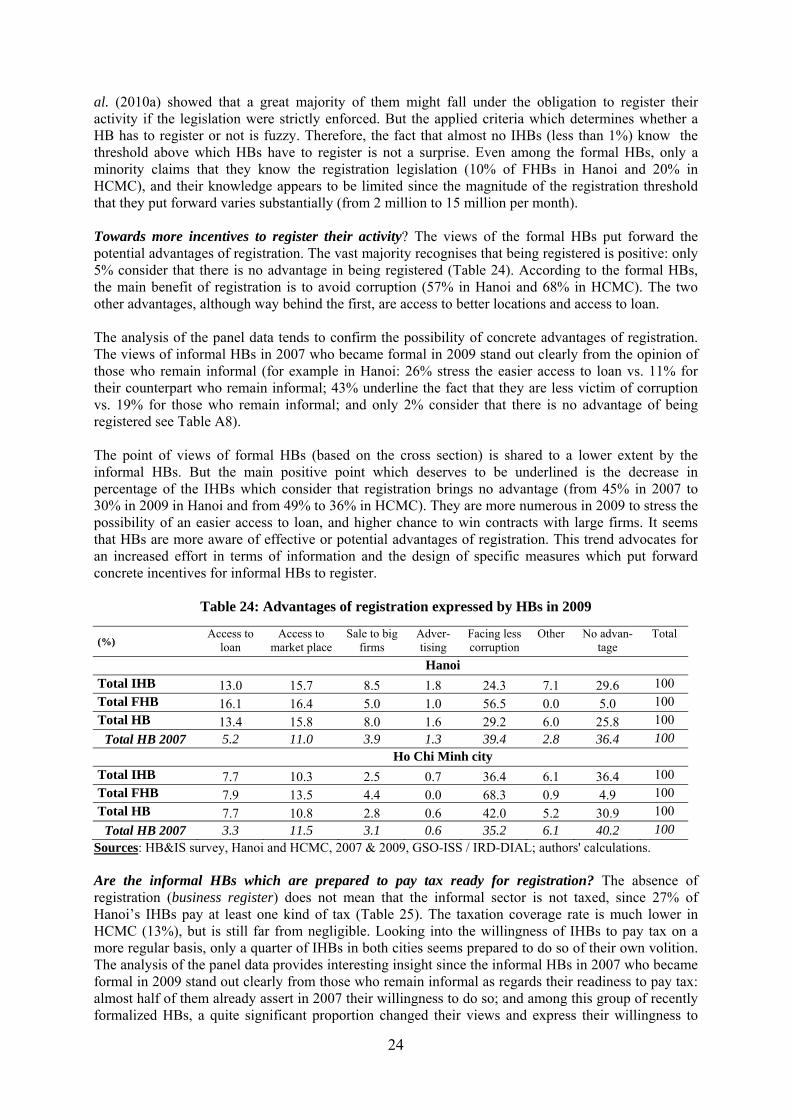
Table 24: Advantages of registration expressed by HBs in 2009
(%) Access to
loan Access to
market place Sale to big
firms Adver-tising
Facing less corruption
Other No advan-tage
Total
Hanoi Total IHB 13.0 15.7 8.5 1.8 24.3 7.1 29.6 100 Total FHB 16.1 16.4 5.0 1.0 56.5 0.0 5.0 100 Total HB 13.4 15.8 8.0 1.6 29.2 6.0 25.8 100
Total HB 2007 5.2 11.0 3.9 1.3 39.4 2.8 36.4 100 Ho Chi Minh city
Total IHB 7.7 10.3 2.5 0.7 36.4 6.1 36.4 100 Total FHB 7.9 13.5 4.4 0.0 68.3 0.9 4.9 100 Total HB 7.7 10.8 2.8 0.6 42.0 5.2 30.9 100
Total HB 2007 3.3 11.5 3.1 0.6 35.2 6.1 40.2 100 Sources: HB&IS survey, Hanoi and HCMC, 2007 & 2009, GSO-ISS / IRD-DIAL; authors' calculations. Are the informal HBs which are prepared to pay tax ready for registration? The absence of registration (business register) does not mean that the informal sector is not taxed, since 27% of Hanoi’s IHBs pay at least one kind of tax (Table 25). The taxation coverage rate is much lower in HCMC (13%), but is still far from negligible. Looking into the willingness of IHBs to pay tax on a more regular basis, only a quarter of IHBs in both cities seems prepared to do so of their own volition. The analysis of the panel data provides interesting insight since the informal HBs in 2007 who became formal in 2009 stand out clearly from those who remain informal as regards their readiness to pay tax: almost half of them already assert in 2007 their willingness to do so; and among this group of recently formalized HBs, a quite significant proportion changed their views and express their willingness to
25
pay tax in 2009. Reciprocally, nearly half of the formal HBs in 2007 who became informal in 2009 changed their views and say that they are not prepared to pay taxes. Since the decision to become formal (or informal) is linked to the performance of the HBs, these results confirm that the more profitable or larger scale the business, the more they are prepared to pay.
Table 25: Informal sector willingness to pay taxes (% of HBs)
Pay at least
one type of tax Prepared to
pay taxes
Prepared to pay taxes (%)
Panel data
2009 2009 Hanoi HCMC
Hanoi HCMC Hanoi HCMC 2007 2009 2007 2009
Manufacturing 8.9 2.3 20.0 20.5
Trade 47.2 27.0 25.9 26.0 Formal-Formal 96.6 93.0 93.2 97.0
Services 17.5 10.0 22.6 24.2 Formal-Informal 95.1 42.9 86.4 46.4
Total IHB 27.3 13.1 23.3 24.0 Informal-Formal 49.5 68.5 46.1 87.6
Total FHB 79.8 91.4 86.4 92.6 Informal-Informal 23.7 22.8 25.3 20.4
Total HB 35.3 26.9 33.0 36.1 Total IHB 39.3 36.2 44.5 43.6 Sources: HB&IS survey, Hanoi and HCMC, 2007 & 2009, cross-section and panel data, GSO-ISS / IRD-DIAL; authors' calculations. We have stressed previously that public policy failed to provide support to the informal sector. This conclusion should be nuanced for Hanoi as regards taxation policy. The fact that a lower percentage of informal HBs (as well as formal ones) have paid taxes in 2009 compared to 2007 (27% of IHBs in 2009 instead of 36% in 2007) could be an evidence of the impact (at least partial) of tax exemption or reduction measures implemented within the stimulus package during the economic crisis. The overall outlook for household businesses The analysis of the expectations of HBs' heads for the future of their business can help to grasp a better understanding of the factors that make people work in this sector and decide to formalise or not their activities, and to determine whether this is the result of a voluntary choice or second best due to a lack of other job opportunities.
No significant change can be observed from 2007 to 2009 as regards the expectations of HBs' heads (Table 26). Even if pessimistic views are predominant in the two cities, as in 2007, the informal business heads in HCMC are more pessimistic about their outlook than their counterparts in Hanoi (respectively only 29% of IHB heads in HCMC and 45% in Hanoi feel their business has a future). The widening gap between the two cities regarding the IHBs prospects might be due to the higher impact of the crisis in HCMC. Consistent with these findings, a higher percentage of informal HBs look for a change of activity in HCMC (25%) than in Hanoi (20%). Most of business heads do not expect to exit the HB sector. The fact that the majority of the IHB’s heads who have pessimistic views do not express any will to change activities deserves to be underlined. It is all the more striking since more than half of the heads who want to change activity plan to stay in the household business sector (12% out of the 20% in Hanoi and 15% out of the 25% in HCMC). It seems that pragmatism or resignation prevails among IHB’s heads: they adapt their expectations to the lack of job opportunity in other institutional sectors; only 4% in Hanoi and 6% in HCMC would like to shift to private enterprises, and less than 3% in the public sector in the two cities. Heads of informal HBs express greater expectations for their children, in spite of their resigned attitude as regards their own future. When we look at the longer-term outlook, only a small minority of IHB’s heads (around 15% in Hanoi as well as in HCMC) feel there is a future for their children in the informal sector. Their first wish for their children is a job in the public sector (54% in Hanoi and 43%

26
in HCMC), a job in private domestic enterprises comes in second place (12% in Hanoi and 23% in HCMC), followed by foreign enterprises (11% in Hanoi and 13% in HCMC).
Table 26: Future prospects for the heads of household businesses (% of HBs)
Industries
HB heads who think their HB has a future
HB heads who want to change
activity
HB heads who want to see their children take over the business
Hanoi HCMC 2009 Hanoi HCMC 2007 2009 2007 2009 Hanoi HCMC 2007 2009 2007 2009
Manufacturing 64.0 56.5 42.6 36.6 18.9 28.2 33.5 23.9 23.5 14.7Trade 44.2 39. 3 26.7 24.4 21.7 23.8 18.1 13.9 14.6 10.5Services 31.7 43.3 28.2 29.3 18.4 24.0 15 14.4 16.4 16.7Total IHB 42.2 45.0 30.9 29.3 19.9 24.7 19.5 16.6 17.4 14.7Total FHB 73.4 67.2 64.3 69.0 5.6 8.0 37.1 39.4 42.4 43.4Total HB 48.3 48.4 39.4 36.3 17.7 21.8 22.9 20.0 23.7 19.7
Sources: HB&IS survey, Hanoi and HCMC, 2007 & 2009, GSO-ISS / IRD-DIAL; authors' calculations. Higher confidence over the future for those who formalize their activities. Formal business heads are more optimistic about their outlook. Thereby, only a minority among them express a will to change activities (6% in Hanoi and 8% in HCMC). Moreover, the analysis of the panel data (which allows to follow exactly the same units in 2007 and 2009) shows that informal HBs in 2007 which became formal in 2009 gain confidence (see Table A10): among them, if only 39% feel their business had a future in 2007 in HCMC, they are 58% in 2009 (the respective figure for Hanoi is 52% in 2007 and 62% in 2009). But the direction of the causality could be reversed: their decision to formalize their activities could stem from their more optimistic views over the future. Therefore, a more secure environment for informal household businesses, which brings more confidence in the sustainability of their business, could encourage formalization process in the informal sector. Conclusion To conclude, some lessons can be drawn from this analysis. First, concerning the statistical properties of the HB&IS survey and the integration of the results into the national accounts:
The first point to stress is the high consistency of the HB&IS surveys. This assessment can be appreciated from three different perspectives: between Hanoi and HCMC; overtime; between cross section and panel data. Since 2007, six independent HB&IS surveys have been undertaken, providing robust structural figures and meaningful differences (spatial and temporal). Additionally, the subjective modules introduced in the 2009 surveys are also consistent with the hard data collected;
After two successful rounds in Hanoi and HCMC (2007 and 2009), the GSO should conduct the HB&IS survey at the national level to get the full picture of the informal sector in Vietnam for the first time ever. As in other part of the world, and in line with the international recommendations, the mixed survey methodology (household-enterprise) is the most cost effective way to capture the informal sector in the country. This is all the more important as up to now no alternative survey can fill the gap on this issue, and the informal sector is a massive component of the Vietnamese economy, both in terms of jobs and production;
The results of the HB&IS survey should be used as a primary source of data to get a more
exhaustive coverage of the GDP and others macroeconomic aggregates. Not taking them into account results in underestimating the informal sector's contribution to the national accounts.

27
Vietnam, along with six other leading developing countries in this field, is participating in the international project on the integration of the informal economy into the national accounts. This project provides a good opportunity to design a generic framework and empirical applications in this respect;
Taking stock of the past surveys, the informal sector measurement should be institutionalized.
The HB&IS survey should be incorporated in the national survey program (timeframe, scope, expected outputs, institutional arrangements, funding) in order to ensure a sound and comprehensive coverage overtime;
Finally, the very concept of the informal economy (sector and employment) needs to acquire a legal and recognised existence in Vietnam, which is currently not the case despite its weight, so that the different public agencies can give it their full consideration. The adoption of a single concept underpinned by a consensus is vital for the definition of targeted policies.
Concerning the analytical part, the empirical evidence suggests that the informal sector is a huge component of the Vietnamese economy which has even increased with the crisis. Whatever the growth hypothesis for the years to come, the informal economy is here to stay. In spite of its intrinsic flexibility, the informal sector suffered significantly from the difficult economic situation in 2008 and 2009. This is specially the case in HCMC, where clear recessive patterns are observed, with adverse consequences on household well being and poverty, underlining the necessity to take into account heterogeneous local circumstances. The greater vulnerability of the economic capital of Vietnam compared to Hanoi may be explained by the very nature of the shock which affected the more opened megalopolis. Some policy implications can be drawn from these results:
In spite of a recent higher awareness about informality in Vietnam, the informal sector still remains a non tackled issue from a policy perspective, largely ignored by the authorities. None of the temporary measures considered in the stimulus package to mitigate the negative impact of the global crisis has benefitted the informal sector. It is all the more problematic as poverty is progressively changing face, from its traditional rural and agriculture profile, to a more urban and informal phenomenon;
No one really knows who should register (business licence) and pay taxes. This fuzzy frontier
between formal and informal HBs and lack of transparency create a grey zone prone to informal arrangements and negotiation, including corruption. Enacting clear rules would help reducing discretionary decisions and harassment by public officials, as well as allowing them to enforce legal regulations on a clear-cut basis;
Formal and informal sectors are no definitive status: the dynamic approach shows that a far
from negligible part of IHBs get formalized and vice versa. Given the advantages of formalization (access to credit, lower risks of corruption, better economic performances, etc.), incentive policies should be designed to favour the flow from informal to formal sector;
Easier access to credit would also help to improve equipment and productivity. It is all the more important as more and more IHBs are facing credit constraints. In particular, micro-finance institutions are quasi absent and should be put in place at a larger scale, as in other developing countries;
Contrary to expectations, the informal sector is only marginally integrated into the rest of the economy. Its already tiny links with the formal sector, through subcontracting and access to big orders, have even decreased between 2007 and 2009. Consistently, this point became one of the main demands for assistance expressed by the IHBs. Therefore, there is room for policies to enhance access to market, in particular through market information.
28
From a human resource perspective, two kinds of policy may be suggested. On the one hand, training programs with specific curricula adapted to informal sector conditions should be developed to improve returns to skills. Up to now, such programs have been marginal (if any) in Vietnam. On the other hand, labour force protection schemes should be put in place to limit the high precariousness and vulnerability of the informal sector workers. An assessment and an adaptation of the voluntary social insurance seem necessary.
References
Cling J.-P., Nguyễn Thị Thu Huyền, Nguyễn Hữu Chí, Phan T. Ngọc Trâm, Razafindrakoto M. and Roubaud F. (2010a), The Informal Sector in Vietnam: A focus on Hanoi and Ho Chi Minh City, Editions The Gioi, Hanoi.
Cling J.-P., Nguyễn Hữu Chí, Razafindrakoto M. & Roubaud F. (2010b), How deep was the impact of the economic crisis in Vietnam? A focus on the informal sector in Hanoi and Ho Chi Minh City, Policy Brief, Hanoi: GSO-IRD.
Cling J.-P., Razafindrakoto M., Roubaud F. (2010c), “Assessing the Potential Impact of the Global Crisis on the Labour Market and the Informal Sector in Vietnam”, Journal of Economics & Development, June, vol. 38, pp. 16-25.
De Soto H. (1989), The Other Path: The Invisible Revolution in the Third World, New York: Harper and Row.
Nguyễn Hữu Chí, Nguyễn Thị Thu Huyền, Razafindrakoto M. & Roubaud F. (2010), Vietnam labour market and informal economy in a time of crisis and recovery 2007-2009 ; Main findings of the Labour Force Surveys (LFS), Hanoi: GSO/IRD.
Rand J. and Torn N. (2010), “The Benefits of Formalization: Evidence from Vietnamese SMEs”, World Development (forthcoming).
Razafindrakoto M., Roubaud F. and Le Van Duy (2008), “Measuring the Informal Sector in Viet Nam: Situation and Prospects”, Statistical Scientific Information N°CS-02, Special Issue on Informal Sector, Hanoi, May.
Razafindrakoto M. and Roubaud F. (2003), “Two Original Poverty Monitoring Tools: The 1-2-3 Surveys and the Rural Observatories” in Cling J.-P., Razafindrakoto M. and Roubaud F., New International Poverty Reduction Strategies, London: Routledge, p.313-339.
World Bank (2006), Vietnam Development Report 2006: Business, Hanoi: The World Bank.
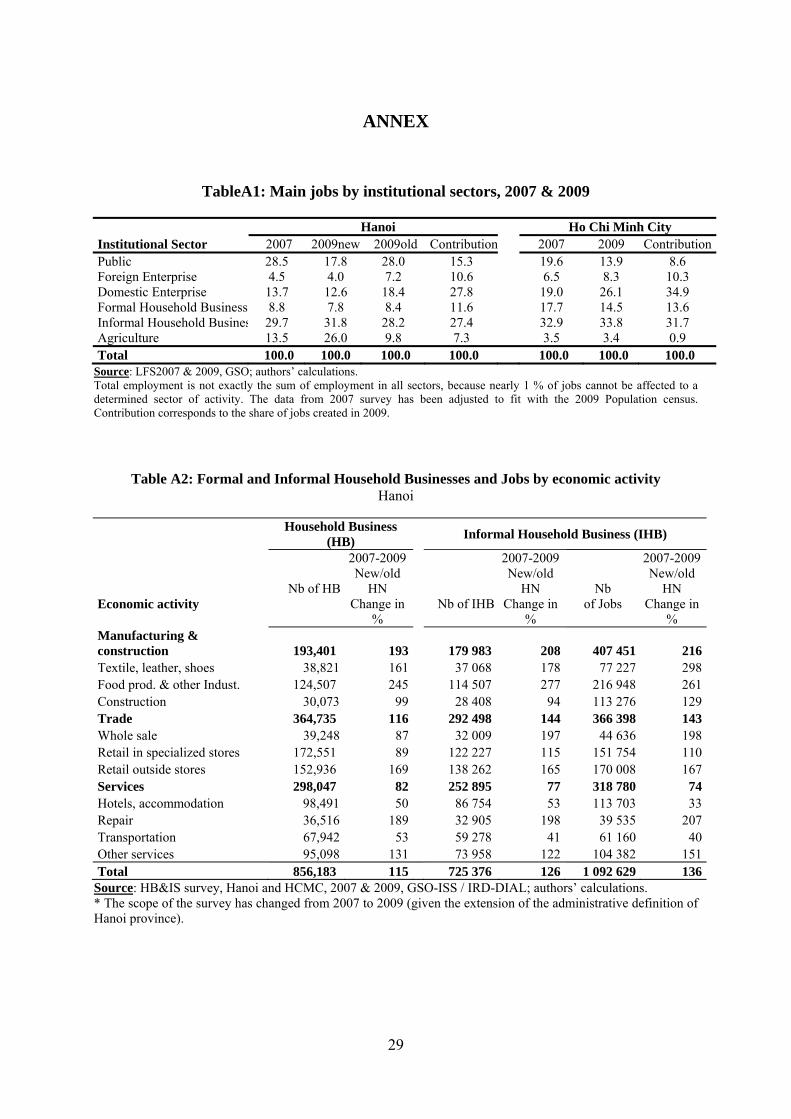
29
ANNEX
TableA1: Main jobs by institutional sectors, 2007 & 2009 Hanoi Ho Chi Minh City Institutional Sector 2007 2009new 2009old Contribution 2007 2009 ContributionPublic 28.5 17.8 28.0 15.3 19.6 13.9 8.6 Foreign Enterprise 4.5 4.0 7.2 10.6 6.5 8.3 10.3 Domestic Enterprise 13.7 12.6 18.4 27.8 19.0 26.1 34.9 Formal Household Business 8.8 7.8 8.4 11.6 17.7 14.5 13.6 Informal Household Busines 29.7 31.8 28.2 27.4 32.9 33.8 31.7 Agriculture 13.5 26.0 9.8 7.3 3.5 3.4 0.9 Total 100.0 100.0 100.0 100.0 100.0 100.0 100.0
Source: LFS2007 & 2009, GSO; authors’ calculations. Total employment is not exactly the sum of employment in all sectors, because nearly 1 % of jobs cannot be affected to a determined sector of activity. The data from 2007 survey has been adjusted to fit with the 2009 Population census. Contribution corresponds to the share of jobs created in 2009.
Table A2: Formal and Informal Household Businesses and Jobs by economic activity Hanoi
Household Business
(HB) Informal Household Business (IHB)
Economic activity
Nb of HB
2007-2009 New/old
HN Change in
% Nb of IHB
2007-2009 New/old
HN Change in
%
Nb of Jobs
2007-2009 New/old
HN Change in
% Manufacturing & construction 193,401 193 179 983 208 407 451 216Textile, leather, shoes 38,821 161 37 068 178 77 227 298Food prod. & other Indust. 124,507 245 114 507 277 216 948 261Construction 30,073 99 28 408 94 113 276 129Trade 364,735 116 292 498 144 366 398 143Whole sale 39,248 87 32 009 197 44 636 198Retail in specialized stores 172,551 89 122 227 115 151 754 110Retail outside stores 152,936 169 138 262 165 170 008 167Services 298,047 82 252 895 77 318 780 74Hotels, accommodation 98,491 50 86 754 53 113 703 33Repair 36,516 189 32 905 198 39 535 207Transportation 67,942 53 59 278 41 61 160 40Other services 95,098 131 73 958 122 104 382 151Total 856,183 115 725 376 126 1 092 629 136
Source: HB&IS survey, Hanoi and HCMC, 2007 & 2009, GSO-ISS / IRD-DIAL; authors’ calculations. * The scope of the survey has changed from 2007 to 2009 (given the extension of the administrative definition of Hanoi province).
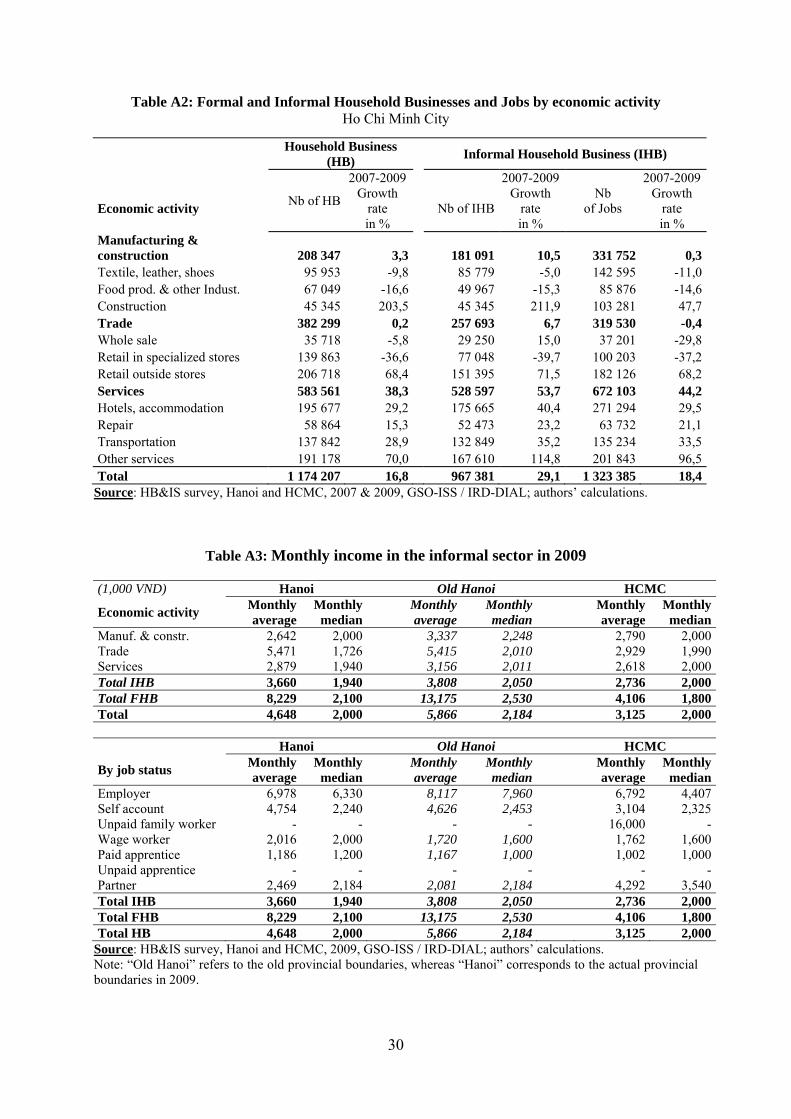
30
Table A2: Formal and Informal Household Businesses and Jobs by economic activity Ho Chi Minh City
Household Business
(HB) Informal Household Business (IHB)
Economic activity
Nb of HB
2007-2009 Growth
rate in %
Nb of IHB
2007-2009 Growth
rate in %
Nb of Jobs
2007-2009 Growth
rate in %
Manufacturing & construction 208 347 3,3 181 091 10,5 331 752 0,3Textile, leather, shoes 95 953 -9,8 85 779 -5,0 142 595 -11,0Food prod. & other Indust. 67 049 -16,6 49 967 -15,3 85 876 -14,6Construction 45 345 203,5 45 345 211,9 103 281 47,7Trade 382 299 0,2 257 693 6,7 319 530 -0,4Whole sale 35 718 -5,8 29 250 15,0 37 201 -29,8Retail in specialized stores 139 863 -36,6 77 048 -39,7 100 203 -37,2Retail outside stores 206 718 68,4 151 395 71,5 182 126 68,2Services 583 561 38,3 528 597 53,7 672 103 44,2Hotels, accommodation 195 677 29,2 175 665 40,4 271 294 29,5Repair 58 864 15,3 52 473 23,2 63 732 21,1Transportation 137 842 28,9 132 849 35,2 135 234 33,5Other services 191 178 70,0 167 610 114,8 201 843 96,5Total 1 174 207 16,8 967 381 29,1 1 323 385 18,4
Source: HB&IS survey, Hanoi and HCMC, 2007 & 2009, GSO-ISS / IRD-DIAL; authors’ calculations.
Table A3: Monthly income in the informal sector in 2009
(1,000 VND) Hanoi Old Hanoi HCMC
Economic activity Monthly average
Monthly median
Monthly average
Monthly median
Monthly average
Monthly median
Manuf. & constr. 2,642 2,000 3,337 2,248 2,790 2,000Trade 5,471 1,726 5,415 2,010 2,929 1,990Services 2,879 1,940 3,156 2,011 2,618 2,000Total IHB 3,660 1,940 3,808 2,050 2,736 2,000Total FHB 8,229 2,100 13,175 2,530 4,106 1,800Total 4,648 2,000 5,866 2,184 3,125 2,000
Hanoi Old Hanoi HCMC
By job status Monthly average
Monthly median
Monthly average
Monthly median
Monthly average
Monthly median
Employer 6,978 6,330 8,117 7,960 6,792 4,407Self account 4,754 2,240 4,626 2,453 3,104 2,325Unpaid family worker - - - - 16,000 -Wage worker 2,016 2,000 1,720 1,600 1,762 1,600Paid apprentice 1,186 1,200 1,167 1,000 1,002 1,000Unpaid apprentice - - - - - -Partner 2,469 2,184 2,081 2,184 4,292 3,540Total IHB 3,660 1,940 3,808 2,050 2,736 2,000Total FHB 8,229 2,100 13,175 2,530 4,106 1,800Total HB 4,648 2,000 5,866 2,184 3,125 2,000
Source: HB&IS survey, Hanoi and HCMC, 2009, GSO-ISS / IRD-DIAL; authors’ calculations. Note: “Old Hanoi” refers to the old provincial boundaries, whereas “Hanoi” corresponds to the actual provincial boundaries in 2009.

31
Table A4: Growth rates of the main economic outputs by transition status, 2007-2009 (median)
Turnover Value Added Profits
Tansition: Hanoi TPHCM Hanoi TPHCM Hanoi TPHCM Formal-Formal 51.5 2.0 43.4 -14.8 37.2 -6.7 Formal-Informal -32.7 -36.6 -14.1 -15.9 -18.8 0.0 Informal-Formal 70.0 54.5 9.9 27.0 3.5 27.3 Informal-Informal 28.8 -4.2 12.1 -8.9 12.2 -9.6
Total HB 18.4 -5.9 13.4 1.1 11.4 3.1 Source: HB&IS survey, Hanoi and HCMC, 2007 & 2009, GSO-ISS / IRD-DIAL; authors’ calculations. Note: Growth in real term, deflators 2007-2009 are 1.323 in Hanoi and 1.316 in HCMC.
Table A5: Assessment of the general economic situation in Vietnam, 2009 (Percentage of respondents for each modality)
Hanoi
Economic activity
Very good Good Neither good
nor bad Bad Very bad Balance (1)
Manufacturing 2.6 45.2 43.4 8.7 - 39.1 Trade 3.3 35.6 53.2 7.9 - 31 Services 2.7 34.9 55.5 7.0 - 30.6 Total IHB 2.9 37.7 51.6 7.8 - 32.8 Total FHB 2.6 46.7 43.6 6.7 0.7 41.9 Total HB 2.9 39.0 50.4 7.6 0.1 34.2
Ho Chi Minh City Economic activity
Very good Good Neither good
nor bad Bad Very bad Balance (1)
Manufacturing 2.5 30.2 58.0 7.3 2.0 23.4 Trade 3.9 30.3 51.8 11.2 2.8 20.2 Services 3.6 35.3 48.2 11.2 1.6 26.1
Total IHB 3.5 33.0 51.0 10.5 2.0 24 Total FHB 5.4 41.7 41.8 10.5 0.6 36 Total HB 3.8 34.6 49.4 10.5 1.8 26.1 Source: HB&IS survey, Hanoi (2007), GSO-ISS / IRD-DIAL.
(1) Difference between the percentages of answers [“Very good”+”Good”] - [“Bad”+”Very bad”].
Table A6: Evolution of the salaries paid, 2008-2009 (Percentage of respondents for each modality)
Hanoi HCMC Economic activity Increased Decreased Balance (1) Increased Decreased Balance (1) Manufacturing 64.4 7.4 36.3 43.7 4.6 39.1 Trade 13.1 26.9 -13.8 78.2 4.6 73.6 Services 29.9 6.9 23.0 15.7 14.5 1.2 Total IHB 47.4 9.2 38.2 34.6 8.9 25.7 Total FHB 38.2 21.1 18.1 27.4 9.4 18.0 Total HB 44.4 13.1 31.3 30.8 9.2 21.6 Source: HB&IS survey, Hanoi (2009), GSO-ISS / IRD-DIAL; authors’ calculations. (1) Increased-Decreased
32
Table A7: Evolution of savings and debt, 2008-2009
(Balance for each modality: Increased-Decreased)
Evolution of savings Evolution of debt Economic activity Hanoi HCMC Hanoi HCMC Manufacturing -15.1 -43.1 -3.7 -2.9 Trade -27.8 -52.2 -10.2 2.5 Services -30.4 -41.9 -9.8 -3.4 Total IHB -25.5 -44.9 -8.5 -1.7 Total FHB -27.3 -33.9 -0.7 -1.6 Total HB -25.8 -42.9 -7.2 -1.7 Source: HB&IS survey, Hanoi (2009), GSO-ISS / IRD-DIAL; authors’ calculations.
Table A8: Advantages of registration and willingness to register in the informal sector by transition status
(panel data 2007-2009)
Prepared to register (business licence)
%
Main advantage of registration (%)
Prepared to register(business licence)
%
Main advantage of registration (%)
Access to loan
Access to market place
Less corrup-
tion
No advan-
tage
Access to loan
Access market place
Less corrup-
tion
No advan-
tage
Hanoi, 2007 Ho Chi Minh, 2007
Informal-formal 25.8 7.8 8.3 45.7 31.8 47.6 6.8 14.0 33.2 32.0
Informal-informal 15.0 6.3 10.1 29.9 47.2 18.1 2.7 10.0 29.5 48.8
Total HB 5.9 10.8 38.5 37.8 3.5 12.2 36.4 38.0
Hanoi, 2009 Ho Chi Minh, 2009
Formal-formal - 9.3 21.6 51.1 7.8 - 4.8 17.1 63.3 6.5
Formal-informal 11.9 11.9 17.7 32.2 18.6 29.0 7.4 9.7 46.0 29.0
Informal-formal - 25.9 19.9 43.2 2.6 - 7.1 16.1 63.8 13.0
Informal-informal 8.1 11.0 12.8 19.2 40.0 16.3 9.8 9.7 33.0 35.9
Total HB 11.9 14.7 25.8 32.0 8.4 11.9 42.6 27.3 Sources: HB&IS survey, Hanoi and HCMC, 2007 & 2009, panel data, GSO-ISS / IRD-DIAL; authors' calculations.
Table A9: Informal sector willingness to pay taxes by transition status (panel data 2007-2009)
Sources: HB&IS survey, Hanoi and HCMC, 2007 & 2009, panel data, GSO-ISS / IRD-DIAL; authors' calculations.
Pay at least one type of tax (%) Prepared to pay taxes (%)
Hanoi HCMC Hanoi HCMC
2007 2009 2007 2009 2007 2009 2007 2009
Formal stable 91.3 93.5 87.5 94.4 96.6 93.0 93.2 97.0
Formal-informal 91.1 37.0 80.9 48.7 95.1 42.9 86.4 46.4
Informal-formal 50.1 76.9 28.0 77.1 49.5 68.5 46.1 87.6
Informal stable 36.0 31.2 14.3 12.3 23.7 22.8 25.3 20.4
Total HB 47.4 42.8 34.3 37.0 39.3 36.2 44.5 43.6
33
Table A10: Future prospects for the heads of informal production units by transition status (panel data 2007-2009)
Industries
HB heads who think their HB has a future
HB heads who want to see their children take over the business
Hanoi HCMC Hanoi HCMC
2007 2009 2007 2009 2007 2009 2007 2009
Formal-formal 81.1 73.5 68.3 69.4 40.2 39.4 42.5 46.4
Formal-informal 62.0 57.5 51.3 44.2 34.4 20.4 35.6 25.1
Informal-formal 51.9 62.3 38.7 57.9 23.7 18.6 25.6 28.7
Informal-informal 43.4 52.7 31.6 26.8 20.6 16.5 16.7 15.4
Total HB 49.9 56.4 41.1 39.3 24.2 19.8 23.9 23.7 Source: HB&IS survey, Hanoi and HCMC, 2007 & 2009, GSO-ISS / IRD-DIAL; authors’ calculations.