dynamical footprints enable detection of disease emergence
TRANSCRIPT

RESEARCH ARTICLE
Dynamical footprints enable detection of
disease emergence
Tobias S. BrettID1,2*, Pejman Rohani1,2,3
1 Odum School of Ecology, University of Georgia, Athens, Georgia, United States of America, 2 Center for
the Ecology of Infectious Diseases, University of Georgia, Athens, Georgia, United States of America,
3 Department of Infectious Diseases, College of Veterinary Medicine, University of Georgia, Athens, Georgia,
United States of America
Abstract
Developing methods for anticipating the emergence or reemergence of infectious diseases
is both important and timely; however, traditional model-based approaches are stymied by
uncertainty surrounding the underlying drivers. Here, we demonstrate an operational, mech-
anism-agnostic detection algorithm for disease (re-)emergence based on early warning sig-
nals (EWSs) derived from the theory of critical slowing down. Specifically, we used
computer simulations to train a supervised learning algorithm to detect the dynamical foot-
prints of (re-)emergence present in epidemiological data. Our algorithm was then chal-
lenged to forecast the slowly manifesting, spatially replicated reemergence of mumps in
England in the mid-2000s and pertussis post-1980 in the United States. Our method suc-
cessfully anticipated mumps reemergence 4 years in advance, during which time mitigation
efforts could have been implemented. From 1980 onwards, our model identified resurgent
states with increasing accuracy, leading to reliable classification starting in 1992. Addition-
ally, we successfully applied the detection algorithm to 2 vector-transmitted case studies,
namely, outbreaks of dengue serotypes in Puerto Rico and a rapidly unfolding outbreak of
plague in 2017 in Madagascar. Taken together, these findings illustrate the power of theo-
retically informed machine learning techniques to develop early warning systems for the (re-
)emergence of infectious diseases.
Introduction
Outbreaks of infectious diseases continue to surprise and evade public health control policy.
This is due to a combination of (1) the reemergence of familiar vaccine-preventable infectious
diseases, such as mumps [1], measles [2], and pertussis [3]; (2) the evolution of resistance to
antimicrobials, including methicillin-resistant Staphylococcus aureus (MRSA) [4], malaria [5],
and extensively drug-resistant tuberculosis (XDR TB) [6]; (3) pathogen range expansion
driven by anthropogenic changes in land use [7] and climate [8]; and (4) the emergence of
novel pathogens from a zoonotic reservoir, such as HIV [9], severe acute respiratory syndrome
coronavirus (SARS-CoV) [10], and Ebola virus [11]. In addition to their burden on human
PLOS BIOLOGY
PLOS Biology | https://doi.org/10.1371/journal.pbio.3000697 May 20, 2020 1 / 20
a1111111111
a1111111111
a1111111111
a1111111111
a1111111111
OPEN ACCESS
Citation: Brett TS, Rohani P (2020) Dynamical
footprints enable detection of disease emergence.
PLoS Biol 18(5): e3000697. https://doi.org/
10.1371/journal.pbio.3000697
Academic Editor: Christophe Fraser, University of
Oxford, UNITED KINGDOM
Received: October 2, 2019
Accepted: April 23, 2020
Published: May 20, 2020
Copyright: © 2020 Brett, Rohani. This is an open
access article distributed under the terms of the
Creative Commons Attribution License, which
permits unrestricted use, distribution, and
reproduction in any medium, provided the original
author and source are credited.
Data Availability Statement: All data files are
available from the Zenodo repository (URL: https://
doi.org/10.5281/zenodo.3713381).
Funding: Research was funded by the National
Institute of General Medical Sciences of the
National Institutes of Health (award no.
U01GM110744; https://www.nigms.nih.gov). The
funders had no role in study design, data collection
and analysis, decision to publish, or preparation of
the manuscript.
Competing interests: The authors have declared
that no competing interests exist.

morbidity, mortality, and the associated social and economic toll, the existential threat posed
by (re-)emerging infectious diseases is increasingly recognized [12].
To foreshadow such threats, field and laboratory approaches have focused on surveillance
of potential zoonotic hosts [13], the detection of "viral chatter" in sequence data collected from
putative emergence hotspots [14], laboratory characterization of viruses with pandemic poten-
tial [15], biogeographic approaches to identify risk zones [16], and the use of phylogenetics to
pinpoint animal reservoirs [17]. We submit that an important dimension to predicting patho-
gen (re-)emergence is to exploit epidemiological incidence reports. In reality, a diversity of
mechanisms can drive increases in transmission that underpin disease emergence or resur-
gence. These include pathogen evolution leading to evasion of immunity [18, 19], host adapta-
tion [20], immune waning [21], changes in population immune profile [22], environmental
change [8], declining vaccine uptake [23], and changes in contacts [24]. This mechanistic
uncertainty, coupled with sparsity of data, impedes the prospects for inference-based forecasts
(e.g., by fitting a transmission model). Previously, statistical approaches have been developed
focusing on characteristics of the outbreak size distribution [2, 25–27]. Though promising,
generalizing these methods requires overcoming the need for (1) a sufficiently large number of
independent outbreaks for reliable statistical estimation and (2) well-defined transmission
chains, which is often not possible. Here, we propose a mechanism-agnostic approach that
harvests information contained in longitudinal epidemiological data.
In general, disease (re-)emergence requires a systematic increase in the expected number of
secondary cases due to an infectious individual, which is quantified by the effective reproduc-
tive number (Reff) [28]. Specifically, as the threshold Reff = 1 is crossed, the system undergoes a
transcritical bifurcation, and sustained chains of transmission become possible (Fig 1A).
Dynamical systems theory identifies statistical footprints of such a critical transition ("critical
slowing down") [29]. These footprints are reflected in trends in the statistical moments of time
series data, such as the autocorrelation and standard deviation [30, 31], as the transition is
approached. Prior theoretical findings [30–32] and tests on simulated data [33, 34] support the
premise of this approach and identify candidate statistical moments. The key challenge, how-
ever, is operationalizing these statistical features to serve as early warning signals (EWSs). In
particular, given a time series, we need to (1) quantify emergence risk through time from a col-
lection of EWS and (2) establish a threshold for detection of emergence. Here, we accomplish
these by use of transfer learning, i.e., training a learning algorithm on simulated time series
data to create a classifier that can subsequently detect emergence in incidence data (Fig 2; see
Methods). The advantage of using a transfer learning approach is the identification of a generic
measure of emergence risk that is robust to uncertainties in the underlying epidemiological
dynamics.
Results
Statistical learning algorithm
We used a stochastic transmission model to generate 10,000 emerging and nonemerging time
series (Fig 2B). To ensure robustness to parametric uncertainty, each time series was the result
of a unique parameterization according to Latin hypercube sampling (Fig 2A; see S4 Table for
ranges). For each trajectory, 8 time-varying EWSs (fYi;tg8
i¼1) were calculated (Fig 2C). To clas-
sify disease emergence, logistic regression was carried out on the ensemble of EWSs to assign a
weight to each signal (Fig 2D). We defined a summary measure of time-dependent emergence
risk as the logistic transform of the weighted sum of our EWS,
Dt ¼ ½1þ expð�X8
i¼1wiYi;t � w0Þ�
� 1, with a range between 0 and 1 (see Methods for details).
PLOS BIOLOGY Dynamical footprints enable detection of disease emergence
PLOS Biology | https://doi.org/10.1371/journal.pbio.3000697 May 20, 2020 2 / 20
Abbreviations: AUC, area under the receiver-
operator characteristic curve; DENV, dengue virus;
EWS, early warning signal; LA, local authority;
MRSA, methicillin-resistant Staphylococcus
aureus; ROC, receiver-operator characteristic;
SARS-CoV, severe acute respiratory syndrome
coronavirus; XDR TB, extensively drug-resistant
tuberculosis.

In this algorithm, emergence is predicted at any time t when Dt> c, where c is a threshold (Fig
2I). We identified this threshold by minimizing classification error, using the receiver-operator
characteristic (ROC) curve (Fig 2E). We evaluated the performance of the detection algorithm
as a function of lead time (the period of time before the outbreak) using the area under the
ROC curve (AUC) statistic (Fig 2E). Further details of the learning algorithm are given in the
Methods. The learning algorithm is designed such that the weighted EWS and detection
threshold (Fig 2F–2I) may be applied to incidence data without further fitting.
We found that a composite of EWSs was a better predictor of emergence than any individ-
ual EWS (S3A Fig). Most weight was assigned to the skewness, the kurtosis, and coefficient of
variation. Indeed, training on just these 3 features yields near-optimal performance (S4 Fig).
Interestingly, individually, these are not the best performing EWS (in fact, the kurtosis and
coefficient of variation are the 2 worst; S3A Fig). The learning algorithm exploits imbalances
in these 3 EWS to detect emergence, assigning negative weight to the kurtosis and coefficient
of variation (Fig 2H and S5 Table). A practical implication of this is that the performance of
the algorithm is insensitive to population size (S3 Fig). That is, the outcome of application to
case counts or incidence data (normalized by population size) is identical.
Sensitivity to mechanism of emergence
We examined whether performance of our algorithm was sensitive to mechanisms (e.g., wan-
ing immunity and pathogen evolution) underlying (re-)emergence that are associated with
Fig 1. (a) Simulation of an emerging disease in a population of 105 susceptible individuals. After 12 years, Reff crosses
the epidemic threshold, and a large outbreak is triggered. (b) Monthly clinically confirmed cases of mumps in England.
Sixteen years after mass vaccination began in 1988, England experienced a large outbreak of mumps, primarily among
university-aged individuals. (c) Monthly reported cases of pertussis in New York state (USA). Beginning in the late
1970s, various states (including New York) began experiencing resurgent outbreaks, in spite of high reported vaccine
coverage levels. Data and code used to generate this figure can be found at https://doi.org/10.5281/zenodo.3713381.
https://doi.org/10.1371/journal.pbio.3000697.g001
PLOS BIOLOGY Dynamical footprints enable detection of disease emergence
PLOS Biology | https://doi.org/10.1371/journal.pbio.3000697 May 20, 2020 3 / 20

different patterns of increase of Reff (for details, see S1 Text). We retrained the learning algo-
rithm on simulated datasets consisting of only (1) concave (d2Reff / dt2 < 0; waning immunity)
and (2) convex (d2Reff / dt2 > 0; evolution) trends. Surprisingly, the EWS weights obtained by
fitting to simulated data that comprised both mechanisms of increase performed best, compa-
rable to training on concave/convex data alone (S5 and S6 Figs).
We performed a similar comparison using data simulated from a model with multiple
time-varying parameters, in addition to Reff (which drives the transition), to assess their con-
founding effects (S7 Fig). As might be expected, the presence of covariates reduced
Fig 2. Demonstration of algorithm design and operationalization. (a) To create a training dataset, 105 unique parameter sets were selected according to Latin
hypercube sampling. Half were emerging (R0 had an increasing trend with endpoint R0 = 1), and half were not (no overall trend). (b) For each parameter set, a
stochastic simulation algorithm was used to produce a time series of weekly case reports, subject to observation error. (c) For each simulated time series, 8 EWSs
were calculated (see panel g). (d) The measure of emergence risk, defined as Dt ¼ ½1þ expð�X8
i¼1wiYi;t � w0Þ�
� 1, was fitted to the emerging and nonemerging
simulated time series using penalized logistic regression (see Methods), generating EWS weights fwig8
i¼1used in Dt (fitted values are listed in S5 Table). Our
algorithm detects emergence whenever Dt exceeds the detection threshold c. (e) Using the fitted weights (panel h), we parameterized c by minimizing the
classification error using the ROC curve. In panels (f–i), we present a step-by-step outline of how, for any time series data, our fitted algorithm functions as an early
warning system. EWS, early warning signal; ROC, receiver-operator characteristic.
https://doi.org/10.1371/journal.pbio.3000697.g002
PLOS BIOLOGY Dynamical footprints enable detection of disease emergence
PLOS Biology | https://doi.org/10.1371/journal.pbio.3000697 May 20, 2020 4 / 20

performance; however, we again found that the EWS weights obtained by fitting to simulated
data without such covariates performed comparably to the optimal fit with covariates.
Mumps case study
To test the performance of our detection algorithm, we carried out 2 case studies on re-emerg-
ing vaccine-preventable childhood diseases. Our first challenge was to anticipate the reemer-
gence of mumps. In England, infant mumps vaccination started in 1988 and coincided with a
rapid reduction in incidence (Fig 1B). This period of low transmission was interrupted in 2004
to 2005 by outbreaks reported across the country, primarily among university-aged individuals
[35]. We examined whether our mechanism-agnostic approach could have anticipated these
outbreaks.
We used the EWS weights (trained on simulated data) to calculate our emergence risk mea-
sure, Dt. We additionally explored the potential impact of spatial scale on the predictability of
emergence by calculating Dt at both the national level (Fig 3A) and for each local authority
(LA) (Fig 3B and S8–S16 Figs). At the national level, the 2004 to 2005 outbreak was successfully
anticipated, with a lead time of approximately 4 years (Fig 3A). At the local level, from 1998
onwards, we observed an increasing number of LAs exceeding the detection threshold, shifting
from a baseline average of 4.6 LAs per week before 2000 to 23 detections per week at the start
of 2004 (S20 Fig).
We additionally categorized localities into those that experienced a sizeable outbreak in
2004 to 2005 and those with small epidemics (S17 Fig). As shown in Fig 3C, locations with
small outbreaks had a much lower emergence detection frequency, which we interpret to
mean a low false positive rate. To dissect whether differences across spatial scales may result
from data aggregation alone, we generated a simulated time series for each LA assuming spa-
tial independence, ensuring the number of emerging and nonemerging time series matched
the number of LAs with large and small outbreaks, respectively. As shown in Fig 3D, there was
qualitative agreement between simulated and mumps data. One discrepancy was that the num-
ber of LAs above the threshold in 2000 was lower for mumps. We speculate this is due to addi-
tional spatial heterogeneity in mumps transmission in England (beyond our emerging/
nonemerging categorization), perhaps with a small set of LAs (e.g., those with large urban stu-
dent populations) serving as foci.
Our measure of emergence risk should not be conflated with a prediction of future outbreak
size or its imminence. Dt quantifies whether the system is approaching Reff = 1. The final out-
break size is determined by additional factors, such as the susceptible population size and the
number initially infected [26]. We found no association between Dt and epidemic size for
large outbreak LAs (S18 Fig). Similarly, although there is no theoretically derived relationship
between Dt and the time of an expected outbreak, we observed a negative association between
an LA’s outbreak size and the detection time, defined as the last time that Dt< c prior to the
outbreak (Spearman’s ρ = −0.66; S19 Fig). This may be because larger outbreaks occur in LAs
with larger susceptible populations, which are more likely to experience repeated "sparks"
prior to the outbreak, hence providing a more reliable probe of the system’s state.
Pertussis case study
Our second case study focused on the resurgence of pertussis in the US. In most states, pertus-
sis incidence declined throughout the 1950s and 1960s until it reached a nadir in the mid-
1970s [36]. Since then, however, this trend has reversed. By the late 2000s, annual reported
incidence in many states had reached levels not seen since the 1960s (Fig 4A). The mechanisms
underlying this resurgence remain contested [21, 37, 38]. A striking feature of pertussis
PLOS BIOLOGY Dynamical footprints enable detection of disease emergence
PLOS Biology | https://doi.org/10.1371/journal.pbio.3000697 May 20, 2020 5 / 20

reemergence has been its geographic unevenness [36]. In some states, reemergence did not
take place until the mid-2000s (Fig 4C), whereas in others, resurgence occurred early, and inci-
dence has plateaued (Fig 4B). We restrict our analysis to the period from 1980 to 2000. We
were prevented from performing a similar analysis to mumps because of the substantial varia-
tion in the timing of the first large outbreak in each state (S24–S26 Figs), which precludes the
aggregation of detections in the same manner (for details, see S27 Fig). Instead, we used regres-
sion analysis to identify which states experienced reemergence (37 states, including Washing-
ton, DC) and which did not (12 states). We challenged our algorithm—based on the EWS
weights fitted to the simulated data—to predict whether resurgence occurred in each state (Fig
Fig 3. Performance at detecting the 2004 to 2005 mumps outbreak in England. (a) Laboratory-confirmed cases of
mumps in England. The predicted emergence risk (Dt; gray line) on the national level goes above the detection
threshold (c; horizontal line) around 2000. Shaded backgrounds indicate Dt> c. (b) LA 25 had the most cases of all
LAs and the longest lead time. Lines and shading correspond to the same quantities as shown in panel (a). (c) As the
lead time decreases, the fraction of LAs above the threshold increases. Most of the localities above the threshold prior
to 2004 had large outbreaks (> 92 cases). (d) Numerical simulation of a country with an administrative structure
matched to England produces qualitatively similar results as shown in panel (c). Data and code used to generate this
figure can be found at https://doi.org/10.5281/zenodo.3713381. LA, local authority.
https://doi.org/10.1371/journal.pbio.3000697.g003
PLOS BIOLOGY Dynamical footprints enable detection of disease emergence
PLOS Biology | https://doi.org/10.1371/journal.pbio.3000697 May 20, 2020 6 / 20
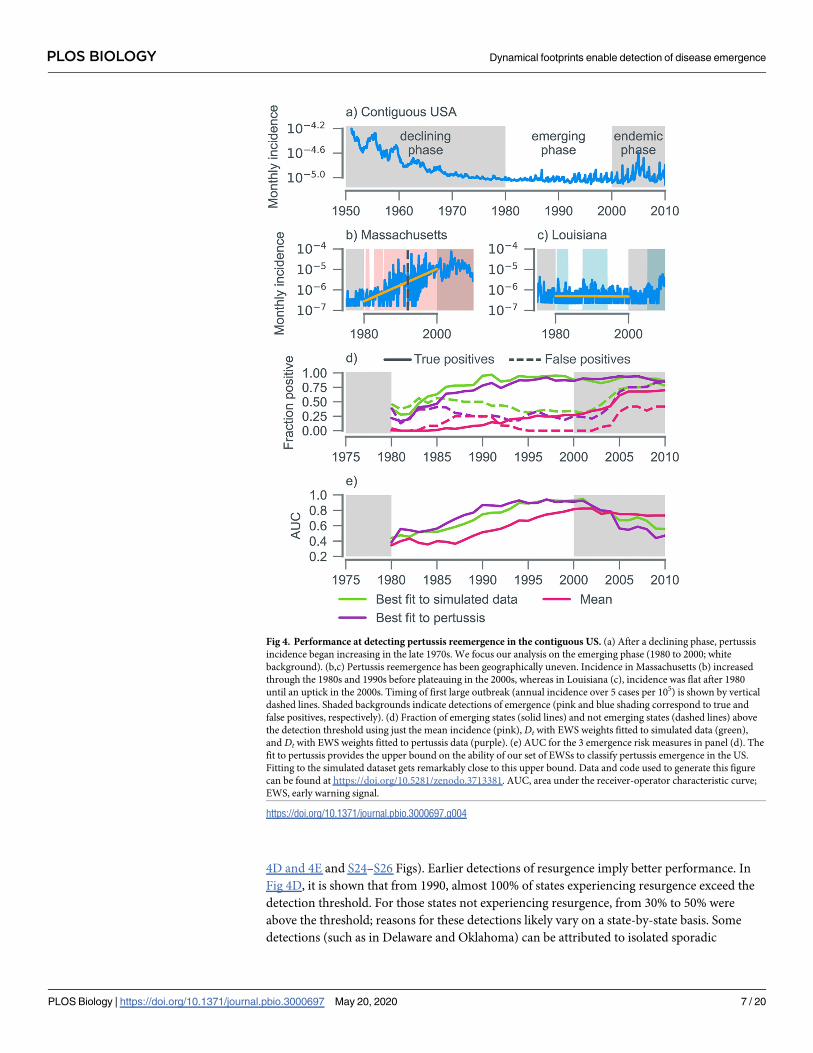
4D and 4E and S24–S26 Figs). Earlier detections of resurgence imply better performance. In
Fig 4D, it is shown that from 1990, almost 100% of states experiencing resurgence exceed the
detection threshold. For those states not experiencing resurgence, from 30% to 50% were
above the threshold; reasons for these detections likely vary on a state-by-state basis. Some
detections (such as in Delaware and Oklahoma) can be attributed to isolated sporadic
Fig 4. Performance at detecting pertussis reemergence in the contiguous US. (a) After a declining phase, pertussis
incidence began increasing in the late 1970s. We focus our analysis on the emerging phase (1980 to 2000; white
background). (b,c) Pertussis reemergence has been geographically uneven. Incidence in Massachusetts (b) increased
through the 1980s and 1990s before plateauing in the 2000s, whereas in Louisiana (c), incidence was flat after 1980
until an uptick in the 2000s. Timing of first large outbreak (annual incidence over 5 cases per 105) is shown by vertical
dashed lines. Shaded backgrounds indicate detections of emergence (pink and blue shading correspond to true and
false positives, respectively). (d) Fraction of emerging states (solid lines) and not emerging states (dashed lines) above
the detection threshold using just the mean incidence (pink), Dt with EWS weights fitted to simulated data (green),
and Dt with EWS weights fitted to pertussis data (purple). (e) AUC for the 3 emergence risk measures in panel (d). The
fit to pertussis provides the upper bound on the ability of our set of EWSs to classify pertussis emergence in the US.
Fitting to the simulated dataset gets remarkably close to this upper bound. Data and code used to generate this figure
can be found at https://doi.org/10.5281/zenodo.3713381. AUC, area under the receiver-operator characteristic curve;
EWS, early warning signal.
https://doi.org/10.1371/journal.pbio.3000697.g004
PLOS BIOLOGY Dynamical footprints enable detection of disease emergence
PLOS Biology | https://doi.org/10.1371/journal.pbio.3000697 May 20, 2020 7 / 20

outbreaks in under-vaccinated communities, not associated with the national trends [39]. In
other states (e.g., Wyoming, see panel Q of S26 Fig), the algorithm may be detecting a late
resurgence not identified by the linear regression.
To quantify algorithm performance, we calculated the time-varying AUC (a measure of
diagnostic ability), which crossed the nominal value of 0.8 around 1992 and continued to
increase as the year 2000 was approached (Fig 4E). As with simulated data, Dt outperforms any
individual EWS, as depicted in Fig 4D and 4E using the mean (the performance of the remain-
ing 7 EWS is shown in S28 Fig).
To obtain an upper bound on the ability of EWS to classify pertussis emergence, we
retrained the learning algorithm on pertussis data (Fig 4E). There is remarkable similarity in
performance relative to the model fitted to simulated data (Fig 4E). Reassuringly, the fit to per-
tussis data assigns most weight to the same 3 EWSs: the skewness, kurtosis, and coefficient of
variation (S29 Fig). Taken together, these findings suggest that our algorithm trained on simu-
lated data can be reliably applied to incidence data. Note that there were more positives (true
and false) when the algorithm is fitted to simulated data, indicating a lower detection threshold
(Fig 4D). This likely arose because demographic parameter ranges in the simulated data were
chosen to mimic those of England rather than the US.
Dengue and plague case studies
In addition to the reemergence of these 2 vaccine-preventable childhood diseases, we tested
the performance of our algorithm (fitted to the synthetic dataset described in the Methods) on
outbreaks of 2 vector-borne diseases, bubonic plague, and dengue. Compared with the mumps
and pertussis examples, the 2017 Madagascar plague outbreak took place over a much shorter
timescale, driven by increasingly favorable climatic factors [40, 41]. Examining the daily case
reports of bubonic plague, the emergence risk crossed the detection threshold 27 days after the
first reported case, a lead time of around 30 days before the outbreak in late September (Fig
5A).
The epidemiological dynamics of dengue virus (DENV) serotypes are complex; dengue
infection leads to lifelong serotype-specific immunity and a transient period of serotype-tran-
scending protection [42, 43]. In Puerto Rico, these interactions led to a sequence of extinctions
and recolonizations for DENV-1 (2000 to 2008), DENV-3 (1995 to 1998), and DENV-4 (2000
to 2008), with only DENV-2 in constant circulation over the entire period (Fig 5B–5E). Our
algorithm, which is designed to detect trends in transmission from incidence data, successfully
anticipated outbreaks of DENV-2 (2006) and DENV-3 (2008) that followed periods of modest
but continuous transmission. These outbreaks were the result of shifts in the immunological
profile of the population following the replenishment of the serotype-specific susceptible pool.
This caused a systematic increase in Reff culminating in a transcritical bifurcation. For DENV-
2, our algorithm made 2 sustained detections: 1 in 1998 that was associated with a small out-
break and 1 at the start of 2004 that preceded the takeoff of the 2006 outbreak by 18 months
(Fig 5C). For DENV-3, the 2008 outbreak was anticipated approximately 6 months ahead of
time (Fig 5D). As expected, because of the absence of transmission during extinction periods,
our algorithm was unable to anticipate sudden reintroduction events (e.g., DENV-1 in 2007).
Transfer learning using the pertussis dataset
As a final test of our transfer learning approach, we applied our detection method fitted to per-
tussis data (using only the 3 most important EWS discussed earlier) to mumps, plague, and
dengue on the national level (S31 and 32 Figs). Remarkably, there was next to no change in
performance when compared with fitting to simulated data. The plague outbreak was detected
PLOS BIOLOGY Dynamical footprints enable detection of disease emergence
PLOS Biology | https://doi.org/10.1371/journal.pbio.3000697 May 20, 2020 8 / 20

Fig 5. Performance at detecting outbreaks of (a) bubonic plague in Madagascar and (b-e) dengue in Puerto Rico.
EWSs are calculated using different temporal resolutions: daily case counts of bubonic plague and weekly case counts
of serotyped DENV infections. (a) For plague, emergence risk (Dt) increases above the detection threshold on day 27.
(b) The algorithm detects a small uptick in DENV-1 cases around 1998. The 2009 outbreak is detected 1 year in
advance; detection prior to this is impossible because of an absence of cases. (c) For DENV-2, the algorithm makes 2
detections: 1 in 1998 that was not associated with a large outbreak and 1 at the start of 2004 that preceded the takeoff of
the 2006 outbreak by 18 months. (d) For a long period (roughly 1999 to 2004), Dt is above the detection threshold for
DENV-3, centered on a small outbreak in late 2001 (with a weekly peak of 22 confirmed cases). The much larger 2008
DENV outbreak is detected with a lead time of about 6 months. (e) The outbreak of DENV-4 in late 1998 was detected
with a lead time of around 4 months. The reintroduction of DENV-4 in 2007 triggered a further detection. Data and
code used to generate this figure can be found at https://doi.org/10.5281/zenodo.3713381. DENV, dengue virus; EWS,
early warning signal.
https://doi.org/10.1371/journal.pbio.3000697.g005
PLOS BIOLOGY Dynamical footprints enable detection of disease emergence
PLOS Biology | https://doi.org/10.1371/journal.pbio.3000697 May 20, 2020 9 / 20
on the same day, whereas for both the mumps and dengue outbreaks, the detections were
within 2 months of each other. There was a reduction in positives (true and false) for mumps
at the local level; however, there was still an appreciable increase in detections in LAs with
large outbreaks before 2004 (S31C Fig). This robustness to the choice of training data under-
scores that our transfer learning–based approach is not reliant on the specifics of the simulated
dataset. Instead, its success stems from the generic statistical properties of incidence data
across disease emergence contexts.
Discussion
At first glance, it may appear surprising that a singular detection method is able to detect emer-
gence in the diverse contexts studied in this paper. However, underlying all these systems are
dynamical commonalities inherent to the disease transmission process: as the reproductive
number increases, the feedback effect of each infectious case on subsequent transmission is
enhanced ("critical-slowing down"). In a similar vein to a recent study on the elimination of
measles [44], our work shows that there is a "canonical path" for diseases emerging via
increases in the reproductive number and that it can be found using statistical learning
methods.
Although we have endeavored to design our detection method such that it is broadly appli-
cable, specific usage of our algorithm necessitates decisions that cannot be made in a context-
agnostic manner. In particular, all detection methods face a trade-off between reducing false
positives (via a higher detection threshold) and false negatives (a lower threshold). For the
mumps example, because of the rarity of outbreaks, our optimized threshold resulted in a rela-
tively large total number of false positives prior to the 2004 outbreak, which could conceivably
result in detection fatigue among end users. This threshold was arrived at by minimizing the
classification error, assigning an equal cost to the false negative and false positive rates. The
number of false positives can be reduced dramatically by assigning a greater cost to false posi-
tives than false negatives (S21 Fig), however, with an unavoidable reduction in the lead time
provided by detections of the 2004 outbreak. The appropriate detection threshold is condi-
tional on the potential human, economic, and political costs of a missed outbreak (which
would be greater for dengue than for mumps, for example), and requires an assessment that
can only be made by public health authorities.
The early warning system proposed here is likely to operate successfully for acute infectious
diseases in which the approach to the critical transition (i.e., Reff! 1) is gradual. This may
result from (1) steady shifts in a population’s immune profile due to either waning immunity
[21] or turnover in “antigenic seniority,” as documented in influenza [22], and (2) the accumu-
lation of mutations that facilitate immune evasion [45] or host adaptation [20]. Instances in
which the transition is abrupt (for example, the introduction of a reassortant influenza virus
[46] or the de novo spillover of an easily human-to-human transmissible pathogen from a zoo-
notic reservoir [16], such as Ebola virus) cannot conceivably be predicted using approaches
that rely on statistical trends in incidence data.
Here, we have demonstrated how ideas from the science of critical slowing down, imple-
mented via a machine-learned detection method, point the way forward for early warning of
disease (re-)emergence. Although our fitted model performed remarkably well in each case
study, the gravity of confident declaration of disease (re-)emergence demands further scrutiny
on the ideal choice of training data and the predictive impact of alternative fitting methodolo-
gies. Given the importance of anticipating such events and identifying appropriate preemptive
steps to mitigate their toll, the adoption of a multiplicity of approaches is warranted [13–17].
PLOS BIOLOGY Dynamical footprints enable detection of disease emergence
PLOS Biology | https://doi.org/10.1371/journal.pbio.3000697 May 20, 2020 10 / 20
Progress will likely require a combination of activities including pathogen discovery, charac-
terization, and increased zoonotic surveillance, allied to cutting edge data analytics.
Methods
EWSs
EWSs are indicators of approaching critical transitions in dynamical systems. Mathematically,
they are defined as the moments and correlation functions of the fluctuations away from a sta-
ble equilibrium [29]. As the critical point is approached, the strength of restorative forces
decreases, and the magnitude of the fluctuations increases. These changes are captured in vari-
ous different unique EWSs, Θi,t, which are indexed by the subscript i = 1. . .n. We considered
n = 8 EWS: the mean, standard deviation, coefficient of variation, index of dispersion, skew-
ness, kurtosis, and autocorrelation at lags 1 and 2. For R0 < 1, the disease-free equilibrium is
stable; previous theoretical studies have shown that as R0 approaches 1, there are detectable
trends in the EWS [30–32].
Operationally, EWSs are calculated from a single epidemiological time series (fXsgTs¼t0
;
either case reports or incidence). We grouped weekly case reports into 4-week totals, informed
by previous findings [33]. Estimators for each EWS were constructed by substituting any
expectations, E½f ðXtÞ�, in its mathematical definition with an exponentially weighted moving
window average,
E½f ðXtÞ� �
Xt
s¼t0
e� lðt� sÞf ðXsÞ
Xt
s¼t0
e� lðt� sÞ: ð1Þ
The decay rate λ was specified by the half-life (the length of time for the exponential weight
to half in magnitude), t1/2 = ln(2)/λ. Preliminary studies found using exponential weighting in
the moving averaging, rather than the more common uniform window, performed better at
detecting emergence in the synthetic dataset. The estimators for each EWS are listed in S1
Table.
Synthetic dataset
This dataset was generated using a stochastic SEIR model [47]. The model incorporates demo-
graphic and environmental stochasticity as well as reporting error. Simulations were per-
formed using the next reaction method [48]. The population size fluctuated via births and
deaths, with a stable mean population size N0 and a mean life expectancy of 75 years. Trans-
mission due to external sources occurred at rate z. Latent and infectious periods were assumed
to be exponentially distributed with a mean of 13 days and 6 days, respectively, values appro-
priate for mumps [47]. Infection-derived immunity was assumed to be complete and lifelong.
Time series were of length 20 years: a 10-year transient period with fixed parameters (not used
for training the learning algorithm), followed by T = 10 years with varying parameters. For
each time series, i, R0 followed a unique stochastic trajectory with initial value RðiÞ0 ð0Þ < 1. We
generated 2 types of data. Time series for an emerging pathogen were generated using a
Brownian bridge process, with curvature determined by parameter κ. For these data,
RðiÞ0 ðTÞ ¼ 1. We also generated data with no average trend in R0, such that E½R0ðTÞ� ¼ RðiÞ0 ;
these data were generated using an Ornstein–Uhlenbeck process. To ensure that RðiÞ0 ðtÞ < 1
for all t< T for emerging and nonemerging time series and that RðiÞ0 ðTÞ ¼ 1 for the emerging
PLOS BIOLOGY Dynamical footprints enable detection of disease emergence
PLOS Biology | https://doi.org/10.1371/journal.pbio.3000697 May 20, 2020 11 / 20

time series, we ignored seasonality in transmission (a feature of all the diseases studied in this
paper). The simulation algorithm returned time series of the reported number of new cases.
These case counts were aggregated into weekly case reports, mimicking the practices of public
health bodies. A negative binomial reporting error was applied to each weekly case report,
with mean ρ. Model symbols and reaction rates are listed in S2 and S3 Tables, respectively. A
total of 10,000 stochastic trajectories were generated, with an even split between emerging and
nonemerging. We used Latin hypercube sampling so that each simulated time series had
unique values for 5 parameters: initial population size (N0), reporting probability (ρ), import
rate (z), the initial R0 (RðiÞ0 ), and the volatility of the Brownian random walk (κ). Parameter
ranges for the Latin hypercube are given in S4 Table.
Learning algorithm
As a measure of emergence risk, we used
DtðYt;wÞ ¼
"
1þ e�
Xn
i¼1
wiYi;t � w0
#� 1
; ð2Þ
where wt is the weight applied to the i-th EWS, w0 is the intercept, and n = 8. We fitted Dt to
the synthetic dataset using logistic regression with an ℓ1-penalty ("lasso regression" [49]), treat-
ing each time point of each time series as an independent data point (see S1 Text for more
details). Each data point was assigned equal importance in the fit—i.e., we did not prioritize
classification accuracy for data points closer to the time of emergence. We used an ℓ1-penalty
both to prevent overfitting to the training data and as a means of feature selection [49]. Our
learning algorithm has 2 hyperparameters, the penalty strength p and the half-life t1/2 (used to
calculate the EWSs), which were optimized using the AUC via 10-fold cross-validation [49]
(see S1 Text). Using the optimized hyperparameters, we trained on the full synthetic dataset to
get the optimum set of weights fwigni¼1
and intercept w0 for Dt. We selected a detection thresh-
old c by calculating the ROC curve—a parametric plot of type I errors against type II errors as
a function of detection threshold—and finding the threshold that minimizes the sum of the
type I and type II error rates. We calculated the AUC through time by grouping the dataset by
reporting week and then calculating the ROC for each group separately. The AUC was calcu-
lated from the ROC curve using the trapezoidal rule. We fitted Eq 2 to both case reports data
and incidence data (calculated by scaling each simulated time series by its associated popula-
tion size).
Mumps data
We sourced laboratory-confirmed mumps cases from Public Health England. Cases were dis-
aggregated by specimen collection week and the respective LA. To preserve patient anonymity,
each LA was assigned a unique integer identifier and every specimen week was shifted by the
same constant. Because of the formation of new LAs during the time period, we restricted our
analysis to the 157 LAs with cases of mumps prior to vaccination in 1988. We calculated emer-
gence risk for each LA by grouping cases into 4-week reporting intervals and applying Eq 2,
using the fit to the synthetic case reports. Emergence risk was calculated nationally by aggre-
gating 4-week case reports from all LAs before calculating the EWSs.
For each LA, we calculated the outbreak size (total cases) in 2004 to 2005. To assign LAs as
those with large and small outbreaks, we modeled outbreak size using a general mixture
model. The model used was a mixture of 2 exponential distributions, Pð�Þ ¼X2
i¼1�ifið�; liÞ,
PLOS BIOLOGY Dynamical footprints enable detection of disease emergence
PLOS Biology | https://doi.org/10.1371/journal.pbio.3000697 May 20, 2020 12 / 20

with rate parameters λ1� λ2. We fitted the model to the outbreak size data using maximum
likelihood. An observed outbreak of size o was classified as large if �1f1ðo; l1Þ > �2f2ðo; l2Þ;
otherwise, we classified it as small.
Pertussis data
We obtained monthly pertussis case reports for each of the 48 contiguous states plus the Dis-
trict of Columbia from 1980 to 2000 [36]. Using state-level population data [50], we converted
case reports data into incidence data. We performed a linear regression on the log-transformed
monthly incidence data. States were classified as either emerging or not emerging based on the
significance of the slope using a 1-sided t test. We used a significance level of 0.05.
EWSs were calculated for each state. Emergence risk was then calculated with Eq 2, using
the weights fitted to the synthetic incidence dataset. Performance was assessed by calculating
the AUC, using the linear regression classification as the true classification. Emergence risk
was also calculated using Eq 2 with weights fitted to the pertussis data instead of simulated
data. For this fit, the linear regression classification of each state was used as the target in the
logistic regression.
Plague and dengue data
Daily case counts of bubonic plague in Madagascar were obtained from [40]. Weekly serotype-
resolved confirmed cases of dengue were made publicly available by the NOAA as part of the
Dengue Forecasting project.
Data availability
Data and code to reproduce results are deposited in the Zenodo repository: https://doi.org/10.
5281/zenodo.3713381 [51].
Supporting information
S1 Text. Supplemental text.
(PDF)
S1 Table. List of early warning signals.
(DOCX)
S2 Table. Model symbols.
(DOCX)
S3 Table. Transitions of the SEIR transmission model. At the beginning of each aggregation
period C is reset to 0.
(DOCX)
S4 Table. Latin hypercube space.
(DOCX)
S5 Table. List of EWS weights and intercepts. Weights found by performing lasso regression
on the dataset indicated in the columns with hyperparameters weeks (see S2 Fig). EWS, early
warning signal.
(DOCX)
S1 Fig. Time series of 20 emerging (left column) and nonemerging (right column) samples
from the Latin hypercube. Top row shows trajectories of R0(t); bottom row shows case reports
PLOS BIOLOGY Dynamical footprints enable detection of disease emergence
PLOS Biology | https://doi.org/10.1371/journal.pbio.3000697 May 20, 2020 13 / 20

through time. Convex trajectories are generated using κ> 1, whereas concave use κ< 1. Data
and code used to generate this figure can be found at https://doi.org/10.5281/zenodo.3713381.
(TIF)
S2 Fig. Heat maps showing mean AUC values from cross-validation for (a) incidence data
and (b) case reports data. The results are largely unaffected by data type, with the same maxi-
mum, μAUC = 0.68, located at tm1=2¼ 156 weeks, pm = 10−3. The black contour indicates the
region within 1 standard deviation of the maximum. The best hyperparameter values are the
same for both data types, t1/2 = 156 and p = 104. Data and code used to generate this figure can
be found at https://doi.org/10.5281/zenodo.3713381. AUC, area under the receiver-operator
characteristic curve.
(TIF)
S3 Fig. AUC through time for the complete simulated dataset. In panel (a), case counts are
converted to incidence data before EWSs are calculated; in panel (b), raw case counts are used.
Our measure of emergence risk, Dt, with weights fitted to the simulated data (light green line)
outperforms any individual EWS at distinguishing between emerging and nonemerging time
series. Performance is only affected by data type for the mean, variance, and index of disper-
sion. Data and code used to generate this figure can be found at https://doi.org/10.5281/
zenodo.3713381. AUC, area under the receiver-operator characteristic curve; EWS, early
warning signal.
(TIF)
S4 Fig. Analysis of importance of individual EWSs to performance of Dt. (a) AUC through
time when fitting Dt with 1 EWS left out. Color matches S3 Fig and indicates the EWSs left
out. (b) Same data as panel (a) but showing only the AUC at a lead time of 3 years. EWSs are
ordered from left to right based on impact on performance. Exclusion of the skewness is seen
to have the most detrimental impact on performance, followed by the kurtosis and coefficient
of variation. (c,d) Based on the ranking in (b), EWSs are sequentially added, with color indicat-
ing the rightmost EWS included in the fit. Including the skewness, kurtosis, and coefficient of
variation is sufficient to get close to optimal performance. Calculated using incidence data.
Data and code used to generate this figure can be found at https://doi.org/10.5281/zenodo.
3713381. AUC, area under the receiver-operator characteristic curve; EWS, early warning sig-
nal.
(TIF)
S5 Fig. AUC through time for the simulated dataset with only convex trends in R0. Case
counts are converted to incidence data before EWSs are calculated. The fit to the simulated
dataset with both concave and convex trends (light green) has comparable performance to the
fit to just convex simulated data (dark purple). Data and code used to generate this figure can
be found at https://doi.org/10.5281/zenodo.3713381. AUC, area under the receiver-operator
characteristic curve; EWS, early warning signal.
(TIF)
S6 Fig. AUC through time for the simulated dataset with only concave trends in R0. Case
counts are converted to incidence data before EWSs are calculated. The fit to the simulated
dataset with both concave and convex trends (light green) has comparable performance to the
fit to just concave simulated data (dark purple). Data and code used to generate this figure can
be found at https://doi.org/10.5281/zenodo.3713381. AUC, area under the receiver-operator
characteristic curve; EWS, early warning signal.
(TIF)
PLOS BIOLOGY Dynamical footprints enable detection of disease emergence
PLOS Biology | https://doi.org/10.1371/journal.pbio.3000697 May 20, 2020 14 / 20

S7 Fig. AUC through time for the simulated dataset with the inclusion of covariates.
Covariates included are the population size, the reporting probability, and the importation
rate. Covariates vary linearly through time; initial and final values are included as independent
variables in the Latin hypercube with identical ranges given in S4 Table. Case counts are con-
verted to incidence data before EWSs are calculated. The fit to the simulated dataset with
covariates (light green) has comparable performance to the fit without their inclusion (dark
purple). Data and code used to generate this figure can be found at https://doi.org/10.5281/
zenodo.3713381. AUC, area under the receiver-operator characteristic curve; EWS, early
warning signal.
(TIF)
S8 Fig. Mumps cases by local authority. The coloring indicates the classification using the
GMM, with red and blue corresponding to large and small outbreaks, respectively. Shaded
backgrounds indicate Dt< c. Data and code used to generate this figure can be found at
https://doi.org/10.5281/zenodo.3713381. GMM, general mixture model.
(TIF)
S9 Fig. Continuation of S8 Fig.
(TIF)
S10 Fig. Continuation of S8 Fig.
(TIF)
S11 Fig. Continuation of S8 Fig.
(TIF)
S12 Fig. Continuation of S8 Fig.
(TIF)
S13 Fig. Continuation of S8 Fig.
(TIF)
S14 Fig. Continuation of S8 Fig.
(TIF)
S15 Fig. Continuation of S8 Fig.
(TIF)
S16 Fig. Continuation of S8 Fig.
(TIF)
S17 Fig. Fit of the GMM to outbreak size data for mumps in England. The GMM fit identi-
fies a boundary between large and small outbreaks at 92 cases (dashed gray line). Dots show the
empirical distribution calculated using a bin width of 5. Data and code used to generate this fig-
ure can be found at https://doi.org/10.5281/zenodo.3713381. GMM, general mixture model.
(TIF)
S18 Fig. Size of the 2004 to 2005 mumps outbreak against emergence risk at the start of
2004, D2004. Data and code used to generate this figure can be found at https://doi.org/10.
5281/zenodo.3713381.
(TIF)
S19 Fig. Size of the 2004 to 2005 mumps outbreak against the detection time. Data and
code used to generate this figure can be found at https://doi.org/10.5281/zenodo.3713381.
(TIF)
PLOS BIOLOGY Dynamical footprints enable detection of disease emergence
PLOS Biology | https://doi.org/10.1371/journal.pbio.3000697 May 20, 2020 15 / 20

S20 Fig. (a) Fraction of LAs above the detection threshold through time. Excluding LAs for
which no cases were recorded between 1990 to 2004 (32 in total) has little effect on either frac-
tion. (b) Number of LAs above the detection threshold through time. Data and code used to
generate this figure can be found at https://doi.org/10.5281/zenodo.3713381. LA, local authority.
(TIF)
S21 Fig. Same as S20 Fig, however, with a higher detection threshold, c = 0.65. Data and
code used to generate this figure can be found at https://doi.org/10.5281/zenodo.3713381.
(TIF)
S22 Fig. Performance of Dt and each individual EWS at detecting mumps outbreaks.
Weights and thresholds for both Dt and the individual EWS were found by fitting to the simu-
lated training data. (a) Detection rate in local authorities with large outbreaks. We assumed
that these detections are true positives. (b) False positives, i.e., detections in local authorities
with small outbreaks. (c) Difference between the true and false positive rates. (d) Close up of
panel (c) focusing on the last 6 years before the outbreak; the coefficient of variation, skewness,
and kurtosis are not shown in this panels as these 3 EWSs performed poorly individually—
echoing their performance during training (S3 Fig)—with high initial false positive and true
positive rates. For all the remaining EWSs, detections increased as the transition was
approached, with the fit using all EWSs, Dt, having the highest true positive rate (a) and differ-
ence between positive rates (c and d) for most of the period post-2000. Performance of the
autocorrelation (at lags 1 and 2) and the index of dispersion are close behind. Data and code
used to generate this figure can be found at https://doi.org/10.5281/zenodo.3713381. EWS,
early warning signal.
(TIF)
S23 Fig. Fit of the GMM to annual incidence for pertussis. The GMM is fit to the annual
incidence data from the years 1980 to 2012, treating each year and state as an independent
sample. The fit identifies a boundary between large and small outbreaks of 6.10 cases per 105
(dashed gray line). Dots show the empirical distribution calculated using a bin width of 1 case
per 105. Data and code used to generate this figure can be found at https://doi.org/10.5281/
zenodo.3713381. GMM, general mixture model.
(TIF)
S24 Fig. Emergence risk for pertussis in US states AL–KY. Colors indicate whether the linear
regression analysis classified a state as emerging (red) or not (blue). Log-transformed inci-
dence data are shown in dark blue; linear regression fits are shown in orange. p-Values from
the linear regression analysis are shown in the panel labels. Shaded backgrounds indicate Dt>
c. Black dashed vertical lines indicate the year of the first large outbreak, found using the
GMM. Data and code used to generate this figure can be found at https://doi.org/10.5281/
zenodo.3713381. GMM, general mixture model.
(TIF)
S25 Fig. Continuation of S24 Fig for states LA–NC.
(TIF)
S26 Fig. Continuation of S24 Fig for states ND–WY.
(TIF)
S27 Fig. (a) Fraction of states above the detection threshold for a range of detection
thresholds as a function of lead time to the first large outbreak (determined using the
GMM). Also shown are the number of states with p< 0.05 when using the linear regression
PLOS BIOLOGY Dynamical footprints enable detection of disease emergence
PLOS Biology | https://doi.org/10.1371/journal.pbio.3000697 May 20, 2020 16 / 20

method. (b) Because the earliest year used to calculate the EWSs is 1980, the number of states
in the denominator of the fraction decreases as the lead time increases, with states that have the
earliest first large outbreaks dropping out first. This leads to difficulties interpreting the results
shown in panel (a) at lead times greater than 4 years. Data and code used to generate this figure
can be found at https://doi.org/10.5281/zenodo.3713381. EWS, early warning signal.
(TIF)
S28 Fig. Performance of different EWS at classifying pertussis reemergence in USA using
incidence data. The fit to simulated data performs much better than any individual EWS and
is close to the upper bound on the ability of our set of EWS to classify pertussis emergence in
the US. Data and code used to generate this figure can be found at https://doi.org/10.5281/
zenodo.3713381. EWS, early warning signal.
(TIF)
S29 Fig. Replication of S4 Fig using pertussis data. The skewness, kurtosis, and coefficient of
variation remain the most important to the performance of Dt. Data and code used to generate
this figure can be found at https://doi.org/10.5281/zenodo.3713381.
(TIF)
S30 Fig. Time series of confirmed cases for DENV serotypes 1–4. Data and code used to
generate this figure can be found at https://doi.org/10.5281/zenodo.3713381. DENV, dengue
virus.
(TIF)
S31 Fig. Replication of Fig 3 using weights trained on the pertussis dataset. Instead of train-
ing on the simulated data, we take the weights and detection threshold found by training on
the pertussis data. We only included the 3 EWSs that were most important to the performance
of Dt in the fit (see S4 Fig), namely, the coefficient of variation, the kurtosis, and the skewness.
On the national level, the detection time is largely unchanged. On the local authority level,
both true and false positives are reduced, indicating a more stringent detection threshold. Per-
formance is slightly worse if the fit to pertussis including all EWSs is used. Data and code used
to generate this figure can be found at https://doi.org/10.5281/zenodo.3713381. EWS, early
warning signal.
(TIF)
S32 Fig. Replication of Fig 5 using weights trained on the pertussis data instead of the sim-
ulated training data. We see no effect on the timing of detection for bubonic plague and a
very small effect for dengue. Data and code used to generate this figure can be found at https://
doi.org/10.5281/zenodo.3713381.
(TIF)
S33 Fig. Comparison of performance of EWS-based detection methods with using linear
regression. Linear regression is performed using the log-transformed pertussis data from 1980
to the date indicated on the x-axis. As the endpoint of the linear regression approaches 2000,
the AUC approaches 1. This is to be expected, as we are comparing the performance of the lin-
ear regression with itself. The EWS-based approach fitted to simulated data tracks this perfor-
mance closely until the mid-1990s, when the AUC saturates at 0.9. The EWS-based approach
fitted to the pertussis data outperforms the linear regression during much of the 1980s and
90s, because of the 8-dimensional logistic model’s increased flexibility. Data and code used to
generate this figure can be found at https://doi.org/10.5281/zenodo.3713381. AUC, area under
the receiver-operator characteristic curve; EWS, early warning signal.
(TIF)
PLOS BIOLOGY Dynamical footprints enable detection of disease emergence
PLOS Biology | https://doi.org/10.1371/journal.pbio.3000697 May 20, 2020 17 / 20

S34 Fig. Comparison of (a) the EWS method and (b) a linear regression method at predict-
ing the 2006 DENV-2 outbreak. The linear regression method was implemented in the same
way as for the pertussis case study and was calculated using all log-transformed case reports
from January 1, 1995 up to the week indicated. As can be seen by visually inspecting the curves
in panel (b), even if the significance level (i.e., the detection threshold, indicated by the hori-
zontal line) is lowered, the linear regression method performs worse at detecting the outbreak.
Data and code used to generate this figure can be found at https://doi.org/10.5281/zenodo.
3713381. DENV, dengue virus; EWS, early warning signal.
(TIF)
Acknowledgments
We thank E. B. O’Dea, J. M. Drake, and A. W. Park for helpful discussions informing the
study, and J. M. Drake for valuable comments on the manuscript.
Author Contributions
Conceptualization: Tobias S. Brett, Pejman Rohani.
Data curation: Tobias S. Brett, Pejman Rohani.
Funding acquisition: Pejman Rohani.
Investigation: Tobias S. Brett, Pejman Rohani.
Methodology: Tobias S. Brett.
Software: Tobias S. Brett.
Supervision: Pejman Rohani.
Validation: Tobias S. Brett.
Visualization: Tobias S. Brett.
Writing – original draft: Tobias S. Brett.
Writing – review & editing: Tobias S. Brett, Pejman Rohani.
References1. Lewnard JA, Grad YH. Vaccine waning and mumps re-emergence in the United States. Science Trans-
lational Medicine. 2018; 10(433).
2. Jansen VA, Stollenwerk N, Jensen HJ, Ramsay M, Edmunds W, Rhodes C. Measles outbreaks in a
population with declining vaccine uptake. Science. 2003; 301(5634):804–804. https://doi.org/10.1126/
science.1086726 PMID: 12907792
3. Rohani P, Scarpino S, editors. Pertussis: Epidemiology, Immunology, and Evolution. Oxford University
Press; 2019.
4. Enright MC, Robinson DA, Randle G, Feil EJ, Grundmann H, Spratt BG. The evolutionary history of
methicillin-resistant Staphylococcus aureus (MRSA). Proceedings of the National Academy of Sci-
ences. 2002; 99(11):7687–7692.
5. Read AF, Huijben S. Perspective: Evolutionary biology and the avoidance of antimicrobial resistance.
Evolutionary Applications. 2009; 2(1):40–51. https://doi.org/10.1111/j.1752-4571.2008.00066.x
6. Shah NS, Wright A, Bai GH, Barrera L, Boulahbal F, Martn-Casabona N, et al. Worldwide emergence of
extensively drug-resistant tuberculosis. Emerging Infectious Diseases. 2007; 13(3):380. https://doi.org/
10.3201/eid1303.061400 PMID: 17552090
PLOS BIOLOGY Dynamical footprints enable detection of disease emergence
PLOS Biology | https://doi.org/10.1371/journal.pbio.3000697 May 20, 2020 18 / 20

7. Patz JA, Daszak P, Tabor GM, Aguirre AA, Pearl M, Epstein J, et al. Unhealthy Landscapes: Policy
Recommendations on Land Use Change and Infectious Disease Emergence. Environmental Health
Perspectives. 2004; 112(10):1092–1098. https://doi.org/10.1289/ehp.6877 PMID: 15238283
8. Mordecai EA, Cohen JM, Evans MV, Gudapati P, Johnson LR, Lippi CA, et al. Detecting the impact of
temperature on transmission of Zika, dengue, and chikungunya using mechanistic models. PLoS Negl
Trop Dis. 2017; 11(4):e0005568. https://doi.org/10.1371/journal.pntd.0005568 PMID: 28448507
9. Morens D, Folkers G, Fauci A. The challenge of emerging and re-emerging infectious diseases. Nature.
2004; 430(6996):242–249. https://doi.org/10.1038/nature02759 PMID: 15241422
10. McLean AR, May RM, Pattison J, Weiss RA. SARS: A Case Study in Emerging Infections. Oxford Uni-
versity Press; 2005.
11. Gostin LO, Friedman EA. A retrospective and prospective analysis of the West African Ebola virus dis-
ease epidemic: robust national health systems at the foundation and an empowered WHO at the apex.
The Lancet. 2015; 385(9980):1902–1909.
12. Morens DM, Fauci AS. Emerging infectious diseases: threats to human health and global stability.
PLoS Pathog. 2013; 9(7):e1003467. https://doi.org/10.1371/journal.ppat.1003467 PMID: 23853589
13. Carroll D, Daszak P, Wolfe ND, Gao GF, Morel CM, Morzaria S, et al. The global virome project. Sci-
ence. 2018; 359(6378):872–874. https://doi.org/10.1126/science.aap7463 PMID: 29472471
14. Wolfe N. The viral storm: The dawn of a new pandemic age. Macmillan; 2011.
15. Neumann G, Noda T, Kawaoka Y. Emergence and pandemic potential of swine-origin H1N1 influenza
virus. Nature. 2009; 459(7249):931. https://doi.org/10.1038/nature08157 PMID: 19525932
16. Jones KE, Patel NG, Levy MA, Storeygard A, Balk D, Gittleman JL, et al. Global trends in emerging infec-
tious diseases. Nature. 2008; 451(7181):990. https://doi.org/10.1038/nature06536 PMID: 18288193
17. Babayan SA, Orton RJ, Streicker DG. Predicting reservoir hosts and arthropod vectors from evolution-
ary signatures in RNA virus genomes. Science. 2018; 362(6414):577–580. https://doi.org/10.1126/
science.aap9072 PMID: 30385576
18. Łuksza M, Lassig M. A predictive fitness model for influenza. Nature. 2014; 507(7490):57–61. https://
doi.org/10.1038/nature13087 PMID: 24572367
19. Gouma S, Vermeire T, Van Gucht S, Martens L, Hutse V, Cremer J, et al. Differences in antigenic sites
and other functional regions between genotype A and G mumps virus surface proteins. Scientific
Reports. 2018; 8(13337):1–10.
20. Antia R, Regoes RR, Koella JC, Bergstrom CT. The role of evolution in the emergence of infectious dis-
eases. Nature. 2003; 426(6967):658. https://doi.org/10.1038/nature02104 PMID: 14668863
21. Domenech de Cellès M, Magpantay FMG, King AA, Rohani P. The impact of past vaccination coverage
and immunity on pertussis resurgence. Science Translational Medicine. 2018; 10(434).
22. Gostic KM, Ambrose M, Worobey M, Lloyd-Smith JO. Potent protection against H5N1 and H7N9 influ-
enza via childhood hemagglutinin imprinting. Science. 2016; 354(6313):722–726. https://doi.org/10.
1126/science.aag1322 PMID: 27846599
23. Takahashi S, Metcalf CJE, Ferrari MJ, Moss WJ, Truelove SA, Tatem AJ, et al. Reduced vaccination
and the risk of measles and other childhood infections post-Ebola. Science. 2015; 347(6227):1240–
1242. https://doi.org/10.1126/science.aaa3438 PMID: 25766232
24. Wilson ME. Travel and the emergence of infectious diseases. Emerging Infectious Diseases. 1995; 1
(2):39. PMID: 8903157
25. Arinaminpathy N, McLean A. Evolution and emergence of novel human infections. Proceedings of the
Royal Society of London B: Biological Sciences. 2009; 276(1675): 3937–3943.
26. Blumberg S, Lloyd-Smith JO. Inference of R0 and transmission heterogeneity from the size distribution
of stuttering chains. PLoS Comput Biol. 2013; 9(5):e1002993. https://doi.org/10.1371/journal.pcbi.
1002993 PMID: 23658504
27. Cauchemez S, Epperson S, Biggerstaff M, Swerdlow D, Finelli L, Ferguson NM. Using routine surveil-
lance data to estimate the epidemic potential of emerging zoonoses: application to the emergence of
US swine origin influenza A H3N2v virus. PLoS Med. 2013; 10(3):e1001399. https://doi.org/10.1371/
journal.pmed.1001399 PMID: 23472057
28. Anderson RM, May RM. Immunisation and herd immunity. The Lancet. 1990; 335(8690):641–645.
29. Scheffer M, Bascompte J, Brock WA, Brovkin V, Carpenter SR, Dakos V, et al. Early-warning signals
for critical transitions. Nature. 2009; 461(7260):53–59. https://doi.org/10.1038/nature08227 PMID:
19727193
30. O’Regan SM, Drake JM. Theory of early warning signals of disease emergence and leading indicators
of elimination. Theoretical Ecology. 2013; 6(3):333–357. https://doi.org/10.1007/s12080-013-0185-5
PMID: 32218877
PLOS BIOLOGY Dynamical footprints enable detection of disease emergence
PLOS Biology | https://doi.org/10.1371/journal.pbio.3000697 May 20, 2020 19 / 20

31. Brett TS, Drake JM, Rohani P. Anticipating the emergence of infectious diseases. Journal of The Royal
Society Interface. 2017; 14(132):20170115.
32. O’Dea EB, Drake JM. Disentangling reporting and disease transmission. Theoretical Ecology. 2018; 12
(1):89–98.
33. Brett TS, O’Dea EB, Marty E, Miller PB, Park AW, Drake JM, et al. Anticipating epidemic transitions with
imperfect data. PLoS Comput Biol. 2018; 14(6):e1006204. https://doi.org/10.1371/journal.pcbi.
1006204 PMID: 29883444
34. Miller PB, O’Dea EB, Rohani P, Drake JM. Forecasting infectious disease emergence subject to sea-
sonal forcing. Theoretical Biology and Medical Modelling. 2017; 14(1):17. https://doi.org/10.1186/
s12976-017-0063-8 PMID: 28874167
35. Gupta RK, Best J, MacMahon E. Mumps and the UK epidemic 2005. BMJ. 2005; 330(7500):1132–
1135. https://doi.org/10.1136/bmj.330.7500.1132 PMID: 15891229
36. Rohani P, Drake JM. The decline and resurgence of pertussis in the US. Epidemics. 2011; 3(3–4):183–
188. https://doi.org/10.1016/j.epidem.2011.10.001 PMID: 22094341
37. Cherry JD, Gornbein J, Heininger U, Stehr K. A search for serologic correlates of immunity to Bordetella
pertussis cough illnesses. Vaccine. 1998; 16(20):1901–1906. https://doi.org/10.1016/s0264-410x(98)
00226-6 PMID: 9796041
38. Wendelboe AM, Van Rie A, Salmaso S, Englund JA. Duration of immunity against pertussis after natu-
ral infection or vaccination. The Pediatric Infectious Disease Journal. 2005; 24(5):S58–S61.
39. Nkowane BM, Wassilak SG, McKee PA, O’Mara DJ, Dellaportas G, Istre GR, et al. Pertussis epidemic
in Oklahoma: difficulties in preventing transmission. American Journal of Diseases of Children. 1986;
140(5):433–437. https://doi.org/10.1001/archpedi.1986.02140190043021 PMID: 3962936
40. Nguyen VK, Parra-Rojas C, Hernandez-Vargas EA. The 2017 plague outbreak in Madagascar: Data
descriptions and epidemic modelling. Epidemics. 2018; 25:20–25. https://doi.org/10.1016/j.epidem.
2018.05.001 PMID: 29866421
41. Migliani R, Chanteau S, Rahalison L, Ratsitorahina M, Boutin JP, Ratsifasoamanana L, et al. Epidemio-
logical trends for human plague in Madagascar during the second half of the 20th century: a survey of
20900 notified cases. Tropical Medicine & International Health. 2006; 11(8):1228–1237. https://doi.org/
10.1111/j.1365-3156.2006.01677.x PMID: 16903886
42. Wearing HJ, Rohani P. Ecological and immunological determinants of dengue epidemics. Proceedings
of the National Academy of Sciences of the United States of America. 2006; 103:11802–11807. https://
doi.org/10.1073/pnas.0602960103 PMID: 16868086
43. Reich NG, Shrestha S, King AA, Rohani P, Lessler J, Kalayanarooj S, et al. Interactions between sero-
types of dengue highlight epidemiological impact of cross-immunity. Journal of The Royal Society Inter-
face. 2013; 10(86):20130414.
44. Graham M, Winter AK, Ferrari M, Grenfell B, Moss WJ, Azman AS, et al. Measles and the canonical
path to elimination. Science. 2019; 364(6440):584–587. https://doi.org/10.1126/science.aau6299
PMID: 31073065
45. Donaldson EF, Lindesmith LC, LoBue AD, Baric RS. Viral shape-shifting: norovirus evasion of the
human immune system. Nature Reviews Microbiology. 2010; 8:231–241. https://doi.org/10.1038/
nrmicro2296 PMID: 20125087
46. Russell CA, Fonville JM, Brown AEX, Burke DF, Smith DL, James SL, et al. The Potential for Respira-
tory Droplet–Transmissible A/H5N1 Influenza Virus to Evolve in a Mammalian Host. Science. 2012; 336
(6088):1541–1547. https://doi.org/10.1126/science.1222526 PMID: 22723414
47. Anderson RM, May RM. Infectious Diseases of Humans: Dynamics and Control. Oxford: Oxford Uni-
versity Press; 1992.
48. Gibson MA, Bruck J. Efficient exact stochastic simulation of chemical systems with many species and
many channels. The Journal of Physical Chemistry A. 2000; 104(9):1876–1889.
49. Friedman J, Hastie T, Tibshirani R. The Elements of Statistical Learning. New York: Springer Science
& Business Media; 2001.
50. Martinez-Bakker M, King AA, Rohani P. Unraveling the transmission ecology of polio. PLoS Biol. 2015;
13(6):e1002172. https://doi.org/10.1371/journal.pbio.1002172 PMID: 26090784
51. Brett TS. Dynamical footprints enable detection of disease emergence [cited Mar 17 2020]. https://doi.
org/10.5281/zenodo.3713381.
PLOS BIOLOGY Dynamical footprints enable detection of disease emergence
PLOS Biology | https://doi.org/10.1371/journal.pbio.3000697 May 20, 2020 20 / 20