dynamic wireless charging of electric vehicles on the...
TRANSCRIPT

Dynamic wireless charging of electric vehicles onthe move with Mobile Energy Disseminators
Leandros A. MaglarasSchool of Computer Science and Informatics
De Montfort University, Leicester, UK
Jianmin JiangDepartment of Computing
University of Surrey, Guilford, UK
Athanasios Maglaras Electrical Engineering Department T.E.I. of Thessaly, Larissa, Greece
Frangiskos V. TopalisElectrical and Computer Engineering Department
N.T.U.A., Athens, Greece
Sotiris Moschoyiannis Department of Computing University
of Surrey, Guilford, UK
Abstract—Dynamic wireless charging of electric vehicles (EVs)is becoming a preferred method since it enables power exchangebetween the vehicle and the grid while the vehicle is moving.In this article, we present mobile energy disseminators (MED),a new concept, that can facilitate EVs to extend their range ina typical urban scenario. Our proposed method exploits Inter-Vehicle (IVC) communications in order to eco-route electricvehicles taking advantage of the existence of MEDs. Combiningmodern communications between vehicles and state of the arttechnologies on energy transfer, vehicles can extend their traveltime without the need for large batteries or extremely costlyinfrastructure. Furthermore, by applying intelligent decisionmechanisms we can further improve the performance of themethod.
Index Terms—Electric vehicle; Dynamic Wireless Charging;IVC; Cooperative Mechanisms
I. INTRODUCTION
With regards to the future transport arena, electric vehicles(EVs) are considered as the likely replacement of internalcombustion engine driven vehicles, especially given the CO2
reduction and alternative energy perspectives. Electric carshave the potential to reduce carbon emissions, local air pol-lution and the reliance on imported oil [1]. In Europe, theEuropean commission aims to reduce road transport emissionsby 70% by 2050 [2]. Taking into account the fact that roadtransport is expected to double by 2050, passenger cars needto reduce their emissions significantly. Advanced internalcombustion engine (ICE) technologies are expected to enableemissions reduction, but are not expected to meet long termtargets. Electric vehicles, especially plug-in ones (PEVS), arepenetrating the market and they are currently counted as zeroemissions vehicles. Apart from the additional cost of theirlithium-ion battery pack that makes them more expensive thanconventional vehicles, there are also some other factors thatdiscourage drivers from switching to an EV. For instance,electric battery vehicles have a limited driving distance [3]and hence, the current lack of charging infrastructure as wellas the total time needed to recharge such a vehicle add to theirlack of desirability.
II. MOTIVATION : INCREASING A CAR’S ALL-ELECTRICRANGE
In order to surmount this problem, industries and researchinstitutions around the world have proposed numerous solu-tions. These vary from stationary stations that are scatteredacross the road network in central positions [4], [5], [6],dynamic wireless charging methods that take advantage of themobility of nodes [7], [8] and eco-routing algorithms that runin isolation in every vehicle or in a central way for a fleet ofvehicles [9], [10], [11]. Dynamic wireless charging is gainingmore ground, since it enables power exchange between thevehicle and the grid while the vehicle is moving. Installedinfrastructure can be utilized very effectively because manyvehicles use the same road segments that are ”equipped”with dynamic charging capabilities. Dynamic charging cantake place in a parking lot, at a bus stop during passengerdisembarkation, along a highway or near traffic lights.
A. Wired charging
Electric vehicles are plugged for charging on the existingelectrical grid infrastructure, but sometimes the electrical in-frastructure is inadequate for supporting this additional energydemand of high power fast charging stations. Moreover, thepresence of several concurrent charging requests could causeoverload conditions in local nodes of the grid, if the chargingprocesses of the PEVs are not properly managed and sched-uled. One alternative to fast charging stations [4] is to havemobile charging systems (MCSs)with a high storage Capacityand a mobile charging system for electric vehicles is presentedin [12]. These stations can be a solution when the electricalinfrastructure of the local grid is unable to support high powerfast charging stations.
Smart scheduling strategies can be profitably used to man-age the (PEV) charging problem [5], for based on quadraticprogramming for charging PEVs, these can decrease the peakload and flatten the overall load profile. The usage of In-formation and Communication Technology (ICT) in a smartgrid environment is a proposed solution [13], [14]. Regarding
(IJACSA) International Journal of Advanced Computer Science and Applications, Vol. 6, No. 6, 2015
239 | P a g ewww.ijacsa.thesai.org

which, the authors in [15] advocate the deployment of smartgrid communication architectures by using small embeddedsystems in a hierarchical way or a manner that can enable thedistribution grid to charge a large number of EVs without theneed to carry a high workload.
B. Dynamic wireless charging
Dynamic wireless charging is gaining more ground, sinceit enables power exchange between the vehicle and the gridwhile the vehicle is moving.
Recently, the Telewatt project introduced an original ap-proach involving the reusing of existing public lighting in-frastructures for such charging, whereby a fraction of thepower not consumed by lamps at night can be used for thebenefit of the charging stations. The service is accessibleby a smartphone application, where clients specify to theTeleWatt server their destination and their battery level, forwhich they receive a response of a list of available chargingterminals close to this destination [6]. Hevo announced anovel dynamic charging system where manhole covers willbe used as charging stations and a pilot program is scheduledto be performed in New York in 2014. Two Online ElectricVehicle (OLEV) buses that can charge during travel have beenput into service for the first time in the world on normalroads in the city of Gumi - Korea by the Korea AdvancedInstitute of Science and Technology (KAIST) [7]. The poweris transmitted through magnetic fields embedded in the roads.That is, it comes from the electrical cables buried under thesurface of the road, thus creating these magnetic fields andthe length of power strips installed is generally 5%-15% ofthe entire road. In [16] the authors present a method forpower transfer between electric vehicles, where drivers ”share”charge with each other using the inductive power transfer(IPT) of the charge between vehicles at rendezvous points.However, one major issue with this concept is the technologyrequirements that have to be met by passenger vehicles inorder for this solution to be feasible. Moreover, the dynamiccharging of vehicles raises health issues related to the leakingmagnetic flux from IPT.
C. The charging station location problem
Thoughtful siting of public charging stations can ease con-sumer range anxiety while offering a lower cost approach tointegrating EVs into the transportation market. The authors in[17] propose a method to anticipate parking demands and moreefficiently to locate EV charging infrastructure in new settingsand/or subject to different constraints. The researchers in [18]used Lisbon, Portugal, as a case study where they determinednot just the locations to be installed, but also their capacityof at each location, with the aim of optimizing the demandcovered within an acceptable level of service. In [11], theauthors try to build a comprehensive objective function takinginto account geographic information, construction cost andrunning cost in order to achieve optimal planning of chargingstations. In [19] an electric vehicle battery swapping station isdescribed as well as a business case scenario provided where
customers have access to the stations such that they can meettheir motion energy requirements by swapping batteries forcharged ones quite quickly.
D. Eco-routing of EVs
Similar to eco-routing for conventional vehicles, novelmethods are being developed and used in order to reduce theenergy consumption of EVs [9], [20]. The authors in [9] havedeveloped an eco-routing navigation system, which determinesthe most eco-friendly route between a trip’s origin and itsdestination. With the use of a Dynamic Roadway Networkdatabase that integrates historical and real time data theymanaged to reduce CO2 emissions. Based on their previouswork they now aim to create an eco-routing algorithm thatwill be incorporated into a prototype eco-routing navigationsystem forEVs. In [20], they moved a step further by creatinga routing system that could extend the driving range of EVsby calculating the minimum energy route to a destination.
E. Contributions
The present article develops a cooperative mechanism fordynamic wireless charging of electric vehicles and makes thefollowing contributions:• The concept of mobile energy disseminators is introduced• A cooperative mechanism based on inter-vehicular com-
munications (IVC) and long term evolution (LTE) com-munication is proposed
• A route optimization problem for every electric vehicleis formulated
• The proposed mechanism is evaluated through extensivesimulations
The rest of this paper is organized as follows: Section IIIdescribes the concept of mobile energy disseminators (MED)and in Section IV the communication mechanisms are pre-sented. In Section V the optimization problem is formulated,whilst Section VI presents the simulation environment Andthe results. Section VII concludes the article.
III. MOBILE ENERGY DISSEMINATORS
Energy exchange can be facilitated by inductive powertransfer (IPT) between vehicles and/or by installing a roadsideinfrastructure unit for wireless charging. However, given thevast expanse of road networks, it is impractical to haveinfrastructure units on every road segment due to prohibitivecosts. IPT allows efficient and real-time energy exchangewhere vehicles can play an active role in the energy exchangeprocedure. On the other hand, the use of mobile nodes as relaynodes is common in vehicular ad hoc networks (VANETs). Ina VANET mobile relay nodes can serve as carriers and dis-seminators of useful information. Influential spreaders, nodesthat can disseminate the information to a large part of thenetwork effectively, are an open issue in ad hoc networks.That is, nodes with predefined or repeating routes that cancover a wide range of a city region can do the work of roadsideunits while exploiting their mobility in order to provide higherquality-of-service (QoS).
(IJACSA) International Journal of Advanced Computer Science and Applications, Vol. 6, No. 6, 2015
240 | P a g ewww.ijacsa.thesai.org

Fig. 1. Electromagnetic induction transfer
Similar to information dissemination, special nodes, likebuses (trucks), can act as energy sources to EVs that needcharging, in order to increase travel time. These vehicles,form now on called mobile energy disseminators (MEDs), useelectric plug in connection or IPT in order to refill starvingEVs. Buses can play the role of MEDs since they followpredefined scheduled routes and their paths cover a major partof a city, while trucks could have the role of energy chargersmainly on highways. Buses can be fully charged when parked,before beginning their scheduled trip, and can be continuouslycharged along their journey by IPT stations installed at busstops. Additional technology requirements that these vehiclesmay need in order to operate as energy sources, is an openissue, but it is rather more feasible in the near future, tohave these features installed into large public vehicles thaninto passenger vehicles due to the additional cost and spacerequirements. Vehicles that book charging places on the sameMED can create clusters and mobile charging stations willplay the role of the clusterheads.
The vehicle requiring electric charge will approach theappropriate truck, after a preceding agreement, from the rearor the front end depending on the vehicle construction. Theprocedure will provide vehicle charging by an electric plug inconnection (or process), or by electromagnetic induction withthe use of Tesla coils. Immobilized charging can take place atpredetermined road points (for example parking areas) in orderto avoid traffic obstruction and in this case the method of theplug in electric connection is preferable. A synchronizationof the vehicles’ movement will be executed via wirelesscommunication mainly controlled by the truck/bus. From theanalysis undertaken, it is apparent that it is preferable, forreasons of safety and better management of the system, thatthe vehicle needing charge should move ahead or behind thetruck creating a cluster [21], [22] or platoon [23]. There will bea special joint magnetic arrangement concerning the vehicles,as well as a special interlocking arrangement in order forthe two vehicles to approach and remain in contact, evenwhile in motion, for as long as the charge transfer takesplace. Charge transfer can be achieved with electric plug inconnection, or by electromagnetic induction. During the lattertransfer, the charge and consequently the power transfer willbe accomplished with the use of two detached subsystems ofmagnetic coupling of high efficiency.
The electromagnetic subsystems will include magnetic coils,
which will cooperate and function like the primary and thesecondary coils of a transformer, which will have loose cou-pling using air as the proper medium. This way of coupling(like Tesla coils) has proven to be more efficient than usingferromagnetic materials. The primary coil of the truck willbe movable and able to be inserted in the bigger diametercoil of the vehicle, in order to improve the efficiency factorof the power transfer process and to minimize the leakingof magnetic flux. Moreover, the two subsystems will bespecially shielded (Faraday cage) in order to protect occupantsand bystander vehicles or pedestrians from electromagneticradiation. The truck/bus will carry high capacity batteries andif needed, the appropriate electric system to convert voltagefrom DC to AC voltage of high frequency. It will also needto carry a conventional internal combustion engine in additionto the correct electric generator, to be used to produce electricenergy in an emergency situation.
The advantages of the proposed system are a) high effi-ciency factor (especially when the charge transfer is achievedvia an electrical plug in connection) b) very short delayregarding the moving of the vehicles c) significant reductionof environmental pollution and d) coverage of special needsin exceptional climatic conditions or failure conditions.
IV. COOPERATIVE MECHANISMS
By using cooperative mechanisms, based on dedicatedshort-range communication (DSRC) capabilities of vehiclesor long term evolution (LTE) technology, vehicles search forthe MEDs in range and arrange a charging appointment whilemoving [8]. In the following section, we present a cooperativemechanism, based on the(DSRC) and LTE capabilities ofvehicles. A network G = (N,L), where N is the set of nodes(intersections) and L is the set of links (road segments), isconsidered. V is the set of electric vehicles that move in thenetwork and M is the subset of electric vehicles that can actas mobile charging stations.
A. IVC system
In order to state its presence, each MED periodicallybroadcasts cooperative awareness messages (CAM). Each bea-con message consists of a node identifier (Vid), node location,scheduled trip (a subset of set L), current charging capability(CC) and energy value (E/KWh). CC is the current energythat the mobile charging station can afford to dispose of tocharge the vehicle without jeopardizing its own needs. Thesemessages are disseminated by all vehicles that act as relaynodes.
Each EV that needs energy, upon receiving a CAM by anMED performs the following steps:
1) Checks whether MED is on his route or not accordingto their current positions and destinations
2) Checks whether the CC level is high enough in orderto cover its energy needs
3) Asks for a charging place by sending a CAM whichcontains minimum charging time
(IJACSA) International Journal of Advanced Computer Science and Applications, Vol. 6, No. 6, 2015
241 | P a g ewww.ijacsa.thesai.org

Fig. 2. Application example of a mobile energy disseminator: A. Contactlesscharging is used to deliver charging to a bus B. V2V communication betweenMED and EV C. EV recharges from the bus using IPT
4) Chooses to select this bus as the wireless energy transferstation
5) Books a charging place6) Drives in front of or behind the bus for the determined
time period in order to rechargeSteps 3-5 constitute the negotiation phase, in which MEDand EV exchange dedicated short range messages (DSRC)in order to confirm the energy transfer. An assumption thatwe make is that vehicles can book their charge of battery assoon as they realize that their charge level is low and a MEDmeets their criteria on relative distance and available energy.The architecture of the proposed mobile energy disseminationis demonstrated in Figure 2.
B. LTE system
For the LTE system, we assume that vehicles are equippedwith The Evolved Universal Terrestrial Radio Access Network(EUTRAN ) interface, which enables the vehicles to commu-nicate with the eNB so as to access the core componentsof the LTE. LTE Evolved Node B (eNB) base stationtransceivers are deployed alongside the road network in orderto cover the area. Each bus communicates to the LTE thescheduled trip that is going to be followed, the available
Fig. 3. Application example of Mobile Energy Disseminator: A. Contactlesscharging is used to deliver charging to a bus B. LTE communication betweenMED and EV C. Electric vehicle recharges from the bus with inductivepower transfer (IPT )
charging capability and energy value and charging availability,similar to the IV C system. All vehicles are assumed to beequipped with GPS.
Each EV that needs energy:1) Checks whether MED is on his route or not according
to their current positions and destinations2) Checks whether the CC level is high enough in order
to cover its energy needs3) Checks whether the MED is already fully booked4) Books a charging place5) Drives along the bus for the determined time in order to
rechargeThe architecture of the proposed mobile energy dissemi-
nation architecture is demonstrated in Figure 3. The benefitsof such an approach are threefold: First, it utilizes existingcellular infrastructure. Second, the 802.11pnetwork overheadintroduced by frequent communication between EV s and
(IJACSA) International Journal of Advanced Computer Science and Applications, Vol. 6, No. 6, 2015
242 | P a g ewww.ijacsa.thesai.org

Fig. 4. Optimum path selection based on a) Distance (Route 3), b) Time(Route 1)
MEDs is offloaded. Third, information is more up to datethan that received through IV C, where many intermediaterelay nodes may be needed in order to disseminate dataeffectively. However, vehicles are required to have two typesof network interface cards. Moreover packets that pass throughthe LTE core potentially experience more delay.
Route selection algorithms, where vehicles communicatewith each other in order to exchange information are crucial inorder to evaluate the performance of the method. Optimal routeselection overcomes a common problem in which all vehiclesare preferring the same paths, leading to over congestion.Optimal routing of vehicles that use this new technology canbe formulated as a modified shortest-path problem where theweights of the road segments may vary over time, accordingto the existence or not of a MED traveling on the road segment[24].
V. FORMULATION OF THE METHOD
Vehicle routing aims at identifying a feasible route thatsatisfies metrics constraints. These metrics are associated withmultiple parameters which can include delay, distance andenergy cost. Mathematical formulation of vehicle routing isintrinsically the restricted shortest path problem (RSP). Inorder to test the performance of the method we solve an opti-mization problem where an objective function that combinestime, distance and power is used in order to make the bestroute selection. The optimization problem is solved in isolationfor each vehicle based on whether the road segments includeMEDs, the additional distance that the vehicles have to traveland the predicted travel time to the destination. A simple graphis shown in Figure 4, where a vehicle has to choose betweenfour routes, one containing a MED and three one of whichbeing the shortest path in terms of distance
The optimization problem for each vehicle i is formulated:
min∑jk
Wijk, where Wijk = F (Eijk, Tijk, Dijk) (1)
s.t. ∑jk
Tijk ≤ Tth (2)
∑jk
Dijk ≤ Dth (3)
∑jk
Eijk ≤ Eo + Eind (4)
where, Wijk is the weight assigned to each road segmentjk of the route of vehicle i. Eij is the energy that is beingconsumed on road segment jk, Eo is the initial energy ofvehicle and Eind is the induced energy to the vehicle i.Constraints (2) and (3) are used in order to avoid sendingall vehicles from routes that are too long, which would leadto excessive cost in terms of time and distance of the trip.Tth,Dth are parameters that give the upper limit of the overalltime and the distance that a vehicle can spend in order to reachits destination. The energy cost of every road segment can beexpressed as a proportion of the mean velocity. The velocity isthe quotient of the distance of the road segment and the timethat the vehicle will need to spend on this segment, on average.The two forces that oppose the motion of an automobile arerolling friction, Froll and air resistance,Fair.
Froll = µτ ∗m ∗ g, Fair =1
2A ∗ C ∗ p ∗ u2 (5)
where, m is the mass of the car in Kg, g = 9.8m/s2, u isthe mean velocity in m/s and µτ is the rolling resistancecoefficient. C is a dimensionless constant called the dragcoefficient that depends on the shape of the moving body, A isthe silhouette area of the car (m2) and p is the density of theair (about 1.2 kg/m3 at sea level at ordinary temperatures).Typical values of C for cars range from 0.35 to 0.50.
In constant-speed driving on a level road, the sum of Frolland Fair must be just balanced by the forward force suppliedby the drive wheels. The power that a vehicle needs whentraveling with a steady speed is given by Equation 6.
P = η ∗ FForward ∗ u = η(Froll + Fair) ∗ u (6)
,η is the efficiency factor of the system.The energy cost of vehicle i for traveling in road segment
(j), Eij , is calculated by Equation 7.
Eij = P ∗ Tijk (7)
If the road segment belongs to the path of a MED, thenthe vehicle can increase its energy by induction. The amountof the induced energy is proportional to the total time that theEV and the MED will stay connected. This time dependson the meeting point between the vehicle and the MED inrelation to the total road segment length and the availabilityof the MED. In order to represent the induced energy to theelectric vehicle Equation 7 is rewritten:
(IJACSA) International Journal of Advanced Computer Science and Applications, Vol. 6, No. 6, 2015
243 | P a g ewww.ijacsa.thesai.org

Fig. 5. Optimum path selection based on energy (Route 4)
Eijk = P ∗ Tijk − Eind (8)
where, Eind is given by:
Eind = tcont ∗ Cind ∗ Pind (9)
Cind is the induction coefficient and tcont the time of con-tact between the MED and the EV . Pind is the power of theMED. We ignore acceleration and deceleration phenomena.The edge parameters for the example network of Figure 4 areshown in Table I. The mean energy induced from a MEDto a vehicle is calculated according to Equation 9 and thehypothesis that all vehicles that traverse the right part of thegraph can be in contact with the MED throughout the timethat it takes in order to traverse each road segment. Time ofcontact between the MED and EV is calculated accordingto the length of the road segment Djk and the velocity of theMED, umed (See Equation 10).
tcond =∑jk∈P ′
Djk
umed(10)
Where, P ′ is the path that MED and EV share, and it isconstituted by individual road segments.
For the simulated scenario presented in Figures 4 and 5,Table I presents edge parameters. By comparing columnsof time, distance and energy cost, it is obvious that theoverall cost of each road segment is different according tothe evaluation metric used. In the table, the optimum routefor every single parameter (time, distance and energy) ishighlighted and it is obvious that for the trip from node 1to node 9 the optimal route in terms of energy consumption,without the existence of a MED, is Route 3 (Nodes: 1, 6,
TABLE ICALCULATION OF DISTANCE, TIME AND ENERGY COST FOR EVERY ROAD
SEGMENT AND ROUTE
Road Dist Time Vel E cost E ind Total EID (Km) (min) (Km/h) (kWh) (kWh) (kWh)12 8 17 28.24 1.315 0.00 1.31524 8 24 20.00 1.315 1.200 0.11416 20 67 17.91 3.286 0.000 3.28623 12 17 42.35 1.972 0.000 1.97237 12 17 42.35 1.972 0.000 1.97245 12 33 21.82 1.972 1.800 0.17258 16 33 29.09 2.629 1.200 1.42967 12 25 28.00 1.972 0.000 1.97268 8 30 16.00 1.314 0.000 1.31479 4 17 14.12 0.657 0.000 0.65789 6 33 10.91 0.986 0.000 0.986
Route1 36 68 5.920 5.9202 36 109 5.920 5.9203 34 130 5.587 5.5874 42 123 6.920 4.200 2.702
8, 9). In the presence of a MED that travels road segments(1,4), (45) and part of road segment (58) the energy cost ofRoute 4 (Nodes: 1, 4, 5, 8, 9) decreases, thus making it theoptimal route
The objective function can be any combination of the pa-rameters time, distance and energy. Using a linear combinationwith different weights (wi) per parameter (see Equation 11)is a solution that produces satisfactory outcomes and canbe tuned in order to favour time, distance, energy or anycombination of the parameters, according to the preferencesof the driver.
Wijk = w1 ∗ |Eijk|+ w2 ∗ |Tijk|+ w3 ∗ |Dijk| (11)
The road segments that comprise the routes that each vehiclecan follow are:• Route 1: Nodes (1, 2, 3, 7, 9)• Route 2: Nodes (1, 6, 7, 9)• Route 3: Nodes (1, 6, 8, 9)• Route 4: Nodes (1, 4, 5, 8, 9)
VI. METHOD EVALUATION
In order to evaluate the effect of the routing method tothe EV total range we conducted simulations where vehiclesare injected into the road network. Vehicles choose their pathaccording to distance, time and energy cost. In addition, thevehicles entering the system have initial energy according toa uniform distribution and the energy of each is measuredwhen it reaches node 9 (exit node). All nodes are equippedwith GPS receivers and On Board Units (OBU) and thelocation information of all vehicles/nodes, needed for theclustering algorithm, is collected with the help of the receivers.The only communications paths available are via the ad-hocnetwork and there is no other communication infrastructure.The power of the antenna is Ptx = 18dBm and the communi-cation frequency f is 5.9 Ghz. In our simulations, we use aminimum sensitivity (Pth) of -69 dBm to -85 db, which givesa transmission range of 130 to 300 meters.
(IJACSA) International Journal of Advanced Computer Science and Applications, Vol. 6, No. 6, 2015
244 | P a g ewww.ijacsa.thesai.org

TABLE IIMINIMUM SENSITIVITY IN RECEIVER ANTENNA ACCORDING TO DATA
RATE.
Data Rate (Mb/sec) Minimum Sensitivity(dBm)3 -854.5 -846 -829 -8012 -7718 -7024 -6927 -67
TABLE IIISIMULATION PARAMETERS
Independent parameter Range of values Default valueNumber of MEDs 1-2 1Number of vehicles 50-100 100
Initialenergy 4-24 kW 24 kWMED capacity 1-2 2
Cind 0.7-0.8 0.8Pind 20-50 kW 40 kWη 0.7-0.8 0.8Eth 6 -10 kW 6 kW
V ehicle rate(eh/min) 1/5 - 1/15 1/5Parameters w1, w2, w3 0-1 1/3
The arrival rate of the vehicles follows the Poison processwith parameter λ and the speed assigned to them is associatedwith the speed limit of each road segment. The range of valuesis given in Table III. Each MED moves in circles representingthe path that a bus follows during a day in the city and eachvehicle in need of energy sends its query using a broadcastmode. Each MED that receives the query replies with itsavailability according to the procedure described in subsectionIV-A. In the case where a vehicle receives more than one replyfrom different MEDs, it decides which to choose accordingto the objective function 11 and the values of the weightswi. Each MED stores the received applications and finaldecisions from the EVs along with the unique ID that eachvehicle has.
In the upcoming subsections, each figure represent a snap-shot of a simulated scenario except for figures 11, 17, 18 and19 as well as tables IV and VI, where the mean values of theoutcomes of 100 different simulations are represented.
A. Network with one MED
In the first evaluation scenario, we simulate the networkof Figure 5, where only one MED exists. Vehicles decideto follow the energy efficient, time efficient or the distanceefficient path (shortest path), according to the policy of thedriver. Based on this policy, the weights w1, w2, w3 assignedto time, distance and energy are different and the vehiclesfollow different paths.
The induced energy to the vehicles that traverse roadsegments (12, 45, and 58) is given by Equation 9. It is worthmentioning that in all the simulated scenarios the vehicles
wait at the beginning of the road segment until the MEDapproaches the intersection so as to achieve maximum contacttime. Therefore, the vehicles choose to wait for the MED toarrive even if it is not near and once in contact accept a longerpath as necessary. This behaviour may lead to some vehicleshaving additional energy consumption, due to longer trip interms of time. Moreover, this situation, where vehicles wait inthe beginning of the area when a MED is moving, inducesadditional parameters in the routing algorithm, e.g. waitingcost that is translated into additional energy cost, time costand additional total load in the network due to stationary cars.In the simulation environment MEDs have the capability ofcharging up to two vehicles simultaneously and they ignoreany incoming calls for charging when they are fully booked.The simulation parameters are given in Table III.
1) Energy efficient scenario: In this case, each vehicle Vithat enters the simulation area, decides upon the optimal routebased on an energy threshold, which can be derived fromEquation 4. If initial energy is below 6kW, which is themaximum amount needed in order to reach the destination(node 9), the vehicle asks the MED for an empty inductionslot, which has two places of charging. If it has an emptyslot then Vi books it and waits for the MED to reach node1 in order to begin recharging (Route 4). In the case wherethe initial energy of the vehicle is above threshold or no freecharging place exists, it chooses to follow the shortest path interms of distance (Route 3). Each MED is driving on a ringroad which consists of road segments (14), (45), part of roadsegment (58) and other roads out of our simulation area of thesame distance. The MED is driving at a velocity that is 90%of the maximum for the road segment, whilst the EVs travel at100% of the allowed speed limit. When a vehicle Vi follows aMED for recharging its velocity drops to the latter’s velocity.
In Figure 6, we observe the energy consumption of eachvehicle during its travel in the simulation area. Vehicles enterthe simulation area with a random initial energy between 4 and24kW. Vehicles with low initial energy, book a free chargingplace on the MED and manage to lower the consumed energyin the area.
Vehicles that choose to recharge during their travel in thesimulation area need to wait for the MED to reach node 1.Bearing in mind that MED is following a different route, whichincludes road segments outside of the simulated area, and thecurrent position of the MED at the time that the bookingapplication happens, the vehicle calculates the waiting timeand decides whether to wait or not for the MED. In thisscenario vehicles do not have any time threshold, and wait nomatter how long the time may be, as long as the MED has afree charging place. This additional waiting time is representedin Figure 7.
When a vehicle Vi follows the MED in order to recharge,in addition to more time this choice leads to a greater distancehaving to be traveled. This additional distance is representedin Figure 8.
2) Impact of the time threshold: In this scenario, vehicleswith energy below the threshold (6 kW) decide to recharge only
(IJACSA) International Journal of Advanced Computer Science and Applications, Vol. 6, No. 6, 2015
245 | P a g ewww.ijacsa.thesai.org

Fig. 6. Energy consumption of Vehicles
Fig. 7. Travel time of vehicles
Fig. 8. Distance covered by every vehicle in the simulation scenario
Fig. 9. Energy consumption of vehicles with time threshold
if this procedure is not going to induce too much additionaltravel time and in order to achieve this, every has its ownmaximum wait time for the MED. When recharge is needed,a vehicle calculates the required wait time and if total traveltime does not exceed the time threshold then it chooses torecharge (Route 4). Conversely, if the total travel time exceedsthe time threshold, the vehicle decides to follow the shortestpath in terms of distance (Route 3) and the effects of thispolicy on energy are depicted in Figure 9. In the simulationsconducted the time threshold is assigned a value that is thesame as the time that a MED needs in order to perform acircle. It is assured that each vehicle waits for the MED tocomplete at most one circle until it reaches the initial point ofcharge (Node 1). In the case when the approaching MED hasno empty charging spot, the vehicles do not wait for anothercircle to be completed and follow the shortest path and it isassumed that they find a stationary charging spot along theirway in order to refill.
3) Impact of E threshold: Increasing the energy thresholdcauses an increase in the demands for recharging from starvingvehicles. Since MED has a limited capacity (in this experi-ment the capacity of the MED has the default value 2), largeenergy thresholds will not have any positive effects on theoverall performance of the system. Vehicles will either needto wait for longer times or will not be able to find a freecharging place (Figures 10, 11). If a MED has an emptyslot, then Vi books it and waits for the former to reach node1 in order to begin recharging (Route 4). In the case that theinitial energy of vehicle is above threshold or no free chargingplace exists, it chooses to follow the shortest path in terms ofdistance (Route 3).
We can observe in 10, that vehicle 25 enters the area withlow energy, but since no free charging place is available onthe MED it runs out of power and the same happens withvehicles 65, 73 and 88. Increasing the threshold but keepingthe number of charging places to the default value of 2, whichis the feasible scenario, the number of vehicles that can beserved does not increase. At the same time, vehicles with no
(IJACSA) International Journal of Advanced Computer Science and Applications, Vol. 6, No. 6, 2015
246 | P a g ewww.ijacsa.thesai.org

Fig. 10. Energy consumption of vehicles. MED with 2 charging places,Energy threshold 6kW
Fig. 11. An increase in the energy threshold leads to more requests forcharging and since MEDs capacity is limited most requests are declined.
immediate need for energy may occupy a charging place, thusleaving out vehicles that are starving (Figure 11).
4) Impact on the vehicles’ total range: The initial purposeof the method is to increase the mean total range of electricvehicles. Based on the above scenarios, we can deduce thatsince the energy of starving vehicles is protected the meantotal range of every vehicle of the investigated system willalso increase. In order to visualize this effect, we extract theremaining energy of all the vehicles after they reach node 9and compare it with that rmaining if they all followed theshortest or the fastest path.
In Figure 12, we present the remaining energy of everyvehicle after reaching node 9 and it can be seen that onlyone runs out of energy before reaching its destination, whenusing the energy optimal efficient scenario. That is, this vehicledoes not manage to find an empty place for charging on theMED and the initial energy that it had was not sufficientfor it to reach its destination. In the shortest path and fastesttime scenarios the number of vehicles that run out of energy
Fig. 12. Remaining energy of vehicles when reaching destination node 9
TABLE IVEVALUATION OF PERFORMANCE BASED ON REMAINING ENERGY E OF
VEHICLES AFTER HAVING REACHED TARGET NODE 9.
Method No of Vehicles with Mean Eout Additionalwith Eout < 0 kWh range %
Energy path 1 10.096Shortest path 4 9.072 -11.3 %Fastest path 9 7.044 -43.3 %
and have to stop before reaching the final destination is givenin Table IV. The same table also shows the mean value ofthe remaining energy. It is evident that the energy efficientscenario, based on the use of MEDs, gives better outcomesand balances the consumed energy of the vehicles.
Based on the remaining energy, we can easily find thetotal additional range that each vehicle can travel and in fact,MEDs manage to increase the total range of each vehicle ina typical urban scenario by as much as 43.3
B. Network with two MEDS
In the second evaluation scenario the network we use isthe one from Figure 13. The graph includes a second MEDthat induces further added distance to a vehicle that choosesto follow it. Vehicles decide to follow the energy efficient,the time efficient or the distance efficient path (shortest path)according to the policy of the driver.
The new added route 5 comprises the nodes (1,2,10,11,7,9).1) Energy efficient path: If the initial energy of a vehicle is
below 6kW, which is the maximum amount of energy neededin order to reach its destination, it asks both MEDs for anempty energy induction slot. Each MED has two places forcharging. If one has an empty slot, then Vi books this slotand waits for the MED to reach the closest node in order tobegin recharging (Route 4 or Route 5). In case that the initialenergy of vehicle is above threshold or no free charging placeexists, vehicle chooses to follow the shortest path in terms ofdistance (Route 3).
In Figure 14, we observe the energy consumption of eachvehicle during its travel in the simulation area. Vehicles enter
(IJACSA) International Journal of Advanced Computer Science and Applications, Vol. 6, No. 6, 2015
247 | P a g ewww.ijacsa.thesai.org
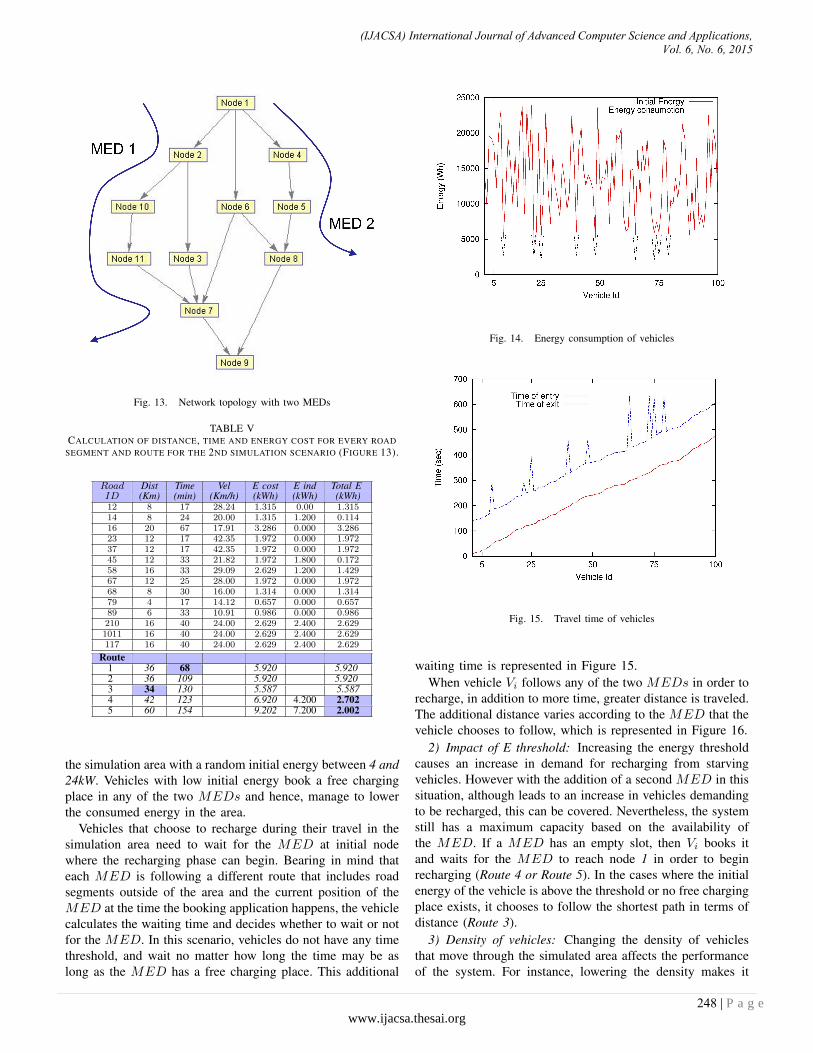
Fig. 13. Network topology with two MEDs
TABLE VCALCULATION OF DISTANCE, TIME AND ENERGY COST FOR EVERY ROAD
SEGMENT AND ROUTE FOR THE 2ND SIMULATION SCENARIO (FIGURE 13).
Road Dist Time Vel E cost E ind Total EID (Km) (min) (Km/h) (kWh) (kWh) (kWh)12 8 17 28.24 1.315 0.00 1.31514 8 24 20.00 1.315 1.200 0.11416 20 67 17.91 3.286 0.000 3.28623 12 17 42.35 1.972 0.000 1.97237 12 17 42.35 1.972 0.000 1.97245 12 33 21.82 1.972 1.800 0.17258 16 33 29.09 2.629 1.200 1.42967 12 25 28.00 1.972 0.000 1.97268 8 30 16.00 1.314 0.000 1.31479 4 17 14.12 0.657 0.000 0.65789 6 33 10.91 0.986 0.000 0.986210 16 40 24.00 2.629 2.400 2.6291011 16 40 24.00 2.629 2.400 2.629117 16 40 24.00 2.629 2.400 2.629
Route1 36 68 5.920 5.9202 36 109 5.920 5.9203 34 130 5.587 5.5874 42 123 6.920 4.200 2.7025 60 154 9.202 7.200 2.002
the simulation area with a random initial energy between 4 and24kW. Vehicles with low initial energy book a free chargingplace in any of the two MEDs and hence, manage to lowerthe consumed energy in the area.
Vehicles that choose to recharge during their travel in thesimulation area need to wait for the MED at initial nodewhere the recharging phase can begin. Bearing in mind thateach MED is following a different route that includes roadsegments outside of the area and the current position of theMED at the time the booking application happens, the vehiclecalculates the waiting time and decides whether to wait or notfor the MED. In this scenario, vehicles do not have any timethreshold, and wait no matter how long the time may be aslong as the MED has a free charging place. This additional
Fig. 14. Energy consumption of vehicles
Fig. 15. Travel time of vehicles
waiting time is represented in Figure 15.When vehicle Vi follows any of the two MEDs in order to
recharge, in addition to more time, greater distance is traveled.The additional distance varies according to the MED that thevehicle chooses to follow, which is represented in Figure 16.
2) Impact of E threshold: Increasing the energy thresholdcauses an increase in demand for recharging from starvingvehicles. However with the addition of a second MED in thissituation, although leads to an increase in vehicles demandingto be recharged, this can be covered. Nevertheless, the systemstill has a maximum capacity based on the availability ofthe MED. If a MED has an empty slot, then Vi books itand waits for the MED to reach node 1 in order to beginrecharging (Route 4 or Route 5). In the cases where the initialenergy of the vehicle is above the threshold or no free chargingplace exists, it chooses to follow the shortest path in terms ofdistance (Route 3).
3) Density of vehicles: Changing the density of vehiclesthat move through the simulated area affects the performanceof the system. For instance, lowering the density makes it
(IJACSA) International Journal of Advanced Computer Science and Applications, Vol. 6, No. 6, 2015
248 | P a g ewww.ijacsa.thesai.org

Fig. 16. Distance covered by every vehicle in the 2nd simulation scenario
Fig. 17. System with 2 MEDs can serve an excessive number of requests
capable of dealing with more demands for charging and hence,efficiency of the system is better for such scenarios (see Figure18).
4) Impact on vehicles total range: In the shortest pathand fastest time scenarios the number of vehicles that runout of energy and have to stop before reaching the finaldestination is given in Table VI. In the same table, the meanvalue of the remaining energy is also shown. It is evident thatthe energy efficient scenario, based on the use of MEDs,gives better outcomes and balances the consumed energy ofvehicles. These values are calculated for the default values ofthe system (Eth =6W, Vehicle rate =1/5). Increasing the Eth,or lowering the rate that vehicles are injected into the system,the improvement in the remaining energy of the vehicles iseven greater.
C. Intelligent MEDs
An important aspect of cooperative mechanisms is increasedawareness about the conditions in the neighborhood of a ve-hicle. MEDs receive several charging requests from vehiclesand respond with regards to availability on a First Come −
Fig. 18. Vehicles density affects system performance
TABLE VIEVALUATION PERFORMANCE BASED ON REMAINING ENERGY E OF
VEHICLES WHEN REACHING THE TARGET NODE 9.
Method No of Vehicles with Mean Eout Additionalwith Eout < 0 kWh range %
Energy path 0 10.186Shortest path 4 9.07211 -11.8 %Fastest path 9 7.044 -44.03 %
First Served basis without taking into account the real needof the vehicle requesting a booked place. This may lead tosituations where vehicles with an immediate need for energyare unable to find a free booking place.
In order to cope with this problem, we modeled an enhancedmechanism where MEDs decide to serve incoming requestsbased on the estimated additional energy that the vehicle willneed in order to reach its destination. Vehicles, along withtheir request for energy, they also send the current energylevel and their final destination. MEDs, using GPS andinformation about traffic on roads, can calculate the additionalinduced energy that each vehicle will need in order to reachits destination. . Based on this information, each MED canassess the level of importance of the requests, and serve thosewith greatest need, while declining to assist those with noreal immediate requirements. The behaviour of the enhancedsystem is evaluated using the network with the two MEDs.All vehicles that send a request for recharging, also send infor-mation about their current energy level and final destination.With this information each MED decides whether to serveor decline the request.
In Figure 19, the impact of the cooperative mechanism onthe systems performance is represented. In order to depict thedifferences in systems performance we inject vehicles at alower rate (1/10) and we set Eth equal to 10kW. The systemnow receives more requests for charging, while on the sametime being able to meet most of them. The difference in thebehaviour between the stand-alone and the cooperative mecha-nism lies in the appropriate selection of requests to be serviced.
(IJACSA) International Journal of Advanced Computer Science and Applications, Vol. 6, No. 6, 2015
249 | P a g ewww.ijacsa.thesai.org

Fig. 19. Variance and standard deviation of parameter Ec
In order to represent this difference we calculate the mean andstandard deviation of parameter Ec, which is calculated usingEquation 12. The calculated metric represents the proportionof energy consumed to the initial energy of the vehicle. We canobserve from Figure 19 that with the cooperative mechanismboth mean value and standard deviation are decreased.
Ec =Energy consumption
Initial Energy(12)
VII. CONCLUSIONS
In this article, we have demonstrated how mobile energydisseminators (MED) can facilitate EVs to extend their rangein a typical urban scenario. Vehicles, based on several param-eters, like time, energy and distance choose to follow longerbut energy efficient paths. Making use of inductive chargingMEDs can act as mobile charging stations, thus improvingthe overall energy consumption of a fleet of vehicles. Thisimprovement comes with a cost in time and distance traveled,but starving vehicles otherwise would have to stop or makelonger re-routes in order to find a stationary station andrecharge their batteries. Combining modern communicationsbetween vehicles and state of the art technologies on energytransfer, vehicles can extend their travel time without theneed for large batteries or extremely costly infrastructure.Preliminary simulations show that applying some form ofintelligence in how MEDs take decisions about accepting orrejecting charging requests, further improves the performanceof the method.
Our proposed method exploits IV C communications inorder to eco-route electric vehicles taking advantage of theexistence of MEDs. In the future, more complex scenariosare going to be investigated where vehicles will have morecharging options to choose from, both stationary and mobile.The combined use of LTE and DSCR capabilities is alsogoing to be investigated, where vehicles will have the oppor-tunity to communicate with a fleet of MEDs and take moreappropriate decisions based on less local information.
REFERENCES
[1] T. R. Hawkins, B. Singh, G. Majeau-Bettez, and A. H. Strmman,“Comparative environmental life cycle assessment of conventional andelectric vehicles,” Journal of Industrial Ecology, vol. 17, no. 1.
[2] H. de Wilde and P. Kroon, “Policy options to reduce passenger cars co2emissions after 2020,” 2013.
[3] S. Lukic and Z. Pantic, “Cutting the cord: Static and dynamic inductivewireless charging of electric vehicles,” in Electrification Magazine, IEEE2013, vol. 1, no. 1. pp. 57-64.
[4] N. Machiels, N. Leemput, F. Geth, J. Van Roy, J. Buscher, and J. Driesen,“Design criteria for electric vehicle fast charge infrastructure based onflemish mobility behavior,” 2013.
[5] G. Putrus, P. Suwanapingkarl, D. Johnston, E. Bentley, and M. Narayana,“Impact of electric vehicles on power distribution networks,” in VehiclePower and Propulsion Conference, 2009. VPPC ’09. IEEE, 2009.
[6] A. R. Mario, A. A. Fadi, M. Gagnaire, and Y. Lascaux, “Telewatt: Aninnovative electric vehicle charging infrastructure over public lightingsystems,” in Proceedings of the 2nd International Conference on Con-nected Vehicles and Expo (ICCVE), Las Vegas, USA, December, 2013.
[7] G. Jung, B. Song, S. Shin, S. Lee, J. Shin, Y. Kim, C. Lee, and S. Jung,“Wireless charging system for on-line electric bus(oleb) with series-connected road-embedded segment,” in Environment and ElectricalEngineering (EEEIC), 2013 12th International Conference on, 2013.
[8] L. A. Maglaras, F. V. Topalis, and A. L. Maglaras, “Cooperativeapproaches for dymanic wireless charging of electric vehicles in a smartcity,” in Energy Conference (ENERGYCON), 2014 IEEE International,May 2014, pp. 1365–1369.
[9] K. Boriboonsomsin, M. J. Barth, W. Zhu, and A. Vu, “Eco-routingnavigation system based on multisource historical and real-time trafficinformation,” 2012.
[10] L. A. Maglaras, P. Basaras, and D. Katsaros, “Exploiting vehicularcommunications for reducing co2 emissions in urban environments,”in in proceedings of the IEEE International Conference on ConnectedVehicles (ICCVE 2013), Las Vegas, USA, December 2-6, 2013.
[11] L. Zi-fa, Z. Wei, J. Xing, and L. Ke, “Optimal planning of chargingstation for electric vehicle based on particle swarm optimization,” inInnovative Smart Grid Technologies - Asia (ISGT Asia), 2012.
[12] M. Badawy, N. Arafat, S. Anwar, A. Ahmed, Y. Sozer, and P. Yi, “Designand implementation of a 75 kw mobile charging system for electricvehicles,” in Energy Conversion Congress and Exposition (ECCE), 2013IEEE, 2013.
[13] S. Deilami, A. Masoum, P. Moses, and M. A. S. Masoum, “Real-time coordination of plug-in electric vehicle charging in smart grids tominimize power losses and improve voltage profile,” Smart Grid, IEEETransactions on, 2011.
[14] K. Mets, T. Verschueren, W. Haerick, C. Develder, and F. De Turck,“Optimizing smart energy control strategies for plug-in hybrid electricvehicle charging,” in Network Operations and Management SymposiumWorkshops (NOMS Wksps), 2010 IEEE/IFIP, 2010.
[15] S. Bohn, M. Agsten, O. Waldhorst, A. Mitschele-Thiel, D. Westermann,and P. Bretschneider, “An ict architecture for managed charging ofelectric vehicles in smart grid environments,” in Journal of Engineering,2013.
[16] D. Promiti, “Coordinating rendezvous points for inductive power transferbetween electric vehicles to increase effective driving distance,” inProceedings of the 2nd International Conference on Connected Vehiclesand Expo (ICCVE), Las Vegas, USA, December, 2013.
[17] C. Donna, M. K. Kara, and K. Moby, “The electric vehicle chargingstation location problem: A parking-based assignment method for seat-tle,” in Proceedings of the 92nd Annual Meeting of the TransportationResearch Board, 2013.
[18] I. Frade, A. Ribeiro, G. Goncalves, and A. Antunes, “Optimal location ofcharging stations for electric vehicles in a neighborhood in lisbon, portu-gal,” in Transportation Research Record: Journal of the TransportationResearch Board, No. 2252: 91-98, 2011.
[19] M. R. Sarker, H. Pandzic, and M. A. Ortega-Vazquez, “Electric vehiclebattery swapping station: Business case and optimization model.”
[20] M. Neaimeh, G. Hill, Y. Hubner, and P. Blythe, “Routing systemsto extend the driving range of electric vehicles,” Intelligent TransportSystems, IET, vol. 7, no. 3, pp. 327–336, 2013.
[21] L. A. Maglaras and D. Katsaros, “Distributed clustering in vehicularnetworks,” in Wireless and Mobile Computing, Networking and Com-
(IJACSA) International Journal of Advanced Computer Science and Applications, Vol. 6, No. 6, 2015
250 | P a g ewww.ijacsa.thesai.org

munications (WiMob), 2012 IEEE 8th International Conference on, Oct2012.
[22] N. Lagraa, M. B. Yagoubi, S. Benkouider et al., “Localization techniquein vanets using clustering (lvc),” IJCSI, 2010.
[23] M. Segata, F. Dressler, R. Lo Cigno, and M. Gerla, “A simulation toolfor automated platooning in mixed highway scenarios,” in Proceedingsof the 18th annual international conference on Mobile computing andnetworking. ACM, 2012, pp. 389–392.
[24] L. A. Maglaras, J. Jiang, F. V. Topalis, and A. L. Maglaras, “Mobileenergy disseminators increase electrical vehicles range in smart city,” inHybrid and Electric Vehicle Conference, IET, November 2014.
(IJACSA) International Journal of Advanced Computer Science and Applications, Vol. 6, No. 6, 2015
251 | P a g ewww.ijacsa.thesai.org