dynamic tunnel usability study: format recommendations … · dynamic tunnel usability study:...
TRANSCRIPT
February 2006
NASA/TM-2006-214272
Dynamic Tunnel Usability Study: Format Recommendations for Synthetic Vision System Primary Flight Displays Jarvis J. Arthur III, Lawrence J. Prinzel III, Lynda J. Kramer, and Randall E. Bailey Langley Research Center, Hampton, Virginia
https://ntrs.nasa.gov/search.jsp?R=20060008164 2018-06-21T06:22:15+00:00Z

The NASA STI Program Office . . . in Profile
Since its founding, NASA has been dedicated to the advancement of aeronautics and space science. The NASA Scientific and Technical Information (STI) Program Office plays a key part in helping NASA maintain this important role.
The NASA STI Program Office is operated by Langley Research Center, the lead center for NASA’s scientific and technical information. The NASA STI Program Office provides access to the NASA STI Database, the largest collection of aeronautical and space science STI in the world. The Program Office is also NASA’s institutional mechanism for disseminating the results of its research and development activities. These results are published by NASA in the NASA STI Report Series, which includes the following report types:
• TECHNICAL PUBLICATION. Reports of
completed research or a major significant phase of research that present the results of NASA programs and include extensive data or theoretical analysis. Includes compilations of significant scientific and technical data and information deemed to be of continuing reference value. NASA counterpart of peer-reviewed formal professional papers, but having less stringent limitations on manuscript length and extent of graphic presentations.
• TECHNICAL MEMORANDUM. Scientific
and technical findings that are preliminary or of specialized interest, e.g., quick release reports, working papers, and bibliographies that contain minimal annotation. Does not contain extensive analysis.
• CONTRACTOR REPORT. Scientific and
technical findings by NASA-sponsored contractors and grantees.
• CONFERENCE PUBLICATION. Collected
papers from scientific and technical conferences, symposia, seminars, or other meetings sponsored or co-sponsored by NASA.
• SPECIAL PUBLICATION. Scientific,
technical, or historical information from NASA programs, projects, and missions, often concerned with subjects having substantial public interest.
• TECHNICAL TRANSLATION. English-
language translations of foreign scientific and technical material pertinent to NASA’s mission.
Specialized services that complement the STI Program Office’s diverse offerings include creating custom thesauri, building customized databases, organizing and publishing research results ... even providing videos. For more information about the NASA STI Program Office, see the following: • Access the NASA STI Program Home Page at
http://www.sti.nasa.gov • E-mail your question via the Internet to
[email protected] • Fax your question to the NASA STI Help Desk
at (301) 621-0134 • Phone the NASA STI Help Desk at
(301) 621-0390 • Write to:
NASA STI Help Desk NASA Center for AeroSpace Information 7121 Standard Drive Hanover, MD 21076-1320
National Aeronautics and Space Administration Langley Research Center Hampton, Virginia 23681-2199
February 2006
NASA/TM-2006-214272
Dynamic Tunnel Usability Study: Format Recommendations for Synthetic Vision System Primary Flight Displays Jarvis J. Arthur III, Lawrence J. Prinzel III, Lynda J. Kramer, and Randall E. Bailey Langley Research Center, Hampton, Virginia

Available from:
NASA Center for AeroSpace Information (CASI) National Technical Information Service (NTIS) 7121 Standard Drive 5285 Port Royal Road Hanover, MD 21076-1320 Springfield, VA 22161-2171 (301) 621-0390 (703) 605-6000
Abstract
A usability study evaluating dynamic tunnel concepts has been completed under the Aviation Safety and Security Program, Synthetic Vision Systems Project. The usability study was conducted in the Visual Imaging Simulator for Transport Aircraft Systems (VISTAS) III simulator in the form of questionnaires and pilot-in-the-loop simulation sessions. Twelve commercial pilots participated in the study to determine their preferences via paired comparisons and subjective rankings regarding the color, line thickness and sensitivity of the dynamic tunnel. The results of the study showed that color was not significant in pilot preference paired comparisons or in pilot rankings. Line thickness was significant for both pilot preference paired comparisons and in pilot rankings. The preferred line/halo thickness combination was a line width of 3 pixels and a halo of 4 pixels. Finally, pilots were asked their preference for the current dynamic tunnel compared to a less sensitive dynamic tunnel. The current dynamic tunnel constantly gives feedback to the pilot with regard to path error while the less sensitive tunnel only changes as the path error approaches the edges of the tunnel. The tunnel sensitivity comparison results were not statistically significant.
Introduction
Better pilot situation awareness (SA) during low visibility conditions can be provided by Synthetic Vision Systems (SVS) displays (Arthur, Prinzel, Kramer, Parrish, & Bailey, 2004; Prinzel, Comstock et al. 2004). New technological developments in navigation performance, low-cost attitude and heading reference systems, computational capabilities, and displays foster the prospect of SVS displays for virtually all aircraft classes. SVS display concepts employ computer-generated terrain imagery, on-board databases, and precise position and navigational accuracy to create a three dimensional perspective presentation of the outside world, with necessary and sufficient information and realism, to enable operations equivalent to those of clear-day flight operations regardless of the outside weather or lighting condition.
Pathway-In-The-Sky Research
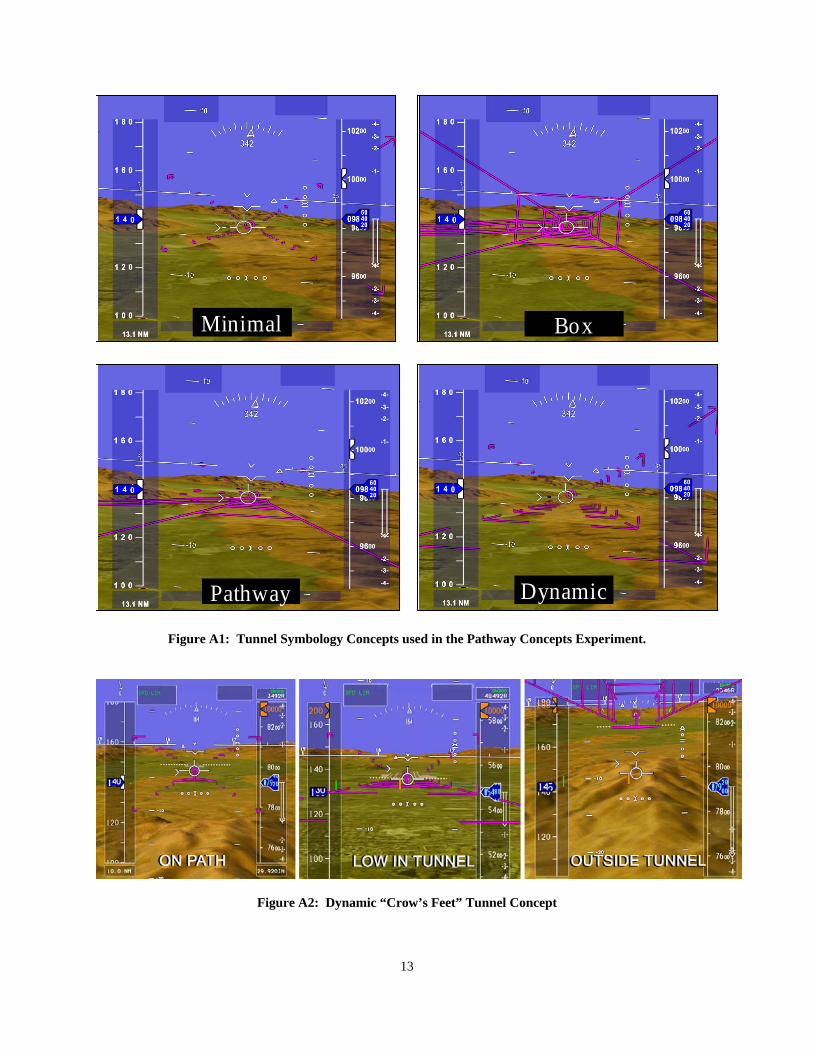
Providing pilots the intended flight path as a 3-dimensional perspective path (also referred to as “highway in the sky”) has been extensively researched by NASA Langley and others (Prinzel, Arthur, Kramer, & Bailey, 2004; Kramer, Prinzel, & Arthur, 2005). For example, Prinzel, Arthur et al. (2004) conducted an experiment to determine the best presentation of a pathway-in-the-sky on a SVS primary flight display (PFD). These researchers tested four different tunnel formats: Minimal “Crow’s Feet”, Box, Dynamic “Crow’s Feet”, and Dynamic Pathway tunnels. The specifications of the four tunnel formats tested are described in Appendix A.

2
Prinzel, Arthur et al (2004) reported nonsignificant performance differences between the four tunnel concepts. However, subjective data of the experiment evinced that pilots preferred the Dynamic Crow’s Feet tunnel. The possible reason for the preference of the Dynamic Crow’s Feet tunnel may have to do with its uniqueness; only a portion of the entire tunnel is displayed dependent upon path error as a human factors design solution to reduce display clutter but preserve informational quality and situation awareness. Behaviorally, the dynamic tunnel grows or shrinks as a function of path error in contrast to the typical static tunnel presentation which remains fixed to design parameters. Effectively, the dynamic tunnel provides the pilot with the boundaries of the flight path through presentation of the corners of the tunnel at all times similar to more traditional tunnel formats. However, more traditional tunnels tend to connect and hold constant one or more of the dimensions of the tunnel to frame the edges of the flight path. The result is that the pilot has significant awareness of how close the aircraft is flying with respect to the pathway, but at the cost of display clutter. With a SVS display, such clutter can obscure equally important obstacle and terrain information leading to an overall reduction in situation awareness.
The minimal “Crow’s Feet” tunnel was a design attempt to reduce the tunnel display clutter by only presenting the corners of the tunnel. Research had shown that, under normal operations and when the aircraft is flying down the center of the tunnel, the format is effective but significantly loses that effectiveness as the deviation from the desired path increases (Glabb, Kramer, Arthur, & Parrish, 2003). Pilots reported that their positional accuracy with respect to the desired path was difficult to estimate with the minimal “Crow’s Feet” tunnel format. The Dynamic “Crow’s Feet” format, in contrast, merged the Minimal “Crow’s Feet” with traditional tunnel concepts; thereby, merging the strengths of both formats. When the path error approaches zero, the Dynamic “Crow’s Feet” resembles the Minimal “Crow’s Feet” tunnel but otherwise, adapts to provide dynamic feedback to the pilot of how close he or she is to the tunnel boundary. The result is a tunnel concept that minimizes clutter yet is flexible and adaptive to ensure high situation awareness through dynamic feedback of path error in an intuitive fashion.
Purpose of Usability Test
A usability test was conducted to evaluate three tunnel design characteristics: tunnel color, tunnel line thickness and dynamic tunnel sensitivity. During simulation and flight test experiments, some pilots had commented that the dynamic tunnel concept might, in fact, be too dynamic, in that, its continual motion can be distracting. One of the concepts tested in Prinzel, Arthur et al. (2004) was a less dynamic tunnel than the Dynamic Crow’s Feet known as the Dynamic Pathway tunnel. The Dynamic Pathway tunnel mirrors the minimal “Crow’s Feet” tunnel until the path error approaches the edge of the tunnel. When the aircraft position is beyond the edges of the tunnel boundary, the behavior of the Dynamic Pathway tunnel is similar to the Dynamic Crow’s Feet tunnel. However, in Prinzel, Arthur et al. (2004), the Dynamic Pathway tunnel had a “floor” which was always present (see Figure 1). Thus, it was conjectured that pilots may have preferred the behavior of the Dynamic Pathway tunnel; however, the floor provided too much clutter, thus resulting in a lower rating compared to the Dynamic Crow’s Feet tunnel.
In addition, many features of the tunnel attributes were carried over from the Minimal “Crow’s Feet” concept conceived for the High Speed Research (HSR) program, which was a precursor to the SVS project. However, these features were not subject to empirical evaluation to their efficacy.

3
Figure 1: Dynamic Pathway tunnel (left) and the Dynamic “Crow’s Feet” tunnel (right). Note that the tunnel “floor” of the Pathway tunnel was not present in the usability study.
A usability study was conducted to determine the pilot’s preferences for three tunnel characteristics, identified on the basis of pilot feedback, which may not be optimal for the Dynamic “Crow’s Feet” tunnel. These characteristics are: dynamic tunnel sensitivity, tunnel color and tunnel line thickness.
In this usability study, two tunnel sensitivities were tested. The values were the same sensitivities used for the Dynamic Pathway and the Dynamic Crow’s Feet tunnel concepts in Prinzel, Arthur et al. (2004). However, for the Dynamic Pathway tunnel, the floor was removed. Essentially, this provides a direct comparison between tunnel sensitivities without the floor confounding the results. In addition to the dynamic sensitively tunnel comparison, four tunnel color combinations and seven different tunnel line thickness combinations were compared.
Past research has shown that path performance is not significantly affected by the type (i.e., Dynamic, Pathway, Minimal, Box) of tunnel symbology (Prinzel, Arthur et al., 2004). Quantitative path performance differences between these concepts would not be expected. On this basis, a usability study, wherein the relevant metrics are only qualitative, should provide valid, accurate results for these comparisons.
Methodology
Usability Participants
A total of 12 subjects were used in the usability study. The subject pool consisted of 11 commercial pilots (first officers and captains) and 1 FAA pilot. The subjects who took part in the usability study were participants in an earlier experiment which used the dynamic tunnel. Since the usability study immediately followed the experiment, subjects were familiar with the dynamic tunnel symbology. Three attributes of the tunnel were evaluated through interactive questionnaires and short simulation sessions. The simulation sessions were conducted in the Visual Imaging Simulator for Transport Aircraft Systems (VISTAS) III, a part task simulator
DynamicDynamicPathwayPathway
4
used for concept development for advanced commercial cockpit displays. The concepts were displayed on a ARINC Size D (7.0 inch square viewable display surface) head down display with a resolution of 768 horizontal pixels over a field of view of 30 degrees. The distance between the eye reference point and the center of the display was 28 inches. The total time for the usability study for each subject was 30 minutes.
Usability Procedure
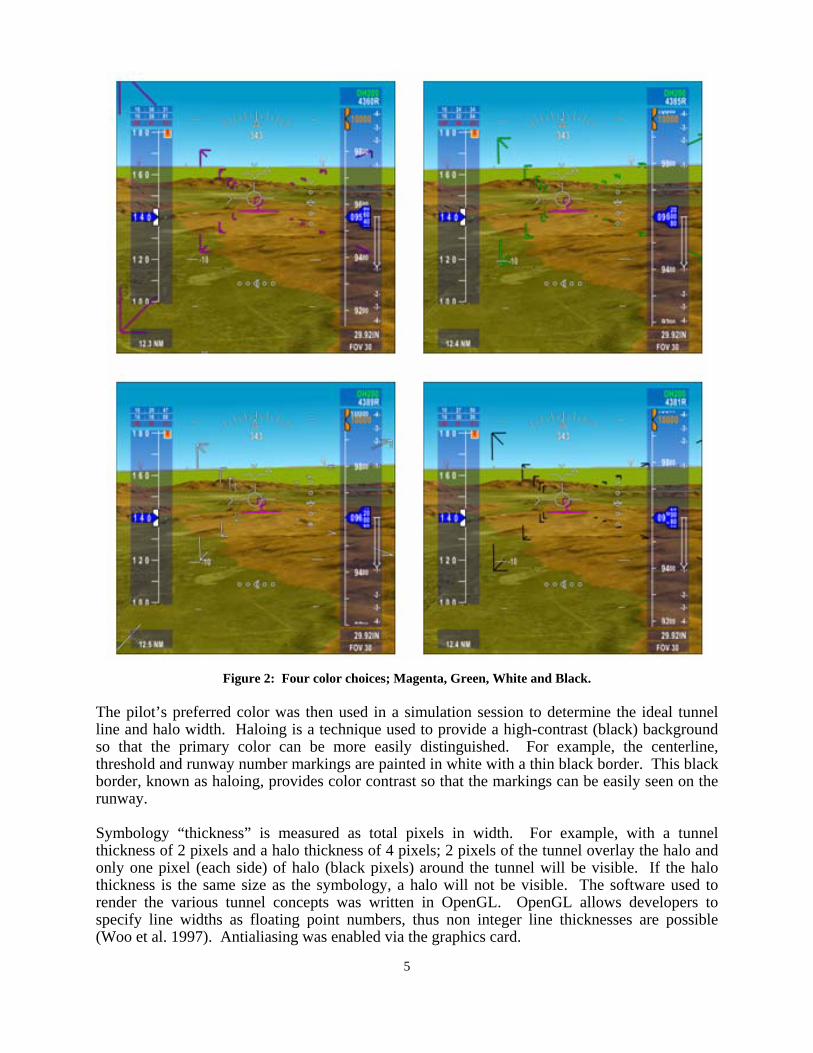
First, pilots were asked their opinion of the color of the tunnel by answering a paired comparison (Appendix B) questionnaire while looking at static pictures of the tunnel concept (see Figure 2). In addition, pilots rank-ordered their preference for tunnel color during the final questionnaire. The paired comparisons were done interactively to ensure accurate data collection and to provide a rationale for each of the four colors; magenta, green, white and black.
Historically, the SVS project has used magenta as the tunnel color because magenta is the color of the active pathway on the navigation display. Therefore, a magenta 3-dimentional projection of this path on the PFD provides visual consistency between the PFD and navigational display. In addition, since the PFD guidance cue is magenta, a magenta tunnel provided reinforcement cueing that all of the magenta symbologies work in concert. However, in past simulation and flight test experiments pilot subjects have commented that this can lead to too much magenta symbology on the display, especially in turns. Evaluation of a white color was chosen to maintain consistency with the other PFD symbologies (e.g., pitch ladder, horizon line, etc). Though white has a good contrast ratio, white tunnel segments could overlap other symbologies (for example, the pitch ladder tick marks) making it hard to distinguish the tunnel shape. Green was chosen as a tunnel evaluation color as no other symbology is green; thus, it should be easily and uniquely interpreted. Finally, black was chosen as an evaluation color as it was considered to provide the same benefits as the green color.
5
Figure 2: Four color choices; Magenta, Green, White and Black.
The pilot’s preferred color was then used in a simulation session to determine the ideal tunnel line and halo width. Haloing is a technique used to provide a high-contrast (black) background so that the primary color can be more easily distinguished. For example, the centerline, threshold and runway number markings are painted in white with a thin black border. This black border, known as haloing, provides color contrast so that the markings can be easily seen on the runway.
Symbology “thickness” is measured as total pixels in width. For example, with a tunnel thickness of 2 pixels and a halo thickness of 4 pixels; 2 pixels of the tunnel overlay the halo and only one pixel (each side) of halo (black pixels) around the tunnel will be visible. If the halo thickness is the same size as the symbology, a halo will not be visible. The software used to render the various tunnel concepts was written in OpenGL. OpenGL allows developers to specify line widths as floating point numbers, thus non integer line thicknesses are possible (Woo et al. 1997). Antialiasing was enabled via the graphics card.
6
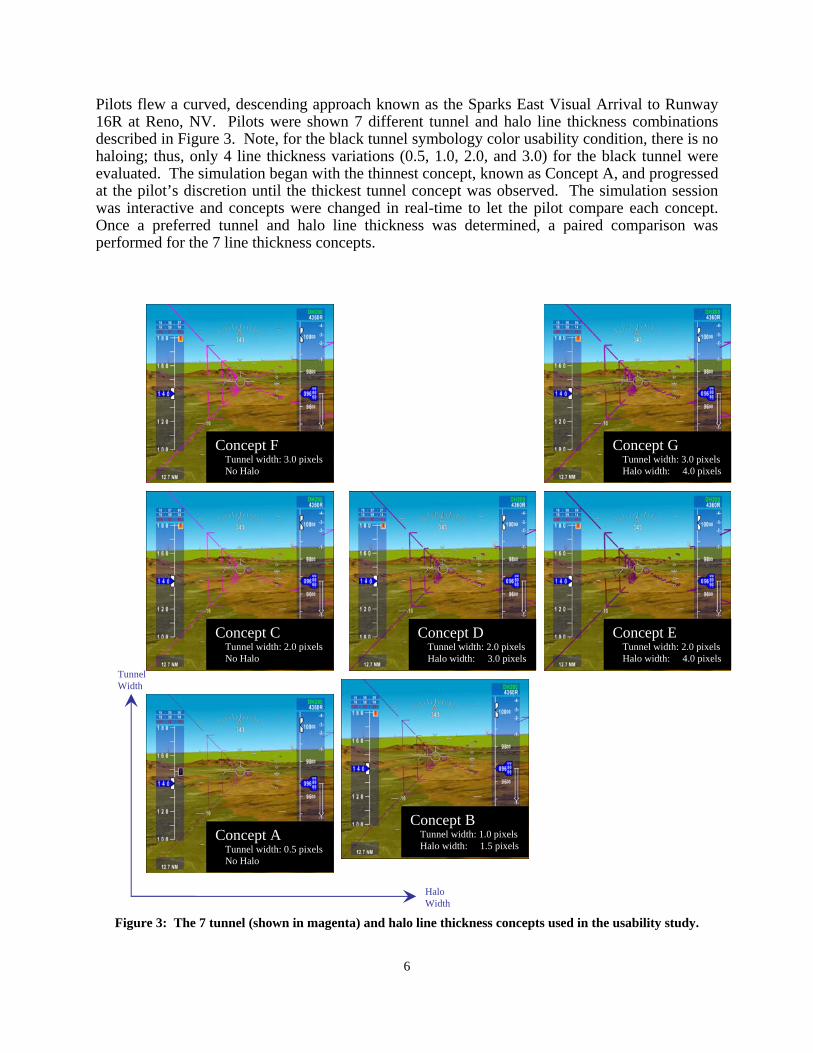
Pilots flew a curved, descending approach known as the Sparks East Visual Arrival to Runway 16R at Reno, NV. Pilots were shown 7 different tunnel and halo line thickness combinations described in Figure 3. Note, for the black tunnel symbology color usability condition, there is no haloing; thus, only 4 line thickness variations (0.5, 1.0, 2.0, and 3.0) for the black tunnel were evaluated. The simulation began with the thinnest concept, known as Concept A, and progressed at the pilot’s discretion until the thickest tunnel concept was observed. The simulation session was interactive and concepts were changed in real-time to let the pilot compare each concept. Once a preferred tunnel and halo line thickness was determined, a paired comparison was performed for the 7 line thickness concepts.
Figure 3: The 7 tunnel (shown in magenta) and halo line thickness concepts used in the usability study.
Concept A Tunnel width: 0.5 pixels No Halo
Concept B Tunnel width: 1.0 pixels Halo width: 1.5 pixels
Concept C Tunnel width: 2.0 pixels No Halo
Concept F Tunnel width: 3.0 pixels No Halo
Concept D Tunnel width: 2.0 pixels Halo width: 3.0 pixels
Concept E Tunnel width: 2.0 pixels Halo width: 4.0 pixels
Concept G Tunnel width: 3.0 pixels Halo width: 4.0 pixels
Halo Width
Tunnel Width
7
At the completion of the tunnel and halo line thickness paired comparison, another short simulation session was conducted to determine the preferred sensitivity of the dynamic tunnel. Pilots were shown two PFD’s side-by-side to evaluate the tunnel sensitivity. One PFD showed the Dynamic Crow’s Feet and the other showed the Dynamic Pathway.
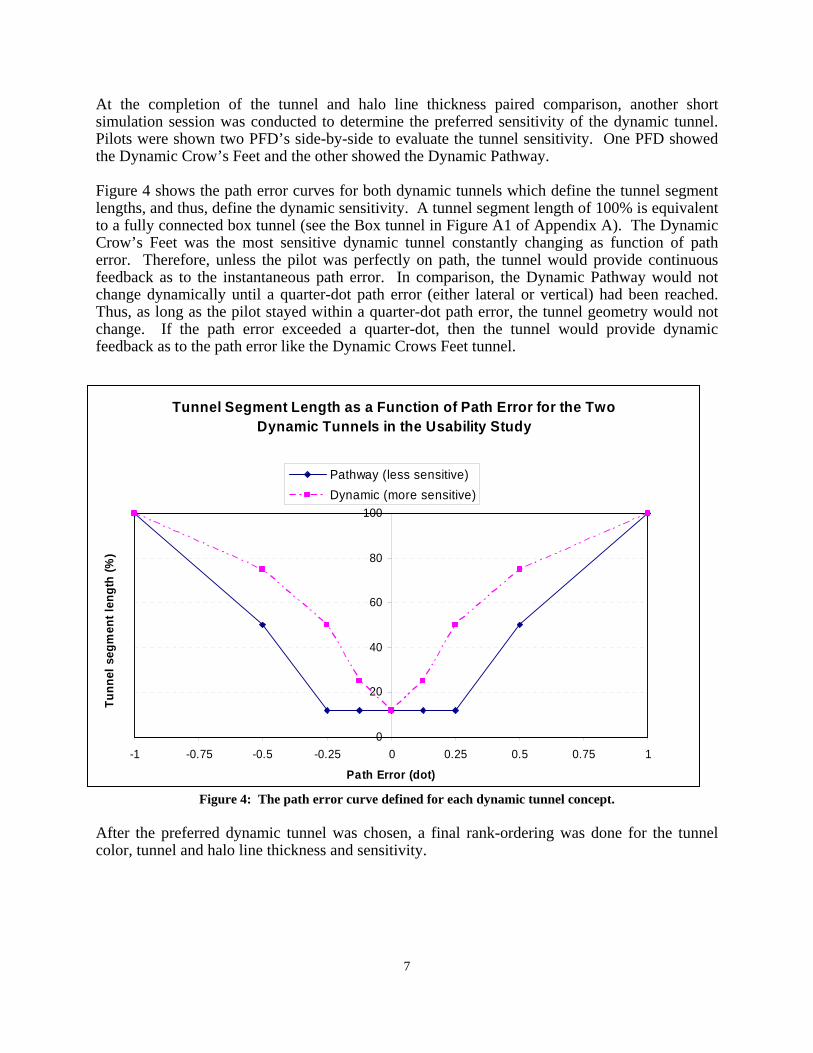
Figure 4 shows the path error curves for both dynamic tunnels which define the tunnel segment lengths, and thus, define the dynamic sensitivity. A tunnel segment length of 100% is equivalent to a fully connected box tunnel (see the Box tunnel in Figure A1 of Appendix A). The Dynamic Crow’s Feet was the most sensitive dynamic tunnel constantly changing as function of path error. Therefore, unless the pilot was perfectly on path, the tunnel would provide continuous feedback as to the instantaneous path error. In comparison, the Dynamic Pathway would not change dynamically until a quarter-dot path error (either lateral or vertical) had been reached. Thus, as long as the pilot stayed within a quarter-dot path error, the tunnel geometry would not change. If the path error exceeded a quarter-dot, then the tunnel would provide dynamic feedback as to the path error like the Dynamic Crows Feet tunnel.
Figure 4: The path error curve defined for each dynamic tunnel concept.
After the preferred dynamic tunnel was chosen, a final rank-ordering was done for the tunnel color, tunnel and halo line thickness and sensitivity.
Tunnel Segment Length as a Function of Path Error for the Two Dynamic Tunnels in the Usability Study
0
20
40
60
80
100
-1 -0.75 -0.5 -0.25 0 0.25 0.5 0.75 1
Path Error (dot)
Tunn
el s
egm
ent l
engt
h (%
)
Pathway (less sensitive)Dynamic (more sensitive)
8
Results
Color
An Analysis of Variance (ANOVA) test was performed on the tunnel color attribute. Color preference was not statistically significant in the paired comparisons (p=0.129) nor in pilot rankings (Friedman test; p=0.138). The tunnel color preference, in order based on the mean rank from the Friedman test, was green (1.82) followed by magenta (2.36), white (2.82) and the least preferred, black (3.0).
Tunnel and Halo Line Thickness
An ANOVA test was performed for tunnel and halo line thickness preference paired-comparisons. Tunnel line thickness was significant (excluding pilots who chose black as preferred color F(6,54) = 3.664, p<.05) for the paired comparisons as well as pilot rankings (Friedman test; p<.05). Concept G (tunnel line thickness of 3 pixels and halo thickness of 4 pixels) was the preferred tunnel thickness.
It should be noted that the pixel is just one measure for the size of the symbology and additional evaluations may be needed for further specification. For example, for smaller or larger display devices, the angle subtended by one pixel varies proportionally to the display device size and resolution. For this study, the display device measured 7.0 inches over 768 pixels resulting in 110 pixels per inch resolution.
Dynamic Tunnel Sensitivity
For tunnel sensitivity, exactly half of the pilots (6 of the 12) chose the high sensitivity tunnel concept (Dynamic Crow’s Feet) and the other 6 chose the less sensitive tunnel concept (Dynamic Pathway). Pilots who preferred the Dynamic Crow’s Feet tunnel stated that it provides instant, intuitive feedback of the path error. In addition, since it was rare for subjects to be exactly on path, the Dynamic Crow’s Feet tunnel provided more definition of turn segments. The result was a clearer depiction of the turn making the tunnel easy to interpret. For the Pathway Tunnel, the tunnel segments in a turn were not long enough to clearly define the turn for the pilot.
Those subjects who chose the Dynamic Pathway tunnel preferred having less movement. They felt the Dynamic Crow’s Feet was too distracting by providing constant tunnel changes. They preferred using the guidance symbol to “fine-tune” flying the path. Further, they liked how the tunnel boundaries changed as they approached the tunnel edge to alert of gross errors rather than constant small errors.
9
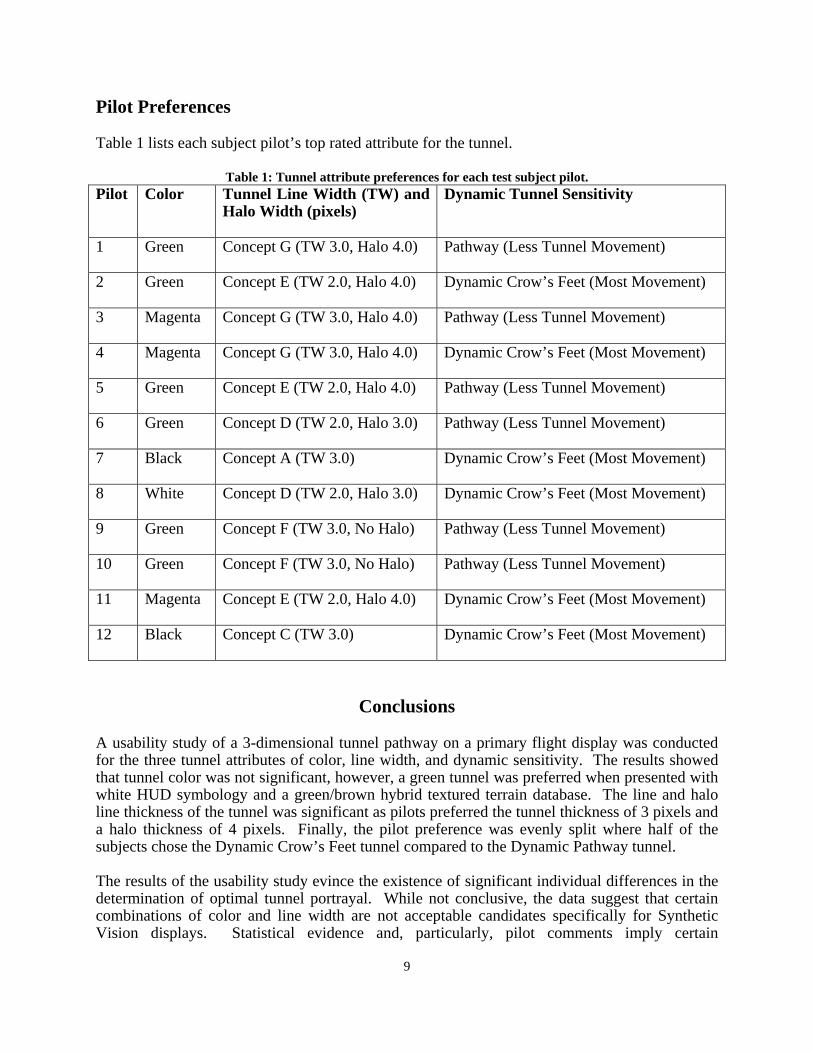
Pilot Preferences
Table 1 lists each subject pilot’s top rated attribute for the tunnel.
Table 1: Tunnel attribute preferences for each test subject pilot. Pilot Color Tunnel Line Width (TW) and
Halo Width (pixels) Dynamic Tunnel Sensitivity
1 Green Concept G (TW 3.0, Halo 4.0) Pathway (Less Tunnel Movement)
2 Green Concept E (TW 2.0, Halo 4.0) Dynamic Crow’s Feet (Most Movement)
3 Magenta Concept G (TW 3.0, Halo 4.0) Pathway (Less Tunnel Movement)
4 Magenta Concept G (TW 3.0, Halo 4.0) Dynamic Crow’s Feet (Most Movement)
5 Green Concept E (TW 2.0, Halo 4.0) Pathway (Less Tunnel Movement)
6 Green Concept D (TW 2.0, Halo 3.0) Pathway (Less Tunnel Movement)
7 Black Concept A (TW 3.0) Dynamic Crow’s Feet (Most Movement)
8 White Concept D (TW 2.0, Halo 3.0) Dynamic Crow’s Feet (Most Movement)
9 Green Concept F (TW 3.0, No Halo) Pathway (Less Tunnel Movement)
10 Green Concept F (TW 3.0, No Halo) Pathway (Less Tunnel Movement)
11 Magenta Concept E (TW 2.0, Halo 4.0) Dynamic Crow’s Feet (Most Movement)
12 Black Concept C (TW 3.0) Dynamic Crow’s Feet (Most Movement)
Conclusions
A usability study of a 3-dimensional tunnel pathway on a primary flight display was conducted for the three tunnel attributes of color, line width, and dynamic sensitivity. The results showed that tunnel color was not significant, however, a green tunnel was preferred when presented with white HUD symbology and a green/brown hybrid textured terrain database. The line and halo line thickness of the tunnel was significant as pilots preferred the tunnel thickness of 3 pixels and a halo thickness of 4 pixels. Finally, the pilot preference was evenly split where half of the subjects chose the Dynamic Crow’s Feet tunnel compared to the Dynamic Pathway tunnel.
The results of the usability study evince the existence of significant individual differences in the determination of optimal tunnel portrayal. While not conclusive, the data suggest that certain combinations of color and line width are not acceptable candidates specifically for Synthetic Vision displays. Statistical evidence and, particularly, pilot comments imply certain
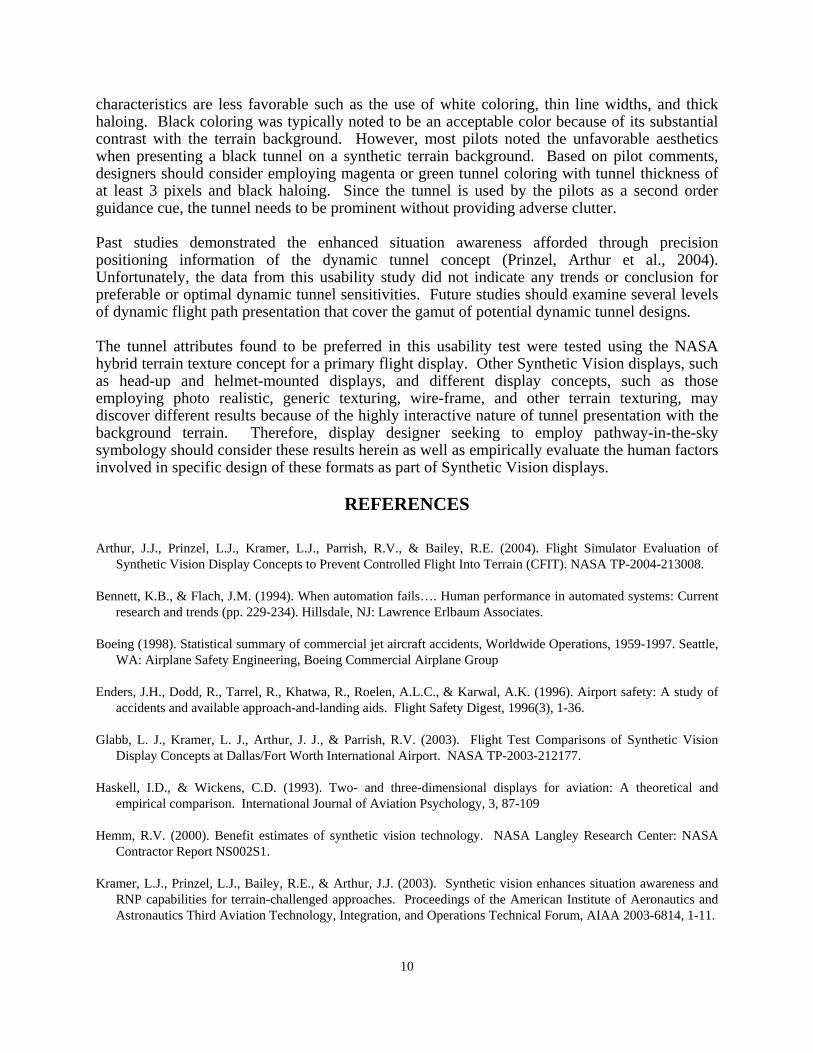
10
characteristics are less favorable such as the use of white coloring, thin line widths, and thick haloing. Black coloring was typically noted to be an acceptable color because of its substantial contrast with the terrain background. However, most pilots noted the unfavorable aesthetics when presenting a black tunnel on a synthetic terrain background. Based on pilot comments, designers should consider employing magenta or green tunnel coloring with tunnel thickness of at least 3 pixels and black haloing. Since the tunnel is used by the pilots as a second order guidance cue, the tunnel needs to be prominent without providing adverse clutter.
Past studies demonstrated the enhanced situation awareness afforded through precision positioning information of the dynamic tunnel concept (Prinzel, Arthur et al., 2004). Unfortunately, the data from this usability study did not indicate any trends or conclusion for preferable or optimal dynamic tunnel sensitivities. Future studies should examine several levels of dynamic flight path presentation that cover the gamut of potential dynamic tunnel designs.
The tunnel attributes found to be preferred in this usability test were tested using the NASA hybrid terrain texture concept for a primary flight display. Other Synthetic Vision displays, such as head-up and helmet-mounted displays, and different display concepts, such as those employing photo realistic, generic texturing, wire-frame, and other terrain texturing, may discover different results because of the highly interactive nature of tunnel presentation with the background terrain. Therefore, display designer seeking to employ pathway-in-the-sky symbology should consider these results herein as well as empirically evaluate the human factors involved in specific design of these formats as part of Synthetic Vision displays.
REFERENCES
Arthur, J.J., Prinzel, L.J., Kramer, L.J., Parrish, R.V., & Bailey, R.E. (2004). Flight Simulator Evaluation of Synthetic Vision Display Concepts to Prevent Controlled Flight Into Terrain (CFIT). NASA TP-2004-213008.
Bennett, K.B., & Flach, J.M. (1994). When automation fails…. Human performance in automated systems: Current research and trends (pp. 229-234). Hillsdale, NJ: Lawrence Erlbaum Associates.
Boeing (1998). Statistical summary of commercial jet aircraft accidents, Worldwide Operations, 1959-1997. Seattle, WA: Airplane Safety Engineering, Boeing Commercial Airplane Group
Enders, J.H., Dodd, R., Tarrel, R., Khatwa, R., Roelen, A.L.C., & Karwal, A.K. (1996). Airport safety: A study of accidents and available approach-and-landing aids. Flight Safety Digest, 1996(3), 1-36.
Glabb, L. J., Kramer, L. J., Arthur, J. J., & Parrish, R.V. (2003). Flight Test Comparisons of Synthetic Vision Display Concepts at Dallas/Fort Worth International Airport. NASA TP-2003-212177.
Haskell, I.D., & Wickens, C.D. (1993). Two- and three-dimensional displays for aviation: A theoretical and empirical comparison. International Journal of Aviation Psychology, 3, 87-109
Hemm, R.V. (2000). Benefit estimates of synthetic vision technology. NASA Langley Research Center: NASA Contractor Report NS002S1.
Kramer, L.J., Prinzel, L.J., Bailey, R.E., & Arthur, J.J. (2003). Synthetic vision enhances situation awareness and RNP capabilities for terrain-challenged approaches. Proceedings of the American Institute of Aeronautics and Astronautics Third Aviation Technology, Integration, and Operations Technical Forum, AIAA 2003-6814, 1-11.
11
Kramer, Lynda J.; Prinzel III, Lawrence J.; and Arthur III, Jarvis J (2005).: Advanced Pathway Guidance Evaluations on a Synthetic Vision Head-Up Display. NASA TP-213782, July 2005.
Merrick, V.K., Jeske, J.A., “Flight Path Synthesis and HUD Scaling for V/STOL Terminal Area Operations,” NASA TM-110348, April 1995.
National Aeronautics and Space Administration (2001). Aerospace Technology Enterprise. Washington, D.C.: NASA.
Prinzel, L.J., Comstock, J.R., Glaab, L.J., Kramer, L.J., Arthur, J.J., & Barry, J.S. (2004). The efficacy of head-down and head-up synthetic vision display concepts for retro- and forward-fit of commercial aircraft. International Journal of Aviation Psychology, 14, 53-73.
Prinzel, L.J., Arthur, J.J., Kramer, L.J. & Bailey, R.E. (2004). Pathway Concepts Experiment for Head Down Synthetic Vision Displays. SPIE. In J. G. Verly (Ed.), Proceedings of the SPIE, Enhanced and Synthetic Vision 2004, 5424-02, pp. 11-22.
Prinzel, L.J., Hughes, M.F., Arthur, J.J., Kramer, L.J., Glaab, L.J., Bailey, R.E., Parrish, R.V., & Uenking, M.D. (2003). Synthetic Vision CFIT Experiments for GA and Commercial Aircraft: “A Picture Is Worth A Thousand Lives”. Proceedings of the Human Factors & Ergonomics Society, 47, 164-168.
Prinzel, L.J., Kramer, L.J., Bailey, R., Hughes, M., & Comstock, R. (2002). NASA Eagle-Vail Synthetic Vision Flight Test. Proceedings of the Human Factors and Ergonomics Society 46th Annual Meeting, 46.135-139
Prinzel, L.J., Kramer, L.J., Comstock, J.R., Bailey, R.E., Hughes, M.F., & Parrish, R.V. (2002). NASA synthetic vision EGE flight test. Proceedings of the Annual Human Factors and Ergonomics Meeting, 46, 135-139.
Schnell, T., Kwon, Y, Merchant, S., & Etherington, T. (2004). Improved flight technical performance in flight decks equipped with synthetic vision information system displays. International Journal of Aviation Psychology, 14, 79-102.
Theunissen, E.R. (1997). Integrated design of a man-machine interface for 4-D navigation. Delft, Netherlands: Delft University Press.
Wiener, E. L. (1977). Controlled flight into terrain accidents: System-induced errors. Human Factors, 19, 171-181.
Williams, D., Waller, M., Koelling, J., Burdette, D., Doyle, T., Capron, W., Barry, J., & Gifford, R. (2001). Concept of operations for commercial and business aircraft synthetic vision systems. NASA Langley Research Center: NASA Technical Memorandum TM-2001-211058.
Williams, K.W. (2002). Impact of aviation highway-in-the-sky displays on pilot situation awareness. Human Factors, 44, 18-27.
Woo, M., Neider, J., & Davis, T. (1997). OpenGL Programming Guide, Second Edition. Addison Wesley Developers Press.
12
Appendix A
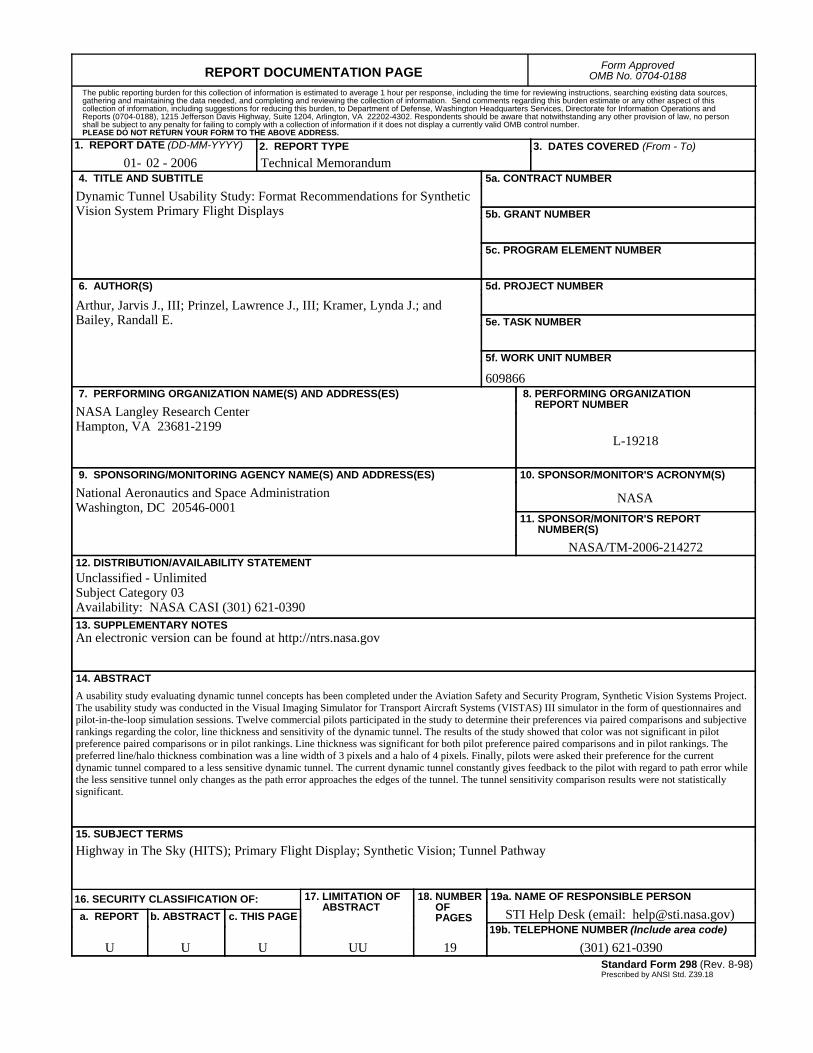
Four tunnel (box, minimal, dynamic “crows feet”, dynamic pathway) and baseline (i.e., no tunnel) concepts were evaluated (see Figure A1) in the paper by Prinzel, Arthur et al. (2004), “Pathway Concepts Experiment for Head Down Synthetic Vision Displays.” The "box" tunnel, a concept that is the subject of most of the tunnel research in the literature, consisted of a series of boxes connected at the corners to form a path within which the pilot flies. It was presented out to a length of 10 nm, with no fading. The minimal tunnel concept consisted of a series of "crows feet" presented in each corner of a tunnel segment (essentially a truncated box). The tunnel presentation was 5 tunnel segments per nautical mile (nm) with a total length of 3 nm, which faded linearly to invisibility. The third concept, dynamic "crows feet", allowed the "crow’s feet" to grow as a function of path error. Therefore, the pilots are given feedback as to where they are in the tunnel and if they are in danger of flying out of the tunnel. The idea of the dynamic tunnel was that if the pilot is flying in the center of the tunnel, there should be the smallest amount of clutter. However, if there exists appreciable path error, the tunnel walls would "grow" to help the pilot gauge where the boundaries of the tunnel are. This helps to overcome a frequent criticism of "low clutter" tunnels. The fourth concept, dynamic pathway, was a variation of the dynamic "crows feet" concept in which the floor of the tunnel was presented at all times. For both the dynamic pathway and dynamic “crows feet”, when the pilot left the tunnel, the tunnel would change to a “trough” and resemble a box tunnel with the exception that the tunnel would open to “invite” the pilot back into the tunnel (Figure A2).
The results indicated that the presence of a tunnel had a marginal effect on enhancing path control performance for the head-down display compared to the baseline (no tunnel w/ ball guidance). No significant differences, however, were found for path control performance between the four tunnel concepts. Despite this, statistically significant differences were found for pilot ratings for situation awareness and workload. Overall, pilots rated the tunnel concepts to be significantly better in terms of workload and situation awareness compared to not having a tunnel present. When just the tunnel concepts are considered, the minimal tunnel concept was consistently rated poorer followed by the box tunnel concept. The reasons are different for the two tunnel concepts. The minimal tunnel was found to be poor for situation awareness because it was difficult to accurately determine where you were in the tunnel. However, pilots did note that the presence of the guidance symbology and path deviation indicators significantly reduce this problem. Furthermore, all pilots remarked that the minimal tunnel might be optimal for a HUD where issues of clutter are of particular concern compared to the PFD. The box tunnel, in contrast, was rated poorer because of concerns of clutter especially on final approach. Although it was fairly easy to determine where they were in the tunnel, the advantage was negated because the tunnel obscured the synthetic terrain. For these reasons, the evaluation pilots preferred the dynamic tunnel concepts for a head-down synthetic vision display.
Overall, the dynamic pathway was rated very high for situation awareness, but several pilots reported that the presence of the tunnel floor (“railroad track”) was unnecessary when compared to the dynamic “crow’s feet” tunnel. Therefore, although preferred to the minimal and box tunnel concepts, the dynamic “crow’s feet” was reported to provide all the advantages of the dynamic pathway with less clutter. All pilots remarked that the dynamic quality of the tunnel was useful to determine exact position within the tunnel and the “trough” effect when outside the tunnel made it very easy to re-enter the tunnel. However, most pilots thought that the tunnel may have been too dynamic and somewhat distracting. Therefore, the algorithm for the dynamic “crow’s feet” tunnel will be redesigned to reduce this issue.
13
MinimalMinimal
DynamicDynamic
BoxBox
PathwayPathway
Figure A1: Tunnel Symbology Concepts used in the Pathway Concepts Experiment.
Figure A2: Dynamic “Crow’s Feet” Tunnel Concept

14
Appendix B
Color Paired comparison questionnaire completed by the subjects
Overview: This questionnaire is designed to allow statistical analysis of your subjective assessment of your preferences for tunnel color and line width/halo that you saw today. Please look at the pictures of the display concepts when making your comparisons.
Paired Comparison Rating Instructions: Each paired comparison will be listed on the left side of the questionnaire.
Pilot Preference (Tunnel Color)
If not equal, how much more or how much less? Barely Substantially
White + Black Halo is (___ more)( ___ equal)( ___ less) preferred than Green + Black Halo
White + Black Halo is (___ more)( ___ equal)( ___ less) preferred than
Black + None White + Black Halo
is (___ more)( ___ equal)( ___ less) preferred than
Magenta + Black Halo Green + Black Halo
is (___ more)( ___ equal)( ___ less) preferred than Black + None
Green + Black Halo is (___ more)( ___ equal)( ___ less) preferred than
Magenta + Black Halo Black + None
is (___ more)( ___ equal)( ___ less) preferred than Magenta + Black Halo
REPORT DOCUMENTATION PAGE Form ApprovedOMB No. 0704-0188
2. REPORT TYPE Technical Memorandum
4. TITLE AND SUBTITLE
Dynamic Tunnel Usability Study: Format Recommendations for SyntheticVision System Primary Flight Displays
5a. CONTRACT NUMBER
6. AUTHOR(S)
Arthur, Jarvis J., III; Prinzel, Lawrence J., III; Kramer, Lynda J.; andBailey, Randall E.
7. PERFORMING ORGANIZATION NAME(S) AND ADDRESS(ES)
NASA Langley Research CenterHampton, VA 23681-2199
9. SPONSORING/MONITORING AGENCY NAME(S) AND ADDRESS(ES)
National Aeronautics and Space AdministrationWashington, DC 20546-0001
8. PERFORMING ORGANIZATION REPORT NUMBER
L-19218
10. SPONSOR/MONITOR'S ACRONYM(S)
NASA
13. SUPPLEMENTARY NOTESAn electronic version can be found at http://ntrs.nasa.gov
12. DISTRIBUTION/AVAILABILITY STATEMENTUnclassified - UnlimitedSubject Category 03Availability: NASA CASI (301) 621-0390
19a. NAME OF RESPONSIBLE PERSON
STI Help Desk (email: [email protected])
14. ABSTRACTA usability study evaluating dynamic tunnel concepts has been completed under the Aviation Safety and Security Program, Synthetic Vision Systems Project.The usability study was conducted in the Visual Imaging Simulator for Transport Aircraft Systems (VISTAS) III simulator in the form of questionnaires andpilot-in-the-loop simulation sessions. Twelve commercial pilots participated in the study to determine their preferences via paired comparisons and subjectiverankings regarding the color, line thickness and sensitivity of the dynamic tunnel. The results of the study showed that color was not significant in pilotpreference paired comparisons or in pilot rankings. Line thickness was significant for both pilot preference paired comparisons and in pilot rankings. Thepreferred line/halo thickness combination was a line width of 3 pixels and a halo of 4 pixels. Finally, pilots were asked their preference for the currentdynamic tunnel compared to a less sensitive dynamic tunnel. The current dynamic tunnel constantly gives feedback to the pilot with regard to path error whilethe less sensitive tunnel only changes as the path error approaches the edges of the tunnel. The tunnel sensitivity comparison results were not statisticallysignificant.
15. SUBJECT TERMSHighway in The Sky (HITS); Primary Flight Display; Synthetic Vision; Tunnel Pathway
18. NUMBER OF PAGES
1919b. TELEPHONE NUMBER (Include area code)
(301) 621-0390
a. REPORT
U
c. THIS PAGE
U
b. ABSTRACT
U
17. LIMITATION OF ABSTRACT
UU
Prescribed by ANSI Std. Z39.18Standard Form 298 (Rev. 8-98)
3. DATES COVERED (From - To)
5b. GRANT NUMBER
5c. PROGRAM ELEMENT NUMBER
5d. PROJECT NUMBER
5e. TASK NUMBER
5f. WORK UNIT NUMBER
609866
11. SPONSOR/MONITOR'S REPORT NUMBER(S)
NASA/TM-2006-214272
16. SECURITY CLASSIFICATION OF:
The public reporting burden for this collection of information is estimated to average 1 hour per response, including the time for reviewing instructions, searching existing data sources, gathering and maintaining the data needed, and completing and reviewing the collection of information. Send comments regarding this burden estimate or any other aspect of this collection of information, including suggestions for reducing this burden, to Department of Defense, Washington Headquarters Services, Directorate for Information Operations and Reports (0704-0188), 1215 Jefferson Davis Highway, Suite 1204, Arlington, VA 22202-4302. Respondents should be aware that notwithstanding any other provision of law, no person shall be subject to any penalty for failing to comply with a collection of information if it does not display a currently valid OMB control number.PLEASE DO NOT RETURN YOUR FORM TO THE ABOVE ADDRESS.
1. REPORT DATE (DD-MM-YYYY)
02 - 200601-