dynamic response analysis of airport pavements during
TRANSCRIPT

Dong et al. / J Zhejiang Univ-Sci A (Appl Phys & Eng) 2021 22(9):736-750 736
Dynamic response analysis of airport pavements during aircraft
taxiing for evaluating pavement bearing capacity*
Qian DONG1,2, Jian-hua WANG†‡1, Xian-min ZHANG2, Hao WANG3, Jing-nan ZHAO3 1School of Civil Engineering, Tianjin University, Tianjin 300072, China,
2College of Transportation Science and Engineering, Civil Aviation University of China, Tianjin 300300, China 3Department of Civil and Environmental Engineering, Rutgers University, Piscataway NJ 08854, USA
†E-mail: [email protected]
Received Aug. 23, 2020; Revision accepted Jan. 22, 2021; Crosschecked Aug. 24, 2021
Abstract: In this paper, we propose a new method to analyze airport pavement bearing capacity using vibration in runways during aircraft taxiing. The new method overcomes shortcomings of existing tests, such as flight suspension and simulated loading. Between aircraft take-off and landing, acceleration sensors are arranged on the surface of the pavement far from the centerline, and the in-situ responses of the pavement under aircraft loads are collected during aircraft operations. The fundamental frequencies of the pavement are obtained by fast Fourier transformation of the measured accelerations, and are used to modify the parameters of a pavement finite element model built according to a design blueprint. By comparing the fundamental frequencies of the measured and calculated signals, the soil modulus is back-calculated. To implement this test method and ensure the accuracy of bearing capacity evaluation, aircraft dynamic loads are obtained by solving dynamic balance equations of the aircraft-pavement coupled system, and the vibration response of the pavement and sensitivity analysis of the fundamental frequencies are introduced. The results show that the fundamental frequencies at the center of the pavement are basically the same as those at the far side on the cross section; the fundamental frequencies in the depth direction remain constant, but the amplitude of the frequency spectrum decreases. The effect of the soil resilient modulus on the vibration frequency is most significant. The fundamental frequency increases from 6.02 to 10.55 Hz when the soil dynamic resilient modulus changes from 91 to 303 MPa. The effects of surface thickness and base thickness on the vibration frequency are less significant, and there is minimal influence when changing the dynamic elastic moduli of the surface layer or base layer. Field test results indicate the efficacy of the method of vibration measurement at the pavement surface to estimate the layer modulus of airport pavement.
Key words: Airport pavement; Non-destructive test; Aircraft-pavement coupling; Fundamental frequency; Acceleration; Finite
element model https://doi.org/10.1631/jzus.A2000378 CLC number: U8; TU43
1 Introduction
It is important to monitor the condition of civil
infrastructure during its service life. Two different methods can be used to evaluate the in-situ condition
of highway and airport pavements. The first is based on nondestructive evaluation (NDE) at different times in the service life of the pavement. The second is to install sensors within the pavement structure or on the surface to measure pavement responses continuously.
Heavy weight deflectometer (HWD) is the most common NDE technology used for evaluating the bearing capacity of airport pavements. However, there are three disadvantages in the testing process. First, the HWD test must be carried out when runways are closed. Therefore, in busy airports it is difficult to
Journal of Zhejiang University-SCIENCE A (Applied Physics & Engineering)
ISSN 1673-565X (Print); ISSN 1862-1775 (Online)
www.jzus.zju.edu.cn; link.springer.com
E-mail: [email protected]
‡ Corresponding author
* Project supported by the National Natural Science Foundation of China (No. 51178456) and the Fundamental Research Funds for the Central Universities (No. 3122017039), China
ORCID: Qian DONG, https://orcid.org/0000-0003-0294-6521 © Zhejiang University Press 2021

Dong et al. / J Zhejiang Univ-Sci A (Appl Phys & Eng) 2021 22(9):736-750 737
find a suitable time to evaluate the bearing capacity of runways. Second, the impact load induced by drop-ping a hammer does not accurately represent the total load of an aircraft in terms of the resulting responses in the pavement. Third, it is difficult to back-calculate the modulus of each pavement layer based on the measured deflection basin. For example, the dynamic deflection basin caused by the impact of a drop hammer is regarded as a static deflection basin curve in the back-calculation, which leads to problems with the reliability of HWD test (Tarefder and Ahmed, 2014; Hamim et al., 2018; Wang et al., 2021). Alt-hough different back-calculation methods have been proposed using an iteration-based approach or a soft computing method (Fileccia Scimemi et al., 2016; Li and Wang, 2018, 2019; Wang et al., 2019; Bazi et al., 2020), the accuracy of back-calculation is still not satisfactory.
In traditional instrumentation, pavement condi-tion was monitored through the use of different types of sensors embedded during construction, such as strain gauges, pressure cells, and temperature sensors. Based on the responses of the instrumentation, the effect of the pavement material or loading on pave-ment stress and strain responses can be evaluated. As demonstrated through pavement test tracks, in-situ instrumentation can provide valuable information for mechanistic design, performance evaluation, and maintenance planning of highway and airport pave-ments (Rollings and Pittman, 1992; Al-Qadi et al., 2004, 2010; Al-Qadi and Wang, 2012; Wang et al., 2013; Khan et al., 2020). However, this method is not applicable for in-service roads because the sensors need to be placed in the pavement by excavation.
On the other hand, pavement condition can be evaluated by measured acceleration using accel-erometers mounted on the pavement surface. The time history of acceleration data has been used for evaluation of pavement responses and measurement of axle loads. Zhang et al. (2017) measured frequency spectra of vertical acceleration for asphalt slabs under different loading scenarios and found that the dy-namic response of pavement structures provided ac-tual field information, helped with damage prediction, and had the potential to distinguish between damaged and intact pavements. Jiang et al. (2021) introduced a back-calculation method for road excitation of a monorail. Comparison of experimental and accelera-
tion data with the simulated results of the back- calculation process was precise enough. Levenberg (2012) collected the accelerations of a road under a vehicle at constant speed, and analyzed the meas-urements to infer the properties of the pavement layer. Ye et al. (2018) found that the acceleration extreme, time-domain signal waveform, frequency distribu-tion, and sum of squares of the Fourier amplitude could be potential indexes for evaluating the service condition of roadways. Nielsen et al. (2020) pasted four accelerometers on a pavement and recorded the vertical acceleration traces resulting from several nearby passes of a truck with known characteristics. An interpretation method for inferring the mechanical properties of the pavement system based on the rec-orded accelerations was demonstrated. Liu et al. (2018) proposed a specific computational program, SAFEM, based on semi-analytical finite element method to overcome the difficulty that stationary loads do not represent real traffic loading.
Few studies have used vibration analysis and acceleration measurement on the pavement surface in an airport to evaluate the bearing capacity of the runway. 2 Objective
In this study, we developed a new method to
analyze the bearing capacity of airport pavements through a comprehensive vibration analysis and finite element updating. The test method can be conducted during normal aircraft operations, thereby overcom-ing shortcomings of existing tests, such as the need for flight suspension and simulated loading.
3 Implementation steps of the test method
3.1 Technical roadmap
The specific processes are shown in Fig. 1. Between aircraft movements, acceleration sensors are installed on the pavement surface far from the cen-terline. Then, vibration accelerations through the pavement are collected during aircraft taxiing. An initial finite element model (FEM) of the runway can be established using ANASYS according to design and construction data. However, because of errors in

Dong et al. / J Zhejiang Univ-Sci A (Appl Phys & Eng) 2021 22(9):736-750 738
construction and the occurrence of fatigue damage during service, the initial FEM will not reflect the true state. Therefore, finite element updating is required based on fundamental frequencies obtained by fast Fourier transformation (FFT) of measured accelera-tions. As parameters obtained from inversion of each sensor may be different, the ordinary least square method is proposed to ensure the acquisition of the actual FEM.
3.2 Means of test technique
The BDI-STS-WIFI structural testing system (Fig. 2), produced in the USA is adopted to achieve the dynamic testing technology. The system includes various sensors (acceleration, strain, and tilt), a wireless data transmission node, a wireless base sta-tion, and data collection terminals. In this method, only the acceleration sensors are used to collect the acceleration of the pavement, from which the fun-damental frequencies can be obtained by FFT.
3.3 Key problems
1. Aircraft dynamic load Calculating the aircraft dynamic load accurately
is a precondition of bearing capacity evaluation, and needs to be analyzed carefully. The force imposed on the pavement by aircraft is influenced by the rough-ness of the deck and lift. In this study, this was ob-tained by solving the dynamic balance equations of the aircraft-pavement coupled system.
2. Finite element model updating The vibration responses across and along the
runway are analyzed and a sensitivity analysis of frequencies is carried out to make sure FEM updating is scientific and effective.
3. Different model updating results Data collected at different positions are used for
model updating, and different updating results may be obtained. The ordinary least square method is pro-posed to ensure that the results of model updating are objective.
4 Aircraft-pavement coupled system
4.1 Aircraft loading model
In highway engineering, vehicle dynamic loads are obtained mostly by the coupled vehicle-road sys-tem (Su, 2008; Lu et al., 2016; Jie et al., 2017) and vehicle-bridge system (Zou et al., 2016; Li et al., 2018). A coupling analysis of the aircraft-pavement system is proposed in this paper.
Boeing aircraft with single-axle and double- wheels were used for the field test, and the following assumptions were set. First, the load distribution co-efficient of the main landing gear was up to 0.95 (CAAC, 2009, 2010), and the nose landing gear was ignored. The whole model of the aircraft was simpli-fied as a mass-spring system with only two main landing gears and four degrees of freedom (Fig. 3). Second, the structures above the shock absorber were defined as a suspended system, and those under the shock absorber were defined as a non-suspended
Fig. 2 Structural testing system Fig. 1 Flow chart of the proposed test method

Dong et al. / J Zhejiang Univ-Sci A (Appl Phys & Eng) 2021 22(9):736-750 739
system. Third, multiple wheels on one landing gear of the aircraft were considered as an equivalent single wheel. Fourth, the stiffness of landing gear shock absorbers and wheels was considered as constant, and the damping force was assumed to be linear in rela-tion to the taxiing speed (Li et al., 2017).
Z0 represents the vertical displacement at the geometric center of the airframe; Z1 and Z2 represent vertical displacements of the fuselage at the shock absorbers, respectively; θz represents the rollover angle of the fuselage; Ly and Lz represent the distances from the left and right main landing gears to the center of the model.
The vibration differential equations are shown in Eq. (1). The random dynamic loads generated by the main landing gear of the aircraft applied on the pavement are shown in Eq. (2).
xHZ 1 3 xHZ 1 3
xHZ 2 4 xHZ 2 4
0 0 xHZ 1 3 xHZ 1 3
xHZ 2 4 xHZ 2 4
1 3 xHZ 1 3 xHZ 1 3
LHZ 3 LHZ 3 LHZ 5 LHZ 5
2 4 xHZ 2 4 xHZ
0,
0,
,
z z z
y
J L K Z Z C Z Z
L K Z Z C Z Z
M Z K Z Z C Z Z
K Z Z C Z Z
M Z K Z Z C Z Z
K Z C Z K Z C Z
M Z K Z Z C Z
2 4
LHZ 4 LHZ 4 LHZ 6 LHZ 6 ,
Z
K Z C Z K Z C Z
(1)
d1 LHZ 3 5 LHZ 3 5
d2 LHZ 4 6 LHZ 4 6
,
,
P K Z Z C Z Z
P K Z Z C Z Z
(2)
where Z3 and Z4 are displacements at two main land-ing gears; Z5 and Z6 are wheel displacements caused by an uneven pavement; KxHZ and CxHZ are the stiffness and damping of the suspended system; KLHZ and CLHZ are the stiffness and damping of the non-suspended system, respectively; M1 and M2 are the masses of the non-suspended system; M0 represents the mass of suspended parts; Jz is the moment of inertia of aircraft around Z-axis; Pd1 and Pd2 are the random dynamic loads generated by the left and right main landing gears of the aircraft, respectively.
4.2 Structure dyanamic analysis
The balance equation of the pavement model is shown in Eq. (3).
, my cy ky p (3)
where m, c, and k represent the mass matrix, damping matrix, and stiffness matrix, respectively. y, y , and
y represent the displacement matrix, velocity matrix,
and acceleration matrix, respectively. p represents the aircraft load matrix, including the random dynamic and the static loads.
According to the structural dynamic mode su-perposition method, Eq. (4) can be expressed as linear independent differential equations of the n-order mode:
2d s2 ,
1, 2, , ,n n n n n n n nA A A P x P P
n N
(4)
where Pn is the generalized force of the nth order mode shape, including static and dynamic loads of aircraft; An is the generalized coordinates; ξn is the damping ratio for the nth mode; ωn is the circular frequency for the nth mode; ϕn(x) is the nth order mode shape function at a horizontal position of pavement; Pd represents the random dynamic loads; Ps represents the static loads of aircraft; N is the number of freedom degrees of structure.
4.3 Aircraft-pavement coupling analysis
When an aircraft is taxiing on the pavement, the wheel and the pavement surface always stay in con-tact. The vertical displacements at aircraft tires are the sum of the vertical vibration displacements generated by the aircraft and surface roughness (Eq. (5)):
Fig. 3 Four degrees of freedom of aircraft model v represents the taxiing speed of aircraft

Dong et al. / J Zhejiang Univ-Sci A (Appl Phys & Eng) 2021 22(9):736-750 740
w1
,N
n n ix xn
Z Z y Z A x
(5)
where Z(x) is a function representing pavement roughness at any point in the horizontal direction; y is vertical displacement caused by pavement vibration.
The differential equations of the aircraft- pavement coupling system can be expressed by
1
1
0 0 xHZ 1 3 xHZ 1 3
xHZ 2 4 xHZ 2 4
xHZ 1 3 xHZ 1 3
xHZ 2 4 xHZ 2 4
1 3 xHZ 3 1 xHZ 3 1 LHZ 3
LHZ 3 LHZ 11
LHZ
0,
0,
z z z
y
N
n nxn
nx
M Z K Z Z C Z Z
K Z Z C Z Z
J L K Z Z C Z Z
L K Z Z C Z Z
M Z K Z Z C Z Z K Z
C Z C Z A x
K Z A
2
2
1
1
11
2 4 xHZ 4 2 xHZ 4 2 LHZ 4
LHZ 4 LHZ 21
LHZ 21
21
LHZ 3 LHZ 11
LHZ 3 LHZ1
,
,
2
N
nn
N
n nxn
N
n nxn
n n n n n n n
N
n nxn
N
nxn
x
M Z K Z Z C Z Z K Z
C Z C Z A x
K Z A x
A A A x
K Z K Z A x
C Z C Z A
2
2
1 s1
22
LHZ 4 LHZ 21
LHZ 4 LHZ 2 s21
,
2
,
1, 2, , ,
n
n n n n n n n
N
n nxn
N
n nxn
x P
A A A x
K Z K Z A x
C Z C Z A x P
n N
(6)
where Ps1 and Ps2 are the static loads generated by the left and right main landing gears, respectively.
The random dynamic loads of aircraft applied on the pavement surface were calculated at different taxiing speeds. The main parameters of the aircraft
(Table 1) were obtained from previous studies (Ling et al., 2017) and the Aeronautical Materials Division of Shenzhen Airlines, China. The random dynamic loads were superimposed with aircraft static loads, excluding the lift force of the aircraft (Fig. 4).
When the aircraft is taxiing on the pavement at a speed of more than 15 m/s, the dynamic load of the aircraft decreases as the taxiing speed increases (Figs. 4b–4d). Because the lift also increases with increasing taxiing speed, its increase is greater than the increase of dynamic load caused by pavement roughness. When the speed keeps constant, the air-craft load increases significantly with the increase of international roughness index (IRI), as shown in Figs. 4a and 4d. This shows that as the flatness of the pavement deteriorates, the aircraft random load ap-plied on it will also increase, which is consistent with existing research conclusions.
5 Finite element model of runway pavement The concrete pavement was simplified as a
three-layer elastic system composed of a surface layer, a base layer, and a soil foundation. Materials in each layer were assumed to be elastic, isotropic, and homogeneous. They were characterized by their dy-namic elastic modulus and Poisson’s ratio (Table 2). Dynamic modulus has been gradually applied to the dynamic response of a rigid pavement, and proved that the ratio between the dynamic modulus and the static modulus ranges from 1.5 to 3 (Irwin, 1977). Correlations between the dynamic and static moduli
Table 1 Main parameters of the aircraft
Parameter Value
Mass of suspension part, m0 (kg) 59 033
Moment of inertia around Z-axis, Jz (kg·m2) 540 302
Mass of non-suspended part, m2 (kg) 888
Stiffness coefficient of suspension, KxHZ (N/m) 614 264
Damping coefficient of suspension, CxHZ (N·s/m) 625 000
Stiffness coefficient of non-suspension, KLHZ (N/m)
4 000 000
Damping coefficient of non-suspension, CLHZ (N·s/m)
4066
Distance between center of gravity and the right tire, Lz (m)
2.86
Distance between center of gravity and the left tire, Ly (m)
2.86

Dong et al. / J Zhejiang Univ-Sci A (Appl Phys & Eng) 2021 22(9):736-750 741
of each layer were obtained from the literature (Zeng, 2003; Sha and Hu, 2008; AASHTO, 2012).
In this paper, the pavement was 45 m wide. Significant displacement of the pavement in the di-rection of moving aircraft was found in a range of 15 m under the aircraft static load (Zhang and Dong, 2012). The length of aircraft moving load needed was 15 m and the length of the model in the taxiing di-rection was determined as 25 m considering the boundary effect. The acceleration of the pavement was not affected by the soil foundation boundary when the thickness of the soil foundation was greater than 13 m after trial calculation, and the depth was selected as 15 m. The mesh size was set as 0.10 m× 0.10 m×0.18 m in the surface layer, 0.30 m×0.30 m×
0.20 m in the base layer, and 0.30 m×0.30 m×0.50 m in the soil foundation, respectively.
There are joints between concrete pavement slabs to prevent cracks due to temperature-induced stress. The shear force transmission between the slabs was simulated by a spring unit. By adjusting the spring stiffness, the joint load transfer capacity could be adjusted. The spring stiffness was calculated based on the contribution area method (Ling et al., 2019). According to the capacity evaluation method (Ling et al., 2019), the static load of a B737-800 was applied at a distance of 15 cm from the joint. By comparing the displacements at the corresponding positions of the adjacent slab, the load transfer coefficient was 90.56%.
Table 2 Parameters of the pavement structure and materials
Structural layer Thickness
(m) Elastic modulus
(MPa) Dynamic elastic modulus (MPa)
Density (kg/m3)
Poisson’s ratio
Concrete slab 0.36 36000 49819 2500 0.15
Cement stabilized base 0.40 1500 2692 2000 0.25
Soil subgrade 15 80 242 1800 0.35
Fig. 4 Random dynamic loads with time T (one landing gear) (a) IRI=1 m/km, v=40 m/s; (b) IRI=2 m/km, v=10 m/s; (c) IRI=2 m/km, v=20 m/s; (d) IRI=2 m/km, v=40 m/s
0 1 2 3 4 5
2.2x10⁵
2.3x10⁵
2.3x10⁵
2.3x10⁵
2.3x10⁵
2.3x10⁵
2.4x10⁵
(a)
Dyn
amic
load
of a
ircra
ft (N
)
T (s)
IRI=1, v=40 m/s
0 5 10 15 202.8x10⁵
2.9x10⁵
2.9x10⁵
3.0x10⁵
3.0x10⁵
3.0x10⁵
(b)
Dyn
amic
load
of a
ircra
ft (N
)
T (s)
IRI=2, v=10 m/s
0 2 4 6 8 102.5x10⁵
2.5x10⁵
2.5x10⁵
2.6x10⁵
2.6x10⁵
2.7x10⁵
2.8x10⁵
(c)
Dyn
amic
load
of a
ircr
aft (
N)
T (s)
IRI=2, v=20 m/s
0 1 2 3 4 5
2.2x10⁵
2.3x10⁵
2.3x10⁵
2.4x10⁵
2.4x10⁵
2.5x10⁵
(d)
Dyn
amic
load
of ai
rcra
ft (N
)
T (s)
IRI=2, v=40 m/s
Dong et al. / J Zhejiang Univ-Sci A (Appl Phys & Eng) 2021 22(9):736-750 742
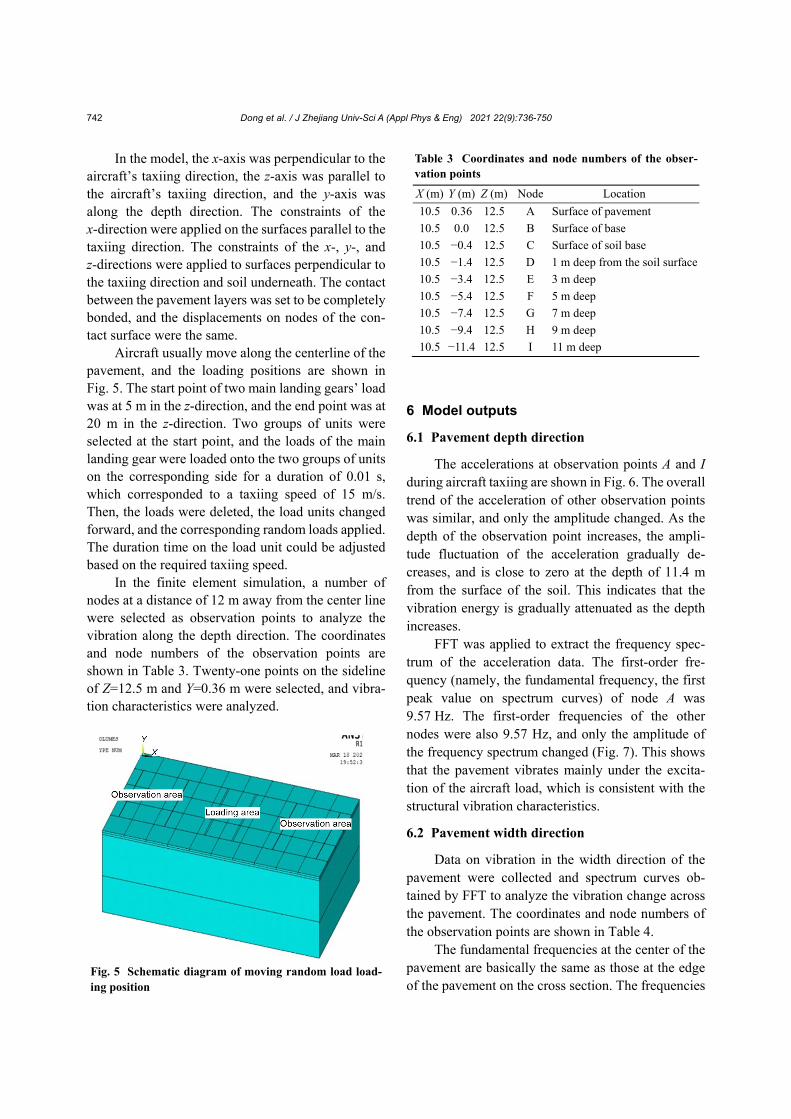
In the model, the x-axis was perpendicular to the aircraft’s taxiing direction, the z-axis was parallel to the aircraft’s taxiing direction, and the y-axis was along the depth direction. The constraints of the x-direction were applied on the surfaces parallel to the taxiing direction. The constraints of the x-, y-, and z-directions were applied to surfaces perpendicular to the taxiing direction and soil underneath. The contact between the pavement layers was set to be completely bonded, and the displacements on nodes of the con-tact surface were the same.
Aircraft usually move along the centerline of the pavement, and the loading positions are shown in Fig. 5. The start point of two main landing gears’ load was at 5 m in the z-direction, and the end point was at 20 m in the z-direction. Two groups of units were selected at the start point, and the loads of the main landing gear were loaded onto the two groups of units on the corresponding side for a duration of 0.01 s, which corresponded to a taxiing speed of 15 m/s. Then, the loads were deleted, the load units changed forward, and the corresponding random loads applied. The duration time on the load unit could be adjusted based on the required taxiing speed.
In the finite element simulation, a number of nodes at a distance of 12 m away from the center line were selected as observation points to analyze the vibration along the depth direction. The coordinates and node numbers of the observation points are shown in Table 3. Twenty-one points on the sideline of Z=12.5 m and Y=0.36 m were selected, and vibra-tion characteristics were analyzed.
6 Model outputs
6.1 Pavement depth direction
The accelerations at observation points A and I during aircraft taxiing are shown in Fig. 6. The overall trend of the acceleration of other observation points was similar, and only the amplitude changed. As the depth of the observation point increases, the ampli-tude fluctuation of the acceleration gradually de-creases, and is close to zero at the depth of 11.4 m from the surface of the soil. This indicates that the vibration energy is gradually attenuated as the depth increases.
FFT was applied to extract the frequency spec-trum of the acceleration data. The first-order fre-quency (namely, the fundamental frequency, the first peak value on spectrum curves) of node A was 9.57 Hz. The first-order frequencies of the other nodes were also 9.57 Hz, and only the amplitude of the frequency spectrum changed (Fig. 7). This shows that the pavement vibrates mainly under the excita-tion of the aircraft load, which is consistent with the structural vibration characteristics.
6.2 Pavement width direction
Data on vibration in the width direction of the pavement were collected and spectrum curves ob-tained by FFT to analyze the vibration change across the pavement. The coordinates and node numbers of the observation points are shown in Table 4.
The fundamental frequencies at the center of the pavement are basically the same as those at the edge of the pavement on the cross section. The frequencies
Fig. 5 Schematic diagram of moving random load load-ing position
Table 3 Coordinates and node numbers of the obser-vation points
X (m) Y (m) Z (m) Node Location
10.5 0.36 12.5 A Surface of pavement
10.5 0.0 12.5 B Surface of base
10.5 −0.4 12.5 C Surface of soil base
10.5 −1.4 12.5 D 1 m deep from the soil surface
10.5 −3.4 12.5 E 3 m deep
10.5 −5.4 12.5 F 5 m deep
10.5 −7.4 12.5 G 7 m deep
10.5 −9.4 12.5 H 9 m deep
10.5 −11.4 12.5 I 11 m deep

Dong et al. / J Zhejiang Univ-Sci A (Appl Phys & Eng) 2021 22(9):736-750 743
are 9.77 Hz between X=14.5 m and X=28.5 m, only 2.05% lower at the far-edge than in the center.
7 Sensitivity analysis of vibration frequency A sensitivity analysis of factors influencing the
fundamental frequency needed to be conducted to determine the key parameters of the FEM for future analysis. The change of influencing factors was de-termined according to the actual pavement structure in design specification.
7.1 Effect of subgrade modulus
The soil base resilient modulus E0 was changed from 91 to 303 MPa, and the resulting change of the fundamental frequency at point A is shown in Fig. 8. As the resilient modulus increases, the fundamental frequency increases up to 74.4%, from 6.05 to 10.55 Hz. When the dynamic resilient modulus of the soil foundation increases, the response depth in the soil decreases under the same aircraft. That is, the depth of the soil base affected by vibration decreases. In addition, the increase of the overall stiffness of the pavement structure leads to an increase in the vibra-tion frequency. This indicates that the dynamic resil-ient modulus of the soil foundation is a key factor in determining the overall stiffness of the pavement structure. Therefore, the resilient modulus of soil
Table 4 Frequencies of 21 nodes on the surface
Coordinate Fundamental frequency (Hz) 45.0, 0.36, 12.5 9.57 42.5, 0.36, 12.5 9.57 39.5, 0.36, 12.5 9.57 37.5, 0.36, 12.5 9.57 35.5, 0.36, 12.5 9.57 34.5, 0.36, 12.5 9.57 32.5, 0.36, 12.5 9.57 30.5, 0.36, 12.5 9.57 28.5, 0.36, 12.5 9.77 24.5, 0.36, 12.5 9.77 22.5, 0.36, 12.5 9.77 20.5, 0.36, 12.5 9.77 16.5, 0.36, 12.5 9.77 14.5, 0.36, 12.5 9.77 12.5, 0.36, 12.5 9.57 10.5, 0.36, 12.5 9.57 9.5, 0.36, 12.5 9.57 7.5, 0.36, 12.5 9.57 5.5, 0.36, 12.5 9.57 2.5, 0.36, 12.5 9.57 0, 0.36, 12.5 9.57
Fig. 6 Acceleration (A) curves of the observation points A(a) and I (b) during aircraft taxiing
0 1 2 3 4 5 6 7
-0.3
-0.2
-0.1
0.0
0.1
0.2
(a)
Acc
eler
atio
n (m
/s2 )
T (s)
Position A
A (
m/s
2)
0 1 2 3 4 5 6 7
-0.2
-0.1
0.0
0.1
0.2
(b)
Acc
eler
atio
n (m
/s2 )
T (s)
Position I
A (
m/s
2)
Fig. 7 Acceleration spectrum curves at node A (pavement surface) (a) and nodes B and I (at different depths in the pavement) (b)

Dong et al. / J Zhejiang Univ-Sci A (Appl Phys & Eng) 2021 22(9):736-750 744
foundation should be considered as a key parameter to modify the FEM using the measured fundamental frequency of the pavement.
7.2 Effect of concrete and base layer moduli
When the dynamic elastic modulus of surface layer E1 was changed from 38 to 66 GPa, the vibration fundamental frequency at point A increased by 2.73%, from 9.51 to 9.77 Hz (Fig. 9a). When the dynamic elastic modulus of base layer E2 was in-creased from 1200 to 4200 MPa, the vibration fun-damental frequency at point A increased by 1.05%, from 9.56 to 9.66 Hz (Fig. 9b).
7.3 Effect of pavement layer thickness
When the thickness of the surface layer was changed from 28 to 48 cm, the fundamental frequency decreased linearly by 9.65%, from 10.16 to 9.18 Hz (Fig. 10a). When the thickness of the base layer was changed from 20 to 50 cm, the fundamental frequency decreased by 5.25%, from 9.90 to 9.38 Hz (Fig. 10b). This indicates that the influence of the base layer thickness on the fundamental frequency is less sig-nificant than that of the surface layer thickness.
8 Field test and analysis
8.1 Sensor instrumentation in an airport pavement
Field tests were conducted at an airport in Yunnan Province, China. The cement concrete run-way at the airport is 2350 m long and 45 m wide. The airport is classed as 4C and can be used for main-stream aircraft in civil aviation, such as the Boeing 737 and Airbus A320. According to the pavement structure design, the thickness of the surface is 34 cm and its elastic modulus is 33 000 MPa. The thickness
8.6
8.8
9.0
9.2
9.4
9.6
9.8
10.0
10.2
0.26 0.30 0.34 0.38 0.42 0.46 0.50
Fun
dam
enta
l fr
eque
ncy
(Hz)
Pavement thickness (m)
(a)
9.3
9.4
9.5
9.6
9.7
9.8
9.9
10.0
0.1 0.2 0.3 0.4 0.5 0.6
Fun
dam
enta
l fr
eque
ncy
(Hz)
Base layer thickness (m)(b)
Fig. 10 Effect of concrete (a) and base layer (b) thick-nesses on frequency
0
2
4
6
8
10
12
80 120 160 200 240 280 320
Fun
dam
enta
l fr
eque
ncy
(Hz)
Resilient modulus (MPa)
Fig. 8 Effect of soil-based dynamic elastic modulus on fundamental frequency
9.3
9.4
9.5
9.6
9.7
9.8
9.9
10.0
36 40 44 48 52 56 60 64 68
Fun
dam
enta
l fr
eque
ncy
(Hz)
Elastic modulus of surface layer (GPa)
(a)
9.3
9.4
9.5
9.6
9.7
9.8
9.9
10.0
1000 2000 3000 4000 5000
Fun
dam
enta
l fr
eque
ncy
(Hz)
Elastic modulus of base layer (MPa)
(b)
Fig. 9 Effect of the dynamic elastic moduli of concrete (a)and base layer (b) on frequency
Dong et al. / J Zhejiang Univ-Sci A (Appl Phys & Eng) 2021 22(9):736-750 745
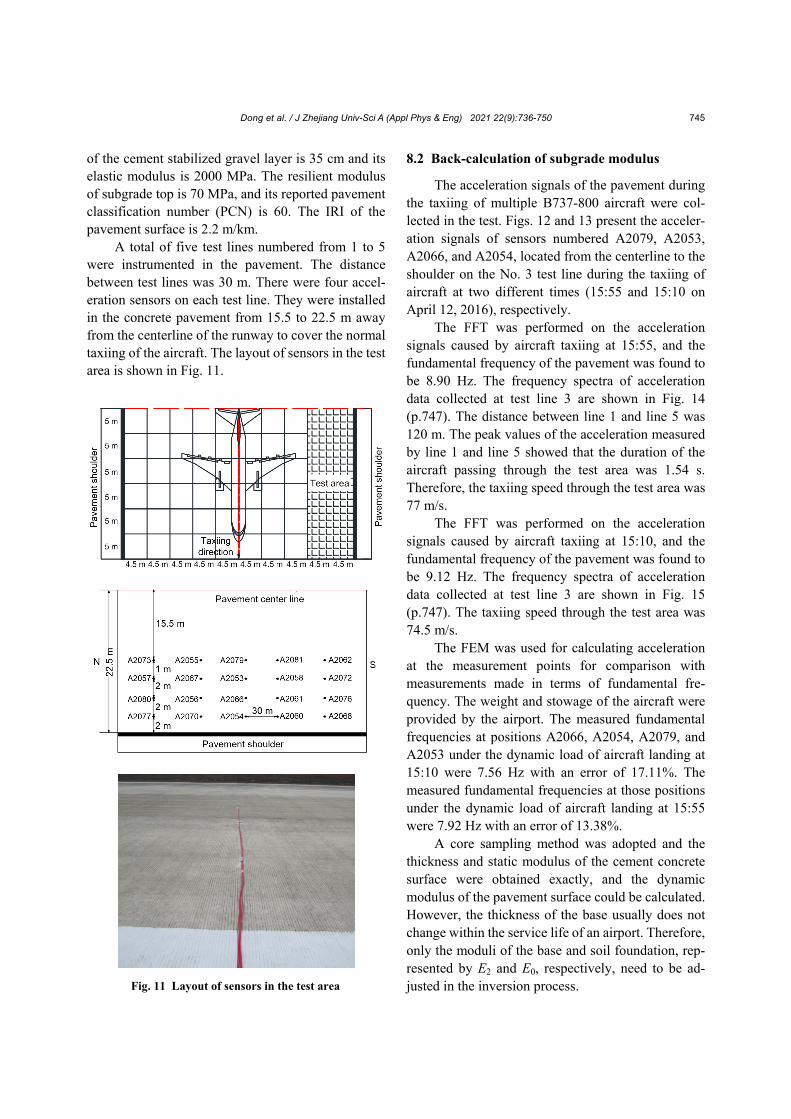
of the cement stabilized gravel layer is 35 cm and its elastic modulus is 2000 MPa. The resilient modulus of subgrade top is 70 MPa, and its reported pavement classification number (PCN) is 60. The IRI of the pavement surface is 2.2 m/km.
A total of five test lines numbered from 1 to 5 were instrumented in the pavement. The distance between test lines was 30 m. There were four accel-eration sensors on each test line. They were installed in the concrete pavement from 15.5 to 22.5 m away from the centerline of the runway to cover the normal taxiing of the aircraft. The layout of sensors in the test area is shown in Fig. 11.
8.2 Back-calculation of subgrade modulus
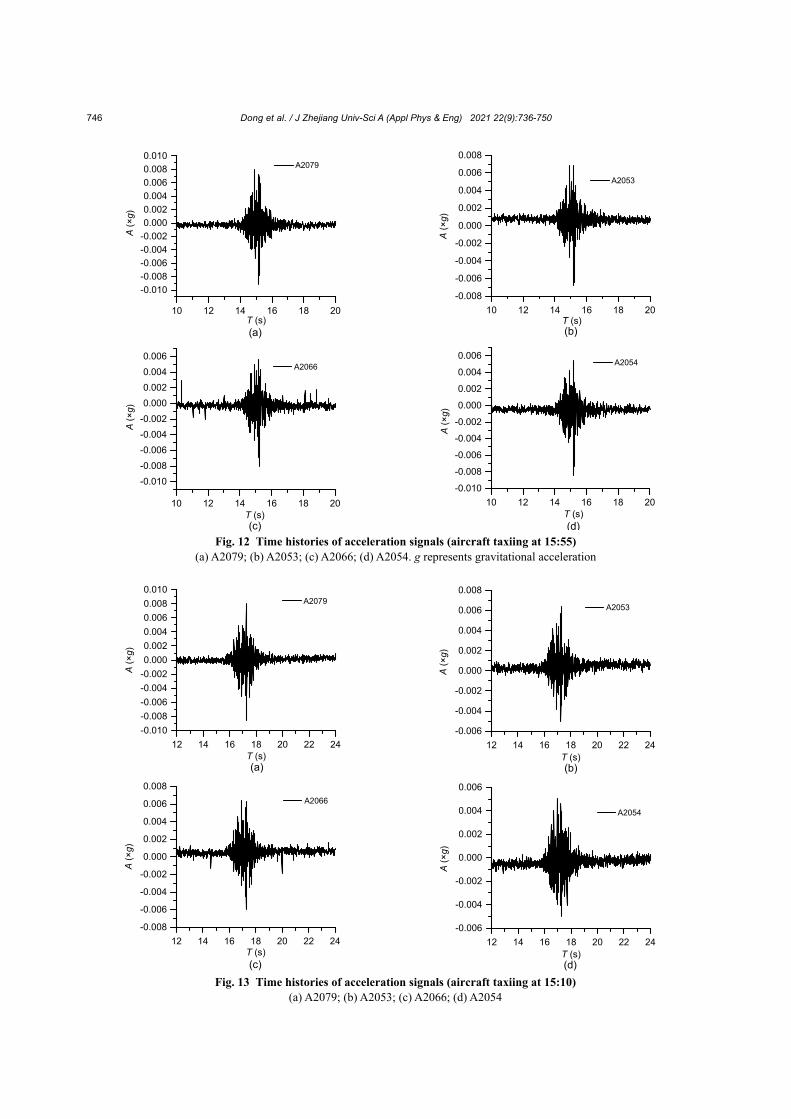
The acceleration signals of the pavement during the taxiing of multiple B737-800 aircraft were col-lected in the test. Figs. 12 and 13 present the acceler-ation signals of sensors numbered A2079, A2053, A2066, and A2054, located from the centerline to the shoulder on the No. 3 test line during the taxiing of aircraft at two different times (15:55 and 15:10 on April 12, 2016), respectively.
The FFT was performed on the acceleration signals caused by aircraft taxiing at 15:55, and the fundamental frequency of the pavement was found to be 8.90 Hz. The frequency spectra of acceleration data collected at test line 3 are shown in Fig. 14 (p.747). The distance between line 1 and line 5 was 120 m. The peak values of the acceleration measured by line 1 and line 5 showed that the duration of the aircraft passing through the test area was 1.54 s. Therefore, the taxiing speed through the test area was 77 m/s.
The FFT was performed on the acceleration signals caused by aircraft taxiing at 15:10, and the fundamental frequency of the pavement was found to be 9.12 Hz. The frequency spectra of acceleration data collected at test line 3 are shown in Fig. 15 (p.747). The taxiing speed through the test area was 74.5 m/s.
The FEM was used for calculating acceleration at the measurement points for comparison with measurements made in terms of fundamental fre-quency. The weight and stowage of the aircraft were provided by the airport. The measured fundamental frequencies at positions A2066, A2054, A2079, and A2053 under the dynamic load of aircraft landing at 15:10 were 7.56 Hz with an error of 17.11%. The measured fundamental frequencies at those positions under the dynamic load of aircraft landing at 15:55 were 7.92 Hz with an error of 13.38%.
A core sampling method was adopted and the thickness and static modulus of the cement concrete surface were obtained exactly, and the dynamic modulus of the pavement surface could be calculated. However, the thickness of the base usually does not change within the service life of an airport. Therefore, only the moduli of the base and soil foundation, rep-resented by E2 and E0, respectively, need to be ad-justed in the inversion process. Fig. 11 Layout of sensors in the test area
Dong et al. / J Zhejiang Univ-Sci A (Appl Phys & Eng) 2021 22(9):736-750 746
Fig. 12 Time histories of acceleration signals (aircraft taxiing at 15:55) (a) A2079; (b) A2053; (c) A2066; (d) A2054. g represents gravitational acceleration
10 12 14 16 18 20
-0.010
-0.008
-0.006
-0.004
-0.002
0.000
0.002
0.004
0.006
0.008
0.010
(a)
Acc
eler
atio
n (g
)
T (s)
A2079
A (
×g)
10 12 14 16 18 20
-0.010
-0.008
-0.006
-0.004
-0.002
0.000
0.002
0.004
0.006
(c)
Acc
eler
atio
n (g
)
T (s)
A2066
A (
×g)
10 12 14 16 18 20
-0.008
-0.006
-0.004
-0.002
0.000
0.002
0.004
0.006
0.008
(b)
Acc
eler
atio
n (g
)
T (s)
A2053
A (
×g)
10 12 14 16 18 20
-0.010
-0.008
-0.006
-0.004
-0.002
0.000
0.002
0.004
0.006
(d)
Acc
eler
atio
n (g
)
T (s)
A2054
A (
×g)
Fig. 13 Time histories of acceleration signals (aircraft taxiing at 15:10) (a) A2079; (b) A2053; (c) A2066; (d) A2054
12 14 16 18 20 22 24
-0.010
-0.008
-0.006
-0.004
-0.002
0.000
0.002
0.004
0.006
0.008
0.010
(a)
Acc
eler
atio
n (g
)
T (s)
A2079
A (
×g)
12 14 16 18 20 22 24
-0.008
-0.006
-0.004
-0.002
0.000
0.002
0.004
0.006
0.008
(c)
Acc
eler
atio
n (g
)
T (s)
A2066
A (
×g)
12 14 16 18 20 22 24
-0.006
-0.004
-0.002
0.000
0.002
0.004
0.006
0.008
(b)
Acc
eler
atio
n (g
)
T (s)
A2053
A (
×g)
12 14 16 18 20 22 24
-0.006
-0.004
-0.002
0.000
0.002
0.004
0.006
(d)
Acc
eler
atio
n (g
)
T (s)
A2054
A (
×g)

Dong et al. / J Zhejiang Univ-Sci A (Appl Phys & Eng) 2021 22(9):736-750 747
Based on the above analysis, the influence of the
soil modulus on the fundamental frequency was most
significant, and was the main factor affecting the fundamental frequency of the pavement. It was the primary factor to adjust among the parameters in the FEM, based on the measured frequency in the field test. The modulus of the base layer influenced the fundamental frequency more slightly, and could be used for fine-tuning the parameters of the FEM.
The starting point is choosing a trial pair of layer moduli, E2 and E0. Next, acceleration traces and fundamental frequencies are calculated for each of the four sensors. As a means of simultaneously consid-ering the signals from all four sensors, the ordinary least square method was adopted to obtain the least residual squared sum of frequencies of four sensors on a test line and match the fundamental frequency from measurements and calculation by adjusting E2 and E0. The objective function is given as
2
c t2 0
1 t
, ,n
i i
i i
f ff E E
f
(7)
where fci represents the fundamental frequency cal-culated by FEM (Hz); fti represents the fundamental frequency from pavement test (Hz).
The parameters of the pavement obtained by core sampling and inversion are shown in Table 5. The dynamic elastic moduli of each layer were chosen in finite element calculation, so the moduli obtained by inversion (namely, moduli of the base and soil foundation) were dynamic and could be changed to static moduli.
When the dynamic resilience modulus of the soil foundation is 196 MPa (i.e. when the static resilience modulus is 65 MPa), and the dynamic elastic modulus of the cement stabilized base is 3435 MPa (i.e. when the static modulus is 2000 MPa), the calculated fre-quency is 8.96 Hz and the error is reduced to 1.75% after fitting by least squares. Build the airport FEM consisting of three layers with static modulus (Ta-ble 5), and calculate the displacements under the standard test load. The calculated displacements are close to displacements obtained by the Beckman beam method in a field test, which proves that the moduli obtained by inversion are credible. By ana-lyzing many passes and subsequently combining the individual results, the inferred moduli are expected to become more representative.
Fig. 14 Spectrum curves of four sensors on test line 3 (taxiing at 15:55) (a) A2079 (4-4) and A2053 (4-3); (b) A2066 (4-2) and A2054 (4-1)
Fig. 15 Spectrum curves of four sensors on test line 3 (taxiing at 15:10) (a) A2079 (4-4) and A2053 (4-3); (b) A2066 (4-2) and A2054 (4-1)

Dong et al. / J Zhejiang Univ-Sci A (Appl Phys & Eng) 2021 22(9):736-750 748
9 Conclusions An array of four accelerometers on each test line
was used on a pavement in a field experiment to rec-ord several passes of aircraft. Accelerations measured were used for pavement bearing capacity analysis. Conclusions can be summarized as follows:
1. Aircraft dynamic loads are obtained by solving dynamic balance equations of an aircraft-pavement coupled system. When the aircraft is taxiing on the same pavement at a speed of more than 15 m/s, the dynamic load of the aircraft decreases as the taxiing speed increases under the influence of lift. When the speed is constant (i.e. when the lift is unchanging), the aircraft load increases significantly with the increase of IRI.
2. The fundamental frequencies at the center of the pavement are basically the same as those at the far side of the pavement on the cross section; the first-order frequencies of nodes in the pavement in the depth direction stay the same, and only the amplitude of the frequency spectrum decreases.
3. The effect of the soil resilient modulus on the vibration frequency is most significant. When the soil resilient modulus changes from 91 to 303 MPa, the fundamental frequency increases by up to 74.4%, from 6.02 to 10.55 Hz. The effects of surface thick-ness and base thickness on the vibration frequency are less significant, and the effects of the elastic moduli of the surface layer and base layer are the least significant.
4. By comparing the fundamental frequencies of measured and calculated signals, back-calculated moduli are obtained. The credibility of the moduli has been proved by the Beckman beam method.
The results of our analysis show the potential of using surface acceleration to evaluate the structural
condition of a pavement. Future work needs to be conducted to validate the proposed analysis method with different pavement structures and loading conditions.
Contributors
Qian DONG designed the research, carried out the study, and wrote the first draft of the manuscript. Jian-hua WANG wrote the first draft of the manuscript, and revised and edited the final version. Xian-min ZHANG and Hao WANG helped to organize the manuscript. Jing-nan ZHAO revised and edited the final version.
Conflict of interest
Qian DONG, Jian-hua WANG, Xian-min ZHANG, Hao WANG, and Jing-nan ZHAO declare that they have no conflict of interest.
References AASHTO (American Association of State Highway and
Transportation Officials), 2012. Standard Specification for Classification of Soil and Soil Aggregate Mixtures for Highway Construction Purposes, AASHTO Designation: M 145-91 (2012). AASHTO, USA.
Al-Qadi IL, Wang H, 2012. Impact of wide-base tires on pavements: results from instrumentation measurements and modeling analysis. Transportation Research Record: Journal of the Transportation Research Board, 2304(1): 169-176. https://doi.org/10.3141/2304-19
Al-Qadi IL, Loulizi A, Elseifi M, et al., 2004. The Virginia smart road: the impact of pavement instrumentation on understanding pavement performance. Journal of the Association of Asphalt Paving Technologists, 73:427- 465.
Al-Qadi IL, Portas S, Coni M, et al., 2010. Runway instru-mentation and response measurements. Transportation Research Record: Journal of the Transportation Re-search Board, 2153(1):162-169. https://doi.org/10.3141/2153-18
Bazi G, Saboundjian S, Ullidtz P, et al., 2020. Performance of an airfield flexible pavement and a novel PCN determi-nation method. Journal of Transportation Engineering, Part B: Pavements, 146(1):04020002. https://doi.org/10.1061/JPEODX.0000154
CAAC (Civil Aviation Administration of China), 2009. Tech-nical Specifications of Aerodrome Pavement Evaluation and Management, MH/T5024-2009. CAAC, China (in Chinese).
CAAC (Civil Aviation Administration of China), 2010. Spec-ifications for Airports Cement Concrete Pavement De-sign, MH/T5004-2010. CAAC, China (in Chinese).
Fileccia Scimemi G, Turetta T, Celauro C, 2016. Backcalcu-lation of airport pavement moduli and thickness using the
Table 5 Parameters of the pavement obtained by core sampling and inversion
Structural layer Thickness
(m)
Static modulus (MPa)
Dynamic modulus (MPa)
Concrete slab 0.34 33 120 45 911
Cement stabilized base
0.35 2000 3435
Soil subgrade – 65 196

Dong et al. / J Zhejiang Univ-Sci A (Appl Phys & Eng) 2021 22(9):736-750 749
Lévy ant colony optimization algorithm. Construction and Building Materials, 119:288-295. https://doi.org/10.1016/j.conbuildmat.2016.05.072
Hamim A, Yusoff NIM, Ceylan H, et al., 2018. Comparative study on using static and dynamic finite element models to develop FWD measurement on flexible pavement structures. Construction and Building Materials, 176: 583-592. https://doi.org/10.1016/j.conbuildmat.2018.05.082
Irwin LN, 1977. Determination of pavement layer moduli from surface deflection data for pavement performance evalu-ation. Proceedings of the 4th International Conference on Structural Design of Asphalt Pavements, p.831-840.
Jiang YZ, Wu PB, Zeng J, et al., 2021. Simplified and rela-tively precise back-calculation method for the pavement excitation of the monorail. International Journal of Pavement Engineering, 22(4):480-497. https://doi.org/10.1080/10298436.2019.1623401
Jie L, Zheng L, Yao HL, et al., 2017. Evaluation of additional dynamic load generated by pavement unevenness using a vehicle-road coupled model. Journal of Vibration Engi-neering & Technologies, 5(6):597-604.
Khan ZH, Tarefder RA, Hasan MA, 2020. Field characteriza-tion of pavement materials using falling weight deflec-tometer and sensor data from an instrumented pavement section. Transportation Research Record: Journal of the Transportation Research Board, 2674(4):205-221. https://doi.org/10.1177/0361198120911926
Levenberg E, 2012. Inferring pavement properties using an embedded accelerometer. International Journal of Transportation Science and Technology, 1(3):229-246. https://doi.org/10.1260/2046-0430.1.3.229
Li MY, Wang H, 2018. Prediction of asphalt pavement re-sponses from FWD surface deflections using soft com-puting methods. Journal of Transportation Engineering, Part B: Pavements, 144(2):04018014. https://doi.org/10.1061/JPEODX.0000044
Li MY, Wang H, 2019. Development of ANN-GA program for backcalculation of pavement moduli under FWD testing with viscoelastic and nonlinear parameters. International Journal of Pavement Engineering, 20(4):490-498. https://doi.org/10.1080/10298436.2017.1309197
Li Y, Howcroft C, Neild SA, et al., 2017. Using continuation analysis to identify shimmy-suppression devices for an aircraft main landing gear. Journal of Sound and Vibra-tion, 408:234-251. https://doi.org/10.1016/j.jsv.2017.07.028
Li Y, Ma XL, Zhang W, et al., 2018. Updating time-variant dimension for complex traffic flows in analysis of vehicle–bridge dynamic interaction. Journal of Aero-space Engineering, 31(4):04018041. https://doi.org/10.1061/(ASCE)AS.1943-5525.0000859
Ling JM, Liu SF, Yuan J, et al., 2017. Comprehensive analysis of pavement roughness evaluation for airport and road
with different roughness excitation. Journal of Tongji University (Natural Science), 45(4):519-526 (in Chinese). https://doi.org/10.11908/j.issn.0253-374x.2017.04.009
Ling JM, Wei FL, Zhao HD, et al., 2019. Analysis of airfield composite pavement responses using full-scale acceler-ated pavement testing and finite element method. Con-struction and Building Materials, 212:596-606. https://doi.org/10.1016/j.conbuildmat.2019.03.336
Liu PF, Wang DW, Otto F, et al., 2018. Application of semi-analytical finite element method to evaluate asphalt pavement bearing capacity. International Journal of Pavement Engineering, 19(6):479-488. https://doi.org/10.1080/10298436.2016.1175562
Lu Z, Hu Z, Yao HL, et al., 2016. An analytical method for evaluating highway embankment responses with consid-eration of dynamic wheel-pavement interactions. Soil Dynamics and Earthquake Engineering, 83:135-147. https://doi.org/10.1016/j.soildyn.2016.01.016
Nielsen J, Levenberg E, Skar A, 2020. Inference of pavement properties with roadside accelerometers. Proceedings of the 9th International Conference on Maintenance and Rehabilitation of Pavements, p.719-728.
Rollings RS, Pittman DW, 1992. Field instrumentation and performance monitoring of rigid pavements. Journal of Transportation Engineering, 118(3):361-370. https://doi.org/10.1061/(asce)0733-947X(1992)118:3(361)
Sha AM, Hu LQ, 2008. Structural characteristics of semi-rigid base course material. China Journal of Highway and Transport, 21(4):1-5 (in Chinese).
Su SY, 2008. Dynamic Characteristics Analysis of Vehicle- road Coupled System Considering the Factor of Pave-ment Evenness. MS Thesis, Chongqing Jiaotong Univer-sity, Chongqing, China (in Chinese).
Tarefder RA, Ahmed MU, 2014. Modeling of the FWD de-flection basin to evaluate airport pavements. International Journal of Geomechanics, 14(2):205-213. https://doi.org/10.1061/(ASCE)GM.1943-5622.0000305
Wang H, Al-Qadi IL, Portas S, et al., 2013. Three-dimensional finite element modeling of instrumented airport runway pavement responses. Transportation Research Record: Journal of the Transportation Research Board, 2367(1): 76-83. https://doi.org/10.3141/2367-08
Wang H, Li MY, Szary P, et al., 2019. Structural assessment of asphalt pavement condition using backcalculated modu-lus and field data. Construction and Building Materials, 211:943-951. https://doi.org/10.1016/j.conbuildmat.2019.03.250
Wang H, Xie PY, Ji R, et al., 2021. Prediction of airfield pavement responses from surface deflections: comparison between the traditional backcalculation approach and the ANN model. Road Materials and Pavement Design, 22(9):1930-1945. https://doi.org/10.1080/14680629.2020.1733638

Dong et al. / J Zhejiang Univ-Sci A (Appl Phys & Eng) 2021 22(9):736-750 750
Ye ZJ, Lu Y, Wang LB, 2018. Investigating the pavement vibration response for roadway service condition evalua-tion. Advances in Civil Engineering, 2018:2714657. https://doi.org/10.1155/2018/2714657
Zeng S, 2003. Research on the Pavement Performance Evalu-ation and Analyze Methods. PhD Thesis, Central South University, Changsha, China (in Chinese).
Zhang XM, Dong Q, 2012. Displacement field study on the full width of rigid airport pavement to aircraft loadings. Applied Mechanics and Materials, 178-181:1611-1614. https://doi.org/10.4028/www.scientific.net/amm.178-181.1611
Zhang YN, Druta C, Wang LB, et al., 2017. Dynamic re-sponses of asphalt concrete slab under cyclic wheel loading using acceleration spectrum analysis. Construc-tion and Building Materials, 152:134-144. https://doi.org/10.1016/j.conbuildmat.2017.05.044
Zou QL, Deng L, Guo TD, et al., 2016. Comparative study of different numerical models for vehicle-bridge interaction analysis. International Journal of Structural Stability & Dynamics, 16(9):1550057. https://doi.org/10.1142/S0219455415500571