dynamic decision model of real estate investment portfolio
TRANSCRIPT

Research ArticleDynamic Decision Model of Real Estate Investment PortfolioBased on Wireless Network Communication and AntColony Algorithm
Ming Li1 and Yousong Wu 2
1Library, Fujian Institute of Engineering, Fuzhou, 350118 Fujian, China2School of Electronics and Information, Nanchang Institute of Technology, Nanchang, 330044 Jiangxi, China
Correspondence should be addressed to Yousong Wu; [email protected]
Received 7 August 2021; Accepted 2 September 2021; Published 9 October 2021
Academic Editor: Zhihan Lv
Copyright © 2021 Ming Li and Yousong Wu. This is an open access article distributed under the Creative Commons AttributionLicense, which permits unrestricted use, distribution, and reproduction in any medium, provided the original work isproperly cited.
From reform and opening to the comprehensive construction of a well-off society, the rapid growth of the national economy andthe advancement of urbanization have promoted the rapid development of China’s real estate industry. The real estate industryhas become a pillar growth point in the development of the national economy. At the same time, China’s real estate marketsalso continue to mature. However, due to the short development time of my country’s real estate market, imperfectmanagement mechanism, irregular organization, and other issues, coupled with the fierce competition and internationalizationof the market investment environment, the risk of investment accumulation in the real estate industry is also increasing.Therefore, in real estate investment decision-making, it is of far-reaching significance to study how to control real estateinvestment risks and promote the healthy and stable development of the real estate industry. The purpose of this article is tobuild a set of investment portfolios based on the ant colony algorithm to diversify risks and obtain returns, so that theconstructed investment portfolios will minimize the risk when the return reaches a certain amount of time. This article firstgives a general introduction to wireless network communication and then analyzes the risk of real estate project investment.First, the variance is used as a measure of risk to establish a dynamic model of the real estate development project portfolio,and the ant colony algorithm is introduced to the investment risk of real estate development projects. In the dynamic analysis,an improved portfolio model was established, and the two were compared through case analysis. The experimental resultsshow that under the condition of the same net present value and investment payback period, the ant colony algorithm basedon variance is invested in lot H. The ratio is obviously higher, and the capital investment ratio of lot H based on the antcolony algorithm is obviously lower. The difference between the two is 30.1%.
1. Introduction
1.1. Background. With the development of the economy, therapid development of the national economy and the processof urbanization have promoted the rapid development ofChina’s real estate industry. At the same time, China’s realestate market continues to mature. In order to improve com-petitiveness and reduce risks, most companies actively carryout investment portfolios, including property-type invest-ment portfolios, investment regional portfolios, investmenttiming and investment cycle portfolios, investment subjectportfolios, and business model portfolios. The ant colony
algorithm is an intelligent optimization algorithm that simu-lates the foraging behavior of ants in the biological world.The artificial ant colony algorithm has successfully solved aseries of problems in life, such as the secondary allocationproblem and the investment portfolio problem, and achievedgood optimization results.
1.2. Significance. In today’s diversified and multiprojectinvestment development in the real estate market, in themultiproject decision-making process of real estate invest-ment, how investors can control real estate investment risksand take advantage of real estate investment opportunities to
HindawiWireless Communications and Mobile ComputingVolume 2021, Article ID 9261312, 14 pageshttps://doi.org/10.1155/2021/9261312

obtain the greatest investment benefits from investors, andsociety is also important for the development and growthof the real estate market. It has far-reaching significance.The ant colony algorithm has few restrictions on the prob-lem to be solved, so its application range is very wide. Inrecent years, scholars have used intelligent optimizationalgorithms to solve investment portfolio problems, but theapplication and research of ant colony algorithm in this areaare relatively few. Therefore, this article applies theimproved ant colony algorithm to the research of solvingthe investment portfolio problem, which has certain theoret-ical significance and certain practical significance.
1.3. Literature Review. With the progress of society, moreand more people have conducted research on wireless com-munication networks. Among them, Du et al. has studiedthe traditional analysis and design of a network control sys-tem (NCS) with state quantification in a single wired/wire-less network environment. They studied the quantitativecontrol of NCS triggered by distributed events in a mixedwired/wireless network environment. In order to reducethe communication burden of each channel, a distributedevent trigger mechanism and multiple quantificationschemes are first proposed [1]. However, in large-scale wire-less networks such as wireless mesh networks, the capacitygain of full-duplex communication has not been fully stud-ied. For this reason, Wang et al. have studied a networkcapacity measurement called transmission capacity for full-duplex wireless networks. It captures the maximum trans-mission throughput in a unit area, subject to a certain prob-ability of interruption. The key challenge in derivingtransmission capacity is to characterize the aggregate inter-ference of a typical link in a full-duplex wireless network,which is completely different from that in a half-duplexwireless network [2]. As one of the most promising technol-ogies in the 5G era, device-to-device (D2D) communicationbased on macro and small cellular networks can improvespectrum efficiency and increase system capacity. Tongmodels cross-layer and colayer D2D communication in atwo-layer macrosmall cell network. In order to avoid thecomplex interference of cross-layer D2D, he proposed amode selection scheme with a dedicated resource sharingstrategy. For cotier D2D, we formulated a joint optimizationproblem of power control and resource reuse, with the goalof maximizing the overall power outage capacity [3]. Onthe basis of deterministic optimization model, a lot ofresearch on evacuation optimization has been carried out,but the randomness or uncertainty of evacuation in the realworld has not been fully considered. Inspired by the goodperformance of heuristic algorithms in solving combinato-rial problems, Liu et al. proposed an improved quantumant colony algorithm (QACA) to exhaustively optimize theevacuation path of people from dangerous areas to safe areas[4]. Today, path planning has become an important researchfield. Cao uses an improved ant colony algorithm to solvethe path planning problem, and the convergence speed canbe improved by improving the algorithm. After determiningthe initial parameters, the author uses the ant colony algo-rithm and its improved algorithm to plan an optimal path
from beginning to end in a known environment [5]. In therelated research carried out by Sousa et al., building fragilityis expressed by strength: the specific distribution of damageexceeding probability of various damage states. The lattercontribution has been demonstrated in the context of build-ing portfolio loss estimation, which shows that the proposedconcept of conditional vulnerability function provides a linkbetween earthquake intensity and the uncertainty in theprobability of damage exceeding [6]. For the above situation,Orlando and Parker focus on assessing the financial status ofinsurance companies issue variable annuity (VA) portfolios.Two multivariate models of underlying real estate and inter-est rates are considered. The first model uses a single totalrate of return for a basket of assets. Second, the rate of returnof n is assets in the joint modeling basket. For simplicity,assume that an insurance company can implement a statichedging plan to manage risk [7]. Xu et al. proposed a largeCVaR-based portfolio selection model with weight con-straints. It includes the standard CVaR-based portfolio selec-tion model as a special case, and it also uses the penaltyquantile regression technique to solve the new model. Theactual data obtained illustrates the effectiveness of the pro-posed model [8]. Pedersen et al. consider using distributedstorage (DS) to reduce the communication cost of contentdelivery in wireless networks. Erasure codes are used to store(cache) content in many mobile devices. When the devicestoring the data left the unit, Pedersen et al. solved the repairproblem and introduced a repair plan. Then the derivedexpression is used to evaluate the communication cost ofDS using several erasure codes [9]. However, the shortcom-ings of these studies are that they have not properly dealtwith the risk of investment portfolios and have not summa-rized the maximization of profits.
1.4. Innovation. The innovations of this article are (1) whenmaking real estate investment decisions, what type of realestate to choose for investment and how to make portfolioinvestment, how to dynamically manage portfolio invest-ment, and how to determine the appropriate investmentratio for different risk tolerance. (2) The ant colony algo-rithm is applied to the research of real estate investmentportfolio. In other applications, the ant colony algorithm isoften used as a method to solve the combination optimiza-tion problem, and this article is dedicated to digging intothe internal ant colony algorithm features and advantages,find out the similarities between ant foraging and real estateinvestment behavior, apply the algorithm’s own characteris-tics to simulate real estate investment behavior, and get abetter real estate investment portfolio.
2. Portfolio Decision Method Based on AntColony Algorithm
2.1. Ant Colony Algorithm. Ant colony algorithm is a proba-bilistic algorithm used to find optimal paths. The basic ideaof applying the ant colony algorithm to solving the optimi-zation problem is: using the walking path of the ants to rep-resent the feasible solution of the problem to be optimized,and all the paths of the entire ant colony constitute the
2 Wireless Communications and Mobile Computing

solution space of the problem to be optimized. Ants with ashorter path release more pheromones. As time progresses,the accumulated pheromone concentration on the shorterpath gradually increases, and the number of ants that choosethis path increases. In the end, the entire ant will be concen-trated on the best path under the action of positive feedback,and at this time, the corresponding is the optimal solution ofthe problem to be optimized.
2.1.1. Form Description.
GA = P 0ð Þ,N , L, S,G, P, F, Tð Þ: ð1Þ
In formula (1), Pð0Þ represents the initial population, Nrepresents the total number in the group, L represents thelength of the binary system, S represents the selection strat-egy, G represents the genetic operator, P represents the oper-ation probability of G, F represents the adaptation degreefunction, and T represents the termination rule.
2.1.2. Performance Evaluation. The online performance isrepresented by the average value from the first generationto the current generation. Suppose XEðSÞ is the linear perfor-mance of strategy S under environment E, and FEðTÞ is theobjective function or average fitness function correspondingto environment E at the time T or T generation; then
XE Sð Þ = 1/T〠T
L
FE Tð Þ: ð2Þ
Online performance represents the average value of theperformance value of the algorithm from the beginning tothe current time period, reflecting the dynamic performanceof the algorithm [10].
Offline performance is the cumulative average of the bestperformance. Let X∗
EðSÞ be the linear performance of strat-egy S under environment E; then
XE Sð Þ = 1/T〠T
L
F∗E Tð Þ: ð3Þ
Then
F∗E Tð Þ = BEST F 1ð Þ
E , F 2ð ÞE ,⋯, F Tð Þ
E
� �: ð4Þ
Offline performance represents the cumulative averageof the best performance values of each evolutionary genera-tion during the running of the algorithm, and it reflects theconvergence performance of the algorithm.
2.1.3. Algorithm Flow. The optimization process of ant col-ony algorithm is actually controlled by three variables,namely state transition rules, pheromone local update rules,and pheromone global update rules [11, 12].
The algorithm process can be simply described, and eachant traverses all cities according to the state transition rules,looking for its own shortest path, until all ants find their ownsolutions [13]. After each iteration is completed, the phero-
mone on all paths is updated and the shortest path generatedafter this iteration is recorded, until the termination condi-tion is met and the iteration ends. In this process, the statetransition probability can be defined as follows:
PKI J Tð Þ = μaI J Tð ÞυbI J Tð Þ/〠
N
J=1μaI J Tð ÞυbI J : ð5Þ
Among them, υI J represents the visibility between I andJ , μI J represents the concentration between the two places, arepresents the importance of the pheromone concentrationbetween the two places, and b represents the importance ofthe upper visibility between the two places [14].
Using the memory list to record the list of cities that antK has walked through, the formula can be updated as fol-lows:
μI J T + 1ð Þ =wμI J Tð Þ + ΔμI J T + 1ð Þ,
ΔμI J T + 1ð Þ = 〠M
K=1ΔμKI J T , T + 1ð Þ,
ΔμKI J T , T + 1ð Þ =Q/LK , exit
0:
( ð6Þ
Among them, ΔμKI JðT , T + 1Þ represents the amount ofpheromone left by the movement of the Kth ant at time ðT , T + 1Þ on the path ðI, JÞ, ΔμI JðT , T + 1Þ represents theamount of pheromones of all ants in this process, and Q rep-resents all paths. The sum of pheromone LK represents thetotal length of the path taken by the Kth ant, and w is theattenuation coefficient of the pheromone trajectory.
2.2. Wireless Network Communication
2.2.1. Wireless Sensor Network. The wireless sensor networkis a self-organizing multihop network composed of a largenumber of cheap microsensor nodes developed in the mon-itoring area [15]. The sensor network has three functions ofdata collection, processing, and transmission. A variety ofsensors on wireless sensor networks can detect various envi-ronmental phenomena, such as vibration, electromagnetic,temperature, humidity, noise, light intensity, pressure, soilcomposition, size, and speed and direction of moving objects[16, 17]. Possible application areas can be summarized asfollows: military, aviation, disaster relief, environment, med-ical, healthcare, household, industry, and other sectors. Theclassic scenario of wireless sensor network applications isshown in Figure 1.
After the large-scale wireless sensor network nodes learnall kinds of information, they can interface with the back-bone Ethernet through the gateway, which can easily learna large amount of information about the target object [18].Different from traditional data networks, wireless sensornetworks have the following unique characteristics: (1) Inself-organization, the layout and development of the net-work do not need to be based on any predetermined net-work installation. Nodes coordinate their behaviors
3Wireless Communications and Mobile Computing

through multilevel protocols and distributed algorithms,which can quickly and automatically form an independentnetwork [19, 20]. (2) The resources of the node are limited.The flexibility and self-organization characteristics of wire-less sensor networks determine the power and processor,and the storage and communication of sensor nodes are verylimited. Therefore, most hardware designs and softwareimplementations need to be based on this. (3) Regardingexecution, different applications are usually interested in dif-ferent physical quantities, so the requirements for networksystem and material design are different, and network archi-tecture and communication protocols are bound to be verydifferent. Therefore, only by planning for each specific appli-cation can a high-performance and reliable system goal beachieved, which is also a significant feature of wireless sensordesign other than traditional network technology [21].
2.2.2. Wireless Cognitive Network Technology. In the cogni-tive radio network, the channel has the characteristics of fre-quency selectivity and constant change over time. Thesecharacteristics will affect the orthogonality between thespreading codes. In addition, the spreading codes are some-times not absolutely orthogonal, which will lead to signalsbetween different users interfering with each other. There-fore, channel estimation not only needs to accurately obtainchannel response information but also needs to adapt to thefast time-varying channel environment.
The specific method is as follows: In the frequency-selective Rayleigh fading channel, a channel estimation algo-rithm is based on an instant two-dimensional pilot mode[22]. In the first step of the algorithm, use LS to estimatethe first pilot symbol to get the current channel responseand save the obtained value. Next, use LS to estimate the reg-ular pilot symbols inserted in the OFDM data symbols [23].In this way, a new two-dimensional pilot-assisted channelestimation algorithm is obtained. The schematic diagram isshown in Figure 2.
Based on the algorithm, we have the following:
(1) Obtain channel information from pilot symbols. Theestimated value that can be obtained by the LS algo-rithm is
�Uip kð Þ = Yi
p kð ÞXip kð Þ , k = 0, 1, 2,⋯,N − 1: ð7Þ
Among them, Xip represents the transmitted pilot sym-
bols, Yip represents the received pilot symbols, and then the
LS algorithm is also used for the pilot symbols that areevenly inserted in the subsequent OFDM data symbols.
�Uip mð Þ = Yi
p mð ÞXip mð Þ , k = 0, 1, 2,⋯,Np − 1: ð8Þ
(2) Use linear interpolation. The linear interpolationmethod uses the information of two adjacent pilotsubchannels to determine the channel response ofthe data subchannel located between them, whichcan be obtained by the above formula:
�Ujp mlð Þ = �Uj
p mlð Þ + 1 − yð Þe mlð Þ: ð9Þ
Among them, eðmlÞ is an error term, y is a parameterwaiting to be determined, and the error can be clearlyexpressed by the zero-mean Gaussian white noise.
y = J0 2πgmaxΔtTsð Þ: ð10Þ
Ethernet
Field instrument DCS
Firewall
Gateway
Router
Host
Figure 1: Typical application wireless sensor network scenario.
4 Wireless Communications and Mobile Computing

J0 represents the first zero-order Nessel function, gmaxrepresents the maximum Doppler frequency shift, t repre-sents time, T represents period, and then eðmlÞ can beobtained as
e mlð Þ =�Uj
p mlð Þ − �Uip mlð Þ
1 − y: ð11Þ
Therefore, by linear interpolation, the error term eðkÞbetween two adjacent derivative symbols can be expressed as
e kð Þ = L − 1ð Þ/L½ �e mlð Þ + 1/L m + 1ð ÞL½ �: ð12Þ
Therefore, by linear interpolation, the error term eðkÞbetween two adjacent derivative symbols can be expressed as
�U jp kð Þ = y �Ui
p kð Þ + 1 − yð Þe kð Þ, k = 0, 1, 2,⋯,N − 1: ð13Þ
Frequency-selective deep fading only affects one or sev-eral subchannels in the system. Using the relevant informa-tion between the subchannels, the data on the interferedsubchannels can be restored, thereby effectively reducingthe randomization caused by fading [24]. And through thefilter to estimate the attenuation factor of the remaining sub-channels, this channel estimation method is very suitable forsevere frequency-selective fading channels.
2.3. Dynamic Management of Real Estate InvestmentPortfolio. The real estate investment portfolio dynamic man-agement implementation engineering diagram is shown inFigure 3. It is mainly divided into the following steps.
(1) Investor goals and constraints: determine the inves-tor’s investment goals, such as the expected rate ofreturn and the minimum risk acceptance; determinethe investor’s constraints, such as capital restrictions,investment preferences, and so on
(2) Conditions and expectations of the real estate mar-ket: the real estate market is in a dynamic processof change. The real estate market in different regionsand different periods has different characteristics.Therefore, it is necessary to carefully analyze the realestate market and predict the expected return rateand risk level of the real estate portfolio investment.The analysis of the real estate market includes qual-itative analysis and quantitative analysis. Qualitativeanalysis mainly includes market efficiency analysis,portfolio management method analysis, analysis ofreal estate markets in various regions, and analysisof various property types of real estate markets[25]. Quantitative analysis includes basic economicevaluation, modern portfolio theory seekingexpected return and risk, probability forecasting,and portfolio optimization
(3) Define the best investment portfolio: investmentobjectives and investor constraints can be reflectedin the investor’s indifference curve. The actual limitrepresents conditions and market expectations, andthe tangent point between the indifference curveand the actual limit represents the best advantageof the investment portfolio
(4) Determination of combination strategy: the processis shown in Figure 4
(5) Monitoring and readjustment: monitoring is theprocess of implementing portfolio management asa continuous potential model to monitor all factorsthat affect the portfolio. It changes the investor’sindifference curve and the actual boundary point,that is, to determine the portfolio size, required per-formance, and risk tolerance: capital mobility, occu-pation period, taxation and related laws, and otherfactors. The adjustment should be an appropriateadjustment of the assets in the investment portfolioto better adapt to market conditions and respondto the requirements and expectations of investors
(6) Evaluation of combined behavior: evaluate whetherthe portfolio management meets the requirementsof investors. If the target portfolio is determined,the manpower and material resources spent on com-prehensive real estate analysis and market analysisare worth the effort, and what aspects of portfoliomanagement still need to be improved. There aretwo commonly used evaluation methods: one isvalue-added valuation, which uses market share,property selection, or differentiation to adjust therate of return for each risk. Effective portfolio man-agement will increase the value of real estate invest-ment portfolios. The second is performancemeasurement, which refers to the measurement ofhistorical returns or expected returns. The historicalrate of return is sometimes called the rate of return,
Times
Frequency
Figure 2: Two-dimensional channel estimation.
5Wireless Communications and Mobile Computing

and the expected rate of return is usually theexpected rate of return.
2.4. Real Estate Portfolio Model Based on Ant ColonyAlgorithm. The assumptions of the portfolio model are asfollows: (1) Investors are risk averse. (2) Investors can obtainthe expected rate of return and variance of different types ofreal estate and make decisions based on comprehensive con-sideration of risks and rates of return. (3) Funds are unlim-ited, and investors do not need to consider the constraints offunds [26].
Under such model assumptions, firstly introduce theinvestment portfolio into the real estate portfolio investmentdecision, and secondly improve the model based on the atti-tude of real estate investors towards risks. Because the realestate business investment does not consider short selling,the model further improved the improvement, and finally aunity of dimensions.
The model introduced into the real estate investmentportfolio is
p1
min κ2p = 〠n
a=1〠n
b=1xaxbκab
s:t:〠n
a=1xaxb ≥ rp
〠n
a=1xa = 1:
8>>>>>>>>>><>>>>>>>>>>:
ð14Þ
In Equation (14), n represents the number of real estateinvestment plans, xa represents the investment ratio of theath real estate, rp represents the expected benefits, and κ2prepresents the risk value of the investment portfolio. In addi-tion, κab represents the ath and the first b covariance ofexpected real estate returns.
Real estateexpectations
Goals andconstraints
Combinationstrategy
determination
Combinationstrategy
Combinationbehavior
assessment
monitor
monitor
Targetcombination
determination
OutputMonitoring andadjustmentInput
Figure 3: Real estate portfolio management.
Current combination
Hold
sell
Portfoliomanagement
The bestsolution
Experimentalprogram
Targetcombination
Manage
Portfoliomanagement
Corporatestrategy
Comparativeanalysis
Figure 4: Real estate corporate strategy.
6 Wireless Communications and Mobile Computing

Since, in actual operation, different real estate investorshave different attitudes towards risk, investors need tochoose the investment ratio according to their attitudetowards risk to achieve their desired risk and return goals[27, 28].
On the basis of p1, p2 introduces the risk coefficient μ,which transforms the risk-return multiobjective model intoa single-objective model. The size of the μ reflects the atti-tude of investors towards risk. The p2 model can choosethe investment ratio according to the investor’s attitudetowards risk. Different risk attitudes will result in differentinvestment ratios. Under a certain risk factor, a certaininvestment ratio may be an inferior solution, while underanother risk factor, this investment ratio may be the optimalsolution.
p2
max 1 − μð Þ〠n
a=1xara − μ〠
n
a=1〠n
b=1xaraκab
s:t:〠n
a=1xa = 1:
8>>>><>>>>:
ð15Þ
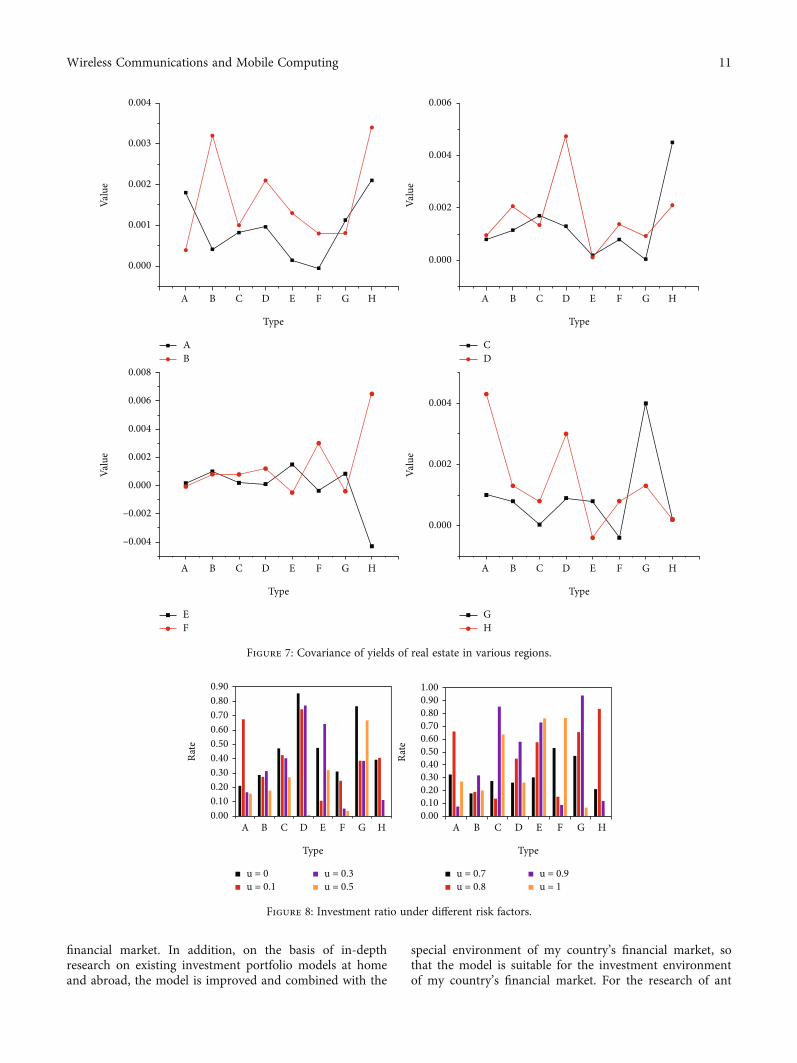
Among them, μ is the risk preference coefficient. μ= 0 stated that investors value returns very much anddo not care about risks. As a neutral risk person or riskenthusiast, the return on investment portfolio is the high-est [29]. μ = 1 stated that investors value risk very muchand have no requirements on the size of returns. Suchinvestors are very cautious and have the lowest risk intheir investment portfolio. If the risk preference coeffi-cient belongs to ½0, 1�, then the value of the data increasesas the degree of investor treatment of risks increases,which represents the attitude of investors at differentstages to risk [30].
The investment portfolio model does not consider thebehavioral constraints that do not allow short selling, whichwill greatly restrict the application of the model. p3 is a realestate portfolio model considering short selling is notallowed:
p3
max 1 − μð Þ〠n
a=1xara − μ〠
n
a=1〠n
b=1xaraκab
s:t:〠n
a=1xa = 1
xa ≥ o
a = 1, 2,⋯, n:
8>>>>>>>>>><>>>>>>>>>>:
ð16Þ
The previous model risk used variance. Here, we intro-duce the investor’s attitude coefficient to risk, transformingthe risk-return multiobjective model into a single-objectivemodel. In order to unify the dimensions of return and risk,the risk here uses standard deviation [31].
p4
max 1 − μð Þ〠n
a=1xara − μ
ffiffiffiffiffiffiffiffiffiffiffiffiffiffiffiffiffiffiffiffiffiffiffiffiffiffi〠n
a=1〠n
b=1xaraκab
s
s:t:〠n
a=1xa = 1
xa ≥ o, a = 1, 2,⋯, n:
8>>>>>>><>>>>>>>:
ð17Þ
Markowitz studied the risks and returns of various secu-rities in the securities market, carried out quantitativeresearch on them, introducing variance to represent the levelof investment risk and expected return to represent the levelof return on investment, and proposed Markowitz portfoliotheory. The mean-variance model of the portfolio is also themost commonly used calculation model. Under certainassumptions about the market, the effective boundary ofthe portfolio is found by studying the mean and varianceof the returns of individual securities, that is, the portfolioof securities is to minimize the risk under a certain level ofreturn or maximize returns at a certain level of risk toler-ance. Markowitz’s research on securities investment portfo-lio also found that diversified investment portfolios shouldalso choose different securities with smaller correlation coef-ficients for investment portfolios to diversify investmentrisks. To maximize the utility expected by investors, not onlythe rate of return on investment but also the investment riskmust be considered. To achieve the optimal portfolio ofsecurities market investment according to relevant condi-tions, Markowitz uses mathematical statistics and quantita-tive analysis methods in a comprehensive and detailedmanner and explains how to determine the optimal invest-ment portfolio based on investment objectives.
Although Markowitz explained the principle of riskdiversification in the theory of investment portfolio scientif-ically, there are still many defects in the application of actualsecurities investment portfolio. The first is that the model isbased on certain assumptions, but these assumptions aregenerally difficult to achieve in reality, and the second isthe determination of parameters such as the rate of return,variance and correlation coefficient in the model, and thedifficulty of estimating these larger parameters, and again,the calculation of the model is more complicated. At present,there is no effective and simple model calculation method.Therefore, the application of this model in reality has certainlimitations.
3. Experimental Design and Result Analysis
3.1. Real Estate Investment Portfolio Plan Design. A realestate development company has eight locations A, B, C,D, E, F, G, and H to choose from in a city, which can carryout (1) residential development, (2) industrial properties, (3)office buildings, (4) leisure tourism, (5) land development,and other five types of real estate development project con-struction. The economic evaluation indicators of each pro-ject type in different locations are shown in Table 1. Thecompany only invests in one type in a lot. Try to determinethe investment portfolio plan for real estate developmentprojects (among them, the net present value (10 million
7Wireless Communications and Mobile Computing

Yuan) in the indicator is represented by N, the internalrecovery rate (%) is represented by R, the payback period(year) is represented by I, and the capital investment ratiois represented by C).
3.2. Real Estate Investment Portfolio Results. Through thestatistics and analysis of the data in Table 1, the calculationresults of the ant colony algorithm based on variance asthe risk measurement index are shown in Figure 5.
In order to find the gap through comparison, the calcu-lation result of the static ant colony algorithm is shown inFigure 6.
By comparing Figures 5 and 6, it can be found that underthe same net present value and investment payback period,the capital investment ratio of ant colony algorithm basedon variance is obviously higher, while the capital investmentratio of ant colony algorithm based on ant colony algorithmis significantly higher [32, 33]. Obviously low, the differencebetween the two is 30.1%.
It can be seen from Table 2 that the calculation speed ofthe ant colony algorithm using variance as the risk measure-ment index is slightly slower, but the rate of return has beengreatly improved compared with the basic ant colony algo-rithm, the same amount of capital is invested, and the profitobtained is also relatively large [34, 35]. It can be said thatthe ant colony algorithm, which uses variance as the mea-surement index and changes over time, is superior to thebasic ant colony algorithm in solving the problem of realestate development project portfolio, and its efficiency isincreased by 26.11%.
3.3. Real Estate Investment Portfolio Based on ImprovedGenetic Algorithm. Through the improved genetic algorithmto solve the real estate investment portfolio model [36, 37],the results can be obtained as shown in Table 3.
Based on the preliminary analysis of the data, since landA is not suitable for open housing, it will not be discussedhere. The development site of land C is too risky, and thereal estate company will not consider it. Through the searchof market information and data, the data results obtained areshown in Figure 7.
By running the program, the portfolio ratios of variousreal estate investment types under different risk aversioncoefficients can be obtained. The data results are shown inFigure 8.
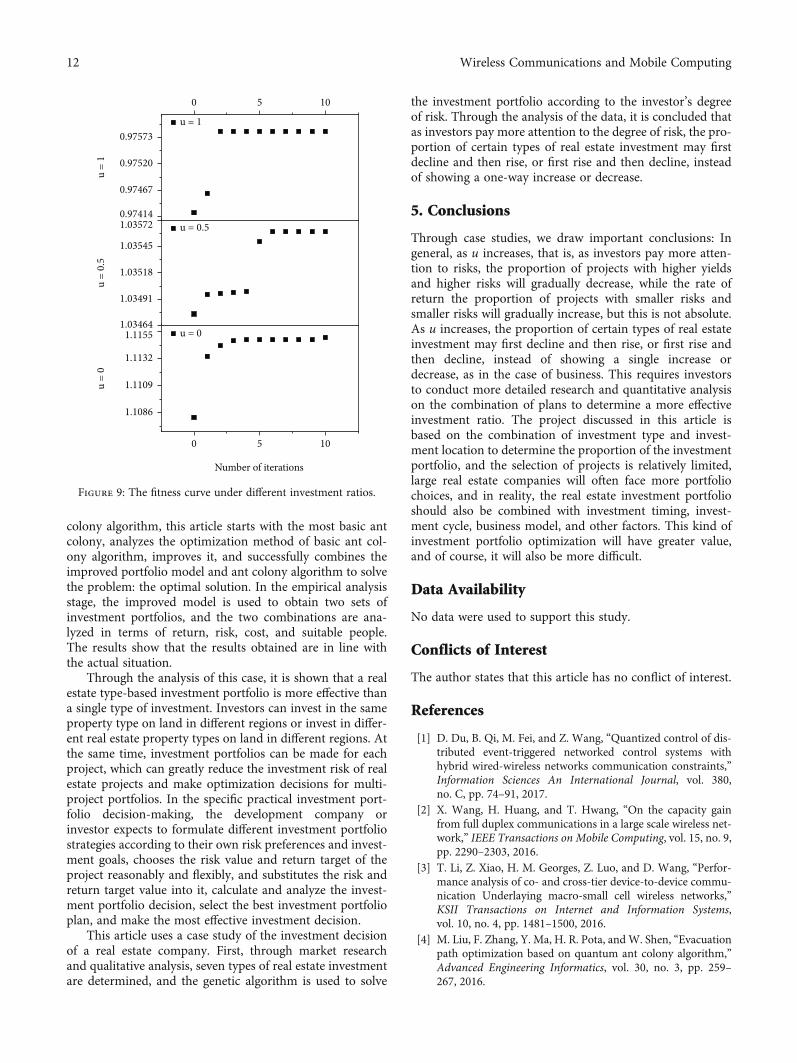
Figure 9 shows the curve of adaptability as the invest-ment ratio changes with the progress of the genetic algo-rithm search when taking different values. Here, only thefunction graphs when u = 0, u = 0:5, and u = 1 are given.
It can be seen from the data in the figure that this modeloptimizes both the risk and return objectives at the sametime and obtains different combinations of “return risk.”Using this model, real estate investors can make investmentdecisions according to their own conditions and risk prefer-ences and change the size of the variable input value indicat-ing that real estate investors gradually weaken theimportance of investment income and continue to increasethe importance of risk.
4. Discussion
This paper is dedicated to research and designs an optimizedcalculation model, and it is based on ant colony algorithmand applies it to the complex analysis and processing of realestate investment. It not only expands the application scopeof ant colony algorithm but is also a new attempt to studythe complexity of the real estate investment market. By sim-ulating the investment behavior of investors in the real estateinvestment market, mining ant colony algorithm as animportant tool for studying the complexity of the systemhas certain potential in the study of the complexity of the
Table 1: Evaluation of various indicators of each investment plan.
Project Lot A B C D E F G H
Residential development
N 26.22 19.64 56.66 16.63 54.30 64.98 22.67 26.22
R 69.91 59.33 66.44 40.65 23.73 21.33 48.14 50.03
I 4.60 6.20 2.50 3.50 3.90 6.20 6.40 2.80
Industrial property
N 44.51 63.09 60.10 44.55 46.75 5.13 23.24 44.51
R 62.77 19.72 39.99 63.80 68.95 15.57 42.15 26.92
I 4.50 8.00 5.50 4.20 6.90 7.50 7.70 5.10
Office building
N 5.17 29.85 63.67 54.52 27.72 37.49 54.18 5.17
R 32.36 35.11 63.47 25.12 63.76 68.78 24.41 26.32
I 6.40 4.30 5.20 4.30 5.90 6.40 7.70 2.20
Leisure travel
N 18.22 56.29 16.33 51.40 60.31 34.51 39.10 18.22
R 13.81 37.87 38.88 41.81 25.67 40.16 63.76 62.54
I 2.60 7.10 4.30 4.80 3.70 5.10 3.70 7.50
Land development
N 21.60 11.99 40.08 35.31 7.69 37.55 62.14 21.60
R 22.44 59.51 45.70 29.73 44.28 62.66 27.03 46.82
I 7.50 7.70 7.00 2.10 7.30 7.90 5.60 3.00
8 Wireless Communications and Mobile Computing

0
10
20
30
40
50
60
70
80
A B C D E F G H
Valu
e
Lot
NRC
Figure 5: The calculation result of the ant colony algorithm based on variance as the risk measurement index.
0
10
20
30
40
50
60
70
80
A B C D E F G H
Valu
e
Lot
NRC
Figure 6: The calculation results of the ant colony algorithm under static conditions.
Table 2: Comparison of the calculation results of the two algorithms.
Algorithm Ant colony algorithm Ant colony algorithm based on variance
Operation hours (s) 99 134
Calculation results 17.6 : 14.3 : 24.3 : 20.6 : 20.4 : 14.5 : 26.5 : 22.3 20.3 : 14.3 : 15.4 : 21.1 : 23.9 : 19.4 : 18.4 : 15.5
Present value of investment income 4573.32 5132.58
9Wireless Communications and Mobile Computing

Table3:Indexvalues
ofvariou
srealestates.
Type
AResidentialdevelopm
ent
BResidentialdevelopm
ent
CIndu
strialprop
erty
DIndu
strialprop
erty
EOffice
build
ing
FOffice
build
ing
GLeisuretravel
HLeisuretravel
Average
rate
7.16%
12.15%
14.44%
15.48%
8.54%
10.23%
10.39%
10.86%
Variance
0.0014
0.0033
0.0016
0.0050
0.0015
0.0031
0.0042
0.0054
Standard
deviation
4.32%
5.88%
4.62%
6.88%
3.79%
5.53%
6.45%
7.21%
10 Wireless Communications and Mobile Computing
financial market. In addition, on the basis of in-depthresearch on existing investment portfolio models at homeand abroad, the model is improved and combined with the
special environment of my country’s financial market, sothat the model is suitable for the investment environmentof my country’s financial market. For the research of ant
A B C D E F G H
0.000
0.001
0.002
0.003
0.004
AB
Valu
e
Type
A B C D E F G H
0.000
0.002
0.004
0.006
CD
Valu
e
Type
A B C D E F G H
–0.004
–0.002
0.000
0.002
0.004
0.006
0.008
EF
Valu
e
Type
A B C D E F G H
0.000
0.002
0.004
GH
Valu
e
Type
Figure 7: Covariance of yields of real estate in various regions.
0.000.100.200.300.400.500.600.700.800.90
A B C D E F G H
Rate
Type
u = 0u = 0.1
u = 0.3u = 0.5
0.000.100.200.300.400.500.600.700.800.901.00
A B C D E F G H
Rate
Type
u = 0.7u = 0.8
u = 0.9u = 1
Figure 8: Investment ratio under different risk factors.
11Wireless Communications and Mobile Computing
colony algorithm, this article starts with the most basic antcolony, analyzes the optimization method of basic ant col-ony algorithm, improves it, and successfully combines theimproved portfolio model and ant colony algorithm to solvethe problem: the optimal solution. In the empirical analysisstage, the improved model is used to obtain two sets ofinvestment portfolios, and the two combinations are ana-lyzed in terms of return, risk, cost, and suitable people.The results show that the results obtained are in line withthe actual situation.
Through the analysis of this case, it is shown that a realestate type-based investment portfolio is more effective thana single type of investment. Investors can invest in the sameproperty type on land in different regions or invest in differ-ent real estate property types on land in different regions. Atthe same time, investment portfolios can be made for eachproject, which can greatly reduce the investment risk of realestate projects and make optimization decisions for multi-project portfolios. In the specific practical investment port-folio decision-making, the development company orinvestor expects to formulate different investment portfoliostrategies according to their own risk preferences and invest-ment goals, chooses the risk value and return target of theproject reasonably and flexibly, and substitutes the risk andreturn target value into it, calculate and analyze the invest-ment portfolio decision, select the best investment portfolioplan, and make the most effective investment decision.
This article uses a case study of the investment decisionof a real estate company. First, through market researchand qualitative analysis, seven types of real estate investmentare determined, and the genetic algorithm is used to solve
the investment portfolio according to the investor’s degreeof risk. Through the analysis of the data, it is concluded thatas investors pay more attention to the degree of risk, the pro-portion of certain types of real estate investment may firstdecline and then rise, or first rise and then decline, insteadof showing a one-way increase or decrease.
5. Conclusions
Through case studies, we draw important conclusions: Ingeneral, as u increases, that is, as investors pay more atten-tion to risks, the proportion of projects with higher yieldsand higher risks will gradually decrease, while the rate ofreturn the proportion of projects with smaller risks andsmaller risks will gradually increase, but this is not absolute.As u increases, the proportion of certain types of real estateinvestment may first decline and then rise, or first rise andthen decline, instead of showing a single increase ordecrease, as in the case of business. This requires investorsto conduct more detailed research and quantitative analysison the combination of plans to determine a more effectiveinvestment ratio. The project discussed in this article isbased on the combination of investment type and invest-ment location to determine the proportion of the investmentportfolio, and the selection of projects is relatively limited,large real estate companies will often face more portfoliochoices, and in reality, the real estate investment portfolioshould also be combined with investment timing, invest-ment cycle, business model, and other factors. This kind ofinvestment portfolio optimization will have greater value,and of course, it will also be more difficult.
Data Availability
No data were used to support this study.
Conflicts of Interest
The author states that this article has no conflict of interest.
References
[1] D. Du, B. Qi, M. Fei, and Z. Wang, “Quantized control of dis-tributed event-triggered networked control systems withhybrid wired-wireless networks communication constraints,”Information Sciences An International Journal, vol. 380,no. C, pp. 74–91, 2017.
[2] X. Wang, H. Huang, and T. Hwang, “On the capacity gainfrom full duplex communications in a large scale wireless net-work,” IEEE Transactions on Mobile Computing, vol. 15, no. 9,pp. 2290–2303, 2016.
[3] T. Li, Z. Xiao, H. M. Georges, Z. Luo, and D. Wang, “Perfor-mance analysis of co- and cross-tier device-to-device commu-nication Underlaying macro-small cell wireless networks,”KSII Transactions on Internet and Information Systems,vol. 10, no. 4, pp. 1481–1500, 2016.
[4] M. Liu, F. Zhang, Y. Ma, H. R. Pota, andW. Shen, “Evacuationpath optimization based on quantum ant colony algorithm,”Advanced Engineering Informatics, vol. 30, no. 3, pp. 259–267, 2016.
0 5 10
1.1086
1.1109
1.1132
1.11551.03464
1.03491
1.03518
1.03545
1.03572
0 5 10
0.97414
0.97467
0.97520
0.97573
u =
0
Number of iterations
u = 0
u =
0.5
u = 0.5
u =
1
u = 1
Figure 9: The fitness curve under different investment ratios.
12 Wireless Communications and Mobile Computing

[5] J. Cao, “Robot global path planning based on an improved antcolony algorithm,” Journal of Computer & Communications,vol. 4, no. 2, pp. 11–19, 2016.
[6] L. Sousa, V. Silva, M. Marques, and H. Crowley, “On the treat-ment of uncertainty in seismic vulnerability and portfolio riskassessment,” Earthquake Engineering & Structural Dynamics,vol. 47, no. 1, pp. 87–104, 2018.
[7] A. Orlando and G. Parker, “Valuation and risk assessment of aportfolio of variable annuities: a vector autoregressionapproach,” Journal of Mathematical Finance, vol. 8, no. 2,pp. 349–371, 2018.
[8] Q. Xu, Y. Zhou, C. Jiang, K. Yu, and X. Niu, “A large CVaR-based portfolio selection model with weight constraints,” Eco-nomic Modelling, vol. 59, pp. 436–447, 2016.
[9] J. Pedersen, A. Graell i Amat, I. Andriyanova, andF. Brannstrom, “Distributed storage in mobile wireless net-works with device-to-device communication,” IEEE Trans-actions on Communications, vol. 64, no. 11, pp. 4862–4878, 2016.
[10] Z. Yong andW. Zhuang, “Performance analysis of cooperativecommunication in decentralized wireless networks with unsat-urated traffic,” IEEE Transactions on Wireless Communica-tions, vol. 15, no. 5, pp. 3518–3530, 2016.
[11] M. Nikolov and Z. J. Haas, “Relay placement in wireless net-works: minimizing communication cost,” IEEE Transactionson Wireless Communications, vol. 15, no. 5, pp. 3587–3602,2016.
[12] K. Wang, F. R. Yu, H. Li, and Z. Li, “Information-centric wire-less networks with virtualization and D2D communications,”IEEE Wireless Communications, vol. 24, no. 3, pp. 104–111,2016.
[13] X. Gong, J. Trogh, Q. Braet et al., “Measurement-based wire-less network planning, monitoring, and reconfiguration solu-tion for robust radio communications in indoor factories,”Iet Science Measurement & Technology, vol. 10, no. 4,pp. 375–382, 2016.
[14] M. Li, F. R. Yu, P. Si, and Y. Zhang, “Green machine-to-machine communications with mobile edge computing andwireless network virtualization,” IEEE Communications Maga-zine, vol. 56, no. 5, pp. 148–154, 2018.
[15] Z. Z. Li, G. Xu, X. B. Chen, X. Sun, and Y. X. Yang, “Multi-userquantum wireless network communication based on multi-qubit GHZ state,” IEEE Communications Letters, vol. 20,no. 12, pp. 2470–2473, 2016.
[16] Q. Yi, “Security and wireless communication networks,” IEEEWireless Communications, vol. 27, no. 3, pp. 4-5, 2020.
[17] S. Fanrong, H. Songchen, and Q. Ge, “Departure trajectorydesign based on Pareto ant colony algorithm,” Transactionsof Nanjing University of Aeronautics and Astronautics,vol. 33, no. 4, pp. 451–460, 2016.
[18] Z. Liang, J. Sun, Q. Lin, Z. du, J. Chen, and Z. Ming, “A novelmultiple rule sets data classification algorithm based on antcolony algorithm,” Applied Soft Computing, vol. 38, no. C,pp. 1000–1011, 2016.
[19] X. Zhang and D. Yuan, “A niche ant colony algorithm forparameter identification of space fractional order diffusionequation,” IAENG International Journal of Applied Mathemat-ics, vol. 47, no. 2, pp. 197–208, 2017.
[20] S. Khudair and T. Younis, “Energy efficient routing protocolfor maximizing the lifetime in WSNS using ant colony algo-rithm and artificial immune system,” International Journal of
Advanced Computer Science & Applications, vol. 7, no. 3,pp. 19–25, 2016.
[21] H. Ab Ghani, M. H. Hamzah, S. Syahali, and N. H. Abdul Aziz,“Ant-colony algorithm with interference cancellation forcooperative transmission,” IET Signal Processing, vol. 10,no. 6, pp. 603–610, 2016.
[22] F. Jalili and M. J. Barani, “Speech recognition using combinedfuzzy and ant colony algorithm,” International Journal of Elec-trical & Computer Engineering, vol. 6, no. 5, pp. 2205–2210,2016.
[23] Z. Cai, T. Chen, C. Zeng et al., “A global approach to the opti-mal trajectory based on an improved ant colony algorithm forcold spray,” Journal of Thermal Spray Technology, vol. 25,no. 8, pp. 1631–1637, 2016.
[24] Y. Geng, L. Zhang, Y. Sun, Y. Zhang, N. Yang, and J. Wu,“Research on ant colony algorithm optimization neural net-work weights blind equalization algorithm,” InternationalJournal of Security and its Applications, vol. 10, no. 2, pp. 95–104, 2016.
[25] L. Bai, K. Zhang, H. Shi, M. An, and X. Han, “Project portfolioresource risk assessment considering project interdependencyby the fuzzy Bayesian network,” Complexity, vol. 2020, ArticleID 5410978, 21 pages, 2020.
[26] P. K. Pouliasis, N. C. Papapostolou, I. Kyriakou, and I. D. Vis-vikis, “Shipping equity risk behavior and portfolio manage-ment,” Transportation Research, vol. 116, pp. 178–200,2018.
[27] K. Moore, C. Smallman, J. Wilson, and D. Simmons,“Dynamic in-destination decision-making: an adjustmentmodel,” Tourism Management, vol. 33, no. 3, pp. 635–645,2012.
[28] A. Diederich and J. S. Trueblood, “A dynamic dual processmodel of risky decision making,” Psychological Review,vol. 125, no. 2, pp. 270–292, 2018.
[29] F. Frombo, R. Minciardi, M. Robba, F. Rosso, and R. Sacile, “Adynamic decision model for the optimal use of forest biomassfor energy production,” Energy Systems, vol. 7, no. 4, pp. 615–635, 2016.
[30] Q. Zhang, G. Lv, Y. Chen, and G. Wang, “A dynamic three-way decision model based on the updating of attribute values,”Knowledge-Based Systems, vol. 142, pp. 71–84, 2018.
[31] A. Baykasoglu and I. Golcuk, “A dynamic multiple attributedecision making model with learning of fuzzy cognitive maps,”Computers & Industrial Engineering, vol. 135, pp. 1063–1076,2019.
[32] Z. Cai, Z. He, X. Guan, and Y. Li, “Collective data-sanitizationfor preventing sensitive information inference attacks in socialnetworks,” IEEE Transactions on Dependable and Secure Com-puting, vol. 15, no. 4, pp. 577–590, 2018.
[33] Z. Cai and Z. He, “Trading private range counting over big IoTdata,” in The 39th IEEE International Conference on Distrib-uted Computing Systems, Dallas, TX, USA, 2019.
[34] W. Deng, S. Shang, X. Cai, H. Zhao, Y. Song, and J. Xu, “Animproved differential evolution algorithm and its applicationin optimization problem,” Soft Computing, vol. 25, no. 7,pp. 5277–5298, 2021.
[35] X. Cai, H. Zhao, S. Shang et al., “An improved quantum-inspired cooperative co-evolution algorithm with multi-strategy and its application,” Expert Systems with Applications,vol. 171, article 114629, 2021.
13Wireless Communications and Mobile Computing

[36] W. Deng and J. Xu, “An enhanced MSIQDE algorithm withnovel multiple strategies for global optimization problems,”IEEE Transactions on Systems, Man, and Cybernetics: Systems,2020.
[37] D. Wu, “A novel gate resource allocation method usingimproved PSO-based QEA,” IEEE Transactions on IntelligentTransportation Systems, 2020.
14 Wireless Communications and Mobile Computing