dwlbc technical report
TRANSCRIPT

DWLBC Technical Report Impact of Perennial Vegetation on Watertables and Dryland Salinity
Technical Report Number 2010/07

Impact of Perennial Vegetation on Watertables and Dryland Salinity
Chris Henschke, Trevor Dooley and Dr Anna Dutkiewicz
Land and Biodiversity Conservation Division Department of Water, Land and Biodiversity Conservation
April 2010
Report DWLBC 2010/07

Land and Biodiversity Conservation Division Department of Water, Land and Biodiversity Conservation 25 Grenfell Street, Adelaide GPO Box 2834, Adelaide SA 5001 Telephone National (08) 8463 6946 International +61 8 8463 6946 Fax National (08) 8463 6999 International +61 8 8463 6999 Website www.dwlbc.sa.gov.au Disclaimer The Department of Water, Land and Biodiversity Conservation and its employees do not warrant or make any representation regarding the use, or results of the use, of the information contained herein as regards to its correctness, accuracy, reliability, currency or otherwise. The Department of Water, Land and Biodiversity Conservation and its employees expressly disclaims all liability or responsibility to any person using the information or advice. Information contained in this document is correct at the time of writing. © Government of South Australia, through the Department of Water, Land and Biodiversity Conservation 2010 This work is Copyright. Apart from any use permitted under the Copyright Act 1968 (Cwlth), no part may be reproduced by any process without prior written permission obtained from the Department of Water, Land and Biodiversity Conservation. Requests and enquiries concerning reproduction and rights should be directed to the Chief Executive, Department of Water, Land and Biodiversity Conservation, GPO Box 2834, Adelaide SA 5001. ISBN 978-1-921528-75-0 Preferred way to cite this publication Henschke C, Dooley T and Dutkiewicz A, 2010, Impact of Perennial Vegetation on Watertables and Dryland Salinity, DWLBC Report 2010/07, Government of South Australia, through Department of Water, Land and Biodiversity Conservation, Adelaide

Report DWLBC 2010/07 iii
FOREWORD
South Australia’s unique and precious natural resources are fundamental to the economic and social wellbeing of the State. It is critical that these resources are managed in a sustainable manner to safeguard them both for current users and for future generations.
The Department of Water, Land and Biodiversity Conservation (DWLBC) strives to ensure that our natural resources are managed so that they are available for all users, including the environment.
In order for us to best manage these natural resources it is imperative that we have a sound knowledge of their condition and how they are likely to respond to management changes. DWLBC scientific and technical staff continues to improve this knowledge through undertaking investigations, technical reviews and resource modelling.
Scott Ashby CHIEF EXECUTIVE DEPARTMENT OF WATER, LAND AND BIODIVERSITY CONSERVATION

Report DWLBC 2010/07 iv
ACKNOWLEDGEMENTS The authors acknowledge the enthusiastic and on-going support of landowners Jim and Karen Mitchell, who contributed significantly to revegetation and groundwater monitoring activities at the site. Also acknowledged for the revegetation component of the project are Chris and Greg Brady of Mt. McKenzie who raised the seedlings, and the Australian Trust for Conservation Volunteers (ATCV) who helped in the planting operation. Mr Don McCarthy (formerly Dept of Agriculture) initiated the original project, and Terry Evans (Rural Solutions SA) operated the drilling rig and carried out the 2006 EM31 survey. Craig Liddicoat and Stuart Wright, both of Rural Solutions SA, undertook soil salt storage calculations and the HARTT analysis, and provided graphics (graphs and GIS maps). Meredith Miller (Flinders University) initialised the FLOWTUBE modelling, including setting up spreadsheets and running scenarios. The Department of Water, Land and Biodiversity Conservation (DWLBC) and the National Landcare Program (NLP) have provided financial support. DWLBC personnel have provided valuable comments on the report. Much of the early work was carried out under the auspices of a National Afforestation Project (NAP Project No. 23, Dryland Salinity Amelioration). Major partners in this NAP project included the then Woods and Forests Department and the SA Dept of Agriculture.

Report DWLBC 2010/07 v
CONTENTS
FOREWORD ........................................................................................................................... iii
ACKNOWLEDGEMENTS ....................................................................................................... iv
SUMMARY ............................................................................................................................... 9
INTRODUCTION .................................................................................................................... 11
AIM AND OBJECTIVES ........................................................................................................ 12
SITE BACKGROUND ............................................................................................................ 13
LOCATION ........................................................................................................................ 13 CLIMATE ........................................................................................................................... 15 GEOLOGY ......................................................................................................................... 16 HYDROGEOLOGY ............................................................................................................ 16 LANDSCAPE AND SOILS ................................................................................................. 16 VEGETATION AND LAND USE ........................................................................................ 17 DRYLAND SALINITY ......................................................................................................... 17
METHODOLOGY ................................................................................................................... 19
PERENNIAL VEGETATION TREATMENTS ..................................................................... 19 DRILLING MONITORING BORES .................................................................................... 23 EM SURVEYS ................................................................................................................... 24 GROUNDWATER MONITORING ..................................................................................... 27 GROUNDWATER TREND ANALYSIS .............................................................................. 27 GROUNDWATER FLOW MODELLING ............................................................................ 28
RESULTS ............................................................................................................................... 29
DRILLING PROFILES ....................................................................................................... 29 SALT STORAGE PROFILES ............................................................................................ 29 EM SURVEYS ................................................................................................................... 30 GROUNDWATER HYDROLOGY ...................................................................................... 34
Groundwater contour maps ............................................................................................................ 34 Groundwater level hydrographs ...................................................................................................... 38 Groundwater discharge .................................................................................................................. 43 Groundwater salinity trends – deeper aquifers ............................................................................... 47 Groundwater Salinity trends - shallow and perched watertables ................................................... 48
GROUNDWATER FLOW MODELLING ............................................................................ 49
DISCUSSION ......................................................................................................................... 53
CONCLUSIONS AND RECOMMENDATIONS ..................................................................... 55

Report DWLBC 2010/07 vi
APPENDICES ........................................................................................................................ 58
A. RAINFALL DATA ...................................................................................................... 58 B. DRILLING LOGS ...................................................................................................... 60 C. DRILL SAMPLE SALINITY ....................................................................................... 69 D. BOREHOLE SPECIFICATIONS .............................................................................. 72 E. HYDROGRAPHS ..................................................................................................... 74 F. WATER LEVEL DATA SUMMARY .......................................................................... 82 G. GROUNDWATER SALINITY GRAPHS ................................................................... 83
UNITS OF MEASUREMENT ................................................................................................. 92
GLOSSARY ........................................................................................................................... 93
REFERENCES ....................................................................................................................... 95

ACKNOWLEDGEMENTS
Report DWLBC 2010/07 7
LIST OF FIGURES
Figure 1. Map showing the location of the Mt Eagle focus area near Keyneton and three sub-catchments located along the Boundary Dividing Range ............................. 14
Figure 2. Residual rainfall curve (1880s – early 2009) for the Mt. Eagle site showing the declining trend in rainfall from the mid 1990s to present ..................................... 15
Figure 3. Panoramic view of the Mt Eagle sub-catchment in 2007 showing trees planted on a steep rocky ridge in the early 1990s ................................................................. 20
Figure 4. Layout of treatments in each sub-catchment, 1) Stonejar with lucerne treatment (top) 2), Boundary as the control (middle) and 3) Mount Eagle with native trees (bottom) superimposed on a 2000 air photo. Lucerne covered a similar area to the tree plantings seen in the air photo. Bores E5, B3 and S3 are located down slope in the valley flats of each catchment (see Section 4.2 for more detail on bore locations) ..................................................................................................... 21
Figure 5. The three sub-catchments superimposed on a topographic map showing the stream ‘nick-point’ in the Mt. Eagle sub-catchment ............................................. 22
Figure 6. Drilling at site E1 on the rocky ridge, February 1990 ........................................... 25 Figure 7. Fully grown trees and piezometers at site E1, October 2007 .............................. 25 Figure 8. Location of drilling sites in the three sub-catchments .......................................... 26 Figure 9. EM surveys, pre and post tree planting in the Mt Eagle sub-catchment .............. 32 Figure 10. EM surveys, pre and post lucerne planting in the Stonejar sub-catchment ......... 33 Figure 11. Groundwater contour map for the three sub-catchments in 1992 ....................... 35 Figure 12. Groundwater contour map for the three sub-catchments in 2007, showing a
reduced hydraulic gradient since 1992 ................................................................ 35 Figure 13. Groundwater contour map for the Mt Eagle sub-catchment, May 1992 .............. 36 Figure 14. Groundwater contour map for the Mt Eagle sub-catchment, May 2003 .............. 36 Figure 15. Groundwater cross-section from rocky ridge to valley floor in the Mt Eagle sub-
catchment showing the falling watertable (dotted lines) between 1992 and 200837 Figure 16. Comparison of groundwater trends in upland sites ............................................. 38 Figure 17. Comparison of groundwater trends for break of slope sites ................................ 40 Figure 18. Comparison of groundwater trends for lower catchment discharge sites ............ 40 Figure 19. Saline seepage at site E2, September 1991 (ridge being ripped for tree planting
in background) ..................................................................................................... 44 Figure 20. Valley near site E2 has dried out and is no longer saline, October 2007 ............ 44 Figure 21. Waterlogging and salinity near site E5, September 1991 .................................... 45 Figure 22. The seepage area near site E5 has dried out, October 2007 .............................. 45 Figure 23. Winter waterlogging near site B2 in control catchment, June 2003 ..................... 46 Figure 24. Saline seepage near site B3 in control catchment, June 2003 (note that the trees
were previously planted on a saline area downslope of this site) ........................ 46 Figure 25. Composite graph showing groundwater salinity trends in deep wells.................. 47 Figure 26. Salinity trends of shallow watertables at valley sites in early 90s ........................ 48 Figure 27. Modelling results for Mt Eagle sub-catchment where the top quarter of the
catchment has been revegetated. After 100 years, the groundwater still discharges (watertable intersects with land surface) (reproduced from Smitt et al 2003) .................................................................................................................... 50

ACKNOWLEDGEMENTS
Report DWLBC 2010/07 8
Figure 28. Modelling results, for Mt Eagle sub-catchment where the top half of catchment has been revegetated. Over time, the no longer intersects (discharges) at 250 m break of slope (reproduced from Smitt et al 2003) .............................................. 51
Figure 29. Modelling results where the bottom half of catchment has been revegetated (reproduced from Smitt et al 2003) ...................................................................... 51
Figure 30. Modelling results: entire catchment revegetated (reproduced from Smitt et al 2003) .................................................................................................................... 52
LIST OF TABLES
Table 1. Sub-catchments with treatments ......................................................................... 19 Table 2. Bore monitoring site description (refer to Figure 8 for bore locations) ................. 23 Table 3. Interpretation of ECa readings in EM surveys (after NLWRA 2007) .................... 24 Table 4. Percentage of area occupied by ECa classes ..................................................... 30 Table 5. Comparison of standing water levels for key landscape positions showing general
falling groundwater levels .................................................................................... 41 Table 6. Groundwater responses to tree plantation ........................................................... 42 Table 7. Groundwater responses to lucerne planting ........................................................ 42 Table 8. Groundwater responses in the control sub-catchment ........................................ 42

SUMMARY
Report DWLBC 2010/07 9
SUMMARY
The theory of recharge reduction for salinity control came under serious consideration in South Australia some twenty years ago.
To test the theory, the Mt. Eagle research site near Keyneton in South Australia’s Mount Lofty Ranges was established in 1989, encompassing three saline sub-catchments in a local groundwater flow system. The Mt Eagle catchment is part of a network of dryland salinity focus areas that are monitored by the Department of Water Land and Biodiversity Conservation (DWLBC) across dryland agricultural regions of the State.
Different perennial vegetation treatments were planted in the two sub-catchments, with the third remaining as a control sub-catchment under annual crop/pasture.
Groundwater monitoring within each sub-catchment was undertaken from 1990 to 2008. During this period, an overall declining trend in rainfall was experienced (long term average rainfall being 525 mm).
Repeat ground-based EM (electromagnetic) surveys were undertaken in the two treatment sub-catchments, in 1989 prior to treatment, and in 2006.
Two modelling tools (FLOWTUBE and HARTT) were used to analyse groundwater flow and groundwater hydrographs respectively, so as to compare observed and expected trends in watertable levels within the context of rainfall trends.
Although climate is a major driver of groundwater responses and dryland salinity, the establishment of perennials in the two sub-catchments resulted in a drop in groundwater levels above and beyond that which would be expected from the declining rainfall trend alone. Repeat EM surveys confirmed a retraction in saltland extent and saltland severity, due to falling groundwater levels.
The relative water use of different vegetation was shown to be trees > dryland lucerne > annual pasture. Revegetating 20% of the area of a sub-catchment with trees effectively lowered groundwater levels beneath a saline discharge area situated 40 m down slope of the trees.
Results from the Mt. Eagle site support the theory of recharge reduction by planting perennial vegetation for salinity control. Revegetation has resulted in a significant “flattening” of the hydraulic gradient such that less saline discharge is expected in future, relative to pre-treatment conditions.
The Mt. Eagle trial results have confirmed that salinity processes need to be understood to effectively address salinity management in local groundwater flow systems.
These results demonstrate the value of consistent and sustained groundwater monitoring for improved understanding of the relative contribution of revegetation and climatic effects on salinity processes. Continued monitoring at this state focus site will allow for quantitative assessment of depth to groundwater levels and saline seepage in the long term under drying and wetting climatic cycles.

SUMMARY
Report DWLBC 2010/07 10
The results from long-term monitoring at Mt. Eagle have contributed to the development of the following recommendations for salinity management:
Define and prioritise the salinity problem, the assets being impacted, and the goal of salinity management,
Define the contributing groundwater catchment and processes (recharge area, flow pathway, discharge area),
Consider a range of management options appropriate to address the salinity problem,
Consider other potential benefits and costs

Report DWLBC 2010/07 11
INTRODUCTION
Dryland salinity has resulted from widespread native vegetation clearance for agricultural development. The resulting increased recharge of unused rainfall to groundwater systems has led to rising groundwater and subsequent discharge of salt to streams and to the land surface. The significant threat that salinity poses to natural and man-made assets in South Australia has long been recognised.
As the agency responsible for state level monitoring and reporting of dryland salinity, the Department of Water, Land and Biodiversity Conservation (DWLBC) has selected a series of representative focus sites across the state for this purpose (DWLBC, 2008a).
One of these focus sites, Mt. Eagle, is located near Keyneton in the Mt. Lofty Ranges, the site being representative of local groundwater flow system (GFS) in the Adelaide and Mount Lofty Ranges (AMLR) and SA Murray-Darling Basin (SAMDB) Natural Resources Management (NRM) regions (DWLBC, 2009 and DWLBC, 2008b).
Research into the effectiveness of recharge reduction for reducing the threat of dryland salinity commenced at Mt. Eagle in 1989. Results from this research are applicable to many areas within the Mt. Lofty Ranges, where dryland salinity is typically expressed as waterlogged valleys supporting thick or patchy sea barley grass (Critesion marinum alternative name Hordeum marinum).
Reclamation of such areas has traditionally involved planting the discharge areas with salt tolerant trees, shrubs and grasses. Work carried out by Dyson (1990) in Victoria showed that watertables could be lowered by planting trees and high water use perennial pastures such as dryland lucerne (Medicago stativa) along ridges and the upper and mid-slopes of catchments.
The Mt. Eagle trial was initially launched with the aim of quantifying the effect on depth to groundwater levels (watertable levels) of tree planting in identified high recharge zones (Dooley, 1991). The trial was subsequently expanded to include dryland lucerne as an alternative perennial to trees for recharge reduction. Current results are presented and discussed in this report.
Salinity indicators (depth to groundwater, groundwater salinity, extent and severity of saltland) at the Mt. Eagle focus site continue to be monitored by DWLBC, ensuring the future availability of long-term data for assisting in the evaluation and adaptive management of dryland salinity.

Report DWLBC 2010/07 12
AIM AND OBJECTIVES
The establishment of the Mt. Eagle research site aimed to quantify the impact of reducing groundwater recharge on saltland reclamation (Dooley, 1991). High recharge areas (upper ridges and slopes) within a saline sub-catchment at Mt. Eagle were established with trees to determine whether effective control of salinity in the sub-catchment could be realised through recharge reduction.
The research site was expanded to a neighbouring saline sub-catchment to include investigation of dryland lucerne establishment as an alternative option to trees for recharge reduction.
Results from repeat EM surveys and groundwater monitoring in the two treated sub-catchments were used to evaluate and compare the level of salinity control achieved, as compared to untreated salinity in a control sub-catchment supporting annual crop/pasture.
Secondary aims of the investigation included gaining better understanding of:
• The proportion of catchment area required to be revegetated to provide salinity control
• The relative water use of perennials versus annuals
• The salinity processes occurring within the site’s local groundwater flow system (GFS)
• The relationship between rainfall trends and depth to groundwater trends.
The landholders’ objectives included slowing or halting the predicted increase in salinity extent1, reducing the export of salt downstream, and increasing the amenity value of the Mt. Eagle hill face.
1 Predicted increases in dryland salinity extent in southern South Australia were summarised by Barnett (2000) in a report for the National Land and Water Resources Audit

Report DWLBC 2010/07 13
SITE BACKGROUND
LOCATION The Mt. Eagle site is located on the "Carlyle" property managed by James and Karen Mitchell, situated in South Australia’s Mount Lofty Ranges some 7.5 kilometres south east of Angaston and 2.5 km north west of Keyneton (refer to Figure 1).
The trial site is located on the Boundary Dividing Range, where small first order catchments become the headwaters of streams. The trial site comprises three sub-catchments: Mt Eagle, Stonejar and Boundary. The Mt. Eagle and Stonejar sub-catchments drain westwards to the North Para River, which flows through the Barossa Valley to Gawler and into the Gulf St. Vincent. On the other side of the divide, the Boundary control sub-catchment drains eastwards into the Marne River, which joins the River Murray south of Swan Reach. Mt Eagle is the highest point (450m) on the Boundary Range.

SITE BACKGROUND
Report DWLBC 2010/07 14
Figure 1. Map showing the location of the Mt Eagle focus area near Keyneton and three sub-catchments located along the Boundary Dividing Range
BOUNDARY DIVIDING RANGE

SITE BACKGROUND
Report DWLBC 2010/07 15
CLIMATE Average annual rainfall at the Mt. Eagle site, as recorded by the Mitchell family since 1962, is 525 mm. Monthly rainfall since 1962 for the Carlyle property is shown in Appendix A. The rainfall pattern is winter dominant, with over 60 mm per month in June, July and August. Episodic rainfall events (thunderstorms and cyclonic rainfall) are experienced occasionally, with waterlogging being a common occurrence in wetter years.
A long-term (1889-2008) residual rainfall curve for the Mt. Eagle site is shown in Figure 2. This graph is based on interpolation of data from surrounding rainfall stations, obtained from QNRW (SILO Data Drill).
Residual rainfall is the cumulative deviation from mean monthly rainfall, where an upward slope represents a wetter climatic phase and a downward slope a drying phase. As can be seen from Figure 2, the establishment of the Mt. Eagle trial site in the early 1990s coincided with a very wet phase (a peak), which was followed by an extended drier period.
Mt Eagle (Keyneton) residual rainfall curve
-500.00
-250.00
0.00
250.00
500.00
750.00
1000.00
1250.00
1500.00
1/01/1889
1/01/1894
1/01/1899
1/01/1904
1/01/1909
1/01/1914
1/01/1919
1/01/1924
1/01/1929
1/01/1934
1/01/1939
1/01/1944
1/01/1949
1/01/1954
1/01/1959
1/01/1964
1/01/1969
1/01/1974
1/01/1979
1/01/1984
1/01/1989
1/01/1994
1/01/1999
1/01/2004
1/01/2009
Date
Cum
ulat
ive
devi
atio
n fr
om m
ean
mon
thly
rain
fall
(mm
)
Figure 2. Residual rainfall curve (1880s – early 2009) for the Mt. Eagle site showing the declining trend in rainfall from the mid 1990s to present

SITE BACKGROUND
Report DWLBC 2010/07 16
GEOLOGY Basement rocks (Kanmantoo Group and Carrickalinga Head Formation) are aligned in a north-south direction and are sloping steeply to the east. The Kanmantoo Group of metasediments occurs in the eastern half of the Mt. Eagle site. The Carrickalinga Head Formation often outcrops as two units (Pannewig, 1994). The sandstone unit has fine to medium grained quartz and mica with small amounts of feldspar. Quartz rich sandstones are more resistant to weathering and form prominent ridges. The siltstone unit contains quartz, mica, feldspar and other minerals. This unit has high levels of mica, which is erodible and can lead to deeply weathered profiles in valleys and drainage lines. Pannewig (1994) also suggested that some mica may release small amounts of salts during the weathering process.
A north-south fault line bisects the western half of the Mt. Eagle site. Angaston Marble has outcropped to the west of the fault, forming steep rounded hills. A thin band of black pyritic shale has resulted in heavymetal contamination of a dam on this property (JB Mitchell, pers. comm.), most likely due to iron sulphides causing acid sulphate soils.
The Mt. Eagle peak is a remnant of an ancient land surface characterised by a flat summit surface capped by an ironstone hardpan, underlain by kaolinitic clays. Regional geology is defined on a digital geological map of the Angaston district (Burtt, 1999).
HYDROGEOLOGY The groundwater flow system (GFS) of the eastern Mount Lofty Ranges is classified as a local flow system occurring in fractured rock aquifers on steep hills (DWR, 2001). This type of GFS is typically found in steep hilly/rocky outcrop country, which is more conspicuous toward the eastern side of the ranges.
In a local GFS, groundwater recharge occurs across much of the landscape, but recharge may be proportionally greater where thin skeletal soils occur along rocky hill slopes and ridges. These areas are usually non-arable.
Groundwater discharge can occur where groundwater flow is impeded by sub-surface barriers/bottlenecks, for example rock bars or fault zones (Cresswell and Liddicoat 2004). Local groundwater constrictions or bottlenecks may coincide with stream nick points along drainage lines (watercourses) (Wilford 2004). A nick point occurs where the stream profile changes morphology rather abruptly. Broader valley profiles and valley fill sediments occur above the nick point, compared with narrower valley profiles and more incised creek lines below the nick point. Salinity and waterlogging often occur on the poorly drained flats above a nick point.
LANDSCAPE AND SOILS The Mt. Eagle peak lies at an elevation of 450 m in the Boundary Range, which is a watershed for drainage to the west (to the North Para River) and to the east (to the River Murray). Two major land systems dominate the Mt. Eagle trial site.

SITE BACKGROUND
Report DWLBC 2010/07 17
In the west (the Angaston Land System), the main landscape features include rocky crests and ridges, broad undulating rises and alluvial flats. Weathered rock is often evident within a metre of the surface. Soils are loam to sandy loam with red or brown clayey subsoils. Significant deposits of localised outwash sediments occur along the margins of valleys.
In the east (the Somme Land System), the landscape is undulating with moderately steep slopes formed on basement rocks and undulating to rolling rises and low hills. Metamorphosed sandstones and siltstones are deeply weathered in places forming kaolinitic clay and ironstone gravels. Localised erosion and deposition has resulted in clayey and sandy valley infill. The lower slopes and flats have deeper but less well drained soils.
Soil depth varies across the landscape, from shallow soils overlying basement rock on the ridges to deep soils over alluvium on valley flats. Clayey subsoils commonly have poor soil structure and tend to be poorly drained with associated waterlogging problems. Poor drainage due to clayey subsoils results in perching of water, or the occurrence of shallow seasonal watertables in low-lying areas. Saline seepage is most common where watercourses are significantly eroded. A more detailed description of landscape and soil features for Mt. Eagle can be found in Soil and Land Information (DWLBC, 2007).
VEGETATION AND LAND USE Pastoralists first settled the Angaston – Keyneton district around the middle of the nineteenth century, grazing stock on the open woodlands. The dominant woodland species were two eucalypts; red gum (Eucalyptus camaldulensis) and blue gum (Eucalyptus leucoxylon). At Mt. Eagle most red gums were felled for timber, while the blue gums were ringbarked and left standing, as they were considered aggressive competitors with pastures for soil moisture (NDSP, 2002).
By 1940, most of the site had been cleared except for the highest ridgeline which supported small pockets of mallee, including mallee box (Eucalyptus porosa), peppermint box (Eucalyptus odorata) and ridge-fruited mallee (Eucalyptus incrassata).
Current land use consists of grazing of improved annual grassy pastures, with occasional cereal cropping undertaken on the eastern slopes of the Mt. Eagle ridge. Some dryland lucerne is also grown, and is cut for hay or rotationally grazed.
DRYLAND SALINITY Dryland salinity was first observed on the Carlyle property in 1964 (NDSP, 2002). The major cause of salinity was increased recharge following tree clearing, exacerbated by a wetter rainfall phase from 1946 to 1958 (Figure 1). Increased recharge caused groundwater to rise significantly so that by the 1960s the watertable had intersected valley floors, with subsequent development of saline seepage. Rancic and Acworth (2008) have noted a similar cause (interaction between climate and land use change) for salinity outbreaks in NSW.
Salinity on the property is commonly expressed in gullies and depressions, characterised by areas of bare soil and the spread of sea barley grass. In 1967, the Mitchell family commenced a program of fencing off these areas and establishing salt tolerant grass species

SITE BACKGROUND
Report DWLBC 2010/07 18
such as puccinellia (Puccinellia ciliata), tall wheat grass (Thinopyrum ponticum) and salt water couch (Paspalum vaginatum).
Dryland salinity expanded noticeably on the property during the 1970s and 1980s, appearing in most of the drainage lines. In 1989, the percentage of salt affected land within each treatment sub-catchment at the Mt. Eagle site ranged from 1% to 5% of the sub-catchment area.
While the total area of salt affected land was not large, such small discrete patches were difficult to manage, and coincided with highly erodible soils. Additionally, the export of salt downstream to sensitive ecosystems and important irrigation areas was viewed as a serious catchment issue (NDSP, 2002).
When approached to be part of a research trial, the Mitchell family were keen to deal with the cause of the salinity problem (recharge), rather than the symptom (discharge). Their own on-farm observations of the potential for recharge control with perennials such as dryland lucerne encouraged them to support the establishment of salinity research at Mt. Eagle (NDSP, 2002).

METHODOLOGY
Report DWLBC 2010/07 19
METHODOLOGY
PERENNIAL VEGETATION TREATMENTS At the Mt. Eagle trial site, three sub-catchments were utilised. Two sub-catchments supported treatments, with one remaining as a control (Table 1).
Table 1. Sub-catchments with treatments
Sub-catchment name Size Treatment
(ha)
Mt Eagle (E) 52 Trees (8 ha)
Stonejar (S) 55 Lucerne (6 ha)
Boundary (B) 50 Control (annual crop/pasture)
In the first treatment sub-catchment (Mt. Eagle), four thousand trees were established during 1990 (initial planting) and 1991 (re-planting) over an area of 8 ha. The tree planting density used (500 stems/ha) was at the lower end of a range of densities recommended for recharge reduction blocks in areas receiving less than 600 mm rainfall (Marcar et al, 2002).
Preparation for tree planting included ripping at 5 m spacing, and weed control (using Roundup® herbicide). Seedlings were raised in a neighbouring plant nursery using seed collected locally where possible, including from remnants at the Mt. Eagle site. Hamilton tree planters were used for the planting operation, and follow up weed control was undertaken (with the herbicides Roundup® and Simazine®).
The major species planted were blue gum (Eucalyptus leucoxylon), red gum (Eucalyptus camaldulensis), and a mix of the local mallee species remaining at the summit of Mt. Eagle. These were augmented with a selection of native pine (Callitris preissii), sheoak (Allocasuarina verticillata) and acacias (Acacia pycnantha, Acacia mearnsii, Acacia paradoxa).
Given the changed hydrological status of the site, several “high water use” species such as sugar gum (Eucalyptus cladocalyx), southern mahogany (Eucalyptus botryoides) and Tasmanian blue gum (Eucalyptus globulus) were also planted according to micro-topography, in the wettest hillside depressions. Similarly, the swamp oak (Casuarina glauca) was planted in small areas showing early signs of salinity expression. A trial fodder area of tagasaste was established at the northern end of the tree block.
Figure 3 shows a 2007 panoramic view of the tree planting site.
In the Stonejar sub-catchment, the landholder established 6 ha of lucerne (Hunter River) in subdued valleys along the upper slopes in October 1991. A very dry spring led to poor establishment, and the area was re-sown in 1992.
A control catchment was chosen on the eastern side of the Boundary Range (property of Mr Bill Evans). The prevalent land use in the Boundary sub-catchment is grazing of annual pastures, with occasional cropping.

METHODOLOGY
Report DWLBC 2010/07 20
Figure 3. Panoramic view of the Mt Eagle sub-catchment in 2007 showing trees planted on a steep rocky ridge in the early 1990s
Figures 4 and 5 show the physical layout of the three sub-catchments, their topography and the location of the treatments. When defined topographically, all sub-catchments are similar in area (~ 50 ha). Hence the dryland lucerne treatment area (6 ha) represents around 10% of the total Stonejar sub-catchment area.
In Figure 5, the nick point is marked to illustrate the pronounced valley constriction that occurs in the Mt. Eagle sub-catchment. This nick point is important for determining the catchment area contributing to saline discharge within the sub-catchment, and groundwater discharge (baseflow) to stream flow. Given the area upstream of the nick point is 40 ha, and 8 ha of trees were established, the effective percentage of the Mt. Eagle sub-catchment area under trees is regarded as 20%.
When considering the impact of revegetation on saline seepage areas down slope and in the valley, the effective treatment percentage needs to be re-calculated. For some break of slope seepage areas 40 m downslope of the trees, the 8 ha of trees is estimated to represent approximately 70% coverage of the actual groundwater catchment contributing to those seeps.

METHODOLOGY
Report DWLBC 2010/07 21
Figure 4. Layout of treatments in each sub-catchment, 1) Stonejar with lucerne treatment
(top) 2), Boundary as the control (middle) and 3) Mount Eagle with native trees (bottom) superimposed on a 2000 air photo. Lucerne covered a similar area to the tree plantings seen in the air photo. Bores E5, B3 and S3 are located down slope in the valley flats of each catchment (see Section 4.2 for more detail on bore locations)

METHODOLOGY
Report DWLBC 2010/07 22
Figure 5. The three sub-catchments superimposed on a topographic map showing the stream ‘nick-point’ in the Mt. Eagle sub-catchment
METHODOLOGY
Report DWLBC 2010/07 23
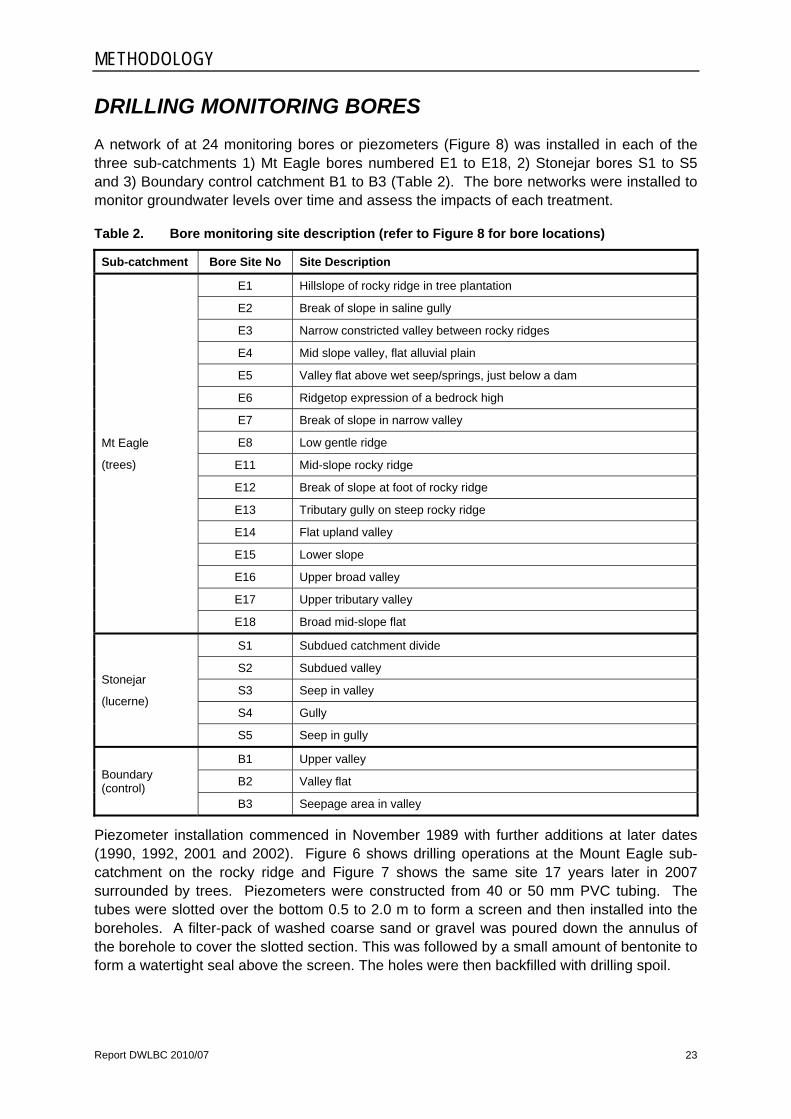
DRILLING MONITORING BORES A network of at 24 monitoring bores or piezometers (Figure 8) was installed in each of the three sub-catchments 1) Mt Eagle bores numbered E1 to E18, 2) Stonejar bores S1 to S5 and 3) Boundary control catchment B1 to B3 (Table 2). The bore networks were installed to monitor groundwater levels over time and assess the impacts of each treatment.
Table 2. Bore monitoring site description (refer to Figure 8 for bore locations)
Sub-catchment Bore Site No Site Description
Mt Eagle
(trees)
E1 Hillslope of rocky ridge in tree plantation
E2 Break of slope in saline gully
E3 Narrow constricted valley between rocky ridges
E4 Mid slope valley, flat alluvial plain
E5 Valley flat above wet seep/springs, just below a dam
E6 Ridgetop expression of a bedrock high
E7 Break of slope in narrow valley
E8 Low gentle ridge
E11 Mid-slope rocky ridge
E12 Break of slope at foot of rocky ridge
E13 Tributary gully on steep rocky ridge
E14 Flat upland valley
E15 Lower slope
E16 Upper broad valley
E17 Upper tributary valley
E18 Broad mid-slope flat
Stonejar
(lucerne)
S1 Subdued catchment divide
S2 Subdued valley
S3 Seep in valley
S4 Gully
S5 Seep in gully
Boundary (control)
B1 Upper valley
B2 Valley flat
B3 Seepage area in valley
Piezometer installation commenced in November 1989 with further additions at later dates (1990, 1992, 2001 and 2002). Figure 6 shows drilling operations at the Mount Eagle sub-catchment on the rocky ridge and Figure 7 shows the same site 17 years later in 2007 surrounded by trees. Piezometers were constructed from 40 or 50 mm PVC tubing. The tubes were slotted over the bottom 0.5 to 2.0 m to form a screen and then installed into the boreholes. A filter-pack of washed coarse sand or gravel was poured down the annulus of the borehole to cover the slotted section. This was followed by a small amount of bentonite to form a watertight seal above the screen. The holes were then backfilled with drilling spoil.

METHODOLOGY
Report DWLBC 2010/07 24
A topographic survey was carried out with a laser level in May 2003 to obtain the ground elevation at the base of each piezometer tube. The ground elevation at each site was relative to the elevation of roadside survey marker 1255 (BM244). Site E4C, having an elevation of 413m, was selected as the benchmark in the catchment, with all monitoring data at the remaining sites ‘tied’ into this site.
Drill soil samples were collected from a selection of representative bores at 1.0 m depth intervals for field description. Detailed drilling logs are presented in Appendix B.
Drilling recovery samples were also obtained at 11 sites to assess salt distribution in the soil and weathered layers (regolith). Laboratory analysis included pH, electrical conductivity (EC) and chloride ion content. The concentration of salt with depth (salt storage) was estimated from electrical conductivity of 1:5 soil water extracts (EC1:5) on the soil samples. Approximately 50 g of soil was added to 250 mL of distilled water and shaken before the EC reading was taken. EC1:5 units are deciSiemens per metre (dS/m). Soil and regolith salt storages (Appendix C) are expressed as milligrams of salt per kg of soil (mg/kg). Details of piezometer specifications are given in Appendix D.
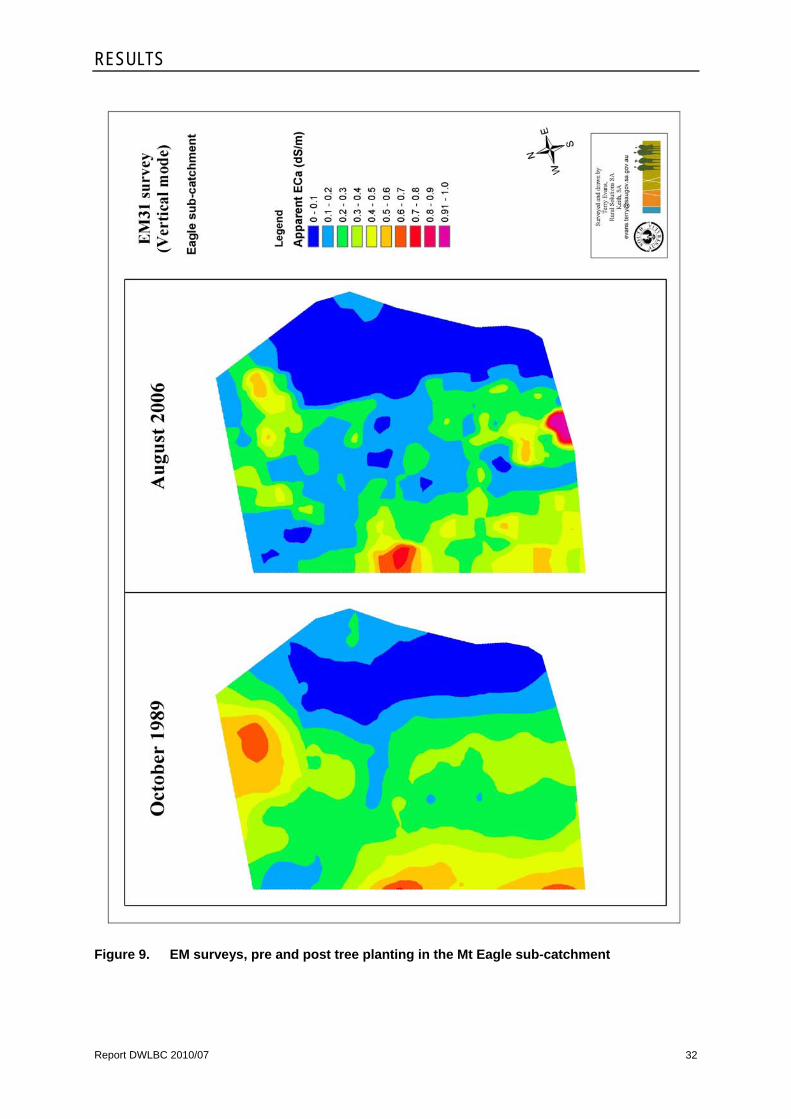
EM SURVEYS An electromagnetic (EM) induction survey using a Geonics EM31 meter was undertaken across the two treatment sub-catchments in October 1989. Both the Mt. Eagle and Stonejar sub-catchments were re-surveyed 17 years later in August 2006, when soil moisture levels were deemed similar to those prevailing at the time of the original surveys.
The 1989 survey was conducted on east-west transects at 50 or 100 m spacings with readings taken at 20 m intervals in the vertical dipole mode. For the 2006 survey, the EM31 was mounted on a quad bike and linked to an on-board differential GPS system. ECa readings were taken automatically along with the GPS position.
When used in the vertical dipole mode, the EM31 meter measured the bulk apparent electrical conductivity (ECa, recorded in dS/m) of the soil profile to a maximum depth of around 6 m. The EM31 meter responds to variations in soil moisture, soil salinity, clay content and cation exchange capacity of the soil. Following calibration with results from soil sampling, the strength of the relationship between ECa and soil salinity was determined, and the intensity of salt affected land interpreted from EM31 ECa guidelines (Table 3) (Slavich and Petterson 1993).
Table 3. Interpretation of ECa readings in EM surveys (after NLWRA 2007)
Intensity of salt affected land ECa (dS/m) Description
Non-saline
Slightly saline
Moderate saline
Severely saline
<0.5
0.5 – 1.0
1.0 – 1.5
>1.5
Land not affected by soil salinity
Ground seasonally damp, reduced vegetation diversity
Salt-tolerant plant species dominate
Bare salt crusts and samphire

METHODOLOGY
Report DWLBC 2010/07 25
Figure 6. Drilling at site E1 on the rocky ridge, February 1990
Figure 7. Fully grown trees and piezometers at site E1, October 2007

METHODOLOGY
Report DWLBC 2010/07 26
Figure 8. Location of drilling sites in the three sub-catchments

METHODOLOGY
Report DWLBC 2010/07 27
GROUNDWATER MONITORING Piezometer nests consisted of deep bores usually installed into hard rock at various depths across the catchment (ranging from ~ 5 to 35 m in depth at Mt Eagle sub-catchment, 6 to 19 m in Stonejar and 3 to 9 m in Boundary control sub-catchment).
Additional shallow observation wells were installed within the soil profile to around 1.5m depth. The shallow wells were installed to measure the water level and salinity of shallow groundwater in the valleys and to record any development of transient perched water tables on hill slopes following heavy rainfall. At some sites, intermediate depth bores were installed to around 2.5m depth.
Watertable levels were monitored on a monthly basis from 1990 until 1992. From 1993 onwards, water levels were monitored monthly from May to September and bi-monthly for the rest of the year. No monitoring was carried out in the control sub-catchment from 1994 until re-commencement in 1999. Water samples were collected from selected bores by manual bailing. Piezometers were sampled on a monthly basis until February 1992 and were analysed for pH, EC and chloride ion content. From 1995 onwards, samples were collected for EC analysis in March and September of each year.
GROUNDWATER TREND ANALYSIS Contextual data is required to analyse and interpret trends in watertable levels (depth to groundwater). Groundwater depth hydrographs are compared to cumulative residual rainfall curves to determine the influence of rainfall on groundwater level trends. Cumulative residual rainfall is the running total of the difference between actual rainfall and average rainfall from the first rainfall date to the latest reading.
Because trends in watertable levels usually show good correlation with cumulative residual rainfall, it can be difficult to separate the impact of recharge reduction treatments on groundwater levels from the impact of longer-term rainfall trends on groundwater levels. For Mt. Eagle trial results, a modelling tool called HARTT - Hydrograph Analysis: Rainfall and Time Trends (Ferdowsian et al. 2001) was used to analyse hydrograph responses.

METHODOLOGY
Report DWLBC 2010/07 28
HARTT is a statistical analysis tool that provides the ability to differentiate between the effect of rainfall fluctuations and the underlining trend of groundwater levels. Through an iterative multiple regression process, HARTT estimates a best fitting curve until the R-squared value of the difference between observed and calculated groundwater levels is maximised. R-squared values closer to 1 indicate that the overall formula provides a good fit between modelled and observed groundwater levels.
GROUNDWATER FLOW MODELLING Catchment scale groundwater modelling was used to examine hydraulic gradients of the groundwater. Hydraulic gradient influences how different recharge rates impact on the discharge of groundwater and extent of shallow water tables.
Groundwater gradients in the Mt. Eagle sub-catchment were simulated using FLOWTUBE, a simple numerical one-dimensional groundwater flow model (Dawes et al. 1997, Dawes et al. 2000). FLOWTUBE is a mass-balance model that can model groundwater recharge and discharge under various perennial vegetation treatments. The results of FLOWTUBE are considered to be a hydraulic gradient along an aquifer transect.
Water sources considered by FLOWTUBE are:
(a) point sources of runoff at the upstream end of the aquifer, often manifested as recharge beds collecting surface water from a steeper part of the catchment, and
(b) diffuse recharge or discharge spread in an arbitrary spatial and temporal pattern across the aquifer being modelled.
The latter water source is the recharge component most altered by the replacement of native perennial species with annual cropping and grazing systems in Australia.
Smitt et al modelled (2003) the Mt. Eagle sub-catchment using a series of linear flowtubes to simulate groundwater behaviour. FLOWTUBE aquifer description files and input parameters are provided in Smitt et al. (2008). Simulated groundwater heads reasonably matched standing watertable levels (SWL) over the length of the sub-catchment. There was a small discrepancy in the upper third of the sub-catchment between observed watertable and “best-fit” calibrated heads.
Four scenarios were modelled; 1) revegetation of the top quarter 2) top half and 3) bottom half of the sub-catchment, plus 4) revegetation of the entire sub-catchment.

Report DWLBC 2010/07 29
RESULTS
DRILLING PROFILES Profiles were characterised by silty and sandy loam topsoil on clay overlying weathered bedrock and sedimentary soil layers (the regolith). Some valley sites had a shallow natural hardpan at a depth of around 1 m. The hardpan was formed of gravel stones (sandstone, quartz, schist) in a slightly cemented matrix.
The regolith overlying fractured rock consisted of highly weathered in situ parent material. It comprised soft silty micaceous clayey sands and pale coloured talcy clays.
Bedrock comprised hard, unweathered fractured rock (metamorphosed sandstone and siltstone) that necessitated the use of specialised rock drilling equipment. A hammer drill bit was used to deepen the piezometer at site E1 after it had become dry (no longer deep enough to intercept groundwater) in 2001.
Detailed logs describing the drilling profiles, where piezometers were installed in the Mt. Eagle, Stonejar and Boundary sub-catchments, are given in Appendix B.
SALT STORAGE PROFILES Graphs of drill sample salt storage profiles from sites in different landscape positions in the Mt. Eagle and Stonejar sub-catchments are presented in Appendix C.
Upland ridges (sites E1 and E6)
Upland sites exhibited relatively uniform low salt content (100 to 400 mg/kg) in the top 10 m of the profile, with a prominent salt bulge (800 to 900 mg/kg) evident below 10 m depth. This pattern, where salt has been leached down the profile, is characteristic of groundwater recharge areas such as ridge tops and hill slopes (Smitt et al. 2008).
Break in slope and mid slopes (sites E4, E8, E12, E18 and S1)
These sites showed increasing salt concentration with depth. Salt contents ranged from 100 to 800 mg/kg in the top 5 m of the soil profile, increasing to 500 to 2000 mg/kg in the 10-15 m depth range. Double bulge profiles occurred at some sites (salt bulges within the top 6 m, then another salt bulge below 10 m). Results indicate that mid slope/break in slope sites were not as strongly leached as the upland ridge sites.
Valley floor discharge (sites E2, E5, and S3)
Salt storage profiles from drainage line sites exhibited larger concentrations of salt in the upper profiles (500 to 1700 mg/kg in the top 2 m). This pattern is characteristic of groundwater discharge sites in valley floors, where salinity levels are often concentrated through evapo-transpiration. At one discharge site (E5), the salt content of a bulge occurring within the top 10 m reached 2500 mg/kg.
Salt storage patterns similar to those at the Mt. Eagle site have been recorded in the nearby Keynes catchment (5 km north east of the Mt Eagle site). At this CSIRO research catchment (Cox and Reynolds, 1995), three main patterns of salt storage and distribution were found:

RESULTS
Report DWLBC 2010/07 30
(a) low salt storage profiles with increasing salinity at depth and a salt bulge at 10-15 m,
(b) salt bulges at two depths (3 m and 13 m) and
(c) high salt storage profiles, with the highest salt bulges occurring near the soil surface.
As with the Mt. Eagle site, pattern (a) is typical of upland recharge areas, while pattern (c) is typical of discharge areas in valley floors.
Wilford (2004) suggested that high salt stores in the Mount Lofty Ranges were associated with highly weathered bedrock (in situ regolith), and with alluvial sediments (deposited by flowing water) and colluvial sediments (accumulated at base of slopes). When clays are generated through weathering of primary rock minerals, the capacity of the landscape to store salts is increased.
EM SURVEYS Results for apparent electrical conductivity (ECa) from EM31 ground-based surveys (measures the soil zone from 3 to 6 metres in vertical mode) are shown in Table 4. Both the Mt. Eagle and Stonejar sub-catchments were initially surveyed in October 1989 prior to any treatment, and subsequent to treatment in August 2006.
Table 4. Percentage of area occupied by ECa classes
ECa class
(dS/m)
Mt Eagle sub-catchment Stonejar sub-catchment
1989 2006 1989 2006
0.0 – 0.1 Non saline
0.1 – 0.2
0.2 – 0.3
0.3 – 0.4
0.4 – 0.5
16%
17%
32%
19%
9%
23%
29%
25%
13%
7%
13%
27%
26%
13%
5%
23%
31%
18%
9%
6%
0.5 – 0.6 Slightly saline
0.6 – 0.7
0.7 – 0.8
0.8 – 0.9
0.9 – 1.0
7%
1%
0
0
0
2%
1%
0
0
0
4%
3%
3%
3%
2%
5%
3%
3%
2%
1%
Mt Eagle sub-catchment = trees, Stonejar sub-catchment = lucerne treatment
The results in Table 4 suggest a contraction in the area of salt affected land (greater than 0.5 ECa) in the Mt. Eagle sub-catchment, from 8% of the sub-catchment area in 1989 to 3% in 2006. For the Stonejar sub-catchment, there was little apparent contraction in saltland area (15% to 14%). These results reflect the relative effectiveness of the two treatments (trees vs dryland lucerne) in reducing recharge.
Direct comparison of readings between the two surveys (February 1989 and October 2006) is limited to some extent by seasonal variables, which may account for conductivity changes due to differences between soil moisture and temperature between the two surveys

RESULTS
Report DWLBC 2010/07 31
(DWLBC, In Press), including changes in groundwater within the sphere of influence of the instrument. As well, different methodologies were used, with the vehicle mounted 2006 surveys providing much higher resolution and more accurate representations of ECa in the landscape.
However, comparison of photo-point images (Figures 19 – 22), along with visual inspection of discharge sites, corroborates the interpretation of the repeat EM surveys for the Mt. Eagle sub-catchment, that salt land area has indeed contracted.
Figures 9 and 10 present the EM survey data for the two treatment sub-catchments in a mapped format, with the following ECa zones identifiable:
0.00 – 0.10 dS/m (dark blue): indicates high rocky ridge tops and bedrock outcrops, or very shallow regolith overlying fractured rock
0.10 – 0.20 dS/m (light blue): indicates rising ground which may reflect either shallow regolith and/or low salt storage profiles
0.20 – 0.50 dS/m (green): indicates break-of-slope and mid slope positions with an increasing salt store in the profiles
0.50 - 0.60 dS/m (orange): indicates low lying areas of the landscape where higher profile salt storages and shallow saline groundwaters are probable
0.60 – 1.00+ dS/m (red): indicates saline areas where sea barley grass has appeared.
Close inspection of Figures 9 and 10 highlights the fact that at depth (between 3 and 6m) the area of subsurface salinity (defined as > 0.5 ECa) has contracted over time.
RESULTS
Report DWLBC 2010/07 32
Figure 9. EM surveys, pre and post tree planting in the Mt Eagle sub-catchment

RESULTS
Report DWLBC 2010/07 33
Figure 10. EM surveys, pre and post lucerne planting in the Stonejar sub-catchment

RESULTS
Report DWLBC 2010/07 34
GROUNDWATER HYDROLOGY
GROUNDWATER CONTOUR MAPS
Groundwater contour maps are shown for the three sub-catchments for September 1992 (Figure 11) and September 2007 (Figure 12). For the Mt. Eagle sub-catchment, higher resolution maps are presented, overlain on pre and post tree planting aerial photographs (Figures 13 and 14). The dominant direction of groundwater flow within each sub-catchment is down slope (as indicated by arrows).
Groundwater flows from the upland ridges and converges toward the outlet of each sub-catchment. In 1992, the hydraulic gradient between the ridges and the valleys was much steeper, whereas by 2007 a significant flattening of the gradient had occurred.
Because bedrock is striking in a north-south direction, aquifer transmissivity may be greater in the N-S than in the E-W direction. In some instances, this may cause transportation of groundwater across sub-catchment divides.
In the Mt. Eagle sub-catchment, the watertable gradient has remained relatively flat between the break of slope and the steep rocky ridge. A zone of steeper hydraulic gradient occurs just below the break of slope, possibly representing a low permeability zone where the regolith has thickened and become more clayey down slope.

Report DWLBC 2010/07 35
Figure 11. Groundwater contour map for the three sub-catchments in 1992 Figure 12. Groundwater contour map for the three sub-catchments in 2007, showing a reduced hydraulic gradient since 1992

Report DWLBC 2010/07 36
Figure 13. Groundwater contour map for the Mt Eagle sub-catchment, May 1992
Figure 14. Groundwater contour map for the Mt Eagle sub-catchment, May 2003
RESULTS
Report DWLBC 2010/07 37
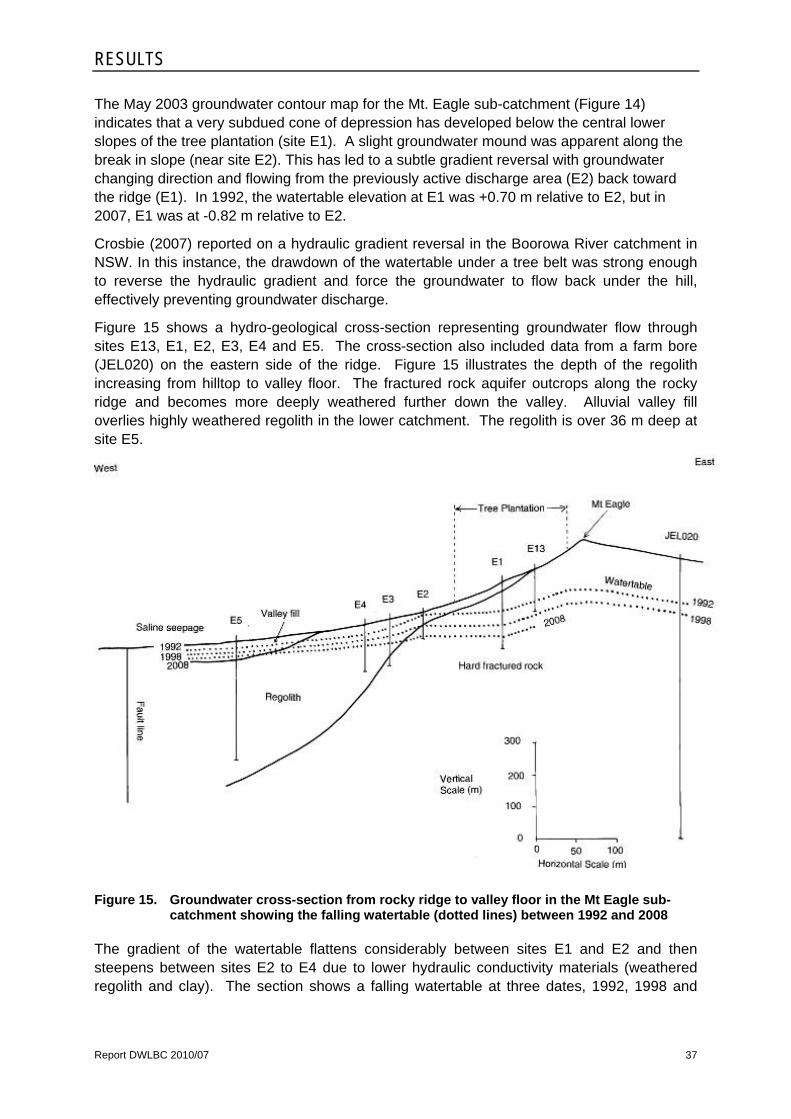
The May 2003 groundwater contour map for the Mt. Eagle sub-catchment (Figure 14) indicates that a very subdued cone of depression has developed below the central lower slopes of the tree plantation (site E1). A slight groundwater mound was apparent along the break in slope (near site E2). This has led to a subtle gradient reversal with groundwater changing direction and flowing from the previously active discharge area (E2) back toward the ridge (E1). In 1992, the watertable elevation at E1 was +0.70 m relative to E2, but in 2007, E1 was at -0.82 m relative to E2.
Crosbie (2007) reported on a hydraulic gradient reversal in the Boorowa River catchment in NSW. In this instance, the drawdown of the watertable under a tree belt was strong enough to reverse the hydraulic gradient and force the groundwater to flow back under the hill, effectively preventing groundwater discharge.
Figure 15 shows a hydro-geological cross-section representing groundwater flow through sites E13, E1, E2, E3, E4 and E5. The cross-section also included data from a farm bore (JEL020) on the eastern side of the ridge. Figure 15 illustrates the depth of the regolith increasing from hilltop to valley floor. The fractured rock aquifer outcrops along the rocky ridge and becomes more deeply weathered further down the valley. Alluvial valley fill overlies highly weathered regolith in the lower catchment. The regolith is over 36 m deep at site E5.
Figure 15. Groundwater cross-section from rocky ridge to valley floor in the Mt Eagle sub-catchment showing the falling watertable (dotted lines) between 1992 and 2008
The gradient of the watertable flattens considerably between sites E1 and E2 and then steepens between sites E2 to E4 due to lower hydraulic conductivity materials (weathered regolith and clay). The section shows a falling watertable at three dates, 1992, 1998 and

RESULTS
Report DWLBC 2010/07 38
2008. A slight gradient reversal between E1 and E2 developed in the late 1990s. This gradient reversal caused decreased surface discharge of groundwater in downslope areas.
GROUNDWATER LEVEL HYDROGRAPHS
Long-term groundwater level data is available from 15 monitoring sites across the three sub-catchments, although there is a broken record of 4 years in the control sub-catchment. Appendix E contains hydrographs from these sites and compares groundwater levels with cumulative residual rainfall from 1990 until early 2008.
Appendix F lists the highest and lowest standing groundwater levels along with the overall linear trend experienced at each of the 15 sites since records commenced. All sites recorded a negative linear trend (falling groundwater), as depicted in the hydrograph for upland sites in the three sub-catchments (Figure 16).
Mt Eagle (Keyneton) Standing Water Level RecordsUpland Catchment Sites
(SWL from Obsw ell, Rainfall from SILO Data Drill [139.1degE, 34.5degS])
-2
0
2
4
6
8
10
12
14
16
18
20Jan-89 Jan-91 Jan-93 Jan-95 Jan-97 Jan-99 Jan-01 Jan-03 Jan-05 Jan-07 Jan-09
Date
Stan
ding
Wat
er L
evel
(m,
belo
w g
roun
d le
vel)
-200
0
200
400
600
800
1000
Cum
ulat
ive
devi
atio
n fr
om
mea
n m
onth
ly ra
infa
ll (m
m)
E1C_E [trees] B1C [control] S1C [ lucerne] Keyneton residual rainfall curve
Ground Surface
HARTT trends. trees: -0.55 m/year (falling), control: -0.41 m/year (falling), lucerne: -0.32 m/year (falling)
Figure 16. Comparison of groundwater trends in upland sites
As Figure 16 illustrates, trends in depth to groundwater tend to reflect the residual rainfall curve. Rainfall at the Mt. Eagle site has shown a general declining trend from 1993 to 2000 followed by a period of stabilisation.
The highest watertable levels shown in Figure 16 coincided with a very wet period that occurred between 1990 and 1992. Depth to groundwater levels then fell until the year 2000, albeit with significant recharge spikes following the wet winters of 1995 and 1996. This general falling trend in groundwater levels since the mid 1990s was reflected at all 15 sites, including in the control sub-catchment.

RESULTS
Report DWLBC 2010/07 39
Figure 16 also illustrates a subtle rising trend in depth to groundwater for tree and lucerne treatments since the year 2000, following wetter years. However, the lucerne treatment groundwater levels showed a more significant rising trend compared to tree treatment. This rising trend is most likely induced by a slow deterioration of the lucerne stand, resulting in less overall water use and therefore an increase in recharge.
Analysis of the seasonal peaks and troughs evident in the hydrograph (Figure 16) suggested that the threshold monthly rainfall for a recharge pulse to occur was 50–100 mm. A wet month of 100+ mm rainfall usually produces distinct spikes (groundwater rises) in the hydrograph.
Climate is a major driver of groundwater level trends (Dooley et al. 2008, Rancic and Acworth 2008, Reid et al. 2008), and climatic factors tend to mask the impact of land use change on groundwater levels. Application of the HARTT model at a number of key sites confirmed that the trees, and to a lesser extent lucerne, produced larger falls in watertable levels (for equivalent landscape positions) than that which occurred in the control sub-catchment.
A HARTT analysis undertaken in 2008 for upland sites (Figure 16) confirmed that the trees produced larger falls in groundwater levels compared to both lucerne and annual crop/pasture land uses:
trees = a falling trend of 0.55 m/yr
lucerne = a falling trend of 0.32 m/yr
control = a falling trend of 0.41 m/yr
In this instance, groundwater trends under the lucerne treatment were similar to the control. The lack of significant difference between the two treatments can be attributed to the substantial growth of trees adjacent to the control sub-catchment which dominated recharge effects in the Boundary catchment (bore B1).
HARTT analysis for break of slope sites in the Mt Eagle sub-catchment (Figure 17) resulted in the following groundwater trends for the treatment and control sub-catchments:
trees = a falling groundwater trend of 0.42 m/yr
lucerne = a falling groundwater trend of 0.25 m/yr
control = a falling groundwater trend of 0.19 m/yr
HARTT analysis undertaken for lower catchment discharge sites (Figure 18) determined a falling groundwater trend of 0.18 m/yr in the tree trial sub-catchment compared to a falling trend of 0.06 m/yr in the control sub-catchment (annual crop/pasture).

RESULTS
Report DWLBC 2010/07 40
Mt Eagle (Keyneton) Standing Water Level RecordsUpland Break of Slope Sites
(SWL from Obsw ell, Rainfall from SILO Data Drill [139.1degE, 34.5degS])-2
0
2
4
6
8
10Jan-89 Jan-91 Jan-93 Jan-95 Jan-97 Jan-99 Jan-01 Jan-03 Jan-05 Jan-07 Jan-09
Date
Stan
ding
Wat
er L
evel
(m,
belo
w g
roun
d le
vel)
-200
0
200
400
600
800
1000
Cum
ulat
ive
devi
atio
n fr
om
mea
n m
onth
ly ra
infa
ll (m
m)
E2C [ trees] B2C [control] S3C [ lucerne] Keyneton residual rainfall curve
Ground Surface
HARTT results. trees: -0.42 m/year (falling), control: -0.19 m/year (falling), lucerne: -0.25 m/year (falling)
Figure 17. Comparison of groundwater trends for break of slope sites
Mt Eagle (Keyneton) Standing Water Level RecordsLower Catchment Discharge Sites
(SWL from Obsw ell, Rainfall from SILO Data Drill [139.1degE, 34.5degS])-2
0
2
4
6
8Jan-89 Jan-91 Jan-93 Jan-95 Jan-97 Jan-99 Jan-01 Jan-03 Jan-05 Jan-07 Jan-09
Date
Stan
ding
Wat
er L
evel
(m,
belo
w g
roun
d le
vel)
-200
0
200
400
600
800
1000
Cum
ulat
ive
devi
atio
n fr
om
mea
n m
onth
ly ra
infa
ll (m
m)
E5B [ trees] B3C [control] Keyneton residual rainfall curve
Ground Surface
E5B (trees): -0.18 m/year (falling), B3C (control: -0.06 m/year (falling)
Figure 18. Comparison of groundwater trends for lower catchment discharge sites

RESULTS
Report DWLBC 2010/07 41
The magnitude of the falls in watertable level within the three sub-catchments can be gleaned from Table 5, which compares autumn (lowest) watertable levels for selected sites at each landscape position. Data for April 1990 represents pre-treatment conditions.
Table 5. Comparison of standing water levels for key landscape positions showing general falling groundwater levels
Site Site position SWL 30 April 1990
(m)
SWL 14 Nov 2005
(m)
SWL 8 April 2008
(m)
Difference in SWL between 1990 and 2008
(m)
E1C_E (trees)
E2C (trees)
E5B (trees)
S1C (lucerne)
S3C (lucerne)
B1C (control)
B2C (control)
B3C (control)
Uplands
Break of slope
Discharge
Uplands
Break of slope
Uplands
Break of slope
Discharge
10.94
1.03
0.97
6.42
1.28
4.50
0.84
-0.73
16.38
4.39
1.66
8.95
2.14
7.25
1.09
-0.71
18.29
8.08
4.36
10.96
5.33
Dry
4.84
0.99
-7.35
-7.05
-3.39
-4.54
-4.05
-
-4.00
-1.72
Standing water levels are in m below ground surface. Negative sign indicates water level is above ground surface
Upland sites
The data (Table 5) indicates that groundwater levels fell by 5.44 m at E1C_E and 2.75 m at B1C between April 1990 and November 2005. Therefore, groundwater levels fell 2.69 m more beneath trees than under crops and pastures over this time. In 2008, B1C was dry indicating that the groundwater levels had fallen below the bore depth of 8.52 m (Appendix D).
Break of slope sites
Comparison of site E2C (40 m downslope of the tree plantation) and site B2C in the control catchment indicates that groundwater levels have fallen by 7.05 m at E2C and 4.00 m at B2C between April 1990 and April 2008 (Table 5). This gives a net fall in groundwater levels of 3.05 m at the tree site relative to the annual crop/pasture land use.
Lower catchment discharge sites
Comparison of site E5B (270 m down slope of the tree plantation) and site B3C in the control sub-catchment indicates that groundwater levels have fallen by 3.39 m at E5 and 1.72 m at B3 between April 1990 and April 2008 (Table 5). This gives a net fall in groundwater levels of 1.67 m in the lower catchment of the tree site relative to the crop/pasture land use.
The largest measured falls in watertable were recorded at sites within or near the tree treatment in the Mt. Eagle sub-catchment. Here, falls greater than 10 m over 18 years were observed (Table 6). As the distance from the trees increased, so the difference in SWL decreased. At 100 m down slope from the trees, the watertable has fallen by 7 m, which is 3 m less than that observed within the trees.

RESULTS
Report DWLBC 2010/07 42
Table 6. Groundwater responses to tree plantation
Site Distance from trees (m)
Difference in SWL (1990-2008)1
(m)
Trend2
(m/yr)
E1
E12
E6
E2
E8
E3
E4
E5
Within trees
10
25
40
55
80
115
270
10.12
10.39
8.95
8.67
9.20
8.62
7.05
4.77
-0.50
-0.52
-0.45
-0.43
-0.46
-0.38
-0.27
-0.18 1 Difference between the highest (1990) and lowest watertable levels (2008) 2 Trend value is obtained from the OBSWELL website by choosing the “fit a linear trend line” to hydrographs
In the Stonejar sub-catchment, the lucerne grew vigorously during the 1990s, but thinned out significantly in the 2000s such that water levels began to rise again in this sub-catchment between 2000 and 2006. However, over the 18 year monitoring period, watertables have fallen by up to 9 m within the lucerne, and fallen by 4 m some 60 m down slope of the lucerne (Table 7).
Table 7. Groundwater responses to lucerne planting
Site Position Difference in SWL 1
(m)
Trend2
(m/yr)
S1
S2
S3
S5
Within lucerne
Within lucerne
45 m from lucerne
60 m from lucerne
7.82
8.86
6.38
3.93
-0.31
-0.33
-0.24
-0.12 1 SWL Range = difference between the highest and lowest watertable levels (1990-2008) 2 Trend value is obtained from the OBSWELL website by choosing the “fit a linear trend line” to hydrographs
In the control sub-catchment, falls of up to 8 m were recorded in the upper catchment at site B1 (Table 8). However, this fall is thought to have been enhanced by a small grove of trees growing close to the piezometer, reflected in the land use “pasture + trees” (Table 8). At the break of slope and lower catchment sites respectively, falls of 5 m and 2.4 m were recorded under annual pasture.
Table 8. Groundwater responses in the control sub-catchment
Site Land use Difference in SWL 1
(m)
Trend2
(m/yr)
B1
B2
B3
Pasture + trees
Pasture
Pasture
8.10
5.08
2.38
-0.41
-0.19
-0.06 1 SWL Range = difference between the highest and lowest watertable levels (1990-2008) 2 Trend value is obtained from the OBSWELL website by choosing the “fit a linear trend line” to hydrographs

RESULTS
Report DWLBC 2010/07 43
Many piezometers, particularly on the upper slopes and rocky ridges, have become dry over the monitoring period. Bores at several sites have been deepened (some three times) to chase a rapidly falling watertable. Due to drilling and cost constraints, monitoring site B1 in the control sub-catchment was not deepened (it became dry in 2002), and has had only intermittent recordings of watertable levels since then (Table 5).
GROUNDWATER DISCHARGE
The flat valley upstream of the nick point was waterlogged and saline in the early 1990s (Figure 21). Saline baseflow (groundwater flow to streams) occurs in the incised drainage line downstream of the nick point, representing another expression of dryland salinity.
Break-in-slope discharge (caused by a change in hydraulic conductivity of the aquifer materials) occurred at sites E2, B2 and S3 during the early 1990s, when groundwater was much closer to the surface.
Figures 19 to 22 illustrate the visual impact of the relative decline in watertable in the Mt. Eagle sub-catchment, with before-treatment and after-treatment photos. At both the break of slope and lower catchment landscape positions, previous seepage areas have now dried out and saline indicators have largely disappeared.
In comparison, Figures 23 and 24 show the continued occurrence of seepage areas for similar landscape positions within the control sub-catchment. At the discharge area depicted in Figure 24, artesian (above the soil surface) groundwater levels are still recorded each winter.

RESULTS
Report DWLBC 2010/07 44
Figure 19. Saline seepage at site E2, September 1991 (ridge being ripped for tree planting in background)
Figure 20. Valley near site E2 has dried out and is no longer saline, October 2007

RESULTS
Report DWLBC 2010/07 45
Figure 21. Waterlogging and salinity near site E5, September 1991
Figure 22. The seepage area near site E5 has dried out, October 2007

RESULTS
Report DWLBC 2010/07 46
Figure 23. Winter waterlogging near site B2 in control catchment, June 2003
Figure 24. Saline seepage near site B3 in control catchment, June 2003 (note that the trees were previously planted on a saline area downslope of this site)

RESULTS
Report DWLBC 2010/07 47
GROUNDWATER SALINITY TRENDS – DEEPER AQUIFERS
Groundwater can be moderately saline in the eastern Mount Lofty Ranges, with salinities ranging from 5 to 15 dS/m (3 000 to 10 000 mg/L TDS). This is due in part to micaceous clays reducing the permeability of fracture zones in the aquifer, providing less opportunity for salts to be flushed through the groundwater flow system.
Groundwater salinity, along with water levels, has been consistently measured at the Mt. Eagle site over many years, with piezometers having been sampled in autumn and spring of each year since 1995. Groundwater salinity (EC time series) graphs are displayed in Appendix G, along with a conversion table of EC to TD.
At the Mt. Eagle site, the spatial distribution of groundwater salinity bears little relationship to topography, with several relatively large values occurring beneath topographic highs (e.g. 15+ dS/m at sites on the rocky ridge). This indicates a rather stagnant flow system, as evidenced by the low hydraulic gradient in the uplands.
Some large fluctuations in groundwater salinity have been measured over time. For example at site E1C (uplands site under tree treatment), salinity levels between 1995 and 1998 increased from 15 to 24 dS/m. Examination of the salt storage profile for E1C shows a salt bulge at 8 to 12 m. Remobilisation of the profile salt storage may account for the observed rises in groundwater salinity.
Site E1E was drilled next to E1C in 2001. The salinity levels were initially very low in the fractured rock aquifer but increased steadily from 3 dS/m in 2001 to 20 dS/m in 2007. The reason for the increasing salinity trend at site E1 (in the middle of the tree plantation) may be due to concentration of salt as the aquifer dried out following increased tree transpiration.
In general, the time series data of groundwater salinity levels (Figure 25) suggests a freshening trend at many sites during the late 1990s, with groundwater salinities again rising after 2002. As an example, the initial salinity at site S3C (10 – 12 dS/m) fell to a low point of 4 dS/m in 2002, and has since risen to be 11 dS/m in 2008.
Salinity Levels for Deep Wells
02468
1012141618202224
Jan-90
Jan-91
Jan-92
Jan-93
Jan-94
Jan-95
Jan-96
Jan-97
Jan-98
Jan-99
Jan-00
Jan-01
Jan-02
Jan-03
Jan-04
Jan-05
Jan-06
Jan-07
Jan-08
Jan-09
Date
EC (d
S/m
)
E1C E1E S3C
Figure 25. Composite graph showing groundwater salinity trends in deep wells

RESULTS
Report DWLBC 2010/07 48
GROUNDWATER SALINITY TRENDS - SHALLOW AND PERCHED WATERTABLES
At the Mt. Eagle site, shallow wells were installed to measure the watertable levels and salinity levels of shallow watertables in valleys (discharge sites), and of transient perched watertables that formed on hillslopes after heavy rainfall.
Figure 26 is a composite of shallow wells showing salinity (EC) trends for the shallow watertable in the discharge areas of each sub-catchment. A permanent and relatively saline shallow watertable occurred at valley sites in all sub-catchments (E2, E3, S3, B2,) during the early 1990s.
As groundwater levels dropped during between 1992 and late 1990s, the shallow watertable in the valleys became transient and much fresher (sites E2, E3, S3, B2), for example, well E2A freshened from 7 dS/m in 1990 to under 1 dS/m by 2006.
However by the late 1990s, shallow watertables were only recorded after heavy winter rainfall. Since water is currently not observed in the intermediate depth (“B”) wells, shallow groundwater is now considered to be of a perched nature and no longer in direct connection with the deeper aquifer. For example at site E2, in July 2005, water with a low salinity level of 1.0 dS/m was present in well E2A, but well E2B was dry. Groundwater was over 6 m deep in piezometer E2C.
Figure 26. Salinity trends of shallow watertables at valley sites in early 90s
Bore B3A in the control sub-catchment has become more saline over time (Figure 26), increasing from around 5 dS/m to over 7 dS/m. This increase has occurred due to the continued discharge of saline water to the surface under artesian pressure.
The occurrence of perched watertables higher in the catchment was common at the Mt. Eagle site in the early 1990s. Developing during the winter months and dissipating by late spring, these ephemeral watertables formed either on soft highly weathered parent materials on top of hard rock (higher ridge slopes), or above a clay layers (soil B horizon) on the gentler hill slopes.

RESULTS
Report DWLBC 2010/07 49
The average water salinity (EC) observed for all shallow wells on hill slopes was 0.64 dS/m. This low salinity reading for perched watertables on the upper and mid slopes reflected the low salt storage recorded in the top 2 m of the soil profile.
Since the late 1990s, formation of perched watertables in the Mt. Eagle sub-catchment has been less frequent, due to the combined influence of the tree establishment and the drier climatic regime. Research in the nearby Keynes catchment (J Cox, CSIRO, pers. comm.) determined that perched watertables were a preferred flow mechanism for episodic recharge, and needed to be dewatered if recharge was to be effectively prevented.
Some recharge is still occurring beneath the trees, as evidenced by the occasional development of perched watertables and recharge spikes (sharp rises in groundwater levels) in the hydrographs for the Mt. Eagle sub-catchment. This episodic recharge is associated with large rainfall events where the ability of the trees to fully intercept rainfall and dewater the profile is partially limited by incomplete canopy closure. Paradoxically, the authors have noted tree deaths over the past 12 months (2008) as a result of extended dry conditions and receding groundwater.
GROUNDWATER FLOW MODELLING For the Mt. Eagle sub-catchment, groundwater flow modelling using FLOWTUBE was undertaken, with the results presented in graphical format (Figures 27 to 30). The schematics represent cross-sections from the ridge top (distance=0 m) to the valley floor and shows the land surface (brown line) and an inferred lower boundary or basement of the aquifer (black line). The modelling results show the watertable at different time intervals (baseline, 5, 10, 50 and 100 years) under the revegetated catchment. The watertable (dark blue line) is the upper boundary of the groundwater in the unconfined aquifer at time zero. The watertable at each time step is shown in a different colour.
All of the modelling runs assume revegetation by mature plants (i.e. recharge is reduced by 90% after the first year of planting).
For revegetation of the top quarter of the Mt. Eagle sub-catchment (Figure 27), groundwater modelling predicted the following outcomes:
The biggest fall in the watertable levels (depth to groundwater) occurs within the upper part of the catchment and becomes apparent after the first 5 years
Equilibrium is achieved between 10 to 20 years (10 – 100 year scenarios overlap and there is no further lowering of the watertable)
Groundwater still discharges in the lower third of the catchment (watertable intersects with land surface at 250 m distance from the ridge top).

RESULTS
Report DWLBC 2010/07 50
Mt Eagle Catchment(Top Quarter revegetated)
350
360
370
380
390
400
410
420
430
440
450
0 50 100 150 200 250 300 350 400 450Distance across catchment (m)
Elev
atio
n (m
, AH
D)
Surface ElevationBasementWater TableReveg (5yrs)Reveg (10yrs)Reveg (20yrs)Reveg (50yrs)Reveg (100yrs)
Figure 27. Modelling results for Mt Eagle sub-catchment where the top quarter of the catchment has been revegetated. After 100 years, the groundwater still discharges (watertable intersects with land surface) (reproduced from Smitt et al 2003)
In the second scenario (Figure 28), the top half of the catchment is revegetated and modelling predicted the following outcomes:
The largest fall in the water table within the upper part of the catchment is seen after the first 5 years
Equilibrium is achieved after approximately 50 years
In the upper half of the catchment, there is a slight fall in watertable level and the groundwater stops discharging to the surface (i.e. watertable no longer intersects at 250 m distance)
There was a significant lowering of watertables in the upper half of the catchment while waterlogged areas remained in the lower third of the catchment.

RESULTS
Report DWLBC 2010/07 51
Mt Eagle Catchment(Top half revegetated)
350
360
370
380
390
400
410
420
430
440
450
0 50 100 150 200 250 300 350 400 450Distance across catchment (m)
Elev
atio
n (m
, AH
D)
Surface ElevationBasementWater TableReveg (5yrs)Reveg (10yrs)Reveg (20yrs)Reveg (50yrs)Reveg (100yrs)
Figure 28. Modelling results, for Mt Eagle sub-catchment where the top half of catchment has been revegetated. Over time, the no longer intersects (discharges) at 250 m break of slope (reproduced from Smitt et al 2003)
In the third scenario (Figure 29), the bottom half of the catchment is revegetated and modelling predicted that there would be no significant impact on the watertable throughout the catchment. Comparison of this result to the previous scenario (Figure 28) reinforces the concept that the majority of the recharge at Mt. Eagle occurs in the upper part of the catchment. The aquifer has insufficient capacity to cope with the amount of recharge occurring in the upper part of the catchment, which therefore results in discharge occurring in the lower third of the catchment.
Mt Eagle Catchment(Bottom half revegetated)
350
360
370
380
390
400
410
420
430
440
450
0 50 100 150 200 250 300 350 400 450Distance across catchment (m)
Elev
atio
n (m
, AH
D)
Surface ElevationBasementWater TableReveg (5yrs)Reveg (10yrs)Reveg (20yrs)Reveg (50yrs)Reveg (100yrs)
Figure 29. Modelling results where the bottom half of catchment has been revegetated (reproduced from Smitt et al 2003)

RESULTS
Report DWLBC 2010/07 52
The modelling results indicate that if the entire catchment were revegetated (Figure 30), then the watertable in the lower third of the catchment would be significantly reduced. Equilibrium would be achieved after approximately 100 years and groundwater stops discharging across the whole catchment. This is the only scenario (entire catchment revegetated) that significantly reduces the watertable in the lower third of the catchment.
Mt Eagle Catchment(Entire catchment revegetated)
350
360
370
380
390
400
410
420
430
440
450
0 50 100 150 200 250 300 350 400 450Distance across catchment (m)
Elev
atio
n (m
, AH
D)
Surface ElevationBasementWater TableReveg (5yrs)Reveg (10yrs)Reveg (20yrs)Reveg (50yrs)Reveg (100yrs)
Figure 30. Modelling results: entire catchment revegetated (reproduced from Smitt et al 2003)
Results of the FLOWTUBE scenario modelling also has implications for understanding the potential effects of commercial plantings on water resources in fractured rock groundwater systems.
Other modelling studies (Smitt et al, 2003) have suggested that groundwater response to revegetation is relatively quicker in rounder wider shaped catchments such as Mt. Eagle, as compared to the response achieved in narrower longer catchments. Hatton et al (2002) discussed the impact of catchment revegetation on groundwater discharge to streams, noting its potential to reduce in-stream salinity. However, these authors also noted the potential of revegetation to reduce catchment water inflow to dams, wetlands and streams.

DISCUSSION
Report DWLBC 2010/07 53
DISCUSSION
The Mt. Eagle research site was initiated in 1989 to test the concept of controlling dryland salinity through recharge reduction, in particular through revegetation of a significant proportion of a catchment in identified high recharge areas.
There is no doubt that the severity and extent of land salinity within the Mt. Eagle sub-catchment has decreased over time, due to the synergistic impact of tree planting combined with a sustained period of near average/lower than average rainfall.
Many authors have discussed the overriding influence of climate on groundwater trends (Rancic and Acworth, 2008; Reid et al, 2008), this influence often masking the impact of land use change. George et al (2008) highlighted that any observed decline in watertable levels must be corrected for climate, otherwise the benefits of management may be exaggerated.
Hydrograph results have pointed to an overall falling groundwater trend across the Mt. Eagle site since 1993, in line with decreased rainfall. However, hydrograph analysis (HARTT) and statistical observation have determined that watertable levels downslope of the tree and dryland lucerne treatments have decreased at a greater rate relative to annual crop/pasture at equivalent landscape positions in the control sub-catchment.
Walker et al (1999) discussed the relative water use of annual pasture, perennial pasture and trees, and acknowledged the high variability and complexity of factors affecting their recharge reduction potential. These authors concluded that there was generally less leakage under well-managed perennial pastures than under annuals, although the leakage under both systems was much more than that which occurred under trees. They suggested that permanent dryland lucerne stands in 400-600 mm rainfall zones could reduce leakage of rainfall by up to 90%.
Results from the Mt. Eagle trial, in terms of comparative watertable decline beneath each treatment, confirmed this relative water use: trees>dryland lucerne>annuals. The greatest decline in watertables occurred directly under the tree and lucerne treatments, however, in both cases the falling watertables extended some distance beyond the immediate treatment areas.
Bennett and George (2008) reviewed watertable response data from a wide range of tree planting sites in Western Australia (WA) where local groundwater flow systems were present. For sites where revegetation covered smaller areas, it was found that falls in groundwater levels were localised beneath the revegetation, with little impact downslope of the revegetation. They determined that a large proportion of a catchment (>50%) would need to be revegetated to have significant salinity benefits.
Other authors have reported similar conclusions. In a trial at Burke Flat in Victoria, the watertable beneath ten-year old trees (established on the hillslopes) dropped 6 m, whereas the watertable beneath corresponding valley discharge areas only fell many years later, and then largely due to a drying climate (Reid, 1995). Blue gums planted on a hilltop in 600 mm rainfall country in WA successfully lowered groundwater levels in a local groundwater flow system by 7 m after 6 years, drying out the aquifer under the trees down to bedrock (Taylor, 2003). However, this effect was relatively local and confined to the immediate area surrounding the trees, due to inertia within the groundwater flow system (George et al, 2008).

DISCUSSION
Report DWLBC 2010/07 54
Besides the proportion of cleared area revegetated, other authors such as Schofield (1990) and Hatton et al (2002) have stressed the importance of elements of canopy coverage (crown cover, leaf area index) in determining the effectiveness of revegetation in reducing recharge. Full canopy cover has not developed in all sections of the tree planting in the Mt Eagle sub-catchment, and some recharge is still occurring beneath the trees, as evidenced by occasional recharge spikes in the relevant hydrographs.
However, the effective coverage by trees of the groundwater catchment contributing to break of slope seepage areas 40 m downslope of the trees has been estimated at 70%, theoretically enough to provide hydrological control. In fact, the recharge reduction from trees has contributed to the formation of a lower/reversed hydraulic gradient, resulting in a contraction in saltland area (as measured by EM survey) at break of slope sites.
The actual observed groundwater responses in the upper and mid slope areas of the Mt. Eagle sub-catchment somewhat exceeded that which was predicted by the FLOWTUBE model, due in large part to a series of dry years accentuating the level of recharge reduction achieved. However, as predicted by the FLOWTUBE modelling, the groundwater response recorded in the lower third of the sub-catchment was much smaller, and groundwater baseflow continued to occur in an incised gully below the nick point in the sub-catchment.
These results for the lower third of the sub-catchment are consistent with the requirement for a large area (>50%) to be revegetated to deliver salinity control, given the sub-catchment area revegetated above this nick point was 20%. In modelling studies undertaken on two other South Australian catchments, Salama et al (1993) concluded that planting 25% of a catchment area with trees would reduce groundwater discharge, but additional discharge enhancement such as groundwater pumping would be required to achieve overall control.
Other research has challenged the conceptual model for salinity used at the Mt. Eagle site. Rainfall may in fact shed off steep hills rather than infiltrate deeply into fractured rock (CJ Clarke, Murdoch University, pers. comm.), resulting in relatively more recharge downslope in areas where runoff accumulates. As well, groundwater flow patterns in fractured rock aquifers have the potential to follow preferred pathways of least resistance (Kevin, 1991), such that recharge areas may not necessarily juxtapose with discharge areas.
Results from the Mt. Eagle site suggest that large rainfall events in wet winters (the last being in 2005) continue to cause the development of perched watertables as preferred flow mechanisms for hillslope recharge. FLOWTUBE modelling determined that the majority of the recharge at Mt. Eagle occurs in the upper part of the sub-catchment, and that revegetating the bottom half of the sub-catchment would have no significant impact.
For South Australia, Cresswell and Liddicoat (2004) suggested that prolonged wet periods, as occurred in the early 1990s, would result in elevated watertables regardless of any intervention strategies. Gamble (2003) suggested that the actual recharge reduction effectiveness of revegetation in many Victorian catchments would only be determined following a few years of above average rainfall.
For the Mt. Eagle site, it remains to be seen if the trees have created sufficient buffering capacity to prevent groundwater from returning to the high pre-1993 levels. The existence of a much flatter hydraulic gradient suggests that any future groundwater discharge will be significantly less than that which would have occurred in the absence of revegetation. As Dooley et al (2008) noted, the main determinants of dryland salinity in South Australia continue to be rainfall, land use and groundwater flow system.

Report DWLBC 2010/07 55
CONCLUSIONS AND RECOMMENDATIONS
Research results from the Mt. Eagle trial site have confirmed the relative water use of annuals versus perennials, with the two perennial treatments (trees and dryland lucerne) producing larger declines in watertable level relative to the decline under the control treatment (annual crop/pasture).
The impact of recharge reduction from the establishment of perennials was enhanced by an overall falling trend in rainfall from 1992 to 2008. However, the establishment of perennials in the sub-catchments has resulted in a drop in watertable levels above and beyond that which would be expected from the declining rainfall trend alone.
Recharge reduction following tree establishment has led to the amelioration of a saline seep 40 m downslope of the trees. The Mt. Eagle trial results have confirmed several principles regarding salinity processes and salinity management in local groundwater flow systems.
Climate is a major driver of dryland salinity
o Trends in groundwater level tend to mirror rainfall trends; the declining trend beneath the control treatment (crop/pasture) was ascribed to declining rainfall.
o Observed declines in the watertable need to be corrected for climate, otherwise the impact of land use change can be exaggerated.
Establishment of perennial vegetation leads to recharge reduction
o Because of their higher water use, trees and dryland lucerne induced a significant decline in watertable levels as compared to levels beneath annual crop/pasture.
o For a 525 mm rainfall zone, relative water use can be ranked (high to low) as: trees > dryland lucerne > annual crop/pasture.
o The effective density/canopy cover of perennials is an important determinant of the level of recharge reduction they induce. Recharge still occurs beneath the trees where there is incomplete canopy coverage; thinning out of the dryland lucerne stand has resulted in decreased water use and a much smaller impact on watertable levels.
Recharge reduction can lead to salinity control
o Where a significant area of a catchment is established to perennials, the resultant decline in watertable levels can lead to amelioration of saline seepage areas. Establishing trees over 20% of a sub-catchment did not fully control salinity in the bottom third of the sub-catchment. However, this revegetation did control salinity in seepage areas immediately downslope of the trees, as the tree area equated to ~ 70% coverage of the groundwater catchment for these break of slope seepage sites.
Salinity processes need to be understood
o While recharge occurs over a whole catchment, preferred recharge pathways may be identified. At Mt. Eagle, drill hole salt storage profiles, EM survey results and shallow well water levels identified upland ridges and hillslopes as

Report DWLBC 2010/07 56
preferential groundwater recharge areas, and perched watertables as a preferential recharge mechanism.
The work undertaken at Mt. Eagle also highlighted the usefulness of several analytical tools:
HARTT analysis of hydrographs, for determining the relative impact of land use change on groundwater levels within the context of underlying rainfall trends
FLOWTUBE groundwater modelling, for generating land use change scenarios and their potential impact on dryland salinity
Cumulative residual rainfall analysis, for determining longer-term rainfall trends
EM surveys, for mapping salinity expression, quantifying change in salinity extent and severity, and identifying recharge areas
Borehole salt storage profiles, for identifying preferential recharge areas and understanding temporal changes in groundwater salinity
Groundwater contour maps (flownets) for illustrating the preferential recharge areas, the discharge areas, and the flow paths/hydraulic gradient between them.
The Mt. Eagle site has been selected by DWLBC as a representative focus area for the on-going monitoring of dryland salinity within local groundwater flow systems in fractured rock aquifers on steep hills. As such, results from long-term monitoring at Mt. Eagle, and the application of a range of analytical tools, are deemed applicable to similar catchments within the South Australian Murray Darling Basin and the Adelaide and Mount Lofty Ranges NRM regions.
From Mt. Eagle research, recommendations for salinity management include:
Define and prioritise the salinity problem, the assets being impacted, and the goal of salinity management. In the case of Mt. Eagle, the assets included agricultural land, downstream water quality, and landscape amenity. The major goal of management intervention was to halt the (then) predicted increase in salinity extent, reduce the export of salt downstream, and increase the amenity value of the Mt. Eagle hill face.
Define the contributing groundwater catchment (recharge area, flow pathway, discharge area). If adopting recharge reduction as a management strategy, this will determine the area required to be treated, and influence its placement in the landscape.
A 20% coverage with trees of the total Mt. Eagle sub-catchment area actually translated to a ~ 70% coverage with trees of the effective catchment area containing the saline seep that was ameliorated. However, 20% coverage was ineffective in halting saline baseflow at the exit of the whole sub-catchment.
FLOWTUBE modelling results reinforced the concept that most recharge occurred in the upper half of the sub-catchment. Scenario modelling for revegetation of the bottom half of the sub-catchment predicted that there would be no significant impact on watertables. Results of the scenario modelling also has implications for determining where to site commercial plantings. Planting in upland recharge areas is

Report DWLBC 2010/07 57
more likely to lower groundwater levels than planting in low lying parts of the catchment.
Consider a range of management options. Establishing perennial vegetation in discharge areas (salt-tolerant species) also contributes to overall recharge reduction. Engineering options may also be applicable, for example, the installation of interceptor banks to reduce preferential recharge via perched watertables.
Consider other potential benefits and costs. Establishment of perennials using appropriate species can add biodiversity and/or livestock production value and perhaps future carbon sequestration value, along with providing erosion and waterlogging control benefits. However, potentially adverse impacts should also be noted, including reduced stream flow and temporary increases in stream flow salinity, and increased fire and pest hazard.
Long-term monitoring is needed to understand the relative impacts of revegetation and of climate on salinity processes.

Report DWLBC 2010/07 58
APPENDICES
A. RAINFALL DATA
“Carlyle” farm data, Keyneton Year Jan Feb Mar Apr May Jun Jul Aug Sep Oct Nov Dec Total
1962 35.0 17.5 28.3 4.5 78.3 34.8 27.5 49.3 24.8 91.2 11.5 52.5 455.2
1963 23.3 1.5 1.0 64.0 86.3 116.7 98.0 66.8 44.8 20.3 4.0 0.0 526.7
1964 12.8 24.5 11.8 28.8 39.3 56.8 108.8 41.5 87.3 40.8 38.5 9.8 500.7
1965 0.0 0.0 4.0 14.3 64.5 31.3 39.8 60.0 31.0 10.8 27.5 14.0 297.2
1966 10.3 14.8 21.5 4.3 35.3 40.8 79.3 26.5 68.0 30.8 19.8 94.0 445.4
1967 0.0 11.3 2.8 0.0 8.0 7.5 40.3 38.8 18.8 19.3 0.0 0.0 146.8
1968 18.8 15.0 21.8 33.5 118.3 73.8 80.3 76.0 35.5 87.8 40.3 37.4 638.5
1969 12.0 95.8 23.0 22.3 37.0 20.8 86.0 36.0 50.3 0.8 16.8 30.8 431.6
1970 25.0 0.0 11.0 29.5 38.0 56.5 52.8 110.8 56.5 4.3 23.5 43.5 451.4
1971 25.0 18.5 36.3 90.8 82.5 96.8 60.8 104.0 82.5 40.3 42.5 23.3 703.3
1972 45.5 16.5 0.0 29.3 18.0 27.3 79.8 86.3 29.3 26.8 15.0 4.0 377.8
1973 6.5 93.5 27.3 48.3 35.0 98.5 84.5 111.3 87.0 86.0 25.8 20.8 724.5
1974 123.5 55.8 58.5 97.3 99.0 38.5 139.8 76.3 90.0 123.5 4.5 6.5 913.2
1975 6.0 3.3 55.5 11.5 132.3 13.8 69.8 46.8 92.0 136.3 16.0 15.0 598.3
1976 23.0 51.5 0.0 13.5 13.3 34.3 34.0 52.3 71.3 77.3 50.3 17.5 438.3
1977 38.3 4.5 57.8 18.8 62.8 47.3 38.0 24.5 42.3 24.0 63.0 24.5 445.8
1978 24.8 5.0 8.3 65.5 59.3 94.5 115.0 73.8 95.8 14.2 20.5 0.0 576.7
1979 32.0 25.5 7.3 48.0 51.8 9.3 57.3 101.3 183.0 112.3 72.0 23.0 722.8
1980 0.8 0.0 3.8 94.0 39.8 97.8 91.3 22.3 48.0 96.0 35.5 8.3 537.6
1981 11.8 8.3 58.0 1.3 77.8 128.3 115.5 146.3 39.8 30.3 39.8 7.0 664.2
1982 14.8 4.0 20.3 12.0 33.0 56.0 30.0 14.0 23.0 21.0 1.3 3.8 233.2
1983 9.8 1.5 128.0 72.3 56.3 24.8 98.5 93.3 75.0 36.8 38.3 31.3 665.9
1984 44.2 2.4 22.0 50.2 20.8 35.4 94.0 137.0 45.2 18.0 29.0 3.6 501.8
1985 0.4 1.4 44.2 35.4 36.8 50.2 28.2 136.6 35.2 21.0 13.6 25.4 428.4
1986 3.4 5.8 0.0 37.6 56.6 16.2 103.6 95.0 67.0 78.0 11.2 44.4 518.8
1987 27.6 21.0 9.0 31.2 97.8 79.6 76.8 58.6 14.8 69.4 8.2 47.0 541.0
1988 6.6 10.8 22.4 28.6 133.6 110.6 53.4 25.6 68.0 19.6 44.0 31.4 554.6
1989 1.8 1.6 7.0 8.2 74.4 61.0 83.4 77.0 83.2 35.0 38.4 45.4 516.4
1990 2.4 7.0 1.2 15.4 13.8 72.4 121.4 102.8 37.6 48.0 9.4 29.0 460.4
1991 18.0 0.0 2.2 42.8 10.0 125.7 65.6 115.6 54.8 2.4 25.4 4.0 466.5
1992 0.0 9.8 51.6 74.4 54.8 71.0 42.0 151.5 135.4 88.6 55.4 184.8 919.3
1993 50.6 4.0 8.4 3.8 22.6 71.0 49.0 43.4 59.4 55.8 27.6 22.2 417.8

Report DWLBC 2010/07 59
1994 20.4 5.2 0.0 1.6 39.6 121.4 35.6 14.8 24.4 36.6 28.0 4.6 332.2
1995 35.2 17.6 13.4 38.6 37.2 70.8 142.6 18.4 48.8 49.0 10.2 9.4 491.2
1996 11.8 6.8 24.8 14.2 9.8 134.8 108.8 107.4 109.0 33.2 6.4 8.0 575.0
1997 11.4 53.4 4.0 2.8 50.8 22.6 26.4 98.2 103.2 40.8 39.8 36.4 489.8
1998 5.4 28.6 6.8 79.0 18.6 77.4 76.6 40.6 47.6 56.6 47.2 3.2 487.6
1999 7.6 11.0 56.0 0.2 85.8 45.6 54.8 22.6 57.8 57.6 44.9 29.6 473.5
2000 1.0 94.0 16.0 61.0 62.8 72.4 67.2 85.0 83.4 45.2 20.6 6.8 615.4
2001 43.2 12.4 29.2 18.6 58.2 83.4 56.8 98.6 97.6 69.2 35.8 6.0 609.0
2002 30.4 1.0 13.2 4.0 64.6 64.8 64.8 36.2 46.8 18.2 19.0 30.8 393.8
2003 4.0 73.0 2.0 26.6 56.0 84.2 67.2 133.8 84.4 41.0 20.0 30.2 622.4
2004 9.0 6.0 17.7 3.4 33.6 132.6 70.0 131.4 69.2 1.4 32.0 84.8 591.1
2005 23.6 7.0 7.0 10.6 2.4 150.6 72.4 77.6 82.0 117.0 101.2 29.0 680.4
2006 15.6 47.2 73.2 55.4 45.6 30.6 57.6 9.0 23.2 0.0 19.0 16.0 392.4
2007 74.0 0.0 28.4 122.0 57.8 18.2 84.6 14.4 32.8 19.2 31.6 17.8 500.8
Ave. 20.6 19.5 22.7 34.1 52.4 65.4 72.4 71.5 62.8 46.8 28.8 26.5 523.4

APPENDICES
Report DWLBC 2010/07 60
B. DRILLING LOGS The following logs are summaries of the drilling profiles from each site drilled in three sub-catchments, prefixed by the letters E, S and B.
__________________________________________________________________________
Field Site No: E1 Date drilled: 31/01/2001
Site Description: Hillslope of rocky ridge in tree plantation
From (m) To (m) Description of material
0.0 0.5 LOAM, sandy, brown
0.5 1.0 LOAM, sandy silty, light brown
1.0 9.0 SANDSTONE, grey micaceous, weathered
9.0 20.5 SANDSTONE, weathered schist layers
EOH at 20.55m in hard light grey sandstone with yellow schisty layers
__________________________________________________________________________
Field Site No: E2 Date drilled: 09/11/1989
Site Description: Break of slope in saline gully
From (m) To (m) Description of material
0.0 1.0 LOAM, silty, dark brown, micaceous
1.0 1.5 HARDPAN, cemented quartz gravel
1.5 6.0 SILTSTONE, grey weathered
6.0 9.0 SILTSTONE, blue grey slight weathered
EOH at 9m in slightly weathered siltstone
__________________________________________________________________________
Field Site No: E3 Date drilled: 21/02/1990
Site Description: Narrow constricted valley between rocky ridges
From (m) To (m) Description of material
0.0 0.5 CLAY, sandy loamy, dark brown
0.5 1.0 SAND, clayey, yellow orange micaceous
1.0 15.0 PHYLLITE, grey weathered, micaceous
EOH at 15m in micaceous phyllite
__________________________________________________________________________

APPENDICES
Report DWLBC 2010/07 61
__________________________________________________________________________
Field Site No: E4 Date drilled: 31/10/1989
Site Description: Mid slope valley, flat alluvial plain
From (m) To (m) Description of material
0.0 0.5 CLAY, sandy loamy, brown
0.5 1.5 HARDPAN, cemented stones in reddish brown matrix
1.5 3.0 SAND, clayey silty orange and green
3.0 4.0 SAND, clayey orange brown micaceous
4.0 15.0 PHYLLITE, highly weathered
EOH at 15m in green blue yellow grey soft micaceous phyllite
__________________________________________________________________________
Field Site No: E5 Date drilled: 08/11/1989
Site Description: Valley flat above wet seep/springs, just below a dam
From (m) To (m) Description of material
0.0 0.5 CLAY, sandy loamy, brown
0.5 1.0 CLAY, sandy loamy, brown, micaceous
1.0 4.0 CLAY, silty brown, micaceous
4.0 5.0 GRAVEL, brown
5.0 30.0 KAOLINITE, fine silty, grey fawn cream
30.0 35.0 CLAY, fine sandy, fawn cream
35.0 36.0 CLAY, gritty, orange fawn
EOH at 36m in fine sandy to gritty clay
__________________________________________________________________________
Field Site No: E6 Date drilled: 22/02/1990
Site Description: Ridgetop expression of a bedrock high
From (m) To (m) Description of material
0.0 0.5 SAND, loamy, brown
0.5 1.0 CLAY, silty micaceous greenish brown
1.0 3.0 SAND, silty grey micaceous
3.0 6.0 SANDSTONE, blue micaceous
6.0 18.0 SANDSTONE, highly weathered
EOH at 18m in schisty sandstone
__________________________________________________________________________
APPENDICES
Report DWLBC 2010/07 62
__________________________________________________________________________
Field Site No: E7 Date drilled: 21/02/1990
Site Description: Break of slope in narrow valley
From (m) To (m) Description of material
0.0 0.5 CLAY, sandy loamy, brown
0.5 3.0 SANDSTONE, highly weathered
3.0 5.0 SANDSTONE, blue grey schisty
EOH at 5m in schisty sandstone
__________________________________________________________________________
Field Site No: E8 Date drilled: 21/02/1990
Site Description: Low gentle ridge
From (m) To (m) Description of material
0.0 0.5 CLAY, loamy, brown
0.5 1.0 CLAY, red brown
1.0 1.5 CLAY, silty orange
1.5 6.0 SILTSTONE, grey micaceous
6.0 9.0 CLAY, grey micaceous, talcy
9.0 10.0 SANDSTONE, bluish grey weathered
10.0 12.0 SANDSTONE, silty, blue grey
EOH at 12m in hard silty sandstone
__________________________________________________________________________
Field Site No: E11 Date drilled: 26/02/1992
Site Description: Mid-slope rocky ridge
From (m) To (m) Description of material
0.0 0.5 LOAM, silty, brown
0.5 1.0 CLAY, greenish brown, micaceous
1.0 4.0 SANDSTONE, highly weathered
4.0 7.0 SCHIST, weathered, with quartz vein
7.0 12.0 SANDSTONE, grey micaceous, silty
12.0 15.0 SCHIST, green grey micaceous
EOH at 15m in micaceous schist
__________________________________________________________________________

APPENDICES
Report DWLBC 2010/07 63
__________________________________________________________________________
Field Site No: E12 Date drilled: 31/01/2001
Site Description: Break of slope at foot of rocky ridge
From (m) To (m) Description of material
0.0 0.5 LOAM, silty, brown
0.5 1.0 CLAY, greenish brown
1.0 2.0 SANDSTONE, highly weathered, schisty
2.0 6.0 SANDSTONE, silty light grey
6.0 8.0 SANDSTONE, micaceous grey
EOH at 8.83m in micaceous sandstone
__________________________________________________________________________
Field Site No: E13 Date drilled: 20/02/1992
Site Description: Tributary gully on steep rocky ridge
From (m) To (m) Description of material
0.0 0.5 SANDSTONE, outcrop with quartz
0.5 10.0 SANDSTONE, grey schisty
10.0 12.0 SANDSTONE, yellowish, micaceous
12.0 14.0 SCHIST, talc and quartz
EOH at 14m in grey schist and quartz rock
__________________________________________________________________________
Field Site No: E14 Date drilled: 31/01/2001
Site Description: Flat upland valley
From (m) To (m) Description of material
0.0 0.5 LOAM, silty, brown
0.5 1.0 CLAY, mottled silty
1.0 2.0 CLAY, green, schisty
2.0 7.0 SCHIST, highly weathered, blue grey
7.0 9.0 SCHIST, micaceous blue grey
EOH at 8.73m in micaceous schist
__________________________________________________________________________

APPENDICES
Report DWLBC 2010/07 64
__________________________________________________________________________
Field Site No: E15 Date drilled: 31/01/2001
Site Description: Lower slope
From (m) To (m) Description of material
0.0 0.5 LOAM, silty, brown
0.5 1.0 CLAY, red brown with quartz gravel
1.0 2.0 SILTSTONE, highly weathered
2.0 7.0 SANDSTONE, fine sandy micaceous
EOH at 6.86m in grey fine sandy weathered sandstone
__________________________________________________________________________
Field Site No: E16 Date drilled: 31/01/2001
Site Description: Upper broad valley
From (m) To (m) Description of material
0.0 0.5 LOAM, silty, brown
0.5 1.0 CLAY, brown
1.0 2.0 GRAVEL, quartz and ironstone
2.0 2.5 CLAY, ironstone gravel in orange clay
2.5 7.0 SCHIST, micaceous silty greeny grey
7.0 9.0 SCHIST, orange, green sandy
9.0 12.0 SCHIST, grey talcy silty
EOH at 11.83m in fine talcy micaceous silty schist
__________________________________________________________________________

APPENDICES
Report DWLBC 2010/07 65
__________________________________________________________________________
Field Site No: E17 Date drilled: 25/01/2002
Site Description: Upper tributary valley
From (m) To (m) Description of material
0.0 0.5 LOAM, over orange clay & quartz gravel
0.5 1.0 SOAPSTONE, orange, cream, grey
1.0 1.5 LATERITE, green, grey, ferruginous bands
1.5 2.0 TALCSTONE, cream, yellow white
2.0 3.0 TALCSTONE, maroon, greasy
3.0 4.0 TALCSTONE, cream, greenish
4.0 8.0 SILTSTONE, greenish highly weathered
8.0 14.0 SILTSTONE, damp, highly weathered Orange & cream
spots and layers
EOH at 14.35m in damp greasy green talcy siltstone with cream kaolin spots
__________________________________________________________________________
Field Site No: E18 Date drilled: 25/01/2002
Site Description: Broad mid-slope flat
From (m) To (m) Description of material
0.0 0.5 LOAM, brown sandy
0.5 1.0 CLAY, mottled with limy marl, quartz gravel
1.0 1.5 QUARTZITE, red
1.5 2.0 SOAPSTONE, blue grey
2.0 2.5 QUARTZITE, hard grey-red layer
2.5 3.0 SOAPSTONE, grey micaceous
3.0 4.0 SILTSTONE, dark grey, spotted, schisty
4.0 5.0 SILTSTONE, grey and maroon feruginised
5.0 6.0 SILTSTONE, grey and harder
6.0 8.0 SCHIST, greenish grey micaceous ferruginised
EOH at 8.37m in greenish grey schist / siltstone with weathered layers
__________________________________________________________________________

APPENDICES
Report DWLBC 2010/07 66
__________________________________________________________________________
Field Site No: S1 Date drilled: 10/11/1989
Site Description: Subdued catchment divide
From (m) To (m) Description of material
0.0 0.5 LOAM, sandy, brown
0.5 1.0 CLAY, red brown
1.0 10.0 SANDSTONE, silty highly weathered
10.0 12.0 SANDSTONE, yellow grey schisty
12.0 19.0 SANDSTONE, silty, blue greenish grey
EOH at 19m in silty sandstone
__________________________________________________________________________
Field Site No: S2 Date drilled: 23/02/1990
Site Description: Subdued valley
From (m) To (m) Description of material
0.0 0.5 CLAY, sandy, brown
0.5 2.0 CLAY, green micaceous
2.0 6.0 CLAY, greenish grey talcy
6.0 9.0 CLAY, talcy with quartz pebbles
EOH at 9m in talcy clay
__________________________________________________________________________
Field Site No: S3 Date drilled: 10/11/1989
Site Description: Seep in valley
From (m) To (m) Description of material
0.0 0.5 CLAY, loam, brown
0.5 1.0 CLAY, red brown
1.0 2.0 CLAY, silty greenish brown micaceous
20 10.0 SCHIST, yellow grey weathered
EOH at 10m in weathered schist
__________________________________________________________________________

APPENDICES
Report DWLBC 2010/07 67
__________________________________________________________________________
Field Site No: S4 Date drilled: 26/02/1992
Site Description: Gully
From (m) To (m) Description of material
0.0 1.0 LOAM, silty, brown
1.0 3.0 SAND, green silty
3.0 5.0 SANDSTONE, grey highly weathered
5.0 6.0 SANDSTONE, grey
EOH at 6m in silty sandstone
__________________________________________________________________________
Field Site No: S5 Date drilled: 26/02/1992
Site Description: Seep in gully
From (m) To (m) Description of material
0.0 0.5 CLAY, brown
0.5 1.5 CLAY, grey brown micaceous
1.5 3.0 SCHIST, highly weathered
3.0 6.0 SCHIST, weathered
6.0 9.0 SCHIST, brownish grey talcy
EOH at 9m in highly weathered schist
__________________________________________________________________________
Field Site No: B1 Date drilled: 27/02/1990
Site Description: Upper valley
From (m) To (m) Description of material
0.0 0.5 CLAY, loamy brown
0.5 6.0 SILTSTONE, highly weathered
6.0 9.0 SILTSTONE, blue grey
EOH at 9m in hard siltstone
__________________________________________________________________________

APPENDICES
Report DWLBC 2010/07 68
__________________________________________________________________________
Field Site No: B2 Date drilled: 27/02/1990
Site Description: Valley flat
From (m) To (m) Description of material
0.0 0.5 CLAY, loamy brown
0.5 6.0 SANDSTONE, silty greenish blue
EOH at 6m in weathered silty sandstone
__________________________________________________________________________
Field Site No: B3 Date drilled: 27/02/1990
Site Description: Seepage area in valley
From (m) To (m) Description of material
0.0 0.5 CLAY, sandy loamy brown
0.5 1.5 SILTSTONE, highly weathered, greenish
1.5 3.0 SILTSTONE, blue grey
EOH at 3m in hard siltstone
__________________________________________________________________________

APPENDICES
Report DWLBC 2010/07 69
C. DRILL SAMPLE SALINITY
Salt storage was derived from EC measurement of 1:5 soil and water extracts, conversion to ppm (mg/L) using E&WS tables, then conversion to mg salt / kg soil assuming soil samples completely dried.
Graphs of drill sample salt storage are presented for different landscape positions ranging from the top of ridges to valley floors.
The graphs show plots of soil salt concentration in mg/kg vs. depth in metres.
Upland ridges (includes sites E1 and E6)
M t Eag le ( Keynet on) D r i l l Sample Salt St o rag e ( mg salt / kg so il) ( d er ived f ro m EC 1:5 measurement s)
0
2
4
6
8
10
12
14
16
18
20
0 100 200 300 400 500 600 700 800 900 1000
mg sa l t / k g soi l
E1
E6

APPENDICES
Report DWLBC 2010/07 70
Break in slope and mid slopes (includes sites E4, E8, E12, E18, and S1)
M t Eag le ( Keynet on) D r i l l Sample Salt St o rag e ( mg salt / kg so il) ( d er ived f ro m EC 1:5 measurement s)
0
2
4
6
8
10
12
14
16
18
20
0 500 1000 1500 2000 2500
mg sa l t / k g soi l
E4
E12
E18
S1
E8

APPENDICES
Report DWLBC 2010/07 71
Valley floor discharge (includes sites E2, E5 and S3)
M t Eag le ( Keynet on) D r i l l Sample Salt St o rag e ( mg salt / kg so il) ( d er ived f ro m EC 1:5 measurement s)
0
2
4
6
8
10
12
14
16
18
20
0 500 1000 1500 2000 2500 3000
mg sa l t / k g soi l
E2
E5
S3
Notes:
The watertable has dropped significantly at sites E2, E5 and S3 since they were drilled and would now no longer be considered as groundwater discharge sites. It is possible that the salt storage in the upper profile may be being leached downwards as the watertable falls.

APPENDICES
Report DWLBC 2010/07 72
D. BOREHOLE SPECIFICATIONS The construction parameters and location details are provided for each piezometer
(1) “E series” piezometers (Trees in Mt Eagle sub-catchment) Drill
hole
No:
Unit
No:
Obs
No:
Construc-tion
date
Easting Northing Ground
elev.
(AHD)
Bore
depth
(BGL)
Screen
length
(m)
Tube height (m)
E1A 3073 MOR214 Nov/89 425.91 1.53 0.70 0.43
E1B 3074 MOR215 Nov/89 425.94 2.62 2.00 0.46
E1C 2699 MOR216 Nov/89 326719 6176456 425.91 14.21 2.00 0.61
E1D 3075 MOR217 Nov/89 425.91 5.95 1.00 0.50
E1E 3417 MOR250 Jan/01 326720 6176462 425.93 20.55 3.00 0.49
E2A 3076 MOR218 Nov/89 415.83 1.29 1.00 0.40
E2B 3077 MOR219 Nov/89 415.90 2.43 0.50 0.54
E2C 2700 MOR220 Nov/89 326631 6176475 415.94 8.48 0.50 1.20
E3A 3078 MOR221 Feb/90 414.02 1.27 1.00 0.59
E3B 3079 MOR222 Feb/90 414.08 2.15 0.50 0.51
E3C 2701 MOR223 Feb/90 326593 6176485 414.15 14.23 0.50 0.58
E4C 2702 MOR224 Oct/89 326559 6176496 412.54 12.15 1.00 0.69
E5A 3080 MOR225 Nov/89 406.47 2.55 1.50 0.41
E5B 3081 MOR226 Nov/89 326405 6176491 406.46 6.74 0.50 0.42
E5C 2703 MOR227 Nov/89 406.53 33.28 0.50 0.58
E6A 3082 MOR228 Feb/90 420.34 1.27 1.00 0.48
E6C 2704 MOR229 Feb/90 326647 6176513 420.34 17.06 1.00 0.48
E7A 3083 MOR230 Feb/90 416.23 1.57 1.00 0.38
E7C 2705 MOR231 Feb/90 326624 6176455 416.27 4.79 1.00 0.48
E8A 3084 MOR232 Feb/90 417.66 1.29 1.00 0.48
E8C 2706 MOR233 Feb/90 326613 6176431 417.73 11.21 1.00 0.51
E9A 3096 MOR234 Oct/90 326775 6176437 440.32 1.69 1.00 0.40
E10A 3097 MOR235 Oct/90 326752 6176451 432.37 1.30 1.00 0.26
E11C 3098 MOR236 Feb/92 326698 6176378 425.99 14.32 1.00 0.49
E12C 3099 MOR237 Feb/92 419.32 4.47 0.50 0.46
E12D 3415 MOR251 Jan/01 326646 6176301 419.28 8.83 2.00 0.68
E12E 3465 MOR278 Jan/02 419.20 16.15 1.00 0.45
E13C 3100 MOR238 Feb/92 326743 6176248 429.48 12.72 1.00 0.74
E14C 3413 MOR252 Jan/01 326574 6176222 418.02 8.73 2.00 0.70
E15C 3414 MOR253 Jan/01 326511 6176366 412.62 6.86 2.00 1.05
E16C 3416 MOR254 Jan/01 326777 6176659 420.67 11.83 2.00 0.61

APPENDICES
Report DWLBC 2010/07 73
E17C 3463 MOR279 Jan/02 326679 6176606 417.41 14.35 1.00 0.41
E18C 3464 MOR280 Jan/02 326473 6176261 413.23 8.37 1.00 0.40
Unit Nos – are prefixed by 6728-0xxxx
(2) “S series” piezometers (Lucerne in Stonejar sub-catchment) Drill-hole
No:
Unit
No:
Obs
No:
Construc-tion
date
Easting Northing Ground
elev.
(AHD)
Bore
depth
(BGL)
Screen
length
(m)
Tube height (m)
S1A 3085 MOR239 Nov/89 416.97 1.38 1.00 0.39
S1C 2707 MOR240 Nov/89 327198 6177275 416.98 15.36 1.00 0.67
S2A 3086 MOR241 Feb/90 414.56 1.36 0.50 0.30
S2B 3087 MOR242 Feb/90 327128 6177327 414.59 2.59 0.50 0.42
S2C 2708 MOR243 Feb/90 414.64 8.48 0.50 0.50
S3A 3088 MOR244 Nov/89 412.18 1.29 1.00 0.44
S3B 3089 MOR245 Nov/89 412.21 2.66 0.50 0.48
S3C 2709 MOR246 Nov/89 327052 6177374 412.21 9.42 0.50 0.95
S4C 3093 MOR247 Feb/92 327022 6177238 414.44 5.60 0.50 0.49
S5A 3094 MOR248 Feb/92 410.50 1.38 0.70 0.44
S5C 3095 MOR249 Feb/92 326975 6177353 410.49 8.46 0.50 0.58
Unit Nos – are prefixed by 6728-0xxxx
(3) “B series” piezometers (Boundary sub-catchment = control) Drill-hole
No:
Unit
No:
Obs
No:
Construc-tion
date
Easting Northing Ground
elev.
(AHD)
Bore
depth
(BGL)
Screen
length
(m)
Tube height (m)
B1A 3090 JEL025 Feb/90 417.35 1.35 1.00 0.44
B1C 2726 JEL026 Feb/90 326875 6176828 417.36 8.52 0.50 0.51
B2A 3091 JEL027 Feb/90 410.96 1.35 1.00 0.20
B2C 2728 JEL028 Feb/90 327054 6176945 411.00 5.45 0.50 0.50
B3A 2727 JEL029 Feb/90 327232 6176913 405.06 1.28 1.00 0.25
B3C 2727 JEL030 Feb/90 405.11 2.58 0.50 0.99
Unit Nos – are prefixed by 6728-0xxxx
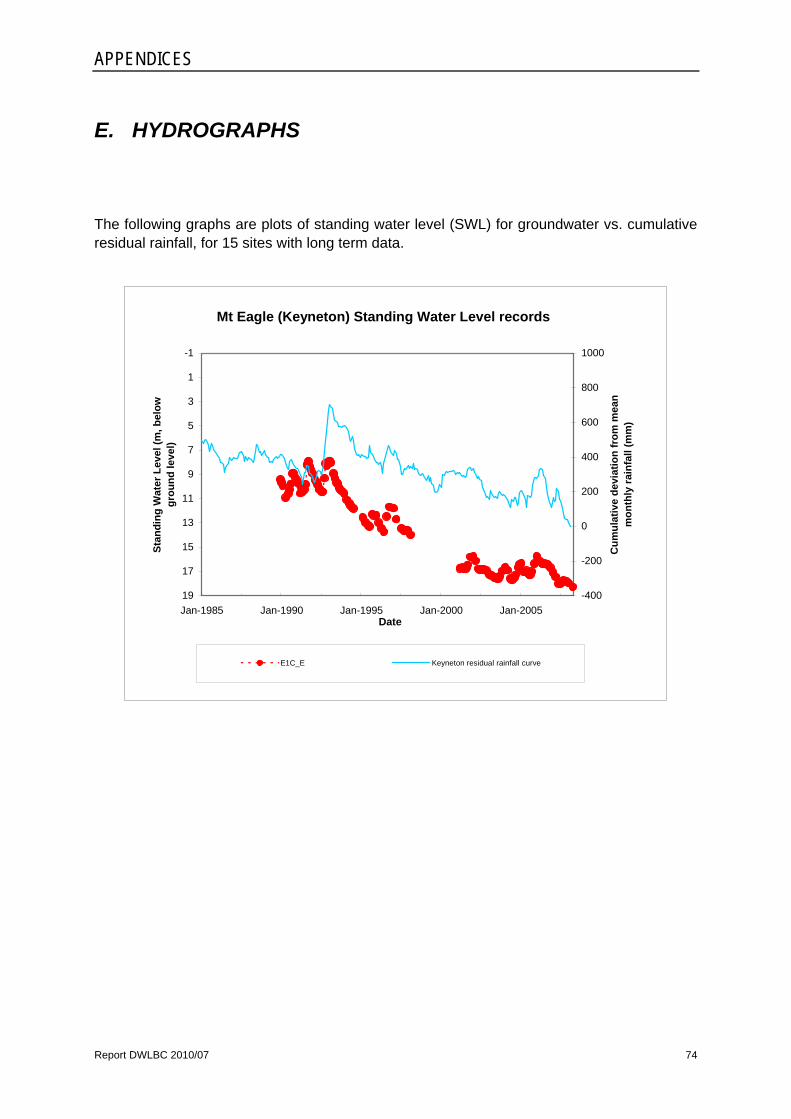
APPENDICES
Report DWLBC 2010/07 74
E. HYDROGRAPHS
The following graphs are plots of standing water level (SWL) for groundwater vs. cumulative residual rainfall, for 15 sites with long term data.
Mt Eagle (Keyneton) Standing Water Level records
-1
1
3
5
7
9
11
13
15
17
19Jan-1985 Jan-1990 Jan-1995 Jan-2000 Jan-2005
Date
Stan
ding
Wat
er L
evel
(m, b
elow
gr
ound
leve
l)
-400
-200
0
200
400
600
800
1000
Cum
ulat
ive
devi
atio
n fr
om m
ean
mon
thly
rain
fall
(mm
)
E1C_E Keyneton residual rainfall curve

APPENDICES
Report DWLBC 2010/07 75
Mt Eagle (Keyneton) Standing Water Level records
-3
-1
1
3
5
7
9
11
13
15
17
19Jan-1985 Jan-1990 Jan-1995 Jan-2000 Jan-2005
Date
Stan
ding
Wat
er L
evel
(m, b
elow
gr
ound
leve
l)
-400
-200
0
200
400
600
800
1000
Cum
ulat
ive
devi
atio
n fr
om m
ean
mon
thly
rain
fall
(mm
)
E2C Keyneton residual rainfall curve
Mt Eagle (Keyneton) Standing Water Level records
-3
-1
1
3
5
7
9
11
13
15
17
19Jan-1985 Jan-1990 Jan-1995 Jan-2000 Jan-2005
Date
Stan
ding
Wat
er L
evel
(m, b
elow
gr
ound
leve
l)
-400
-200
0
200
400
600
800
1000C
umul
ativ
e de
viat
ion
from
mea
n m
onth
ly ra
infa
ll (m
m)
E3C Keyneton residual rainfall curve
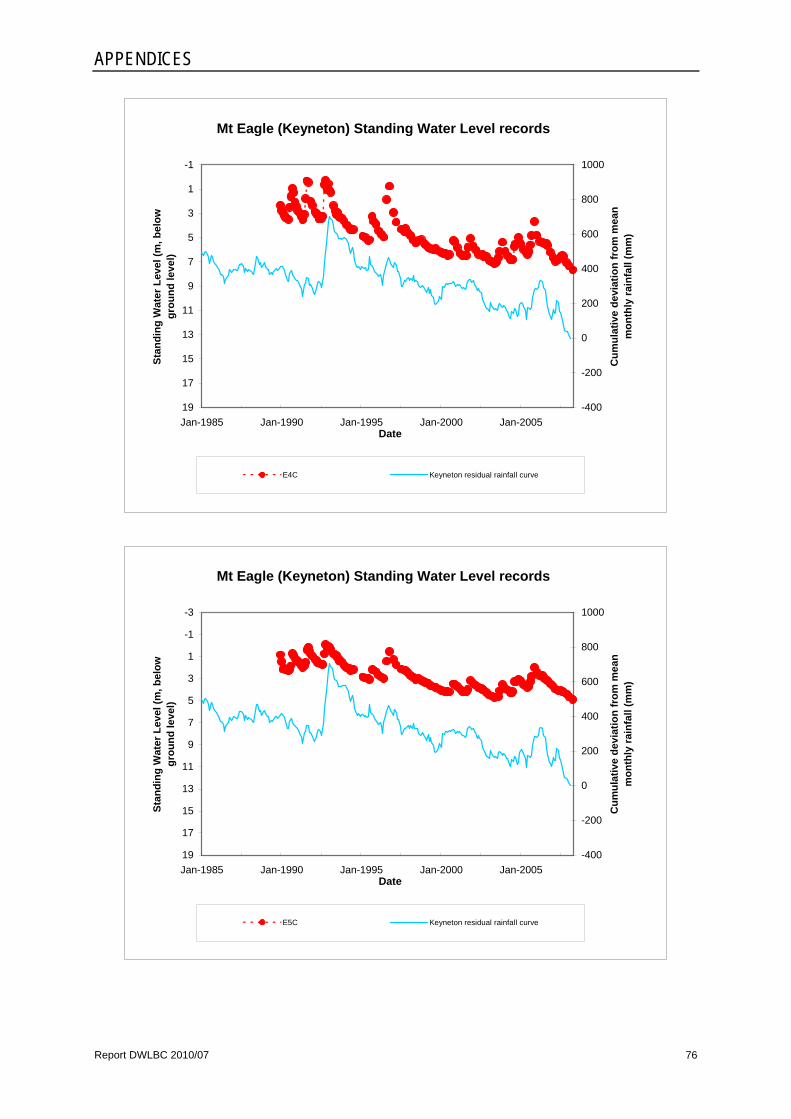
APPENDICES
Report DWLBC 2010/07 76
Mt Eagle (Keyneton) Standing Water Level records
-1
1
3
5
7
9
11
13
15
17
19Jan-1985 Jan-1990 Jan-1995 Jan-2000 Jan-2005
Date
Stan
ding
Wat
er L
evel
(m, b
elow
gr
ound
leve
l)
-400
-200
0
200
400
600
800
1000
Cum
ulat
ive
devi
atio
n fr
om m
ean
mon
thly
rain
fall
(mm
)
E4C Keyneton residual rainfall curve
Mt Eagle (Keyneton) Standing Water Level records
-3
-1
1
3
5
7
9
11
13
15
17
19Jan-1985 Jan-1990 Jan-1995 Jan-2000 Jan-2005
Date
Stan
ding
Wat
er L
evel
(m, b
elow
gr
ound
leve
l)
-400
-200
0
200
400
600
800
1000C
umul
ativ
e de
viat
ion
from
mea
n m
onth
ly ra
infa
ll (m
m)
E5C Keyneton residual rainfall curve

APPENDICES
Report DWLBC 2010/07 77
Mt Eagle (Keyneton) Standing Water Level records
-1
1
3
5
7
9
11
13
15
17
19Jan-1985 Jan-1990 Jan-1995 Jan-2000 Jan-2005
Date
Stan
ding
Wat
er L
evel
(m, b
elow
gr
ound
leve
l)
-400
-200
0
200
400
600
800
1000
Cum
ulat
ive
devi
atio
n fr
om m
ean
mon
thly
rain
fall
(mm
)
E6C Keyneton residual rainfall curve
Mt Eagle (Keyneton) Standing Water Level records
-1
1
3
5
7
9
11
13
15
17
19Jan-1985 Jan-1990 Jan-1995 Jan-2000 Jan-2005
Date
Stan
ding
Wat
er L
evel
(m, b
elow
gr
ound
leve
l)
-400
-200
0
200
400
600
800
1000C
umul
ativ
e de
viat
ion
from
mea
n m
onth
ly ra
infa
ll (m
m)
E8C Keyneton residual rainfall curve

APPENDICES
Report DWLBC 2010/07 78
Mt Eagle (Keyneton) Standing Water Level records
-1
1
3
5
7
9
11
13
15
17
19Jan-1985 Jan-1990 Jan-1995 Jan-2000 Jan-2005
Date
Stan
ding
Wat
er L
evel
(m, b
elow
gr
ound
leve
l)
-400
-200
0
200
400
600
800
1000
Cum
ulat
ive
devi
atio
n fr
om m
ean
mon
thly
rain
fall
(mm
)
E12C_D_E Keyneton residual rainfall curve
Mt Eagle (Keyneton) Standing Water Level records
-1
1
3
5
7
9
11
13
15
17
19Jan-1985 Jan-1990 Jan-1995 Jan-2000 Jan-2005
Date
Stan
ding
Wat
er L
evel
(m, b
elow
gr
ound
leve
l)
-400
-200
0
200
400
600
800
1000C
umul
ativ
e de
viat
ion
from
mea
n m
onth
ly ra
infa
ll (m
m)
S1C Keyneton residual rainfall curve

APPENDICES
Report DWLBC 2010/07 79
Mt Eagle (Keyneton) Standing Water Level records
-1
1
3
5
7
9
11
13
15
17
19Jan-1985 Jan-1990 Jan-1995 Jan-2000 Jan-2005
Date
Stan
ding
Wat
er L
evel
(m, b
elow
gr
ound
leve
l)
-400
-200
0
200
400
600
800
1000
Cum
ulat
ive
devi
atio
n fr
om m
ean
mon
thly
rain
fall
(mm
)
S2C Keyneton residual rainfall curve
Mt Eagle (Keyneton) Standing Water Level records
-3
-1
1
3
5
7
9
11
13
15
17
19Jan-1985 Jan-1990 Jan-1995 Jan-2000 Jan-2005
Date
Stan
ding
Wat
er L
evel
(m, b
elow
gr
ound
leve
l)
-400
-200
0
200
400
600
800
1000C
umul
ativ
e de
viat
ion
from
mea
n m
onth
ly ra
infa
ll (m
m)
S3C Keyneton residual rainfall curve

APPENDICES
Report DWLBC 2010/07 80
Mt Eagle (Keyneton) Standing Water Level records
-3
-1
1
3
5
7
9
11
13
15
17
19Jan-1985 Jan-1990 Jan-1995 Jan-2000 Jan-2005
Date
Stan
ding
Wat
er L
evel
(m, b
elow
gr
ound
leve
l)
-400
-200
0
200
400
600
800
1000
Cum
ulat
ive
devi
atio
n fr
om m
ean
mon
thly
rain
fall
(mm
)
S5C Keyneton residual rainfall curve
Mt Eagle (Keyneton) Standing Water Level records
-1
1
3
5
7
9
11
13
15
17
19Jan-1985 Jan-1990 Jan-1995 Jan-2000 Jan-2005
Date
Stan
ding
Wat
er L
evel
(m, b
elow
gr
ound
leve
l)
-400
-200
0
200
400
600
800
1000C
umul
ativ
e de
viat
ion
from
mea
n m
onth
ly ra
infa
ll (m
m)
B1C Keyneton residual rainfall curve

APPENDICES
Report DWLBC 2010/07 81
Mt Eagle (Keyneton) Standing Water Level records
-3
-1
1
3
5
7
9
11
13
15
17
19Jan-1985 Jan-1990 Jan-1995 Jan-2000 Jan-2005
Date
Stan
ding
Wat
er L
evel
(m, b
elow
gr
ound
leve
l)
-400
-200
0
200
400
600
800
1000
Cum
ulat
ive
devi
atio
n fr
om m
ean
mon
thly
rain
fall
(mm
)
B2C Keyneton residual rainfall curve
Mt Eagle (Keyneton) Standing Water Level records
-3
-1
1
3
5
7
9
11
13
15
17
19Jan-1985 Jan-1990 Jan-1995 Jan-2000 Jan-2005
Date
Stan
ding
Wat
er L
evel
(m, b
elow
gr
ound
leve
l)
-400
-200
0
200
400
600
800
1000C
umul
ativ
e de
viat
ion
from
mea
n m
onth
ly ra
infa
ll (m
m)
B3C Keyneton residual rainfall curve

APPENDICES
Report DWLBC 2010/07 82
F. WATER LEVEL DATA SUMMARY
This table lists the highest and lowest water levels (SWL) for the 15 wells with long term records. Water levels have also been converted to reduced standing water levels (RSWL) which relates all water levels to a common reference point usually measured in metres above mean sea level. The trend is obtained from the OBSWELL website by choosing the “fit a linear trend line” to individual well hydrographs. A negative sign indicates a falling trend.
Field
No.
Obs
No.
Highest
SWL
(m)
Highest
RSWL
(mAHD)
Lowest
SWL
(m)
Lowest
RSWL
(mAHD)
Trend
(m/yr)
E1C_1E
E2C
E3C
E4C
E5C
E6C
E8C
E12C_12E
S1C
S2C
S3C
S5C
B1C
B2C
B3C
MOR216-250
MOR220
MOR223
MOR224
MOR227
MOR229
MOR233
MOR237_278
MOR240
MOR243
MOR246
MOR249
JEL026
JEL028
JEL030
7.89
-1.03
-0.05
0.26
-0.08
3.00
0.15
0.51
3.63
0.06
-0.88
-0.58
0.39
-0.54
-1.52
418.02
416.97
414.20
412.28
406.61
417.34
417.58
418.81
413.35
414.62
413.09
411.07
416.97
411.54
406.63
18.29
8.08
8.77
7.66
4.88
12.35
9.69
11.21
11.45
8.92
5.50
3.89
Dry
4.84
0.99
407.64
407.86
405.38
404.88
401.65
407.99
408.04
407.99
405.53
405.76
406.71
406.60
Dry
406.16
404.12
-0.43
-0.38
-0.27
-0.18
-0.45
-0.46
-0.31
-0.33
-0.24
-0.12
-0.41
-0.19
-0.06

APPENDICES
Report DWLBC 2010/07 83
G. GROUNDWATER SALINITY GRAPHS
Groundwater EC time series graphs are displayed in this Appendix. A conversion table of EC to TDS is also presented.
Conversion table from EC units to Total Dissolved Salts EC
(dS/m)
EC
(μS/cm)
TDS
(mg/L or ppm)
0.5
1
2
3
4
5
6
7
8
9
10
11
12
13
14
15
16
17
18
19
20
500
1000
2000
3000
4000
5000
6000
7000
8000
9000
10000
11000
12000
13000
14000
15000
16000
17000
18000
19000
20000
275
550
1105
1664
2227
2795
3367
3943
4524
5109
5698
6291
6889
7491
8098
8708
9323
9942
10565
11192
11824
EC = Electrical conductivity in deciSiemens per metre and microSiemens per cm
(1.0 dS/m = 1000 μS/cm)
TDS = Total Dissolved Salts in mg/L or ppm
The conversion of EC to TDS is based on conversion tables produced by State Water Labs.

APPENDICES
Report DWLBC 2010/07 84
(a) Groundwater salinity trends in deep piezometers
E1C
02468
1012141618202224
Jan-90
Jan-91
Jan-92
Jan-93
Jan-94
Jan-95
Jan-96
Jan-97
Jan-98
Jan-99
Jan-00
Jan-01
Jan-02
Jan-03
Jan-04
Jan-05
Jan-06
Jan-07
Jan-08
Jan-09
Date
EC (d
S/m
)
E1E
0
2
4
6
8
10
12
14
16
18
20
22
Jan-90
Jan-91
Jan-92
Jan-93
Jan-94
Jan-95
Jan-96
Jan-97
Jan-98
Jan-99
Jan-00
Jan-01
Jan-02
Jan-03
Jan-04
Jan-05
Jan-06
Jan-07
Jan-08
Jan-09
Date
EC (d
S/m
)

APPENDICES
Report DWLBC 2010/07 85
E2C
0
2
4
6
8
10
12
Jan-90
Jan-91
Jan-92
Jan-93
Jan-94
Jan-95
Jan-96
Jan-97
Jan-98
Jan-99
Jan-00
Jan-01
Jan-02
Jan-03
Jan-04
Jan-05
Jan-06
Jan-07
Jan-08
Jan-09
Date
EC (d
S/m
)
E3C
0
2
4
6
8
10
Jan-90
Jan-91
Jan-92
Jan-93
Jan-94
Jan-95
Jan-96
Jan-97
Jan-98
Jan-99
Jan-00
Jan-01
Jan-02
Jan-03
Jan-04
Jan-05
Jan-06
Jan-07
Jan-08
Jan-09
Date
EC (d
S/m
)
E4C
0
2
4
6
8
10
Jan-90
Jan-91
Jan-92
Jan-93
Jan-94
Jan-95
Jan-96
Jan-97
Jan-98
Jan-99
Jan-00
Jan-01
Jan-02
Jan-03
Jan-04
Jan-05
Jan-06
Jan-07
Jan-08
Jan-09
Date
EC (d
S/m
)

APPENDICES
Report DWLBC 2010/07 86
E5B
0
2
4
6
8
10
12
Jan-90
Jan-91
Jan-92
Jan-93
Jan-94
Jan-95
Jan-96
Jan-97
Jan-98
Jan-99
Jan-00
Jan-01
Jan-02
Jan-03
Jan-04
Jan-05
Jan-06
Jan-07
Jan-08
Jan-09
Date
EC (d
S/m
)
E5C
0
2
4
6
8
10
Jan-90
Jan-91
Jan-92
Jan-93
Jan-94
Jan-95
Jan-96
Jan-97
Jan-98
Jan-99
Jan-00
Jan-01
Jan-02
Jan-03
Jan-04
Jan-05
Jan-06
Jan-07
Jan-08
Jan-09
Date
EC (d
S/m
)
E6C
0
2
4
6
8
10
12
Jan-90
Jan-91
Jan-92
Jan-93
Jan-94
Jan-95
Jan-96
Jan-97
Jan-98
Jan-99
Jan-00
Jan-01
Jan-02
Jan-03
Jan-04
Jan-05
Jan-06
Jan-07
Jan-08
Jan-09
Date
EC (d
S/m
)
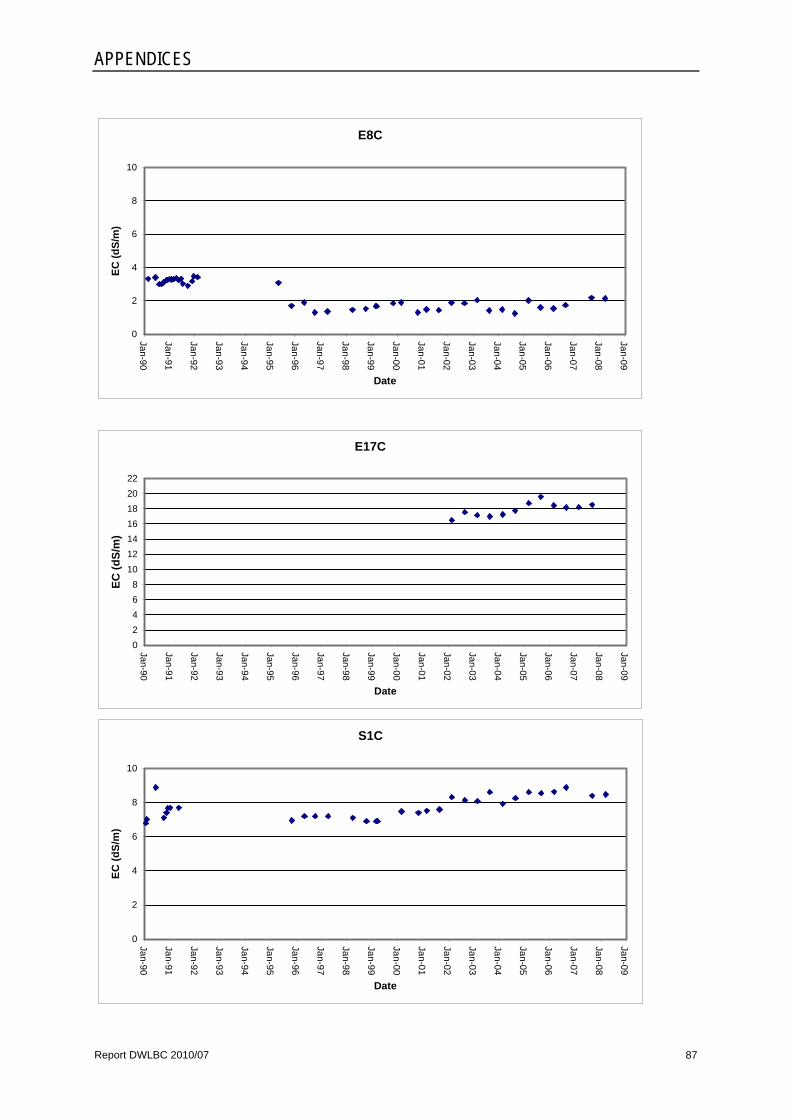
APPENDICES
Report DWLBC 2010/07 87
E8C
0
2
4
6
8
10
Jan-90
Jan-91
Jan-92
Jan-93
Jan-94
Jan-95
Jan-96
Jan-97
Jan-98
Jan-99
Jan-00
Jan-01
Jan-02
Jan-03
Jan-04
Jan-05
Jan-06
Jan-07
Jan-08
Jan-09
Date
EC (d
S/m
)
E17C
02468
10121416182022
Jan-90
Jan-91
Jan-92
Jan-93
Jan-94
Jan-95
Jan-96
Jan-97
Jan-98
Jan-99
Jan-00
Jan-01
Jan-02
Jan-03
Jan-04
Jan-05
Jan-06
Jan-07
Jan-08
Jan-09
Date
EC (d
S/m
)
S1C
0
2
4
6
8
10
Jan-90
Jan-91
Jan-92
Jan-93
Jan-94
Jan-95
Jan-96
Jan-97
Jan-98
Jan-99
Jan-00
Jan-01
Jan-02
Jan-03
Jan-04
Jan-05
Jan-06
Jan-07
Jan-08
Jan-09
Date
EC (d
S/m
)

APPENDICES
Report DWLBC 2010/07 88
S2C
02468
1012141618202224
Jan-90
Jan-91
Jan-92
Jan-93
Jan-94
Jan-95
Jan-96
Jan-97
Jan-98
Jan-99
Jan-00
Jan-01
Jan-02
Jan-03
Jan-04
Jan-05
Jan-06
Jan-07
Jan-08
Jan-09
Date
EC (d
S/m
)
S3C
02468
1012141618202224
Jan-90
Jan-91
Jan-92
Jan-93
Jan-94
Jan-95
Jan-96
Jan-97
Jan-98
Jan-99
Jan-00
Jan-01
Jan-02
Jan-03
Jan-04
Jan-05
Jan-06
Jan-07
Jan-08
Jan-09
Date
EC (d
S/m
)

APPENDICES
Report DWLBC 2010/07 89
S5C
02468
1012141618202224
Jan-90
Jan-91
Jan-92
Jan-93
Jan-94
Jan-95
Jan-96
Jan-97
Jan-98
Jan-99
Jan-00
Jan-01
Jan-02
Jan-03
Jan-04
Jan-05
Jan-06
Jan-07
Jan-08
Jan-09
Date
EC (d
S/m
)
B2C
0
2
4
6
8
10
Jan-90
Jan-91
Jan-92
Jan-93
Jan-94
Jan-95
Jan-96
Jan-97
Jan-98
Jan-99
Jan-00
Jan-01
Jan-02
Jan-03
Jan-04
Jan-05
Jan-06
Jan-07
Jan-08
Jan-09
Date
EC (d
S/m
)
B3C
0
1
2
3
4
Jan-90
Jan-91
Jan-92
Jan-93
Jan-94
Jan-95
Jan-96
Jan-97
Jan-98
Jan-99
Jan-00
Jan-01
Jan-02
Jan-03
Jan-04
Jan-05
Jan-06
Jan-07
Jan-08
Jan-09
Date
EC (d
S/m
)

APPENDICES
Report DWLBC 2010/07 90
(b) Groundwater salinity trends in shallow wells
E2A
0
2
4
6
8
10
Jan-90
Jan-91
Jan-92
Jan-93
Jan-94
Jan-95
Jan-96
Jan-97
Jan-98
Jan-99
Jan-00
Jan-01
Jan-02
Jan-03
Jan-04
Jan-05
Jan-06
Jan-07
Jan-08
Jan-09
Date
EC (d
S/m
)
S3A
0123456789
1011121314
Jan-90
Jan-91
Jan-92
Jan-93
Jan-94
Jan-95
Jan-96
Jan-97
Jan-98
Jan-99
Jan-00
Jan-01
Jan-02
Jan-03
Jan-04
Jan-05
Jan-06
Jan-07
Jan-08
Jan-09
Date
EC (d
S/m
)

APPENDICES
Report DWLBC 2010/07 91
B2A
0
2
4
6
8
10
12
14
Jan-90
Jan-91
Jan-92
Jan-93
Jan-94
Jan-95
Jan-96
Jan-97
Jan-98
Jan-99
Jan-00
Jan-01
Jan-02
Jan-03
Jan-04
Jan-05
Jan-06
Jan-07
Jan-08
Jan-09
Date
EC (d
S/m
)
B3A
0
1
2
3
4
5
6
7
8
9
10
Jan-90
Jan-91
Jan-92
Jan-93
Jan-94
Jan-95
Jan-96
Jan-97
Jan-98
Jan-99
Jan-00
Jan-01
Jan-02
Jan-03
Jan-04
Jan-05
Jan-06
Jan-07
Jan-08
Jan-09
Date
EC (d
S/m
)

Report DWLBC 2010/07 92
UNITS OF MEASUREMENT
Units of measurement commonly used (SI and non-SI Australian legal) Name of unit Symbol Definition in terms of other
metric units Quantity
day d 24 h time interval
gigalitre GL 106 m3 volume
gram g 10–3 kg mass
hectare ha 104 m2 area
hour h 60 min time interval
kilogram kg base unit mass
kilolitre kL 1 m3 volume
kilometre km 103 m length
litre L 10-3 m3 volume
megalitre ML 103 m3 volume
metre m base unit length
microgram μg 10-6 g mass
microlitre μL 10-9 m3 volume
milligram mg 10-3 g mass
millilitre mL 10-6 m3 volume
millimetre mm 10-3 m length
minute min 60 s time interval
second s base unit time interval
tonne t 1000 kg mass
year y 365 or 366 days time interval
Shortened forms
~ approximately equal to
bgs below ground surface
EC electrical conductivity (µS/cm)
K hydraulic conductivity (m/d)
pH acidity
ppm parts per million

REFERENCES
Report DWLBC 2010/07 93
GLOSSARY Alluvial sediments – sedimentary material deposited by flowing water
Aquifer - An underground layer of rock or sediment that holds water and allows water to percolate through
Aquifer, unconfined - An aquifer in which there is no confining layer (e.g. clay) between the groundwater and the soil surface; the watertable is the upper boundary of the groundwater
Aquifer, perched - an aquifer above and separated from the major aquifer by an impermeable layer of clay or rock; often occurs as a shallow seasonal watertable
Baseflow - The water in a stream that results from groundwater discharge to the stream; often maintains flows during seasonal dry periods and has important ecological functions
BoM - Bureau of Meteorology, Australia
Bore - See ‘well’
Break in slope - A linear feature across a landscape at which the surface slope is markedly reduced. Groundwater discharge may occur may occur at along this feature due to a change in hydraulic gradient
Catchment - That area of land determined by topographic features within which rainfall will contribute to run-off at a particular point
Cation Exchange Capacity - The capacity of the soil to exchange cations (positive ions) such as sodium and calcium between the soil solution and the clay complexes in the soil
Colluvial sediments - Loose deposits occurring on or near the base of slopes
CSIRO - Commonwealth Scientific and Industrial Research Organisation
Discharge - Outflow of groundwater as seepage or as evaporation from shallow watertables; often produces the symptoms of dryland salinity (bare ground, salt crusts, waterlogging)
Dryland salinity - The process whereby salts stored below the surface of the ground are brought close to the surface by the rising watertable; the accumulation of salt degrades the upper soil profile, with impacts on agriculture, infrastructure and the environment
DWLBC - Department of Water, Land and Biodiversity Conservation (Government of South Australia)
EC - Electrical conductivity; 1 EC unit = 1 deci-Siemen per metre (dS/m) measured at 25°C; commonly used as a measure of water salinity as it is quicker and easier than measurement by TDS
EC 1:5 - Electrical conductivity of a mixture of 1 part by weight (g) of dried soil to 5 parts by volume (ml) distilled water
ECa - Apparent Electrical Conductivity of bulk soil
EMLR - Eastern Mount Lofty Ranges
EM - Electro-magnetic induction equipment used to measure the soils electrical conductivity
GFS - Groundwater Flow System
GPS - Geographical Positioning System
Groundwater - Water occurring naturally below ground level or water pumped, diverted and released into a well for storage underground
HARTT - Hydrograph Analysis: Rainfall and Time Trends
Hydraulic conductivity (K) - A measure of the ease of flow through aquifer material: high K indicates low resistance, or high flow conditions; measured in metres per day
Hydraulic head - The pressure exerted by groundwater in an elevated part of the aquifer; this usually causes groundwater movement, possibly resulting in lateral or upward discharge

REFERENCES
Report DWLBC 2010/07 94
Hydraulic gradient - (also known as groundwater head) is the change in groundwater level over a distance
Hydrogeology - The study of groundwater, which includes its occurrence, recharge and discharge processes, and the properties of aquifers; see also ‘hydrology’
Hydrograph - A graph that shows the elevation of groundwater as a function of time
Hydrology - The study of the characteristics, occurrence, movement and utilisation of water on and below the Earth’s surface and within its atmosphere; see also ‘hydrogeology’
Land system - An area of land, with a particular set of features (geology, topography, soils and vegetation) that distinguish it from surrounding land.
m AHD - Defines elevation in metres (m) according to the Australian Height Datum (AHD)
Metasediments - a sediment or sedimentary rock that has been subjected to metamorphic process.
MLR - Mount Lofty Ranges
Model - A conceptual or mathematical means of understanding elements of the real world that allows for predictions of outcomes given certain conditions. Examples include estimating storm run-off, assessing the impacts of dams or predicting ecological response to environmental change
NAP - National Afforestation Project
NRM - Natural resources management
Observation well - A narrow well or piezometer whose sole function is to permit water level measurements
OBSWELL - Observation Well Network is the state repository of groundwater information in SA
Permeability - A measure of the ease with which water flows through an aquifer or aquitard, measured in m2/d
Piezometer - A narrow tube, pipe or well; used for measuring moisture in soil, water levels in an aquifer, or pressure head in a tank, pipeline, etc
PIRSA - Primary Industries and Resources South Australia (Government of South Australia)
Recharge area - The area of land from which water from the surface (rainfall, streamflow, irrigation, etc.) infiltrates into an aquifer
Regolith - Weathered or sedimentary material between the ground surface and bedrock
Residual Rainfall curve - The mean deviation from the average monthly rainfall over time; the shape of the curve shows periods where the rainfall has been either higher or lower than average; upward slopes on the curve indicate ‘wetter’ periods and downward slopes indicate ‘drier’ periods
RSSA - Rural Solutions South Australia (Government of South Australia)
RSWL - Reduced Standing Water Level relates standing water levels to a common reference point, usually measured in metres above mean seal level
Sub-catchment - The area of land determined by topographical features within which rainfall will contribute to run-off at a particular point
SWL - Standing Water Level as recorded in a piezometer or observation well
TDS - Total dissolved solids, measured in milligrams per litre (mg/L); a measure of water salinity
Transmissivity (T) - A parameter indicating the ease of groundwater flow through a metre width of aquifer section
Tributary - A river or creek that flows into a larger river
Watershed - The land area that drains into a stream, river, lake, estuary, or coastal zone
Watertable - Is the upper boundary of an unconfined aquifer
Well - An opening in the ground excavated for the purpose of obtaining access to underground water

REFERENCES
Report DWLBC 2010/07 95
REFERENCES
Barnett SR (2000) Extent and impacts of dryland salinity in South Australia, National Land and Water Resources Audit, PIRSA Report Book 2000/00045, Dept for Water Resources, December 2000
Bennett D and George R (2008) Long term monitoring of groundwater levels at 24 sites in Western Australia show that integrated farm forestry systems have little impact on salinity, Proc of 2nd International Salinity Forum, Adelaide, April 2008
Burtt AC (1999) Angaston (6728-iv) 1:50,000 geological sheet, Geological Survey of SA, Dept of Primary Industries and Resources SA
Cox JW and Reynolds MB (1995) Hydrogeological results from the Keynes catchment, South Australia (stage 2). CSIRO Technical Report 5/1995, CRC for Soil and Land management, Glen Osmond, SA
Cresswell R and Liddicoat C (2004) Application of airborne geophysical techniques to salinity issues around Jamestown, South Australia, DWLBC Report 2004/37
Crosbie RS, Hughes JD, Friend J and Baldwin BJ (2007) Monitoring the hydrological impact of land use change in a small agricultural catchment affected by dryland salinity in central NSW, Australia, Agric. Water Management 88:43-53
Dawes WR, Walker GR, and Stauffacher M (1997) Model Building: Process and Practicality, In: Proceedings of MODSIM 97, AD McDonald, M McAleer (eds), Modelling & Simulation Society of Australia, Canberra, 317-22
Dawes WR, Stauffacher M and Walker GR (2000) Calibration and modelling of groundwater processes in the Liverpool Plains, CSIRO Land and Water Technical Report 05/00, Canberra
Dooley TJ (1991) Tree planting for dryland salinity control, Termination report for National Afforestation Program, Dept. of Agriculture, June 1991
Dooley T, Henschke C and Hall J (2008) Salinity extent and trends in SA, Proc of 2nd International Salinity Forum, Adelaide SA, April 2008
DWLBC (In Press) Monitoring and Evaluation of Saltland in SA using Electromagnetic (EM) Induction Mapping, Report for Dept of Water Land and Biodiversity Conservation by Terry Evans, Trevor Dooley and Chris Henschke, Rural Solutions SA
DWLBC (2008a) Monitoring and Evaluation of Land Salinity trends in SA. Fact Sheet 86. Department of Water, Land and Biodiversity Conservation.
DWLBC (2008b) 2007 Saltland Snapshot South Australian Murray-Darling Basin Natural Resources Management Region. Fact Sheet 85. Department of Water, land and Biodiversity Conservation, 2008, Government of South Australia.
DWLBC (2009) 2007 Saltland Snapshot Adelaide & Mt. Lofty Ranges Natural Resources Management Region. Fact Sheet 87. Department of Water, land and Biodiversity Conservation, 2008, Government of South Australia.
DWLBC (2007) Regional Land Resource Information for Southern South Australia, Soil and Land Program, Dept Water Land and Biodiversity Conservation [DVD ROM]
DWR (2001) Groundwater Flow Systems contributing to Dryland Salinity, 1:1 000 000 map produced by Spatial Information Services, Dept for Primary Industries and Resources SA, for the Dept. for Water Resources

REFERENCES
Report DWLBC 2010/07 96
Dyson P (1990) Dryland Salinity Containment in South-Eastern Australia, In: Proc. of a Salinity Technical Forum, Waite Ag. Res. Inst., Feb. 14 1990
Ferdowsian R, Pannell DJ, McCarron C, Ryder AT and Crossing L (2001) Explaining groundwater hydrographs: separating atypical rainfall events from time trends, Aust J Soil Res, 39, 861-875
Gamble I (2003) Dry conditions and the watertable. In: North East Salinity Strategy Implementation Newsletter. Summer / Autumn 2003, 15th Edition, DPI Victoria
George RJ Speed RJ Simons JA Smith RH Ferdowsian R Raper GP and Bennett DL (2008) Long term groundwater trends and their impact on the future extent on dryland salinity in Western Australia in a variable climate, Proc of 2nd International Salinity Forum, Adelaide, April 2008
Hatton, Tom; Reggiani, Paolo and Hodgson, Geoff (2002) The role of trees in the water and salt balances of catchments. In Trees, Water and Salt (2002). Editors Stirzaker, Richard; Vertessy, Rob and Sarre, Alistair. Joint Venture Agroforestry Program. RIRDC Publication No: 01/086
Kevin PM and Dyson PR (1991) Dryland salinity processes at the Mt Camel Range, central Victoria. In: Proc. International Hydrology and Water Resources Symposium, Perth, 2-4 October 1991
Marcar, Nico; Benyon, Richard and Myers, Brian (2002) Species selection and the management of farm forestry plantings. In Trees, Water and Salt (2002). Editors Stirzaker, Richard; Vertessy, Rob and Sarre, Alistair. Joint Venture Agroforestry Program. RIRDC Publication No: 01/086
NDSP (2002) Monitoring shows impact of perennials on recharge, Salt Magazine, The Magazine of Australia’s National Dryland Salinity Program, Issue No 6, May 2002
NLWRA (2007) Land salinity indicator: areas threatened by shallow or rising watertables, National Land and Water Resources Audit, November 2007
Pannewig MK (1994) Electromagnetic induction salinity surveys in a fractured rock system, A thesis submitted to the Faculty of Agriculture Science, The University of Adelaide, Dept. of Soil Science, Nov. 1994 (unpublished)
Rancic A and Acworth I (2008) The relationship between the 1947 shift in climate and the expansion of dryland salinity on the western slopes of the Great Dividing Range in NSW, Proc of 2nd International Salinity Forum, Adelaide SA, April 2008
Reid M (1995). Burkes Flat – A salinity treatment success story, In: Murray Darling 1995 Workshop Extended Abstracts, Wagga Wagga 11-13 September, Record No 1995/61
Reid M, Gill B, Cheng X, Fawcett J, Hekmeijer P Clark R and Hood A (2008) Overview of groundwater trends and dryland salinity in Victoria, Proc of 2nd International Salinity Forum, Adelaide SA, April 2008
Salama RB, Laslett D and Farrington P (1993) Predictive modelling of management options for the control of dryland salinity in a first-order catchment in the wheatbelt of Western Australia, J Hydrology, 145: 19-40
Schofield, NJ (1990) Determining reforestation area and distribution for salinity control. Journal of Hydrological Sciences 35, 1, 2/1990.
Slavich, P.G. and Petterson, G.H. (1993). Estimating the Electrical Conductivity of Saturated Paste Extracts from1:5 Soil: Water Suspensions and Texture. Australian Journal of Soil Research 31, 73 – 81.

REFERENCES
Report DWLBC 2010/07 97
Smitt C, Cox J, McEwan K, Davies P, Herczeg A and Walker G (2003) Salt transport in the Bremer Hills, SA – FLOWTUBE modelling, Second report to the NAP South Australian Salt Mapping and Management, CSIRO Land and Water Technical Report 06/03, April 2003
Smitt, CM, Cox JW, Herczeg A, Wilford J, Henschke, C, Liddicoat, C and Walker, G (submitted for publication in 2009) The origins, mobilisation and management of salt in the eastern Mt Lofty Ranges of South Australia, submitted to Exploration Geophysics
Soil and Land Information (2004) Land Resource Information, Central Districts, Soil and Land Information, Dept of Water Land and Biodiversity Conservation, South Australia [5 set CD ROM]
Soil and Land Program (2007) Landscape model data – salinity risk, Data accessed April 2007, Soil and Land Program, Dept of Water Land and Biodiversity Conservation, South Australia
Taylor P (2003) Salinity foe forces eucalypt rethink, Australian Landcare, March 2003
Walker, Glen; Gilfidder, Mat and Williams, John (1999) Effectiveness of Current Farming Systems in the Control of Dryland Salinity. CSIRO Land and Water publication 1999.
Wilford J (2004) Regolith-landforms and salt stores in the Angas-Bremer Hills, CRC LEME Report 206, Report prepared as part of the NAP South Australian Salt Mapping and Management Support Project, April 2004