dust environment of an airless object a phase space study
TRANSCRIPT

Planetary and Space Science 120 (2016) 56–69
Contents lists available at ScienceDirect
Planetary and Space Science
http://d0032-06
n CorrE-m
journal homepage: www.elsevier.com/locate/pss
Dust environment of an airless object: A phase space study withkinetic models
E. Kallio a,n, S. Dyadechkin a, S. Fatemi b, M. Holmström c, Y. Futaana c, P. Wurz d,V.A. Fernandes d,e, F. Álvarez f, J. Heilimo g, R. Jarvinen g, W. Schmidt g, A.-M. Harri g,S. Barabash c, J. Mäkelä h, N. Porjo g,i, M. Alho a
a Aalto University, School of Electrical Engineering, Helsinki, Finlandb Space Sciences Laboratory, 7 Gauss Way, University of California at Berkeley, Berkeley, CA 94720, USAc Swedish Institute of Space Physics, Kiruna, Swedend University of Bern, Bern, Switzerlande Museum für Naturkunde, Leibniz-Institut für Evolutions- und Biodiversitätsforschung, Berlin, Germanyf Arquimea Ingeniería S.L, Leganés, Spaing Finnish Meteorological Institute, Helsinki, Finlandh University of Jyväskylä, Jyväskylä, Finlandi ArcDia International Oy Ltd, Finland
a r t i c l e i n f o
Article history:Received 11 December 2014Received in revised form2 November 2015Accepted 9 November 2015Available online 3 December 2015
Keywords:DustMoonasteroidsPlasma–surface interactionKinetic particle simulationsSpace plasma
x.doi.org/10.1016/j.pss.2015.11.00633/& 2015 Elsevier Ltd. All rights reserved.
esponding authors. Tel.: þ358 50 4205 857.ail address: [email protected] (E. Kallio).
a b s t r a c t
The study of dust above the lunar surface is important for both science and technology. Dust particles areelectrically charged due to impact of the solar radiation and the solar wind plasma and, therefore, theyaffect the plasma above the lunar surface. Dust is also a health hazard for crewed missions becausemicron and sub-micron sized dust particles can be toxic and harmful to the human body. Dust alsocauses malfunctions in mechanical devices and is therefore a risk for spacecraft and instruments on thelunar surface. Properties of dust particles above the lunar surface are not fully known. However, it can bestated that their large surface area to volume ratio due to their irregular shape, broken chemical bonds onthe surface of each dust particle, together with the reduced lunar environment cause the dust particles tobe chemically very reactive. One critical unknown factor is the electric field and the electric potentialnear the lunar surface. We have developed a modelling suite, Dusty Plasma Environments: near-surfacecharacterisation and Modelling (DPEM), to study globally and locally dust environments of the Moon andother airless bodies. The DPEM model combines three independent kinetic models: (1) a 3D hybridmodel, where ions are modelled as particles and electrons are modelled as a charged neutralising fluid,(2) a 2D electrostatic Particle-in-Cell (PIC) model where both ions and electrons are treated as particles,and (3) a 3D Monte Carlo (MC) model where dust particles are modelled as test particles. The threemodels are linked to each other unidirectionally; the hybrid model provides upstream plasma para-meters to be used as boundary conditions for the PIC model which generates the surface potential for theMC model. We have used the DPEM model to study properties of dust particles injected from the surfaceof airless objects such as the Moon, the Martian moon Phobos and the asteroid RQ36. We have performeda (v0, m/q)-phase space study where the property of dust particles at different initial velocity (v0) andinitial mass per charge (m/q) ratio were analysed. The study especially identifies regions in the phasespace where the electric field within a non-quasineutral plasma region above the surface of the object,the Debye layer, becomes important compared with the gravitational force. Properties of the dust par-ticles in the phase space region where the electric field plays an important role are studied by a 3D MonteCarlo model. The current DPEM modelling suite does not include models of how dust particles areinitially injected from the surface. Therefore, the presented phase space study cannot give absolute 3Ddust density distributions around the analysed airless objects. For that, an additional emission model isnecessary, which determines how many dust particles are emitted at various places on the analysed (v0,m/q)-phase space. However, this study identifies phase space regions where the electric field within theDebye layer plays an important role for dust particles. Overall, the initial results indicate that when arealistic dust emission model is available, the unified lunar based DPEM modelling suite is a powerful

E. Kallio et al. / Planetary and Space Science 120 (2016) 56–69 57
tool to study globally and locally the dust environments of airless bodies such as planetary moons,Mercury, asteroids and non-active comets far from the Sun.
& 2015 Elsevier Ltd. All rights reserved.
Fig. 1. Overview of the three models in the DPEM modelling suite: [1] a 3D Hybridmodel, [2] a 2D electrostatic full kinetic Particle-In-Cell (PIC) model, and [3] a 3DMonte Carlo (MC) model. All three models have also their own 3D MaxwellianParticle Generator, MPG, to inject particles into models. Models are connected toeach other by a one-way relationship: The PIC model uses the impacting Hþ ionsderived by the hybrid model while the MC model uses the surface potential cal-culated by the PIC model. Input parameters for the models are the solar wind (SW),the radius of the object (Robj), the gravitational force (g) and the interplanetarymagnetic field (Bsw). The physical output dust parameters are 1D, 2D and 3Ddensity profiles.
1. Introduction
The Moon is the best known example of the so-called directplasma–surface interaction where plasma interacts directly withthe surface of the object. This direct interaction takes place at thelunar surface because the Moon has neither an atmosphere nor aglobal intrinsic magnetic field, which could change the motion ofcharged particles near the surface. Thus, the Moon is an idealobject to study various physical processes near the surface, whichare anticipated to occur on the so-called airless bodies, likeasteroids, other planetary moons in the Solar System and non-active dusty comets.
One can anticipate that many physical parameters affect sur-face processes near the lunar surface (see e.g. Kallio et al., 2012,and discussion therein): (1) the density, bulk velocity and tem-perature of the solar wind protons and electrons; (2) secondaryparticles (electrons, positively and negatively charged ions)resulting from the impact of the solar wind onto the surface;(3) photoelectrons from the surface in places exposed to thesunlight; (4) charged dust particles above the surface, which arealso sinks and sources of charged particles like the surface itself;(5) the interplanetary magnetic field (IMF), the magnetic fieldassociated with the Earth's magnetosheath or with the magneto-sphere. Furthermore, possible local magnetic anomalies affect theproperties of plasma, for example, reflection of the solar windelectrons and protons from and above the surface requiring e.g.hybrid modelling beyond the Debye scale; (6) the convectiveelectric field associated with the flow of the solar wind, with theelectric field in the Earth's magnetosheath or in the magneto-sphere (e.g. Kallio and Facskó, 2015). Moreover, there is an electricfield within the Debye sheath (or the Debye layer) where theplasma is not quasi-neutral. Furthermore, the solar radiation variesdue to temporal variations of the Sun. The intensity of the solarradiation at a given point on the lunar surface varies also with theorbit of the Moon around the Earth. Moreover, physical and che-mical properties of the locations on the lunar surface from wherethe charged particles originate vary (e.g., mafic basalt flows orcrustal anorthositic material) vary. Finally, surface processes areaffected by topographical variations due to lunar landscapes (e.g.Dyadechkin et al., 2015).
In addition to the aforementioned physical parameters andprocesses the lunar near-surface is highly important for basicspace plasma physics research. Such research is also needed toimprove the understanding of the interaction between the dustparticles on the lunar surface and the Debye layer that directlyaffect the technical and scientific instrumentation deployed on thelunar surface during different missions. Ultimately, these effectscan pose potential hazard to humans (e.g. Linnarsson et al., 2012).In addition, laboratory experiments have shown that due to theelectric field near the surface the dust particles can easily be dis-placed (Wang et al., 2010) potentially causing malfunctions ofmoving spacecraft parts and space instruments existing on thelunar surface. Moreover, dust can contaminate astronomicalobservations in the infra-red, visible and UV wavelength ranges(Murphy and Vondrak, 1993; Stubbs et al., 2006). Lunar dust hasalso been observed far above the surface (see e.g. references inStubbs et al., 2006) suggesting that dust may have global effects.
Space weathering caused by micrometeorites, galactic cosmicrays and solar energetic particles erode, and vaporise dust grainsand regolith on the lunar surface (see e.g. Jordan et al., 2015).However, the difference between dust on the Earth and on the
Moon is that on the Moon there is no Earth-like wind or watererosion of dust particles. Therefore, small lunar dust particles canhave very sharp edges and reactive broken chemical bonds (e.g.Liu and Taylor, 2011; Liu et al., 2008; Linnarsson et al., 2012).When entered into the lungs of an astronaut, the small sharp dustparticles are therefore a potential health hazard. Generallyspeaking, lunar dust is more chemically reactive, has large surfaceareas, and is composed of sharper jagged edges than Earth's dust(Cain, 2010). Properties of dust are therefore a critical issue thathas to be taken into account when a crewed lunar mission isplanned.
A comprehensive lunar dust model should consider three dif-ferent space regimes. It should include (1) a global model thatgives properties of the solar wind plasma impacting on the sur-face, (2) a local model of the electric field above the lunar surfacewhich accelerates dust particles, and (3) a global model whichgives the density of dust around the Moon. Towards this goal, thepresent study focuses on three different but connected models. Aglobal hybrid model gives the properties of protons above thesurface. A local 2D full kinetic model is then used to derive thesurface potential at different Solar Zenith Angles (SZA) near thesurface. Finally, a global Monte Carlo model is used to derive threedimensional densities of the dust particles escaping from thesurface. The comprehensive lunar dust model is then applied tostudy the 3D dust density profiles for the Moon, the Martian moonPhobos and the asteroid RQ36 to cover a large size range of pla-netary objects.
The paper is organised as follows. First the three developedmodels are described. The capability of the models is demon-strated with a phase space study where the models are used toderive 3D dust densities for the Moon, Phobos and the asteroidRQ36 for parameters entered manually and for two different dustemission models: a homogeneous dust emission for the surface,and a point source at the subsolar point. For parameter evaluation,initial dust particles were chosen from a range that makes itpossible to analyse effects of the surface electric potential and,consequently, the capacity of the developed modelling suite tostudy various airless bodies. Finally, lessons of the analysed casesand a roadmap for future more sophisticated dust models arediscussed.
E. Kallio et al. / Planetary and Space Science 120 (2016) 56–6958
2. Description of the Dusty Plasma Environments: near-surface characterization and modelling (DPEM) suite
The DPEM model contains three kinetic models: (1) a 3DHybrid model where ions are particles and electrons form a fluid,(2) a 2D electrostatic full kinetic Particle-in-Cell (PIC) model whereboth ions and electrons are particles, and (3) a 3D Monte Carlo(MC) model.
Fig. 1 shows an illustration of the models and depicts how theyare connected to each other by unidirectional connections wherethe hybrid model provides the plasma parameter boundary con-ditions for the PIC model, which in turn gives inputs to the MCmodel. More precisely, the hybrid model provided the positionsand velocities of the solar wind protons which hit the surface ofthe planetary object. The PIC model uses these particles andderives the macroscopic plasma parameters associated with theprecipitating protons: the density of protons, (n(Hþ)), three bulkvelocity components for protons (Ux(Hþ), Uy(Hþ), Uz(Hþ)) and thetemperatures of protons in three directions (Tx(Hþ), Ty(Hþ),Tz(Hþ)). Here the indices refer to the Object-centred Solar windOrbital (OSO) coordinates where the x-axis points from the centreof the (spherical) object against the flow of the solar wind, the y-axis shows the direction of the velocity vector of the object per-pendicular the x-axis, and the z-axis completes the right handedcoordinate system. All three models include their own 3D Max-wellian Particle Generator, MPG, which are used to inject particlesinto models. If the macroscopic parameters associated with theprecipitating protons are close to the values of the undisturbedsolar wind parameters, as in the cases analysed in this study asdiscussed later in Section 2.1, the PIC model generates particles byusing its own MPG which uses undisturbed plasma parameters.Finally, the PIC model gives the surface potential values to the MCmodel which uses the potential values in its MPG as will be dis-cussed later in detail in Section 2.3.2.
All three models in the DPEM suite are kinetic simulationswhere some, or all, of the particle species are modelled as parti-cles. The particles are propagated by using Newton's second law:
mdv r; tð Þ
dt¼mgðrÞþqEðr; tÞþqv � Bðr; tÞþF ð1aÞ
drðr; tÞdt
¼ vðr; tÞ ð1bÞ
Here, q, m and v are the charge, mass and velocity of a particle,g is the gravitation acceleration at the point where the particle is, Eis the electric field, B the magnetic field and F is the contributionof all other forces, such as caused by the radiation pressure orcollisions. The three models differ from each other in the wayparticles are modelled, how the electric field is derived and howthe magnetic field is treated.
The objects were assumed to be spherical balls with a homo-geneous mass density end electrical conductivity. However, themodels do not include information about the detailed chemicalcomposition of the surface material. The DPEM model was used tostudy three different objects of different sizes, masses and escapevelocities:
1. Object No1: Near Earth asteroid RQ36
The RQ36, or 101955 Bennu, is an Apollo near Earth asteroiddiscovered in 1999. In the simulations RQ36 in the solar wind wasassumed to have a radius of 252 m and a mass of 1.4�1011 kg. Theescape velocity from RQ36 is about 0.2 m/s.
2. Object No2: Martian Moon Phobos
Phobos was assumed to have radius of 12 km and the mass of1.066�1016 kg. The escape velocity from Phobos is about 11 m/sand the surface gravity is 0.0057 m/s2. In the simulations Phoboswas assumed to be in the solar wind.
3. Object No3: The Moon.
In the global simulations the Moon was assumed to be in thesolar wind, and to have a radius of 1730 km and a mass of7.35�1022 kg. The escape velocity from the Moon is about 2.5 km/s and the surface gravity is 1.622 m/s2.
Moreover, in the PIC model the EUV light is directed along thex-axis, which results in photo-electron emission from the surfaceof the planetary body. Photo-electrons were modelled by a 3DMaxwellian velocity distribution function with the thermal velo-city of 621 km/s, which corresponds to a temperature of about2.2 eV. The photo-electron emission current density was assumedto be 4.5 μA m�2 based on measurements (Willis et al., 1973) andwhich has been used in previous 1D PIC simulations (see, e.g.,Poppe and Horànyi, 2010). Moreover, the high energy tail of theMaxwellian velocity distribution function was cut away byremoving electrons above 6 eV.
2.1. Hybrid model
In the hybrid model, ions are modelled as particles according toEqs. (1) and (2). Electrons are modelled as a massless fluid. Thecharge density of electrons, ne, is assumed to be equal to the totalcharge density of positively charged ions, that is, the plasma isassumed to be quasi-neutral. In the DPEM hybrid model the onlypositively charged ions were the solar wind protons. The electricfield is derived from the electron momentum equation and thedefinition of the electric current:
Eðr; tÞ ¼ �Ueðr; tÞ � Bðr; tÞ ð2aÞ
Ueðr; tÞ ¼UH þ ðr; tÞ� jðr; tÞ=eneðr; tÞ ð2bÞHere Ue, UH þ , j and e are the electron bulk velocity, bulk velocityof protons, the electric current, and the positive unit charge,respectively (see e.g., Kallio, 2005, for the details of a 3D hybridmodel simulations for a Moon-type of airless objects without anintrinsic magnetic field). The object is assumed to be an insulator(resistivity 1�107 Ω/m) into which the IMF can diffuse (seeHolmström et al., 2012, for the details of the model). Theupstream parameters were n(Hþ)¼7.1 cm�3, U(Hþ)¼[�450, 0,0] km/s, T(Hþ)¼1.2�105 K and the IMF was B¼[7/√2, 7/√2, 0]nT.
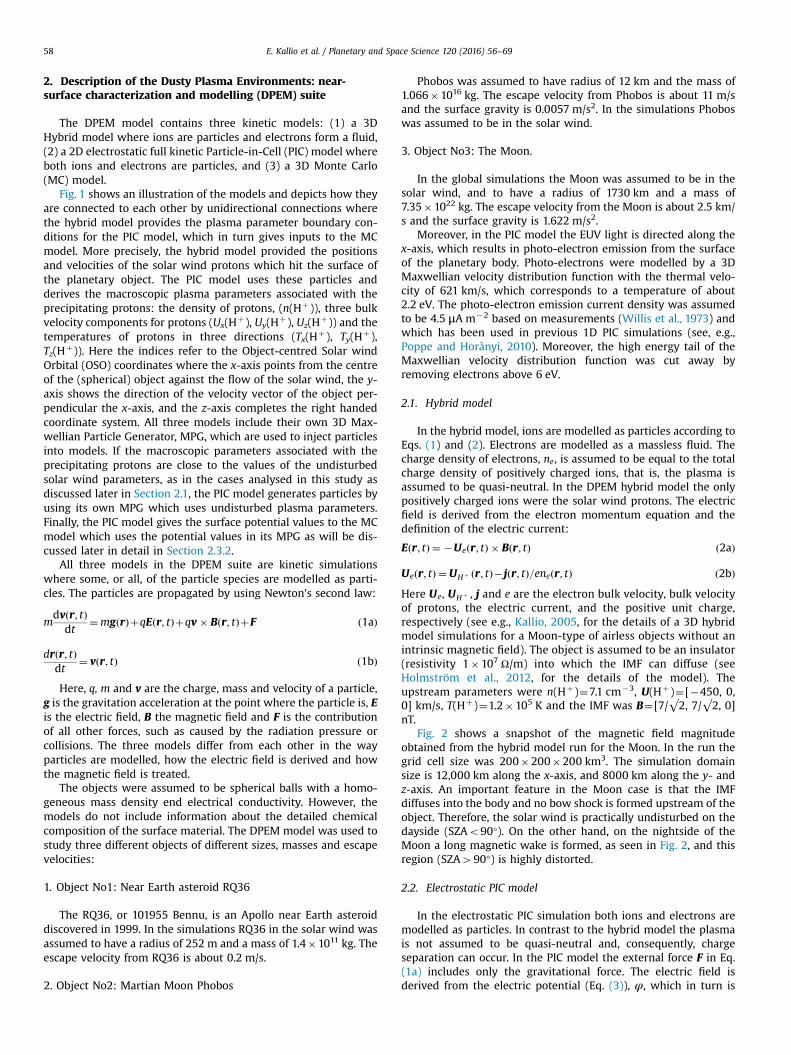
Fig. 2 shows a snapshot of the magnetic field magnitudeobtained from the hybrid model run for the Moon. In the run thegrid cell size was 200�200�200 km3. The simulation domainsize is 12,000 km along the x-axis, and 8000 km along the y- andz-axis. An important feature in the Moon case is that the IMFdiffuses into the body and no bow shock is formed upstream of theobject. Therefore, the solar wind is practically undisturbed on thedayside (SZAo90°). On the other hand, on the nightside of theMoon a long magnetic wake is formed, as seen in Fig. 2, and thisregion (SZA490°) is highly distorted.
2.2. Electrostatic PIC model
In the electrostatic PIC simulation both ions and electrons aremodelled as particles. In contrast to the hybrid model the plasmais not assumed to be quasi-neutral and, consequently, chargeseparation can occur. In the PIC model the external force F in Eq.(1a) includes only the gravitational force. The electric field isderived from the electric potential (Eq. (3)), φ, which in turn is
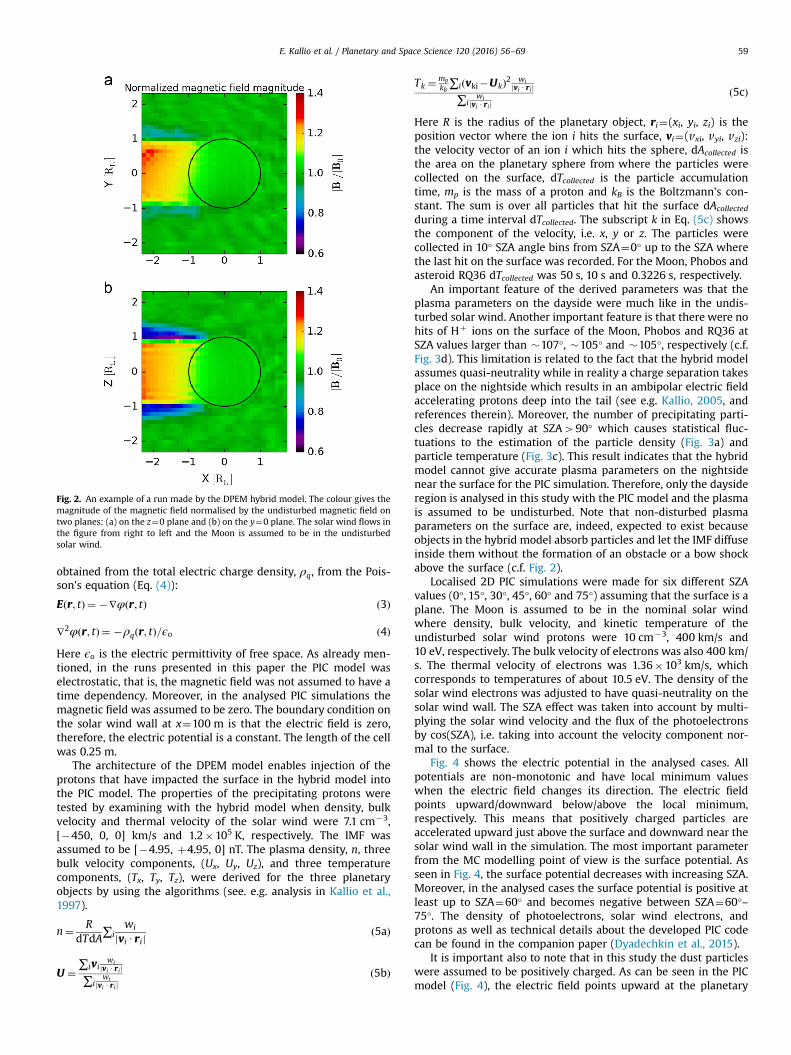
Fig. 2. An example of a run made by the DPEM hybrid model. The colour gives themagnitude of the magnetic field normalised by the undisturbed magnetic field ontwo planes: (a) on the z¼0 plane and (b) on the y¼0 plane. The solar wind flows inthe figure from right to left and the Moon is assumed to be in the undisturbedsolar wind.
E. Kallio et al. / Planetary and Space Science 120 (2016) 56–69 59
obtained from the total electric charge density, ρq, from the Pois-son's equation (Eq. (4)):
Eðr; tÞ ¼ �∇φðr; tÞ ð3Þ
∇2φ r; tð Þ ¼ �ρq r; tð Þ=ϵo ð4Þ
Here ϵo is the electric permittivity of free space. As already men-tioned, in the runs presented in this paper the PIC model waselectrostatic, that is, the magnetic field was not assumed to have atime dependency. Moreover, in the analysed PIC simulations themagnetic field was assumed to be zero. The boundary condition onthe solar wind wall at x¼100 m is that the electric field is zero,therefore, the electric potential is a constant. The length of the cellwas 0.25 m.
The architecture of the DPEM model enables injection of theprotons that have impacted the surface in the hybrid model intothe PIC model. The properties of the precipitating protons weretested by examining with the hybrid model when density, bulkvelocity and thermal velocity of the solar wind were 7.1 cm�3,[�450, 0, 0] km/s and 1.2�105 K, respectively. The IMF wasassumed to be [�4.95, þ4.95, 0] nT. The plasma density, n, threebulk velocity components, (Ux, Uy, Uz), and three temperaturecomponents, (Tx, Ty, Tz), were derived for the three planetaryobjects by using the algorithms (see. e.g. analysis in Kallio et al.,1997).
n¼ RdTdA
∑iwi
jvi Urijð5aÞ
U ¼∑ivi
wijvi Urij
∑iwi
jvi Uri jð5bÞ
Tk ¼ mp
kB∑iðvki�UkÞ2 wi
jvi U rij∑i
wijvi Uri j
ð5cÞ
Here R is the radius of the planetary object, ri¼(xi, yi, zi) is theposition vector where the ion i hits the surface, vi¼(vxi, vyi, vzi):the velocity vector of an ion i which hits the sphere, dAcollected isthe area on the planetary sphere from where the particles werecollected on the surface, dTcollected is the particle accumulationtime, mp is the mass of a proton and kB is the Boltzmann's con-stant. The sum is over all particles that hit the surface dAcollected
during a time interval dTcollected. The subscript k in Eq. (5c) showsthe component of the velocity, i.e. x, y or z. The particles werecollected in 10° SZA angle bins from SZA¼0° up to the SZA wherethe last hit on the surface was recorded. For the Moon, Phobos andasteroid RQ36 dTcollected was 50 s, 10 s and 0.3226 s, respectively.
An important feature of the derived parameters was that theplasma parameters on the dayside were much like in the undis-turbed solar wind. Another important feature is that there were nohits of Hþ ions on the surface of the Moon, Phobos and RQ36 atSZA values larger than �107°, �105° and �105°, respectively (c.f.Fig. 3d). This limitation is related to the fact that the hybrid modelassumes quasi-neutrality while in reality a charge separation takesplace on the nightside which results in an ambipolar electric fieldaccelerating protons deep into the tail (see e.g. Kallio, 2005, andreferences therein). Moreover, the number of precipitating parti-cles decrease rapidly at SZA490° which causes statistical fluc-tuations to the estimation of the particle density (Fig. 3a) andparticle temperature (Fig. 3c). This result indicates that the hybridmodel cannot give accurate plasma parameters on the nightsidenear the surface for the PIC simulation. Therefore, only the daysideregion is analysed in this study with the PIC model and the plasmais assumed to be undisturbed. Note that non-disturbed plasmaparameters on the surface are, indeed, expected to exist becauseobjects in the hybrid model absorb particles and let the IMF diffuseinside them without the formation of an obstacle or a bow shockabove the surface (c.f. Fig. 2).
Localised 2D PIC simulations were made for six different SZAvalues (0°, 15°, 30°, 45°, 60° and 75°) assuming that the surface is aplane. The Moon is assumed to be in the nominal solar windwhere density, bulk velocity, and kinetic temperature of theundisturbed solar wind protons were 10 cm�3, 400 km/s and10 eV, respectively. The bulk velocity of electrons was also 400 km/s. The thermal velocity of electrons was 1.36�103 km/s, whichcorresponds to temperatures of about 10.5 eV. The density of thesolar wind electrons was adjusted to have quasi-neutrality on thesolar wind wall. The SZA effect was taken into account by multi-plying the solar wind velocity and the flux of the photoelectronsby cos(SZA), i.e. taking into account the velocity component nor-mal to the surface.
Fig. 4 shows the electric potential in the analysed cases. Allpotentials are non-monotonic and have local minimum valueswhen the electric field changes its direction. The electric fieldpoints upward/downward below/above the local minimum,respectively. This means that positively charged particles areaccelerated upward just above the surface and downward near thesolar wind wall in the simulation. The most important parameterfrom the MC modelling point of view is the surface potential. Asseen in Fig. 4, the surface potential decreases with increasing SZA.Moreover, in the analysed cases the surface potential is positive atleast up to SZA¼60° and becomes negative between SZA¼60°–75°. The density of photoelectrons, solar wind electrons, andprotons as well as technical details about the developed PIC codecan be found in the companion paper (Dyadechkin et al., 2015).
It is important also to note that in this study the dust particleswere assumed to be positively charged. As can be seen in the PICmodel (Fig. 4), the electric field points upward at the planetary
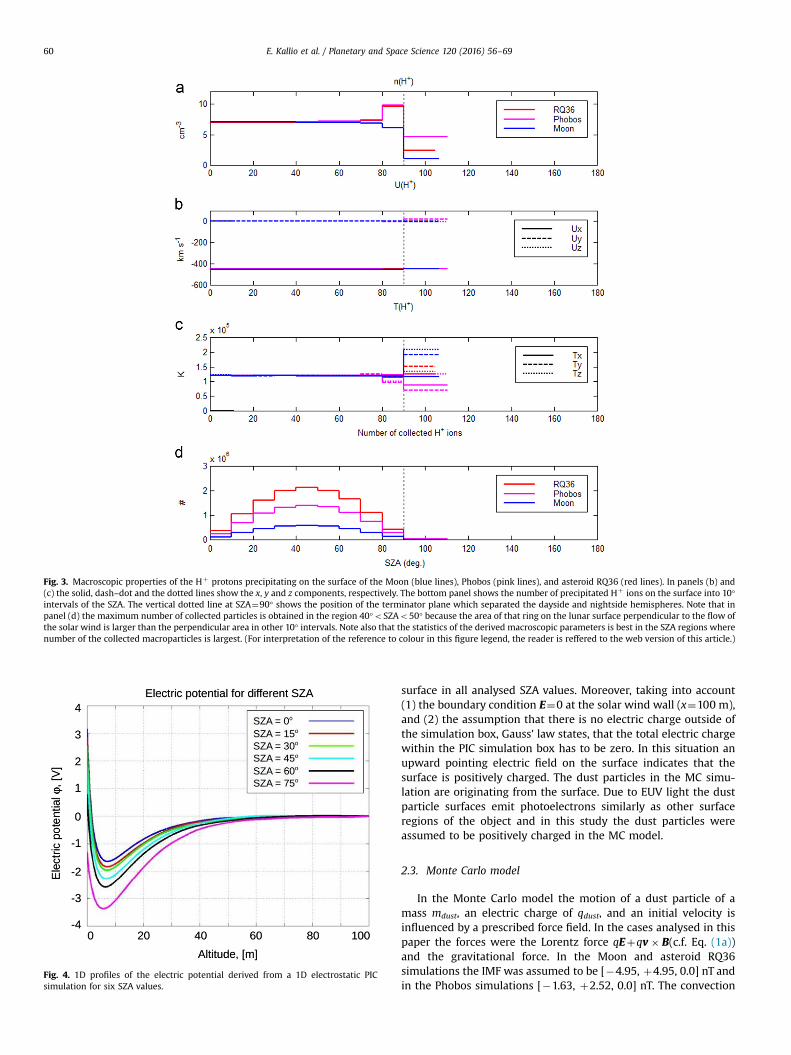
Fig. 3. Macroscopic properties of the Hþ protons precipitating on the surface of the Moon (blue lines), Phobos (pink lines), and asteroid RQ36 (red lines). In panels (b) and(c) the solid, dash–dot and the dotted lines show the x, y and z components, respectively. The bottom panel shows the number of precipitated Hþ ions on the surface into 10°intervals of the SZA. The vertical dotted line at SZA¼90° shows the position of the terminator plane which separated the dayside and nightside hemispheres. Note that inpanel (d) the maximum number of collected particles is obtained in the region 40°oSZAo50° because the area of that ring on the lunar surface perpendicular to the flow ofthe solar wind is larger than the perpendicular area in other 10° intervals. Note also that the statistics of the derived macroscopic parameters is best in the SZA regions wherenumber of the collected macroparticles is largest. (For interpretation of the reference to colour in this figure legend, the reader is reffered to the web version of this article.)
Fig. 4. 1D profiles of the electric potential derived from a 1D electrostatic PICsimulation for six SZA values.
E. Kallio et al. / Planetary and Space Science 120 (2016) 56–6960
surface in all analysed SZA values. Moreover, taking into account(1) the boundary condition E¼0 at the solar wind wall (x¼100 m),and (2) the assumption that there is no electric charge outside ofthe simulation box, Gauss' law states, that the total electric chargewithin the PIC simulation box has to be zero. In this situation anupward pointing electric field on the surface indicates that thesurface is positively charged. The dust particles in the MC simu-lation are originating from the surface. Due to EUV light the dustparticle surfaces emit photoelectrons similarly as other surfaceregions of the object and in this study the dust particles wereassumed to be positively charged in the MC model.
2.3. Monte Carlo model
In the Monte Carlo model the motion of a dust particle of amass mdust, an electric charge of qdust, and an initial velocity isinfluenced by a prescribed force field. In the cases analysed in thispaper the forces were the Lorentz force qEþqv � B(c.f. Eq. (1a))and the gravitational force. In the Moon and asteroid RQ36simulations the IMF was assumed to be [�4.95, þ4.95, 0.0] nT andin the Phobos simulations [�1.63, þ2.52, 0.0] nT. The convection

Fig. 5. Analysis of the role of the surface charging to the density of dust within theDebye layer. The curves show the normalized density of dust particles at six SZAcases for the (a) “cold” dust run (the Run PIC-1) and (b) the “hot” dust run (the RunPIC-2) when the thermal velocity (Vth) was small, large compared with the bulkvelocity, respectively. The densities are calculated with the 2D MC model by usingthe electric potential given in Fig. 4. In (a) every six cases are normalized so that themaximum density is one. In (b) densities are normalized with the maximumdensity of dust in the SZA¼0° case.
E. Kallio et al. / Planetary and Space Science 120 (2016) 56–69 61
electric field was set to zero to investigate change of the energy ofthe dust particles caused by the surface charging and gravitation.
The density of the dust was derived from two Monte Carlomodels: (1) Dust within and near the Debye layer is studied by alocal 2D MC model and the (2) global dust distribution around anobject by a 3D MC model. Two different models were used toobtain a good spatial resolution near the surface, where the lengthscale of the electric potential is the Debye length, and around theobject, where the length scale is large, on the order of the radius ofan object.
As will be discussed in detail later in Section 3.1, it is not knownhow large the amount of detached dust particles from the surfacecan become and what might be their masses, electric charges andthe velocity distribution functions. Dust particles can be envi-sioned to be lifted from the surface by micrometeoroid impacts orby a human activity such as walking, driving a lunar rover orlanding of a spacecraft. Dust lifting by electrostatic forces has alsobeen a topic of numerous studies (see e.g. Farrell et al., 2007). Theparticle flux of dust from the surface is also an unknownparameter.
Because of the aforementioned uncertainties several choiceshave been made in the MC simulations to study the sensitivity ofthe results to the input parameters. First, simulations were madefor different masses, charges and velocities of dust particles. Sec-ond, the role of the planetary surface charge, which affects theacceleration of charged dust particles, was studied by making runswith and without surface charging. Third, two different dustsource models were analysed: A full surface dust emission caseand a point source dust emission case. Fourth, the density of thedust is given in normalized values because the particle flux of dustis not known. Fifth, the initial velocity distribution function of dustparticles emitted from the surface was assumed to be Maxwellian.
2.3.1.. Debye layer regionFig. 5 shows 1D density profiles of dust particles within the
Debye layer in the analysed “cold” and “hot” cases. In the 2D MCruns the dust particles had the mass of 6.2832�10�18 kg(�3.76�109 amu, where amu is the atomic mass unit, about thesame as the mass of a proton of 1.67�10�27 kg), and the electriccharge of þ3.5322�10�17 C (�221 e, where e is the positive unitcharge of 1.602�10�19 C). The adopted dust mass and electriccharge has the same order of magnitude as the dust(�5.3�108 amu, �105 e) which has recently been used to studythe dust density above 2D lunar surfaces. The adopted mass andcharge values correspond to a dust particle with a radius of�0.05 μm and a potential of �3 V (Dyadechkin et al., 2015).
Densities were derived for the six electric potential casesshown earlier in Fig. 4. The densities from the 2D MC model givenin Fig. 5 are derived along the x-axis at y¼0 m. In the 2D PICmodel, the x-axis is the vertical axis pointing away from the sur-face, and the y-axis is the horizontal axis. Initial mass for the dustwere chosen to give an example of the situation where the role ofthe electric potential can be identified in dust densities. Thesimulated region was x¼[0, 100] m, the grid size was 0.25 m, thetime step was 0.01 s and the duration of the simulation was 50 s.
The “cold” dust run is shown in Fig. 5a (the Run PIC-1). In thisrun dust was launched from the surface with a 3D Maxwellianvelocity distribution function with a bulk velocity of 10 m/s andthermal velocity of 1 mm/s. In this “cold” dust case, or a “beam”
dust case, the adopted thermal velocity was therefore muchsmaller than the bulk dust velocity and the maximum dust densityvalue can be found at the altitude where the dust upward movingvelocity changes its direction to downward velocity.
Fig. 5b represents the “hot” dust case (the Run PIC-2) where thethermal velocity of 2 m/s is comparable with the bulk velocity of10 m/s. Thermal spread results in the situation where dust parti-cles turn back to surface at different altitudes resulting in aspreading of the dust density around the maximum dust density.In the “hot” dust case, as in the “cold” dust case, the altitude of themaximum dust density decreases with increasing SZA because thesurface charging decreases with the increasing SZA.
Note that the density differences in Fig. 5a and b are causedpurely by the Debye layer. In the “cold” dust case the maximumdensity forms a sharp peak because all emitted dust particles hadquite similar initial velocities. The maximum altitude is highest atsmall SZA values because the positive surface potential is largestthere and, consequently, it gives the maximum upward pointingacceleration for a positively charged dust particle. The SZA¼60°case resembles most of the cases without the Debye layer becausein this SZA situation the surface potential in near zero (c.f. Fig. 4)and, therefore, it has only slightly increased the maximum altitudefrom about 31 m (¼0.5� (10 m/s)2/1.622 m/s2), which the dustparticles would have had due to the lunar gravitational field alone.The 60° case also divides the dust density curves into two regionswith respect to the SZAs: The SZA case where the (positive) Debye

E. Kallio et al. / Planetary and Space Science 120 (2016) 56–6962
layer increases the maximum altitude and the high SZA casewhere the maximum altitude is decreased by the Debye layer.
2.3.2. 3D MC modelThe 3D dust density distribution function cannot be derived
with the similar small grid size as shown in Fig. 5 because of thehigh computational cost. Therefore, the role of the surface chargewas taken into account in the following way. First, the Debye layerregion was removed from the 3D MC simulation region. Second,the effect of the removed Debye layer was taken into account bymodifying the radial (upward) velocity of a dust particle which islaunched in the MC model at SZA, vMC
r ðSZAÞ, by using the surfacepotential at the launch point, φPIC
surf SZAð Þ; which is derived from thePIC model:
12mdustv
MCr SZAð Þ2þmdustU hð Þg ¼
12mdustv
Maxwellr
2þmdustUð0ÞgþqdustφPICsurf SZAð Þ
ð6Þ
⇒vMCr SZAð Þ ¼ vMaxwell
r
ffiffiffiffiffiffiffiffiffiffiffiffiffiffiffiffiffiffiffiffiffiffiffiffiffiffiffiffiffiffiffiffiffiffiffiffiffiffiffiffiffiffiffiffiffiffiffiffiffiffiffiffiffiffiffiffiffiffiffiffiffiffiffiffiffiffiffiffiffiffiffiffiffiffiffiffiffiffiffiffiffiffiffiffi
1þ2 qdust
mdust
� �φPIC
surf SZAð Þ�2½U hð Þg�U 0ð Þg�vMaxwell2r
vuut ð7Þ
Here vMaxwellr ;U hð Þg ;Uð0Þg are respectively the radial velocity com-
ponent derived from the 3D Maxwellian velocity distributiongenerator of the MC model, the gravitation potential at the heighth from the surface, and the gravitational potential on the surface.The two velocity components along the surface were unchangedby the electric potential. As pointed out before, the properties ofprecipitating protons at the dayside in all three analysed objectswere much like the undisturbed solar wind protons on the day-side. Therefore, similar SZA dependent surface potentials wereused for all objects at SZAo90° as shown in Fig. 4. At higher SZAvalues the surface potential was assumed to be zero because thehybrid model does not give accurate plasma parameters near thesurface, as also noted before.
It is worth recalling how the surface potential affects the radialvelocity in Eq. (7). As discussed in Section 2.2, the surface as well asthe dust particles can be regarded as positively charged at SZAo60°.However, a dust particle can also be non-charged because of the lowsurface charging, as will be discussed in detail later in Section 3.1. Asituation where a dust particle is positively charged means that theterm qdustφPIC
surf SZAð Þ in Eq. (7) is positive at SZAo60° and, conse-quently, that a dust particle which has passed through the Debye layerhas increased its radial velocity. This also means that the surfacepotential increases the number of dust particles, which can escapefrom the Debye layer because low velocity dust particles can getenough energy to move to high altitudes in the gravitational field. AtSZA¼75°, instead, the surface potential is negative and a positivelycharged dust particle which has passed through the Debye layer hasdecreased its radial velocity. Therefore the surface potential decreasesthe number of small velocity dust particles which can escape from theDebye layer at high SZA values.
In all 3D MC runs identical upstream parameters were used tosee the effect of the size of the object. The 3D MC model usedperiodic boundary conditions and the grid size was 0.125 times theradius of the object. The time steps in the 3D MC Moon, Phobosand RQ36 runs were 20 s, 20 s and 1 s, respectively.
Fig. 6. Normalized dust densities around asteroid RQ36 on the (left columns) xy-plane and (right columns) on the xz-plane when the surface potential is notincluded. In the first run (RQ36-1) dust was emitted from the full surface while inthe rest three runs (RQ36-2, RQ36-3, RQ36-4) dust was emitted from a single point.Legends of the panels show the input parameters: The initial velocity (vd) ortemperature (Td) of a dust particle and its mass (md). In all cases the charge of thedust particle was þ350 e. The densities in panels (a), (b), (c) and (d) are snapshotsat 6000 s, 7500 s, 7500 s and 7500 s after the continuous emission was started,respectively. In the plots the Sun is on the right.
2.3.2.1. Asteroid RQ36. The first analysed object is the asteroidRQ36. Fig. 6 shows the simulated normalized 3D dust densitieswhen the roles of the initial velocity and the mass of a dust
E. Kallio et al. / Planetary and Space Science 120 (2016) 56–69 63
particle as well as the dust emission site were studied. In all casesin Fig. 6 the surface potential was assumed to be zero to study laterits role. The charge of the dust particle was þ350 e. The four runs,their basic input parameters and the main characteristic featuresof the solution are the following:
1. Run RQ36-1 (Fig. 6a)
No surface charging. Dust particles are emitted homo-geneously through the entire surface of an object mimicking thesituation when the asteroid is within large homogeneous andisotropic micrometeoroid cloud. The mass and the charge of adust particle were 3.7�109 amu and þ350 e, respectively. Theinitial bulk velocity in the Maxwellian velocity distributionfunction of the dust particles was zero but they had a non-zerotemperature of 300 K which corresponds to the thermal speedof about 0.03 m/s (¼
ffiffiffiffiffiffiffiffiffiffiffiffiffiffiffiffiffiffiffiffiffiffikBT=mdust
p). Dust particles are bound to
the surface and do not escape from the asteroid where theescape velocity is 0.2 m/s.
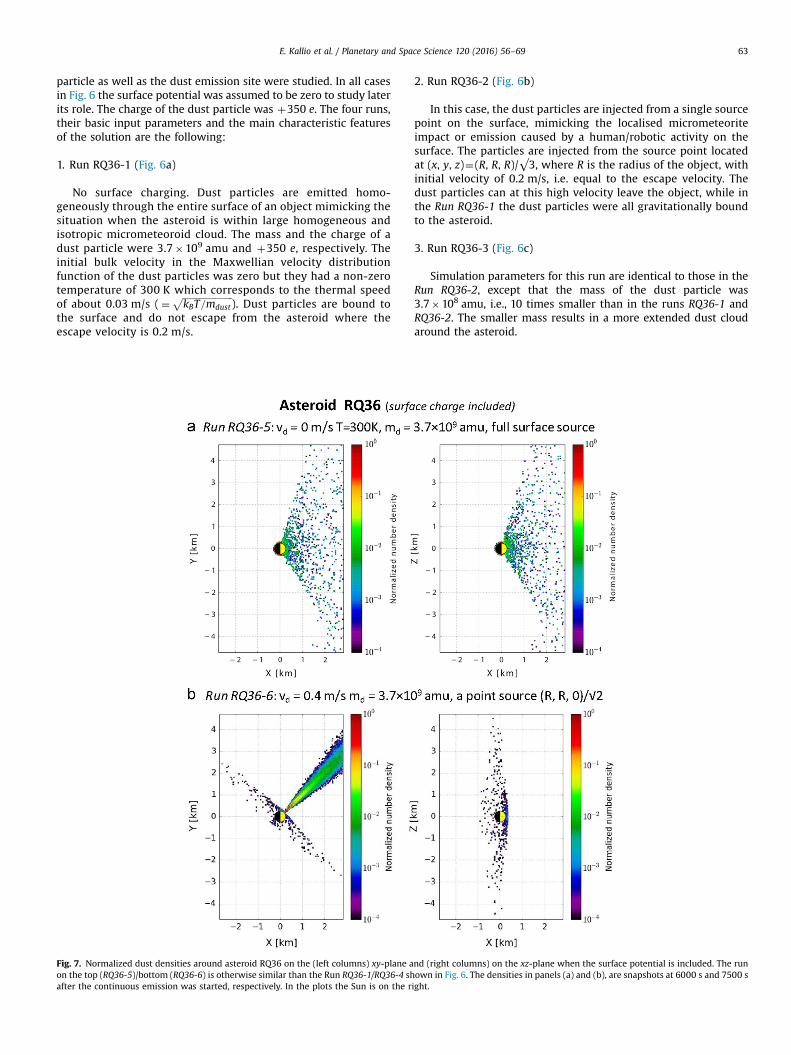
Fig. 7. Normalized dust densities around asteroid RQ36 on the (left columns) xy-plane aon the top (RQ36-5)/bottom (RQ36-6) is otherwise similar than the Run RQ36-1/RQ36-4 shafter the continuous emission was started, respectively. In the plots the Sun is on the r
2. Run RQ36-2 (Fig. 6b)
In this case, the dust particles are injected from a single sourcepoint on the surface, mimicking the localised micrometeoriteimpact or emission caused by a human/robotic activity on thesurface. The particles are injected from the source point locatedat (x, y, z)¼(R, R, R)/√3, where R is the radius of the object, withinitial velocity of 0.2 m/s, i.e. equal to the escape velocity. Thedust particles can at this high velocity leave the object, while inthe Run RQ36-1 the dust particles were all gravitationally boundto the asteroid.
3. Run RQ36-3 (Fig. 6c)
Simulation parameters for this run are identical to those in theRun RQ36-2, except that the mass of the dust particle was3.7�108 amu, i.e., 10 times smaller than in the runs RQ36-1 andRQ36-2. The smaller mass results in a more extended dust cloudaround the asteroid.
nd (right columns) on the xz-plane when the surface potential is included. The runown in Fig. 6. The densities in panels (a) and (b), are snapshots at 6000 s and 7500 sight.

Fig. 8. Normalized dust densities around Martian moon Phobos on the (left columns) xy-plane and on the (right columns) xz-plane at four MC model runs. In panels(a) and (b) there is no surface charging but in panels (c) and (d) the surface charging is added. Dust was emitted from the full surface in panels (a) and (c) and(d) while the panel (b) shows the point source situation. The densities in panels (a), (b), (c) and (d) are snapshots at 10,000 s, 7500 s, 10,000 s and 40,000 s after thecontinuous emission was started, respectively. In the plots the Sun is on the right.
E. Kallio et al. / Planetary and Space Science 120 (2016) 56–6964
E. Kallio et al. / Planetary and Space Science 120 (2016) 56–69 65
4. Run RQ36-4 (Fig. 6d)
In this run, the dust particles are released from a single point that islocated in the 2D xy-plane at SZA¼45° i.e. at (x, y, z)¼(R, R, 0)/√2. Theinitial velocity for the dust particles in this simulationwas increased to0.4 m/s, i.e., to larger values than the escape velocity.
The effects of the surface charge in asteroid RQ36 was studied inFig. 7. In this case, the inputs are similar to those in the two previousexamples with the difference that the surface charge from the PICmodel is included. The two new runs are the following.
5. Run RQ36-5 (Fig. 7a)
Simulation parameters for this run are similar to those in RunRQ36-1 except that the surface potential is now non-zero on thedayside. It can be seen that the surface potential charging has a con-siderable effect on dust motion near the asteroid, allowing dust par-ticles to escape from the dayside in the analysed case with initialparameters. Note that dust particles cannot escape from the nightsidebecause the surface potential in the model was zero there.
6. Run RQ36-6 (Fig. 7b)
In this example dust particles are released from a single sourcepoint on the surface which is on the xy-plane at SZA¼45°. Simu-lation parameters are similar to those in Run RQ36-4, except thatnow the surface charging is included. Similarly, as in the Run
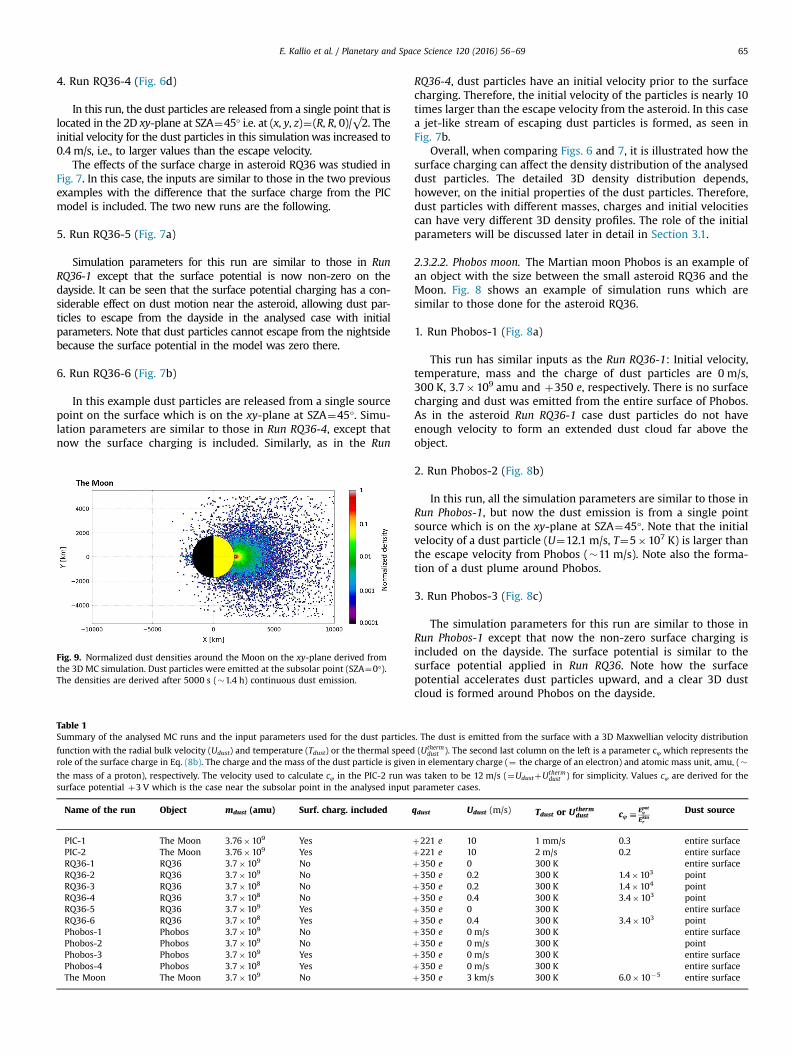
Fig. 9. Normalized dust densities around the Moon on the xy-plane derived fromthe 3D MC simulation. Dust particles were emitted at the subsolar point (SZA¼0°).The densities are derived after 5000 s (�1.4 h) continuous dust emission.
Table 1Summary of the analysed MC runs and the input parameters used for the dust particle
function with the radial bulk velocity (Udust) and temperature (Tdust) or the thermal speedrole of the surface charge in Eq. (8b). The charge and the mass of the dust particle is given
the mass of a proton), respectively. The velocity used to calculate cφ in the PIC-2 run wsurface potential þ3 V which is the case near the subsolar point in the analysed input
Name of the run Object mdust (amu) Surf. charg. included
PIC-1 The Moon 3.76�109 YesPIC-2 The Moon 3.76�109 YesRQ36-1 RQ36 3.7�109 NoRQ36-2 RQ36 3.7�109 NoRQ36-3 RQ36 3.7�108 NoRQ36-4 RQ36 3.7�108 NoRQ36-5 RQ36 3.7�109 YesRQ36-6 RQ36 3.7�108 YesPhobos-1 Phobos 3.7�109 NoPhobos-2 Phobos 3.7�109 NoPhobos-3 Phobos 3.7�109 YesPhobos-4 Phobos 3.7�108 YesThe Moon The Moon 3.7�109 No
RQ36-4, dust particles have an initial velocity prior to the surfacecharging. Therefore, the initial velocity of the particles is nearly 10times larger than the escape velocity from the asteroid. In this casea jet-like stream of escaping dust particles is formed, as seen inFig. 7b.
Overall, when comparing Figs. 6 and 7, it is illustrated how thesurface charging can affect the density distribution of the analyseddust particles. The detailed 3D density distribution depends,however, on the initial properties of the dust particles. Therefore,dust particles with different masses, charges and initial velocitiescan have very different 3D density profiles. The role of the initialparameters will be discussed later in detail in Section 3.1.
2.3.2.2. Phobos moon. The Martian moon Phobos is an example ofan object with the size between the small asteroid RQ36 and theMoon. Fig. 8 shows an example of simulation runs which aresimilar to those done for the asteroid RQ36.
1. Run Phobos-1 (Fig. 8a)
This run has similar inputs as the Run RQ36-1: Initial velocity,temperature, mass and the charge of dust particles are 0 m/s,300 K, 3.7�109 amu and þ350 e, respectively. There is no surfacecharging and dust was emitted from the entire surface of Phobos.As in the asteroid Run RQ36-1 case dust particles do not haveenough velocity to form an extended dust cloud far above theobject.
2. Run Phobos-2 (Fig. 8b)
In this run, all the simulation parameters are similar to those inRun Phobos-1, but now the dust emission is from a single pointsource which is on the xy-plane at SZA¼45°. Note that the initialvelocity of a dust particle (U¼12.1 m/s, T¼5�107 K) is larger thanthe escape velocity from Phobos (�11 m/s). Note also the forma-tion of a dust plume around Phobos.
3. Run Phobos-3 (Fig. 8c)
The simulation parameters for this run are similar to those inRun Phobos-1 except that now the non-zero surface charging isincluded on the dayside. The surface potential is similar to thesurface potential applied in Run RQ36. Note how the surfacepotential accelerates dust particles upward, and a clear 3D dustcloud is formed around Phobos on the dayside.
s. The dust is emitted from the surface with a 3D Maxwellian velocity distribution
(Uthermdust ). The second last column on the left is a parameter cφ which represents the
in elementary charge (¼ the charge of an electron) and atomic mass unit, amu, (�as taken to be 12 m/s (¼UdustþUtherm
dust ) for simplicity. Values cφ are derived for theparameter cases.
qdust Udust (m/s) Tdust or Uthermdust cφ � Epot
φ
Ekinr
Dust source
þ221 e 10 1 mm/s 0.3 entire surfaceþ221 e 10 2 m/s 0.2 entire surfaceþ350 e 0 300 K entire surfaceþ350 e 0.2 300 K 1.4�103 pointþ350 e 0.2 300 K 1.4�104 pointþ350 e 0.4 300 K 3.4�103 pointþ350 e 0 300 K entire surfaceþ350 e 0.4 300 K 3.4�103 pointþ350 e 0 m/s 300 K entire surfaceþ350 e 0 m/s 300 K pointþ350 e 0 m/s 300 K entire surfaceþ350 e 0 m/s 300 K entire surfaceþ350 e 3 km/s 300 K 6.0�10�5 entire surface
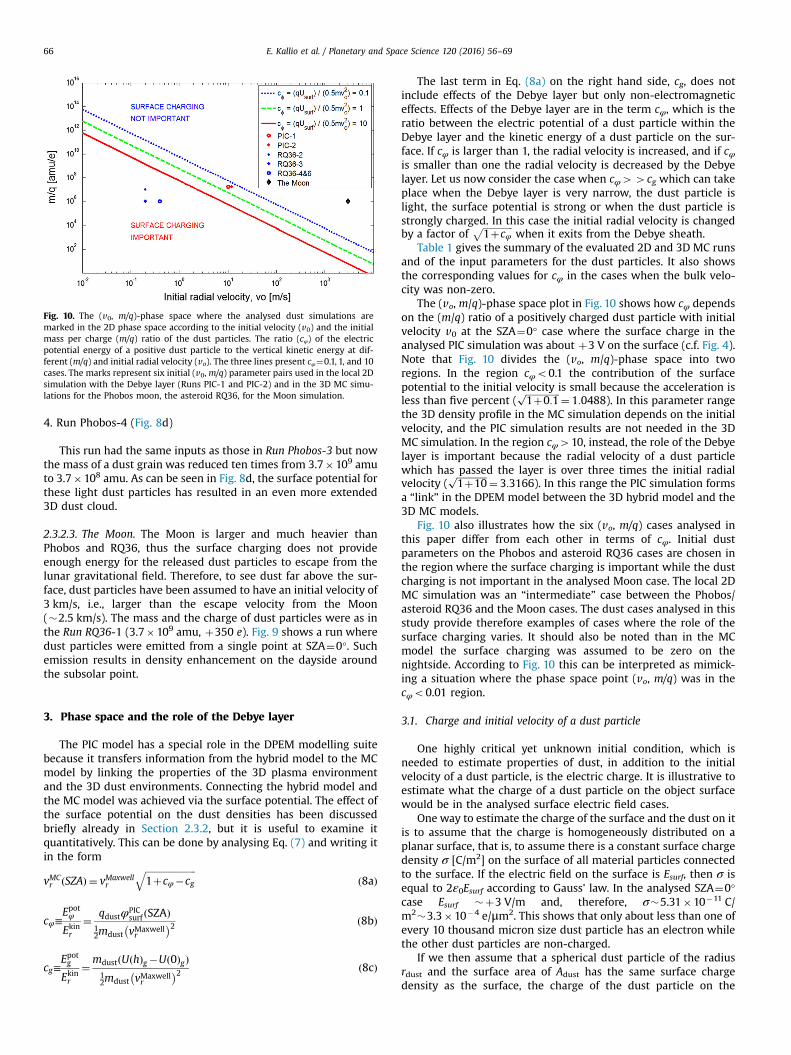
Fig. 10. The (v0, m/q)-phase space where the analysed dust simulations aremarked in the 2D phase space according to the initial velocity (v0) and the initialmass per charge (m/q) ratio of the dust particles. The ratio (cφ) of the electricpotential energy of a positive dust particle to the vertical kinetic energy at dif-ferent (m/q) and initial radial velocity (vo). The three lines present cφ¼0.1, 1, and 10cases. The marks represent six initial (v0,m/q) parameter pairs used in the local 2Dsimulation with the Debye layer (Runs PIC-1 and PIC-2) and in the 3D MC simu-lations for the Phobos moon, the asteroid RQ36, for the Moon simulation.
E. Kallio et al. / Planetary and Space Science 120 (2016) 56–6966
4. Run Phobos-4 (Fig. 8d)
This run had the same inputs as those in Run Phobos-3 but nowthe mass of a dust grain was reduced ten times from 3.7�109 amuto 3.7�108 amu. As can be seen in Fig. 8d, the surface potential forthese light dust particles has resulted in an even more extended3D dust cloud.
2.3.2.3. The Moon. The Moon is larger and much heavier thanPhobos and RQ36, thus the surface charging does not provideenough energy for the released dust particles to escape from thelunar gravitational field. Therefore, to see dust far above the sur-face, dust particles have been assumed to have an initial velocity of3 km/s, i.e., larger than the escape velocity from the Moon(�2.5 km/s). The mass and the charge of dust particles were as inthe Run RQ36-1 (3.7�109 amu, þ350 e). Fig. 9 shows a run wheredust particles were emitted from a single point at SZA¼0°. Suchemission results in density enhancement on the dayside aroundthe subsolar point.
3. Phase space and the role of the Debye layer
The PIC model has a special role in the DPEM modelling suitebecause it transfers information from the hybrid model to the MCmodel by linking the properties of the 3D plasma environmentand the 3D dust environments. Connecting the hybrid model andthe MC model was achieved via the surface potential. The effect ofthe surface potential on the dust densities has been discussedbriefly already in Section 2.3.2, but it is useful to examine itquantitatively. This can be done by analysing Eq. (7) and writing itin the form
vMCr SZAð Þ ¼ vMaxwell
r
ffiffiffiffiffiffiffiffiffiffiffiffiffiffiffiffiffiffiffiffiffiffi1þcφ�cg
qð8aÞ
cφ≡Epotφ
Ekinr
¼ qdustφPICsurf SZAð Þ
12mdust vMaxwell
r
� �2 ð8bÞ
cg≡Epotg
Ekinr
¼mdustðU hð Þg�U 0ð ÞgÞ12mdust vMaxwell
r
� �2 ð8cÞ
The last term in Eq. (8a) on the right hand side, cg, does notinclude effects of the Debye layer but only non-electromagneticeffects. Effects of the Debye layer are in the term cφ, which is theratio between the electric potential of a dust particle within theDebye layer and the kinetic energy of a dust particle on the sur-face. If cφ is larger than 1, the radial velocity is increased, and if cφis smaller than one the radial velocity is decreased by the Debyelayer. Let us now consider the case when cφ44cg which can takeplace when the Debye layer is very narrow, the dust particle islight, the surface potential is strong or when the dust particle isstrongly charged. In this case the initial radial velocity is changedby a factor of
ffiffiffiffiffiffiffiffiffiffiffiffiffi1þcφ
pwhen it exits from the Debye sheath.
Table 1 gives the summary of the evaluated 2D and 3D MC runsand of the input parameters for the dust particles. It also showsthe corresponding values for cφ in the cases when the bulk velo-city was non-zero.
The (vo, m/q)-phase space plot in Fig. 10 shows how cφ dependson the (m/q) ratio of a positively charged dust particle with initialvelocity v0 at the SZA¼0° case where the surface charge in theanalysed PIC simulation was about þ3 V on the surface (c.f. Fig. 4).Note that Fig. 10 divides the (vo, m/q)-phase space into tworegions. In the region cφo0.1 the contribution of the surfacepotential to the initial velocity is small because the acceleration isless than five percent (
ffiffiffiffiffiffiffiffiffiffiffiffiffiffiffi1þ0:1
p¼ 1:0488). In this parameter range
the 3D density profile in the MC simulation depends on the initialvelocity, and the PIC simulation results are not needed in the 3DMC simulation. In the region cφ410, instead, the role of the Debyelayer is important because the radial velocity of a dust particlewhich has passed the layer is over three times the initial radialvelocity (
ffiffiffiffiffiffiffiffiffiffiffiffiffi1þ10
p¼ 3:3166). In this range the PIC simulation forms
a “link” in the DPEM model between the 3D hybrid model and the3D MC models.
Fig. 10 also illustrates how the six (vo, m/q) cases analysed inthis paper differ from each other in terms of cφ. Initial dustparameters on the Phobos and asteroid RQ36 cases are chosen inthe region where the surface charging is important while the dustcharging is not important in the analysed Moon case. The local 2DMC simulation was an “intermediate” case between the Phobos/asteroid RQ36 and the Moon cases. The dust cases analysed in thisstudy provide therefore examples of cases where the role of thesurface charging varies. It should also be noted than in the MCmodel the surface charging was assumed to be zero on thenightside. According to Fig. 10 this can be interpreted as mimick-ing a situation where the phase space point (vo, m/q) was in thecφo0.01 region.
3.1. Charge and initial velocity of a dust particle
One highly critical yet unknown initial condition, which isneeded to estimate properties of dust, in addition to the initialvelocity of a dust particle, is the electric charge. It is illustrative toestimate what the charge of a dust particle on the object surfacewould be in the analysed surface electric field cases.
One way to estimate the charge of the surface and the dust on itis to assume that the charge is homogeneously distributed on aplanar surface, that is, to assume there is a constant surface chargedensity σ [C/m2] on the surface of all material particles connectedto the surface. If the electric field on the surface is Esurf, then σ isequal to 2ε0Esurf according to Gauss' law. In the analysed SZA¼0°case Esurf �þ3 V/m and, therefore, σ�5.31�10�11 C/m2�3.3�10�4 e/μm2. This shows that only about less than one ofevery 10 thousand micron size dust particle has an electron whilethe other dust particles are non-charged.
If we then assume that a spherical dust particle of the radiusrdust and the surface area of Adust has the same surface chargedensity as the surface, the charge of the dust particle on the
E. Kallio et al. / Planetary and Space Science 120 (2016) 56–69 67
surface is
qdust e½ � ¼ Adustσ ¼ 4πr2dustσ � 0:0042r2dust ½mm� ð9Þhere the electric charge is given in the unit of the elementary
charge e and the radius is given in μm. As Eq. (9) indicates, thecharge of a micron size dust particle is very small in the analysedcases. For example, the radius of a dust particle has to be about15 μm for the dust particle to carry the charge of an electron, andabout 150 μm to have a charge of 100 electrons, which is in theorder of the charge of a dust particle analysed in the paper. Such aparticle would be very large and, consequently, very heavy. Forexample, if we assume a spherical dust particle with a massdensity, ρmass
dust , of 3 g cm�3 the mass of a 1e particle would be�3�1016 amu and for a 100e particle would be �3�1019. Thismeans that the mdust/qdust ratio of a 1e and a 100e dust particlewould be �3�1016 amu/e and �3�1017 amu/e, respectively.These high mass values are outside the range in Fig. 10 and belongto the region where the Debye layer is not important.
This analysis suggests that if the surface is made of equal sizespherical charged particles with size one micron or less, most ofthe dust particles would have zero charge. A more accurate esti-mation should take into account non-spherical shaped dust par-ticles. A sphere is a geometrical shape where the surface area/volume ratio is in its minimum. Therefore, the mass of a non-spherical particle associated with the Adust is smaller than for aspherical particle. It is, however, unlikely that a non-spherical“fluffy” shape of a particle could decrease the mass per chargeratio many orders of magnitude.
Therefore, some other more effective dust charging mechanismthan photoemission by EUV is needed to result in dust chargesanalysed in this paper if we assume a homogeneously distributedelectric charge on a planar surface. Other surface charging sourcescould be X-rays (Manka, 1973) or micrometeoroid impact ionisa-tion (e.g. Collette et al., 2014). Secondary electrons also result insurface charging and their role has been studied widely, forexample, when spacecraft charging has been analysed (e.g. Pavlŭet al. 2014). Laboratory measurements have shown that dust par-ticles are mobilised and transported on the surface near regions ofdiffering secondary electron yields due to either their character-istic compositions or surface roughness, and that a few kV/melectric field can be formed near the surface (Wang et al., 2010).However, it is not clear how well the laboratory measurements canmimic real situations on the lunar surface and the complex sur-face/structure of the dust particles. Moreover, the question of howlarge the charge of a dust particle can be and what mechanismcould lift dust particles from the surface is unknown.
The phase space shown in Fig. 10 illustrates the parameterrange where the surface charging can have global effects on dustdensities, i.e., when surface charging has substantial effects on thevelocity of a dust particle after it has escaped from the Debye layer.However, it is also informative to analyse local effects, that is, asituation when the initial velocity of a dust particle is large enoughto affect its motion within the Debye layer. It is interesting toconsider how small a dust particle on a surface can be so that afteremission of the minimum amount of electric charge, i.e., onephotoelectron, it would have such a small m/q ratio that the sur-face potential would be important. If we assume again that themass density of a spherical dust particle is 3 g cm�3, the radius ofa particle which has emitted one photoelectron and which m/qratio is 1�1011 amu/e, 1�1010 amu/e, 1�109 amu/e and1�108 amu/e is �0.2 μm, �0.1 μm, �0.05 μm, and �0.02 μm,respectively. According to Fig. 10 those particles are close to thecφ¼1 line if their initial radial velocity is of the order of �0.06 km/s, �0.3 km/s, �0.8 km/s, �3 km/s, respectively. This implies thatfor a dust particle of radius, say, �0.02 μm the initial velocitybecomes locally important if it is of the order of 1 km/s, as
demonstrated in 1D PIC simulations which showed that themaximum velocity of a levitating 0.02 μm dust particle is only fewm/s (see Poppe and Horànyi, 2010, Figure 11). However, it is notknown how a dust particle could have an initial velocity of theorder of km/s.
4. Discussion
This study describes the new unified DPEM modelling suite ofthree integrated kinetic models that enables local and globalanalysis of dust and plasma near an airless planetary object. The3D hybrid model uses a hybrid modelling package built on thepublicly available FLASH code (http://flash.uchicago.edu/site/flashcode/), which has already been used to study the Moon–solarwind interaction (Holmström et al., 2012). The 3D MC model wasalso built around the FLASH code, and it uses a new dust softwarepackage developed for the DPEM model. The PIC model is a newcode utilising the HYB software platform, which included initiallya hybrid model (e.g. Kallio, 2005, and references therein), a 3Delectromagnetic model, and then a 1D electrostatic model.Recently, the developed 2D PIC model has been extended to modelalso a non-planar surface (Dyadechkin et al., 2015).
The DPEM model provides a tool to analyse many aspectsassociated with the plasma and dust near the surface of an airlessbody, such as 1) the properties of plasma near the surface based ona 3D kinetic model (hybrid model), 2) to study electric potentialand the dust density profiles within and near the surface (PICmodel) and, finally, 3) to obtain 3D dust density profiles. Theanalyses imply that properties of the lifted dust strongly affect thedust densities locally and globally depending on the mass, chargeand initial velocity of the dust.
Although the DPEM model links three individual models whichare dedicated to analysing different plasma processes and plasmaphenomena, the modelling suite can be regarded as the first steptowards a real unified model for studying the dust environment ofairless bodies. The one direction connection between the modelsHybrid-PIC-MC (c.f. Fig. 1) manifests the challenge of the phy-sical processes in a wide range of space and time scales. The fastestprocesses in the modelling suite are the electron plasma frequency(�9 √ne(cm�3) kHz) and the smallest space scale is the Debyelength (�69√Te(K)/ne(m�3) m) that are considered in the PICmodel. Therefore, for example, in the PIC model the time step inthe simulation, the running time, and the grid size were5�10�8 s, 2 ms and 0.25 m, respectively. These values were muchsmaller than those used in the MC model which considered theslowly moving dust particles in a 3D space. For example, in Figs. 6–9 the running time of the simulation was thousands of seconds.
Because of the highly different time and space scales in thethree DPEM models, dust particles did not affect the properties ofplasma in the PIC or hybrid model. In a completely unified model,instead, the link in a dusty-plasma model should be two way(Hybrid2PIC2MC). For example, dust particles can be a sourceof electrons, the so called dust electrons (e.g. Stubbs et al., 2011),which in turn affect the electron density and electron distributionfunction. A self-consistent model should include this effect intothe PIC model. Moreover, the charge of a dust particle above thesurface varies in time and it depends on the nearby plasma (seee.g. Nitter et al., 1998) while the charge of a dust particle was keptconstant in the 2D PIC simulation (c.f. Fig. 5) and in the 3D MCsimulations (c.f. Figs. 6–9) for simplicity. It is however a verychallenging task to model the whole system fully self-consistentlywith present computational resources.
The nightside region was also modelled in a simpler manner byusing a zero surface potential. This approach was chosen becausethe hybrid model does not give accurate plasma parameters near

E. Kallio et al. / Planetary and Space Science 120 (2016) 56–6968
the surface by or at midnight. It can be envisioned that a morerealistic 3D dust distribution could be obtained when the PICmodel uses, for example, observations or some other models. Inaddition, 2D landscapes can affect the electric potential and theyshould be included into the PIC model (see e.g. Zimmerman et al.,2011). Lunar magnetic anomalies also affect the properties of theprecipitating solar wind protons and the electric potential near thesurface (see, e.g. hybrid modelling by Jarvinen et al., 2014). In thefuture, such magnetic field regions could be simulated with theDPEM model by combining the 3D hybrid model which simulatesmagnetic anomaly globally and a local PIC simulation which giveselectric potential within the Debye layer.
It should also be mentioned, that although the hybrid model inthe DPEM suite enables to derive detailed knowledge of theproperties of the solar wind protons near the terminator regionand then used in the PIC simulation, in the analysed cases thedetailed 3D velocity distribution information was not used in thePIC model. The reasons for this choice is based on the relativelysmall level of disturbance observed (c.f. Fig. 3). However, if thegoal of the study would have been to analyse local property of thedust near the terminator region, for example, near the lunar polarregions, then the detailed velocity distribution function obtainedfrom the hybrid model would have been highly important. Itwould also be interesting to test how the properties of the plasmadiffer near the terminator region at different solar wind conditionsand, for example, when the Moon is in the Earth's magnetosphereor when Phobos is in the induced Martian magnetosphere.Moreover, the hybrid model can also simulate cases when thesolar wind plasma is non-Maxwellian. Such studies are, however,beyond the scope of the present work.
To interpret the results obtained in this study, it is important tobear in mind that the DPEM modelling suite does not model theinitial dust particle injection from the surface of the planetarybody. In other words, the DPEM model does not include infor-mation of how many dust particles are emitted at various places inthe (v0, m/q)-phase space shown in Fig. 10. Therefore, the DPEMmodelling suite cannot provide absolute dust density profileswithout inclusion of an additional dust lifting modelling, based onthe laboratory measurements of hypervelocity impacts, forexample (see e.g. Frisch, 1992; Eichhorn and Eberhar, 1993; Langeand Ahrens, 1987), or dust lifting models based on the first phy-sical principles of the forces affecting dust particles on the surfaceof an airless body (see e.g. Hartzell and Scheeres, 2011; Hartzell,2012). For example, as can be seen in Fig. 10, the initial parametersof dust particles injected from the surface of RQ36 (Figs. 6–7) andPhobos (Fig. 8) were chosen in the phase space so that the surfaceelectric potential has a significant contribution to the densityof dust.
Modelling is also complicated due to the fact that the shapeand surface area of the dust particles are highly irregular andrelatively large, respectively (e.g. Liu et al., 2008 and Liu andTaylor, 2011). To be able to include these input parameters wouldbe crucial to obtain a realistic 3D dust density profile. Therefore,more theoretical studies and laboratory measurements are calledfor to characterise more precisely the properties of lifted dustparticles and the potential variability due to different bulk che-mical composition. Moreover, different lunar missions and differ-ent observations have provided contradictory results about theproperties of dust around the Moon (see e.g. Feldman et al., 2014)and, therefore, more dedicated remote sensing and in situ dustobservations are needed. This will help in further understandingthe interaction of the charged particles and the potential “dan-gling” surface bonds (free radicals) with the exterior and interiorof the human body (e.g. Fubini and Hubbard, 2003; and Hurowitzet al., 2007) and technical instrumentation used on the lunarsurface. This will enable a better understanding of the potential
toxicity of the lifted dust particles and respective hazards tohuman health. Moreover, the improvements in models can alsohelp to better protect scientific and technical instrumentationused on the lunar surface.
5. Summary
A new tool called the DPEM modelling suite has been devel-oped to study dust environments of airless objects. This unifiedkinetic model was used to study three different planetary objectsizes (the Moon, the Martian moon Phobos and the asteroidRQ36). The phase space analysis revealed regions in the initialvelocity-the mass-to-charge ratio phase space where the densityof the dust particles was affected strongly by the electric fieldwithin the Debye layer. The study also showed how the 3D densitydistribution of such dust particles is affected by the Debye layer.Overall, the initial results presented in this paper suggested thatwhen a realistic dust emission model is available, the unifiedDPEM modelling suite provides a powerful tool to study the dustenvironments of airless bodies such as moons, Mercury, asteroidsand non-active comets far from the Sun.
Acknowledgements
The authors acknowledge the ESA GSP programme projectDPEM, Dusty plasma environments: near-surface characterizationand modelling (ESA ITT, AO-1-6696/11/NL/CO) for the financialsupport for the work. The authors thank Fabrice Cipriani/ESTEC/ESA for the discussions about dusty plasma. Authors would like toacknowledge Dr. D. Kent Ross (NASA-JSC) for proofreading themanuscript and for useful comments and remarks. EK thanks Dr.Cyril Simon Wedlund, Aalto University, for useful suggestionsabout the manuscript. VAF acknowledges financial support by theDFG-Eigenestelle FE 1523/3-1. Figs. 2, 6, 7, 8 and 9 are made by theVisIt visualisation tool. This work was in part conducted usingresources provided by the Swedish National Infrastructure forComputing (SNIC) at the High Performance Computing CenterNorth (HPC2N), Umeå University, Sweden. The software used inthis work was in part developed by the DOE NNSA-ASC OASCRFLASH Center at the University of Chicago.
References
Cain, J.R., 2010. Lunar dust: the hazard and astronaut exposure risks. Earth MoonPlanets 107, 107–125.
Collette, A., Grün, E., Malaspina, D., Sternovsky, Z., 2014. Micrometeoroid impact-charge yield for common spacecraft materials. J. Geophys. Res. 119, 6019–6026.http://dx.doi.org/10.1002/2014JA020042.
Dyadechkin, S., Kallio, E., Wurz, P., 2015. New fully kinetic model for the study ofelectric potential, plasma, and dust above lunar landscapes. J. Geophys. Res.Space Phys. 120 (3), 1589–1606. http://dx.doi.org/10.1002/2014JA020511.
Eichhorn, K., Eberhar, G., 1993. High-velocity impacts of dust particles in low-temperature water ice. Planet. Space Sci. 41 (6), 429–433. http://dx.doi.org/10.1016/0032-0633(93)90002-J.
Farrell, W.M., Stubbs, T.J., Vondrak, R.R., Delory, G.T., Halekas, J.S., 2007. Complexelectric fields near the lunar terminator: the near-surface wake and accelerateddust. Geophys. Res. Lett. 34, L14201.
Feldman, P.D., Glenar, D.A., Stubbs, T.J., Retherford., K.D., Gladstone, R., Miles, P.F.,Greathouse, T.K., Kaufmann, D.E., Wm., J., Parker, S.A., 2014. Upper limits for alunar dust exosphere from far-ultraviolet spectroscopy by LRO/LAMP. Icarus233, 106–113.
Frisch, W., 1992. Hypervelocity impact experiments with water ice targets. In:McDonnell., J.A.M. (Ed.), Hypervelocity Impacts in Space. Unit for Space Sci-ences, University of Kent, pp. 7–14.
Fubini, B., Hubbard, A., 2003. Serial review: role of reactive oxygen and nitrogenspecies (ROS/RNS) in lung injury and diseases. Free Radic. Biol. Med. 34,1507–1516.
E. Kallio et al. / Planetary and Space Science 120 (2016) 56–69 69
Holmström, M., Fatemi, S., Futtana, Y., Nilsson, H., 2012. The interaction betweenthe Moon and the solar wind, Earth, planets and space, 64, pp. 237–245 ⟨http://dx.doi.org/10.5047/eps.2011.06.040⟩.
Hartzell, C.M., Scheeres, D.J., 2011. The role of cohesive forces in particle launchingon the Moon and asteroids. Planet. Space Sci. 59, 1758–1768.
Hartzell, C., 2012. The Dynamics of Near-Surface Dust on Airless Bodies (Ph.D.Thesis). University of Colorado.
Hurowitz, J.A., Tosca, N.J., McLennan, S.M., Schoonen, M.A.A., 2007. Production ofhydrogen peroxide in Martian and lunar soils. Earth Planet. Sci. Lett. 255,41–52.
Jarvinen, R., Alho, M., Kallio, E., Wurz, P., Barabash, S., Futaana, Y., 2014. On verticalelectric fields at lunar magnetic anomalies. Geophys. Res. Lett. 41, 2243–2249.http://dx.doi.org/10.1002/2014GL059788.
Jordan, A.P., Stubbs, T.J., Wilson, J.K., Schwadron, N.A., Spence, H.E., 2015. Dielectricbreakdown weathering of the Moon's polar regolith. J. Geophys. Res. Planets120, 210–225. http://dx.doi.org/10.1002/2014JE004710.
Kallio, E., Luhmann, J.G., Barabash, S., 1997. Charge exchange near Mars: the solarwind absorption and neutral atom production. J. Geophys. Res. 102,22183–22197.
Kallio, E., 2005. Formation of the lunar wake in quasi-neutral hybrid model. Geo-phys. Res. Lett. 32, L06107.
Kallio, E., Jarvinen, R., Dyadechkin, S., Wurz, P., Barabash, S., Alvarez, F., Fernandes,V., Futaana, Y., Heilimo, J., Lue, C., Makela, J., Porjo, N., Schmidt, W., Siili, T., 2012.Kinetic simulations of finite gyroradius effects in the lunar plasma environmenton global, meso, and microscales. Planet. Space Sci. 74 (1), 146–155.
Kallio, E., Facskó, G., 2015. Properties of plasma near the Moon in the magnetotail.Planet. Space Sci. 115, 69–76. http://dx.doi.org/10.1016/j.pss.2014.11.007.
Lange, M.A., Ahrens, T.J., 1987. Impact experiments in low-temperature ice. Icarus69 (3), 506–518. http://dx.doi.org/10.1016/0019-1035(87)90020-0.
Linnarsson, D., Carpenter, J., Fubini, B., Gerde, P., Karlsson, L.L., Loftus, D.J., Prisk, G.K., Staufer, U., Tranfield, E.M., van Westrenen, W., 2012. Toxicity of lunar dust.Planet. Space Sci. 74, 57–71.
Liu, Y., Taylor, T.A., 2011. Characterization of lunar dust and a synopsis of availablelunar simulants. Plan. Space Sci. 59, 1769–1783.
Liu, Y., Park, J.S., Schnare, D., Hill, E., Taylor, L.A., 2008. Characterization of lunar dustfor toxicological studies: Part 2-morphology and physical characteristics. J.Aerosp. Eng. 21, 272–279.
Manka, R.H., 1973. Plasma and potential at the lunar surface. In: Grard, R.J.L. (Ed.),Photon and Particle Interactions with Surfacesin Surface. D. Reidel PublishingCo., Dordrecht, Holland, pp. 347–361.
Murphy, D.L., Vondrak, R.R., 1993. Effects of levitated dust on astronomical obser-vations from the lunar surface. In: Proceedings of the 24th Lunar PlanetaryScience Conference, pp. 1033–1034.
Nitter, T., Havnes, O., Melandso, F., 1998. Levitation and dynamics of charged dust inthe photoelectron sheath above surface in space. J. Geophys. Res. 103 (A4),6605–6620.
Pavlŭ, J., Beránek, M., Vaverka, J., Šafránková, J., Nemeććek, Z., Richterová, I., 2014.Secondary electron emission from Martian soil simulant. J. Geophys. Res. Pla-nets 119, 199–209. http://dx.doi.org/10.1002/2013JE004522.
Poppe, A., Horànyi, M., 2010. Simulations of the photoelectron sheath and dustlevitation on the lunar surface. J. Geophys. Res. 115, A08106. http://dx.doi.org/10.1029/2010JA015286.
Stubbs, T.J., Vondrak, R.R., Farrell, W.M., 2006. A dynamic fountain model for lunardust. Adv. Space Res. 37 (65), 59–66.
Stubbs, T.J., Glenar, D.A., Farrell, W.M., Vondrak, R.R., Collier, M.R., Halekas, J.S.,Delory, G.T., 2011. On the role of dust in the lunar ionosphere. Planet. Space Sci.59 (13), 1659–1664.
Wang, X., Horànyi, M., Robertson, S., 2010. Investigation of dust transport on thelunar surface in a laboratory plasma with an electron beam. J. Geophys. Res. 115(A11102), 1–6.
Willis, R.F., Anderegg, M., Feuerbacher, B., Fitton, B., 1973. Photoemission and sec-ondary electron emission from lunar surface material. In: Grard, R.J.L. (Ed.),Photon and Particle Interactions With Surfaces in Space. Springer, New York,pp. 369–387.
Zimmerman, M.I., Farrell, W.M., Stubbs, T.J., Halekas, J.S., Jackson, T.L., 2011. Solarwind access to lunar polar craters: feedback between surface charging andplasma expansion. Geophys. Res. Lett. 38, L19202. http://dx.doi.org/10.1029/2011GL048880.