durham shared maths project - education endowment · pdf fileeducation endowment foundation...
TRANSCRIPT
Educat ion Endowment Foundat ion
Durham Shared Maths ProjectEvaluation report and Executive summaryJuly 2015
Independent evaluators:Cheryl Lloyd, Triin Edovald, Stephen Morris, Zsolt Kiss, Amy Skipp, Sarah Haywood (NatCen Social Research)

The Education Endowment Foundation (EEF)
The Education Endowment Foundation (EEF) is an independent grant-making charity dedicated to breaking the link between family income and educational achievement, ensuring that children from all backgrounds can fulfil their potential and make the most of their talents.
The EEF aims to raise the attainment of children facing disadvantage by:
• Identifying promising educational innovations that address the needs of disadvantaged children in primary and secondary schools in England;
• Evaluating these innovations to extend and secure the evidence on what works and can be made to work at scale;
• Encouraging schools, government, charities, and others to apply evidence and adopt innovations found to be effective.
The EEF was established in 2011 by the Sutton Trust, as lead charity in partnership with Impetus Trust (now part of Impetus-The Private Equity Foundation) and received a founding £125m grant from the Department for Education.
Together, the EEF and Sutton Trust are the government-designated What Works Centre for improving education outcomes for school-aged children.
For more information about the EEF or this report please contact: Robbie Coleman Research and Communications Manager Education Endowment Foundation 9th Floor, Millbank Tower 21-24 Millbank SW1P 4QP p: 020 7802 1679 e: [email protected] w: www.educationendowmentfoundation.org.uk

Durham Shared Maths Project
Education Endowment Foundation 1
About the evaluator The project was independently evaluated by a team from NatCen Social Research. The impact evaluation was led by Cheryl Lloyd who was assisted by Triin Edovald, Stephen Morris, and Zsolt Kiss. The process evaluation was designed and overseen by Amy Skipp, with Sarah Haywood managing the qualitative strand of the project, assisted by Fay Sadro.
A team from the University of Bristol, led by Paul Clark managed the evaluation project through set up and randomisation for the trial.
NatCen would like to thank Emily Tanner, Eloise Poole and Gemma Lewis for their support and contribution to the project, as well as all the schools who gave up their time to participate in our interviews.
Contact details: Emily Tanner Head of Children, Families & Work NatCen Social Research 35 Northampton Square London Tel: 0207 549 8580 Email: [email protected]

Durham Shared Maths Project
Education Endowment Foundation 2
Contents
Executive summary ................................................................................................... 3
Introduction ............................................................................................................... 5
Methodology .............................................................................................................. 9
Impact evaluation .................................................................................................... 21
Process evaluation.................................................................................................. 37
Conclusion ............................................................................................................... 49
References ............................................................................................................... 52
Appendix A: Parent information sheet .................................................................. 53
Appendix B: Parent opt-out letter .......................................................................... 54
Appendix C: Main analysis of primary outcome................................................... 55
Appendix D: Subgroup analysis of primary outcome .......................................... 57
Appendix E: Analysis of secondary outcome: Attitudes towards school .......... 69
Appendix F: Analysis of secondary outcome: Attitudes towards reading ........ 75
Appendix G: Analysis of secondary outcome: Attitudes towards maths .......... 81
Appendix H: Security classification of trial findings ............................................ 87
Appendix I: Cost rating ........................................................................................... 88

Durham Shared Maths Project
Education Endowment Foundation 3
Executive summary
Shared Maths is a form of cross-age peer tutoring, developed at Durham University, where older pupils (Year 5/Year 6) work with younger pupils (Year 3/Year 4) to discuss and work through maths problems using a structured approach. The intervention structures interactions between the two pupils to enable the younger pupils (the tutee) to find solutions to maths problems. The older pupils (the tutor) use strategies such as questioning, thinking out loud, praise, and reviewing strategies to gain a deeper understanding of mathematics.
The intervention was delivered by teachers, with training and support from a Local Co-ordinator in each of four participating local authorities (Leeds, Medway, Durham and Worcester). Participating pupils spent 20 minutes each week using the approach, for two blocks of 16 weeks over consecutive years.
An effectiveness trial assessed the impact of the project on the progress in terms of mathematics of 6,472 pupils (3,305 in Year 3 and 3,167 in Year 5) in 82 primary schools across four local authorities with 40 schools randomly allocated to receive the programme and 42 schools allocated to the control condition. The control schools received the intervention after the intervention schools had completed the project.
Key Conclusions 1. This evaluation does not provide any evidence that the Durham Shared Maths programme
had an impact on attainment in maths, when used with Year 5 and 3 pupils. 2. There is no quantitative evidence of any impact on the attitudes towards school, reading and
maths for both Year 3 and Year 5 pupils who participated in the Shared Maths programme. 3. The process evaluation revealed teachers’ views that pupils with EAL, SEN and lower ability
were particularly struggling with the intervention. Teachers did not feel well equipped to support these pupils in accessing the intervention.
4. Teachers reported a number of wider perceived benefits from using Shared Maths - such as improvements in confidence in maths, approaches to problem-solving and social skills. These benefits may in time help support improvements in learning, and transfer to other lessons, although further work is needed here.
5. Given the concerns expressed by teachers about lower ability pupils finding adherence to the programme challenging, Shared Maths could benefit from further tailoring of the content and delivery to be better suited for pupils with different abilities prior to further testing.
What impact did it have?
There is no evidence from this evaluation that the Durham Shared Maths intervention had an impact on the maths attainment (primary outcome) of participating pupils, as well as on attitudes towards school, maths and reading (secondary outcomes) of participating pupils, measured using Interactive Computerised Assessment System (InCAS) scores, compared to those in the control group.
Interviews with participating teachers and the Shared Maths delivery team suggested that there were minor differences in the way the programme was implemented (for example the format and content of training for teachers and pupils) although such differences can be expected considering the scale and context of intervention delivery. Furthermore, it has to be noted that teachers had to fit the intervention to their existing schemes of work.
Although teachers perceived the programme to be benefitting pupils in terms of their confidence in maths, approaches to problem-solving and social skills, there were concerns about the accessibility of the intervention for lower ability pupils and pupils with English as an Additional Language (EAL) or Special Educational Needs (SEN).
Durham Shared Maths Project
Education Endowment Foundation 4
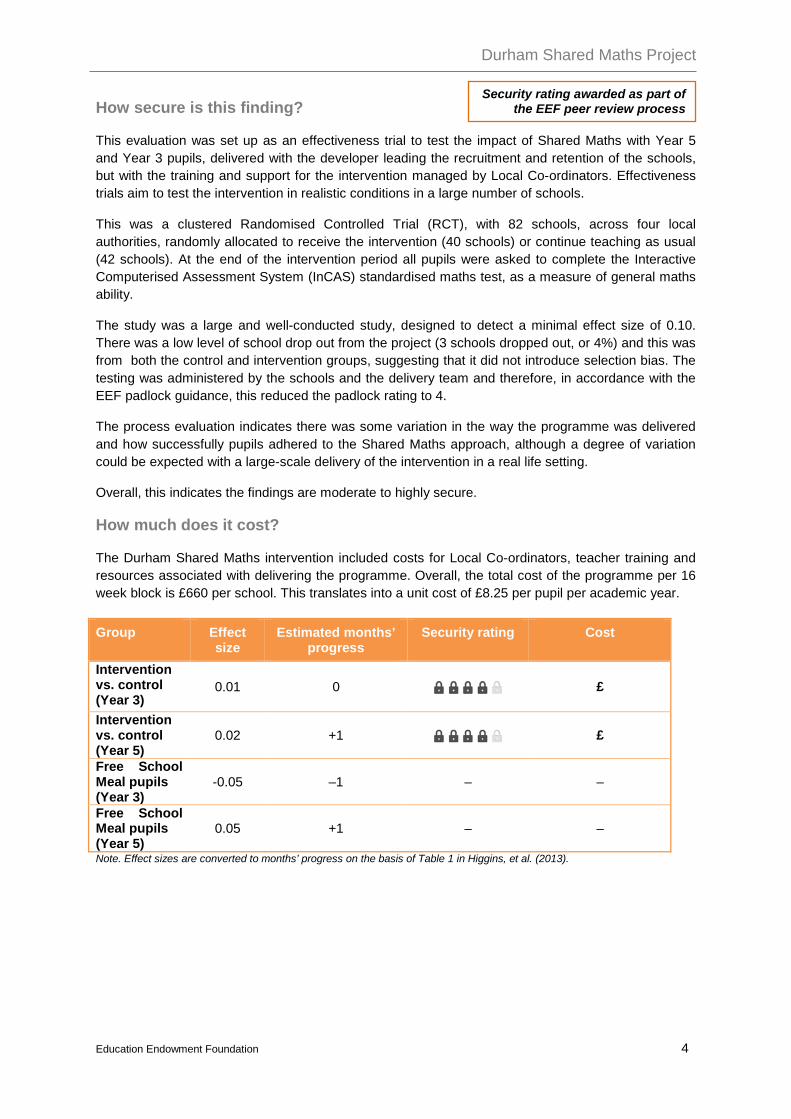
How secure is this finding?
This evaluation was set up as an effectiveness trial to test the impact of Shared Maths with Year 5 and Year 3 pupils, delivered with the developer leading the recruitment and retention of the schools, but with the training and support for the intervention managed by Local Co-ordinators. Effectiveness trials aim to test the intervention in realistic conditions in a large number of schools.
This was a clustered Randomised Controlled Trial (RCT), with 82 schools, across four local authorities, randomly allocated to receive the intervention (40 schools) or continue teaching as usual (42 schools). At the end of the intervention period all pupils were asked to complete the Interactive Computerised Assessment System (InCAS) standardised maths test, as a measure of general maths ability.
The study was a large and well-conducted study, designed to detect a minimal effect size of 0.10. There was a low level of school drop out from the project (3 schools dropped out, or 4%) and this was from both the control and intervention groups, suggesting that it did not introduce selection bias. The testing was administered by the schools and the delivery team and therefore, in accordance with the EEF padlock guidance, this reduced the padlock rating to 4.
The process evaluation indicates there was some variation in the way the programme was delivered and how successfully pupils adhered to the Shared Maths approach, although a degree of variation could be expected with a large-scale delivery of the intervention in a real life setting.
Overall, this indicates the findings are moderate to highly secure.
How much does it cost?
The Durham Shared Maths intervention included costs for Local Co-ordinators, teacher training and resources associated with delivering the programme. Overall, the total cost of the programme per 16 week block is £660 per school. This translates into a unit cost of £8.25 per pupil per academic year.
Note. Effect sizes are converted to months’ progress on the basis of Table 1 in Higgins, et al. (2013).
Group Effect size
Estimated months’ progress
Security rating Cost
Intervention vs. control (Year 3)
0.01 0 £
Intervention vs. control (Year 5)
0.02 +1 £
Free School Meal pupils (Year 3)
-0.05 –1 – –
Free School Meal pupils (Year 5)
0.05 +1 – –
Security rating awarded as part of the EEF peer review process

Durham Shared Maths Project
Education Endowment Foundation 5
Introduction
Durham Shared Maths is a cross-age peer tutoring pedagogy which seeks to improve maths learning for all children taking part. The intervention pairs older (Year 5/Year 6) pupils (tutors) with younger (Year 3/Year 4) pupils (tutees) to discuss and work through maths problems using a structured approach. The approach aims to help both ‘tutors’ and ‘tutees’ gain a clearer and deeper understanding of the maths problem and from that, the path to the solution. The intervention is delivered in the classroom and fits within the existing and ongoing maths teaching, rather than providing an alternative scheme of work.
The Shared Maths intervention is a modified version of the Duolog Maths tutoring model developed by Prof Keith Topping and tested at scale in the Fife Peer Learning Project in Scotland. This model requires the tutor to encourage the tutee to solve maths questions with high emphasis on developing metacognitive awareness of the processes and strategies being utilised (Topping, et al., 2004). The older pupils use strategies such as questioning, thinking out loud, praising and linking the questions to real life situations to help their tutee reach the answer and gain a deeper understanding of the maths problem. The method aims to highlight the different methods that can be employed when doing maths for both the tutee and tutor.
The Durham Project team behind the Shared Maths handbook, produced for the teachers taking part in this project, theorise that the Shared Maths process should be effective at raising maths attainment for both tutees and tutors. For tutees, the Shared Maths approach allows individuals to work through problems at their own level with the tutor prompting them to think more deeply about what the question is asking and about strategies for answering. The tutee receives immediate feedback and is able to seek help from a peer who is able to explain the process in a different way from the teacher. It also encourages the tutee to verbalise their thinking making them more aware of the processes they are using. Praise and feedback encouraged by the process help to build tutee’s confidence in maths. Tutors also benefit from the process as they need to understand and solve the questions ahead of the tutors and think of ways in which they can guide their tutee to a solution. This can help tutors to consolidate and build on previous learning and may also present them with new strategies not previously considered. The questioning skills developed through the intervention may also improve their own self-questioning and problem-solving behaviour. Being given a tutoring role also improves the confidence and self-concept of the tutors.
The intervention involves all pupils across Year 3 and Year 5 paired together (or occasional trios) on the basis of their relative maths ability in their classes.1 Shared Maths lessons take place for 20 minutes each week over two 16 week blocks, one in each academic year. The questions to be solved during the lessons are set by the Year 3 class teacher to be appropriate to the Year 3 pupil’s current maths work and level of ability. At the start of the intervention all pupils are trained by teachers in how to solve problems using the Shared Maths process and the pupils’ roles.
Schools from four local authorities took part in the trial; Worcestershire, Leeds, Durham and Medway. As this project is an effectiveness trial aiming to look at how the Shared Maths intervention could be delivered at scale, teachers were trained and supported in their implementation of Shared Maths by four independent local consultants recruited by the developer team (Shared Maths coordinators). Two of the consultants were employees of the local authorities and two were independent Maths consultants. The consultants received training from the developer team at the beginning of the project and attended additional training days through the project. The four consultants delivered training sessions for teachers involved (two sessions each year) and monitored Shared Maths practice
1 At the start of the Shared Maths programme pupils were in Years 3 and 5 and progressed to Years 4 and 6 respectively by the end of the programme, throughout this report pupils are referred to as in Years 3 and 5 only throughout the report.
Durham Shared Maths Project
Education Endowment Foundation 6
through visits to all schools to observe lessons and provide feedback to the school and the developer team (once a year). Teachers in participating schools received a detailed programme handbook which included classroom prompts and resources as well as access to the Shared Maths website with video examples of Shared Maths practice.
Background evidence
Many research studies have looked at the peer tutoring process and how effective it is at raising attainment as well as improving social and emotional outcomes. The results of these studies have been brought together by researchers in meta-analytic reviews which summarise findings from a variety of different sources. The evidence for peer tutoring tends to be positive, with reviews showing that peer tutoring is an effective technique for raising attainment in school-aged children, particularly with younger pupils across different subjects including maths, literacy and science – with tutoring in maths being particularly effective (Cohen, Kulik & Kulik, 1982; Rohrbeck, et al., 2003).
A recent meta-analytic review by the Washington State Institute for Public Policy (WSIPP) (Pennucci & Lemon, 2014) explored the effects of both cross-age and same-age/classwide peer tutoring.2 The results of respective meta-analytic reviews indicated that both types of programmes had a positive effect on participant test scores. However, the strength of the evidence was found to be stronger for same-age and classwide peer tutoring when compared cross-age peer tutoring in the WSIPP inventory of evidence- and research-based practices. The meta-analytic review on cross-age peer tutoring included only two relatively old studies (1980 and 1983) that included limited information on the demographic characteristics of the pupils (for further details on the criteria applied to included studies please see Pennucci & Lemon, 20143).
Looking at maths peer tutoring, reviews (e.g. Britz, Dixon & McLaughlin, 1989; Robinson, Schofield, & Steers-Wentzell, 2005) have identified that these interventions have been successful at raising pupil attainment and that providing training for pupils improved the effectiveness of the tutoring. However, a more recent report by the What Works Clearinghouse in the US identified one study of peer-assisted learning strategies that meets their evidence standards (2013). The report indicated that this tutoring programme was found to have no discernible effects on mathematics achievement for elementary school students in the US.
The EEF and Sutton Trust Pupil Premium Toolkit (Higgins, Katsipataki, Coleman et al., 2014) included a review of the effectiveness of different teaching and learning strategies and concluded that based on current evidence peer tutoring was a potentially effective approach to improved attainment for both the tutors – who have to think carefully about how to explain and solve the problem – and the tutees. It also concluded that the approach should be used to supplement or enhance normal teaching, rather than to replace it.
A recent large-scale efficacy trial in Fife (Tymms, et al., 2011) developed the peer tutoring approach in primary school maths and reading and found that cross-age tutoring was more effective than
2 In the two evaluations included in the meta-analysis of cross-age peer tutoring, the average cross-age peer tutoring programme provides 30 hours tutoring time and 7.5 hours of training time per class. In the evaluations included in the meta-analysis of same-age peer tutoring, pupils from the same classrooms provide academic assistance to struggling peers. Same-age tutoring assistance occurs through one-on-one interactions or in small groups, and in some instances, students alternate between the role of tutor and tutee. The same-age peer tutoring programmes included in the WSIPP’s meta-analysis provide, on average, 30 hours of peer tutoring time each year and about five hours of training time for teachers and students to learn programme procedures. 3 For combined meta-analytic results on class-wide peer tutoring, peer-assisted learning strategies and reciprocal peer tutoring by WSIPP please visit the following link: http://www.wsipp.wa.gov/BenefitCost/Program/107

Durham Shared Maths Project
Education Endowment Foundation 7
tutoring with age groups for maths. The study had some limitations, including participants and researchers not being blind to treatment allocation, loss of schools and pupils during the project, schools changing their intervention group and a differential loss to follow up among the older cohort. Despite these limitations, this is still a relatively robust study, demonstrating positive impacts of cross-age peer tutoring in mathematics when implemented in real world contexts, suggested that peer tutoring has promise when scaled up. This EEF effectiveness trial builds on this experience by delivering the programme to a large number of primary schools in four English local authorities to assess how effective it is at raising the attainment of disadvantaged pupils when implemented on a large scale and delivered by non-specialists in peer tutoring.
Evaluation objectives
The aim of the impact evaluation was to measure the impact of the Durham Shared Maths programme on the maths attainment and attitudes towards school, reading and maths of pupils receiving Shared Maths using InCAS (please see Outcomes section below for more information) by comparing their results to pupils from the control schools:
• in Year 3 (the tutees; outcomes measured in Year 4) • in Year 5 (the tutors; outcomes measured in Year 6) • those who are eligible for free school meals in both tutee and tutor year groups.
The aim of the process evaluation was to explore:
• Local Co-ordinators’ experiences of delivering training and supporting schools to implement the Shared Maths intervention
• Changes made by the intervention team after delivery to intervention schools was completed and delivery to control schools had not started
• The effect of these changes on programme delivery • Teachers’ views and experiences of implementing and delivering the Shared Maths
programme in their school • Teachers’ perceptions of the impact the programme had on their pupils, them and the wider
school.
Project teams
The project was run by the Durham Shared Maths Project team consisting of:
Andy Wiggins - Project Lead Vic Menzies - Intervention development and local coordinators training and support Clare Collyer – Project and trial administration Christine Merrell - Assessment Steve Higgins – Question / problem resources Keith Topping (Dundee University) – Peer Tutoring methodology Jeremy Hodgen (Kings / Nottingham university) – Maths pedagogy Allen Thurston (up to September 2012 – moved to Queen) – Intervention development Kirsty Younger (up to February 2014) – Project administration The independent intervention delivery team consisted of Jeanette Brocks, Nicola Stevenson, John Shute and Brian Hill.
The independent evaluation was set up by a team from the University of Bristol, led by Paul Clark who managed the project through set up and randomisation for the trial. For the remaining stages of the project a team from NatCen Social Research were the independent evaluators. The impact evaluation was led by Cheryl Lloyd who was assisted by Stephen Morris, Triin Edovald and Zsolt Kiss. The

Durham Shared Maths Project
Education Endowment Foundation 8
process evaluation was designed and overseen by Amy Skipp, with Sarah Haywood managing the qualitative strand of the project, assisted by Fay Sadro.
The Durham team carried out the adaption of the existing Fife Peer Tutoring model, this included adding resources for the English curriculum, tutee question selection, and local consultant training resources. They also recruited the participating schools and managed the trial (including outcome testing and data collection). The delivery team were responsible for the training and on-going monitoring and support of the teachers and schools. The evaluation team were responsible for the data analysis and telephone interviews with teachers, local consultants and Durham team.
Ethical review
Ethical approval was obtained by the Durham Shared Maths project team from the Board of Ethics in the School of Education at Durham University. This approval included the intervention development and delivery, the trial and assessment.
NatCen Social Research obtained ethical approval from its own ethics board for the evaluation, comprising the process evaluation and analysis of test results. This approval included the processes for the research team communicating with and carrying out interviews with school staff. For further details on parental consent procedures see Pupil eligibility and recruitment section below.

Durham Shared Maths Project
Education Endowment Foundation 9
Methodology Trial design
This trial was designed as a cluster randomised field trial across four different geographical areas. Primary schools that were approached and that chose to take part in the study were assigned at random, on a 1:1 basis, to either the intervention or control group. Year 3 and Year 5 pupils in intervention schools participated in the project from September 2012 to April 2014. Pupils in control schools acted as wait-list controls. The Shared Maths intervention was implemented in control schools from April 2014.
A cluster trial design was chosen to avoid the potential for contamination to occur between pupils assigned to different study arms within the same school or class: a potential concern if classes or individual pupils are the unit of randomisation rather than whole schools.
Eligibility
School eligibility and recruitment
The Durham Shared Maths team were responsible for local authority and school recruitment. In October 2011 four local authority districts were contacted and asked to take part in the trial, of which three agreed to participate. Another local authority was then approached and agreed to participate in the project. The four local authorities that agreed to take part were: Medway, Worcester, Durham and Leeds. These areas were selected on the basis of providing a good spread of schools around the country. In line with the EEF policy at the time, the strategy for the recruitment of primary schools within these local authority districts included the following aims:
1. it was intended that around 40 per cent of schools in the study sample were to be or have been below the government performance floor target threshold at some time in the last three years (i.e. 2010, 2011 and possibly 2012)4; and;
2. it was intended that schools in the study sample would be from areas of high deprivation (e.g. high proportion of FSM/low IDACI rankings).
Each local authority was asked to put forward at least 22 candidate schools for inclusion in the trial by mid-March 2012.5 The local authorities were asked to prioritise schools that were perceived as having weaknesses in maths teaching, but also had the potential and capacity to improve their maths teaching. They were also asked not to put forward schools that had recently been graded as inadequate by Ofsted or were known to be going through a period of major re-organisation (e.g. academisation). In addition they were asked not to nominate schools with more than 3 entry forms or substantial imbalance between Y3 and Y5. Actual agreement with the schools was not required at this stage.
A total of 129 nominated schools were approached by the Shared Maths team. Nominated schools were provided with an information leaflet. This set out the aims of the project, details of the assessment procedures and what the project required of schools (i.e. willingness to be randomised, to carry out computer-based testing, and to deliver the intervention for 18 months). Further detail on the timescales involved and the support available to schools from the project team were also provided in
4 For more information about floor target thresholds please see https://www.gov.uk/government/news/primary-schools-test-results-released 5 Some local authorities provided an initial list of suitable schools that included more than 22 schools per local authority area.

Durham Shared Maths Project
Education Endowment Foundation 10
the leaflet.6 Schools were invited to attend a recruitment event in their local authority area and encouraged to sign up for the study in May 2012. In total 70 schools attended one of the four recruitment events (one in each local authority).7
Following face-to-face discussions, follow-up emails and phone calls after the recruitment events, a total of 84 schools were recruited for the trial. These schools agreed to all trial procedures, including informing parents, undertaking the computerised assessments of the relevant cohorts (Year 3 and Year 5), randomisation and implementation of the intervention as allocated.
Even though 84 schools were recruited for the trial (and for randomisation), the Shared Maths project team and the original evaluators excluded two schools from the intervention arm post-randomisation that failed to complete the pre-testing in time. The two schools and their local authorities were not informed of their allocations. Thus, the final study sample consisted of 82 schools for which the data was available.
Pupil eligibility and recruitment
All Year 3 and Year 5 pupils in recruited schools were eligible to take part in the trial. School-level consent was sought for testing as this was carried out across the whole year group and the results were passed back to schools to be used for monitoring purposes8. Participating schools informed parents of all pupils in relevant cohorts about the study using an information sheet provided by the Shared Maths team (Appendix A). Parents had the opportunity to withdraw their child’s data from the analysis by responding to an opt-out letter from the Shared Maths team which was distributed by schools (Appendix B).
Intervention
Durham Shared Maths is a cross-age peer tutoring pedagogy which pairs older Year 5 pupils (tutors) with younger Year 3 pupils (tutees) to discuss and work through maths problems using a structured stepped approach. The approach aims to help both ‘tutors’ and ‘tutees’ gain a clearer and deeper understanding of the maths problem and from that, the path to the solution. The Shared Maths pedagogy seeks to promote the National Curriculum aims of fluency in maths, problem solving and encouraging mathematical reasoning and incorporates some key aspects of Ofsted guidance on best practice e.g. formative assessment and differentiation. The intervention was delivered in the classroom and was designed to fit within the existing and ongoing maths teaching, rather than providing an alternative scheme of work. Training and support for implementing the programme was provided to Year 3 and Year 5 teachers by local consultants.
The Shared Maths approach
In Shared Maths the tutee and tutor are encouraged to discuss the maths problem/question in a way that encourages them both to fully understand the problem and find the method for reaching the solution. This involves approaching each question/problem using three main steps: (1) understanding the question”, (2) finding an answer to the question and (3) finishing the question by checking, summarising and linking to other learning and real life. During the first step the pairs should read the 6 Available from http://www.sharedmaths.org/attachments/DSMP%20Info%20Sheet.pdf 7 Based on information available to the NatCen evaluation team, it was not possible to identify how many of the 70 schools that attended the recruitment events signed up for the study. 8 No parental consent was sought as Schedule 2 Item 6 of the Data Protection Act could be applied. For further details see the guidance for evaluators on gaining consent from participants for EEF evaluations: http://educationendowmentfoundation.org.uk/uploads/pdf/EEF_guidance_for_evaluators_on_consent_and_the_Data_Protection_Act_FINAL.pdf

Durham Shared Maths Project
Education Endowment Foundation 11
question together, identify what the question is asking and verbalise how they plan to solve the problem. After doing this the tutee should try to solve the problem “thinking aloud” explaining what they are doing. The tutee should prompt or use questions to help the tutee to solve and better understand the question. After the pair reaches an answer they should move onto the final step which involves checking the answer, summarising they methods they used to solve the problem and discussing the problem fitted into what they already know and how the method could be used in real life. Throughout all steps the tutor should praise and encourage the tutee for making progress in solving the problem. During Shared Maths the role of the tutor is to ensure that the tutee sticks to the structured approach when solving maths questions and to encourage them to verbalise their thinking. The tutor should prompt or ask questions to help their tutee to solve the problem but shouldn’t explicitly tell their tutee how to solve the problem.
Matching pupils
Teachers were responsible for matching pairs of pupils from the participating year groups. Pupils were paired up based on their relative ability in their class which means the pupils who were most able in Year 3 were paired with those who were most able in Year 5. If teachers believed that a pair would have a difficulty working with each other (e.g. due to their personalities or social history) then the next nearest tutor could be assigned to the tutee.
If classes did not have the same number of pupils then some pupils could be grouped into ‘trios’ with two tutees to one tutor or two tutors to one tutee, depending on which class is larger. This method of grouping could also be used if levels of pupil absence were high among a group to ensure there was some consistency in tutoring. Teachers were strongly encouraged to consider personalities when putting pupils into trios.
Teaching pupils to do Shared Maths
Teachers were encouraged to train all tutors and tutees together in two sessions before starting on the programme to allow all pupils to become familiar with the key strategies, see a demonstration of these and practice them.
The programme handbook provided guidance about what should be covered and how during the pupil training sessions. In the first session, the focus was on ways to understand and solve maths questions which involved the following strategies in pairs:
• Read • Identify • Listen • Question • Think out loud; and • Praise.
The second session included a reminder of the problem solving strategies covered in session one, followed by a focus on the following strategies:
• Check • How did you do it? • How could you use it?
Durham Shared Maths sessions
The pairs (or trios) of pupils spent twenty minutes each week solving maths problems together, over two blocks of 16 weeks across two academic years.

Durham Shared Maths Project
Education Endowment Foundation 12
Shared Maths lessons took place during regular maths classes. Each Shared Maths lesson lasted for 30 minutes which included five minutes at the beginning and end of the lesson to get set up and move between classrooms. The Shared Maths element of the work lasted 20 minutes, starting with an introduction, 15 minutes of paired work then 3 to 4 minutes of debriefing at the end.
During the paired work teachers were responsible for monitoring the interactions in the classroom and supporting pairs where they may be struggling with either the problem or the process.
Selecting Questions/problems for pairs
The teacher of the younger class was responsible for selecting the maths questions in advance of each lesson. The handbook provided guidance on how to select appropriate questions. Questions used should be at the upper edge of the tutee’s independent maths ability level and differentiated for each pupil. They should ideally tie into work that the tutees are learning at the time.
Training for teachers
All training sessions for teachers were delivered by the local Shared Maths coordinator (and each initial session was observed by a member of the developer team). At the beginning of each block of Shared Maths the coordinators ran a 5 hour training session and all year 3 and year 5 teachers in the first year and Year 4 and Year 6 teachers in the second year in participating schools were invited to attend. This session introduced the method and background to the intervention and the reasons for doing Shared Maths. It then went into detail about the different steps in the approach and showed a video demonstrating Shared Maths in practice. The training then covered the organisational aspects of beginning Shared Maths including how to match up children, the structure of the lesson, training pupils and selecting appropriate questions. Throughout the session teachers were encouraged to reflect on the potential benefits from implementing the programme and to consider how the intervention would work in the context of their school. Teachers were encouraged to discuss any concerns or potential barriers in their schools. The session also provided time for teachers from the same school to jointly plan their implementation of the project.
A second twilight or afternoon training session was run midway through each block. At this session teachers were encouraged to reflect on how Shared Maths had been implemented in their school and discuss the benefits seen as well as any issues they were having. Discussion at the sessions focused on the specific issues that the teachers in attendance were having. There was also additional input from coordinators on judging the difficulty of maths questions and on encouraging praise and feedback.
Additionally around half way through each block the Shared Maths coordinator visited each school to observe a lesson. The teacher whose lesson was observed in each school was randomly selected by the developer team. The coordinator observed and used the Observation Schedule (included in the appendices) to record what was happening in the classroom generally and the discussion between one or two randomly selected pairs in the classroom. The information from the observation was fed back to the teacher at the end of the lesson and suggestions for development discussed. The completed observation schedule was also returned to the developer team with the permission of the teacher.
Project resources
All teachers involved were given the Shared Maths handbook which described in detail all aspects of the intervention and included copiable resource sheets designed to lead pupils through the process. Resources included the Shared Maths diagram included above, worksheets for tutors and tutees, questioning prompt cards, praise prompt cards and a tutor and tutee log sheet to reflect on learning.

Durham Shared Maths Project
Education Endowment Foundation 13
Teachers were expected to choose the resources required that would be useful in their class. The handbook also contained links to other information to help teachers plan and deliver lessons.
Teachers were also given access to the Shared Maths secure website which provided video examples of the different stages of the tutoring process, links to websites where suitable maths questions might be found and contact details for the project team.
Delivery model
In each local authority there was a Local co-ordinator who was responsible for providing teacher training and on-going support throughout the project. Two of these coordinators were people already employed by the Local Authority in a teacher development role and who had time ringfenced to support the programme. The other two coordinators were private maths consultants who provided professional development to schools. All contact with schools about the intervention was done through the coordinators.
Training for coordinators
The four local coordinators attended training sessions at the beginning of the project and through the year. These sessions allowed the coordinators to share practice with each other and to feedback to the developer team on the experiences of teachers. The table below shows the dates and topics of the training sessions for coordinators.
Date Days Training
Topics covered
June 2012 3 Shared Maths process & training for schools (day 1)
The trial design and methodology (day 2)
Mentoring teachers, observing Shared Maths and providing feedback (day 3)
October 2012 1 Refresher of session 1 training for schools and discussion of foreseeable barriers for schools, input on difficulty of word problems in maths.
February 2013 1 Refresher of session 2 training for schools, classroom observations, and focus session on feedback.
October 2013 2 Feedback from team on teacher surveys, and observation data. Coordinator input on classroom practice and on useful additions to the handbook. (Day 1)
Filming, future delivery plans and engaging control schools. (Day 2)
March 2014 1 Feedback on teacher questionnaires and classroom observations, changes to the model for Phase 2 (control schools) and costs of delivery.
November 2014 1 Preliminary results of trial, implementation data, describing the coordinator role, possible case studies.
Control schools
The control group schools followed ‘business as usual’ during the trial and did not receive any Durham Shared Maths materials or training. However, it is important to note that whilst schools did not receive the programme, the delivery team were aware that at least some of the control schools

Durham Shared Maths Project
Education Endowment Foundation 14
were independently making a focused effort to improve pupils’ maths attainment during the trial using other strategies.
Outcomes
Primary outcome
The primary outcome of interest in this study was maths attainment. This became the sole focus of this analysis (see Analysis section below for further details). The Interactive Computerised Assessment System (InCAS), which is a diagnostic, computer-adaptive assessment tool (Merrell & Tymms, 2005), was used to measure pre- and post-intervention maths ability. The maths module of the InCAS assessment presents questions from several topics including number work, shape, measuring and reading graphs and charts.
The following InCAS modules were chosen for this trial to measure pupils’ mathematic attainment:
• General Mathematics • Mental Arithmetic
These modules each provide a pupil score:
• A general maths score is provided calculated using the pupils scores from the component parts of the general mathematics module which including counting, arithmetic, problem solving, measures, shape and space and data handling.
• A mental arithmetic score based on scores from the addition, subtraction, multiplication and division modules.
For each module pupil scores are provided in raw form and converted to an age equivalent score which can be used to compare progress with their actual age. InCAS also provides age standardised scores which have a mean of 100 and a standard deviation of 15. This means that scores of between 85 and 114 are “average” with those achieving 115 or higher performing “above average” and those scoring under 85 being “below average”. (Please see Analysis section below for further details on specific scores that were used in the analysis.)
Secondary outcomes
The secondary outcomes of interest in this study were reading ability, developed ability and attitudes to school which were also measured using the InCAS assessment. InCAS Reading looks at pupils’ ability to recognise words, to break them into sounds and to choose the appropriate words to complete a passage. The InCAS attitudes module asks pupils for their attitudes to Reading, Maths and school on a sliding scale. The secondary outcomes included in the analysis were attitudes to school, reading and maths (see Analysis section below for further details).
Administration of the InCAS assessment
All Year 3 and Year 5 pupils in participating schools undertook the pre-test in September 2012 to November 2012 and the follow-up test between February and March 2014. The InCAS assessment was completed on computers and administered to pupils in groups or as a class. In addition to primary and secondary outcomes, schools were welcome to complete the other modules for their own information if they wished.
The tests were administered by schools with some support from the Shared Maths team and other employees from the Centre for Evaluating and Monitoring (CEM). For example, in some instances the project team helped schools with setting up the tests and administering it to the pupils. Teachers and the Shared Maths project team were aware of the pupils’ group allocation at post-test. The test
Durham Shared Maths Project
Education Endowment Foundation 15
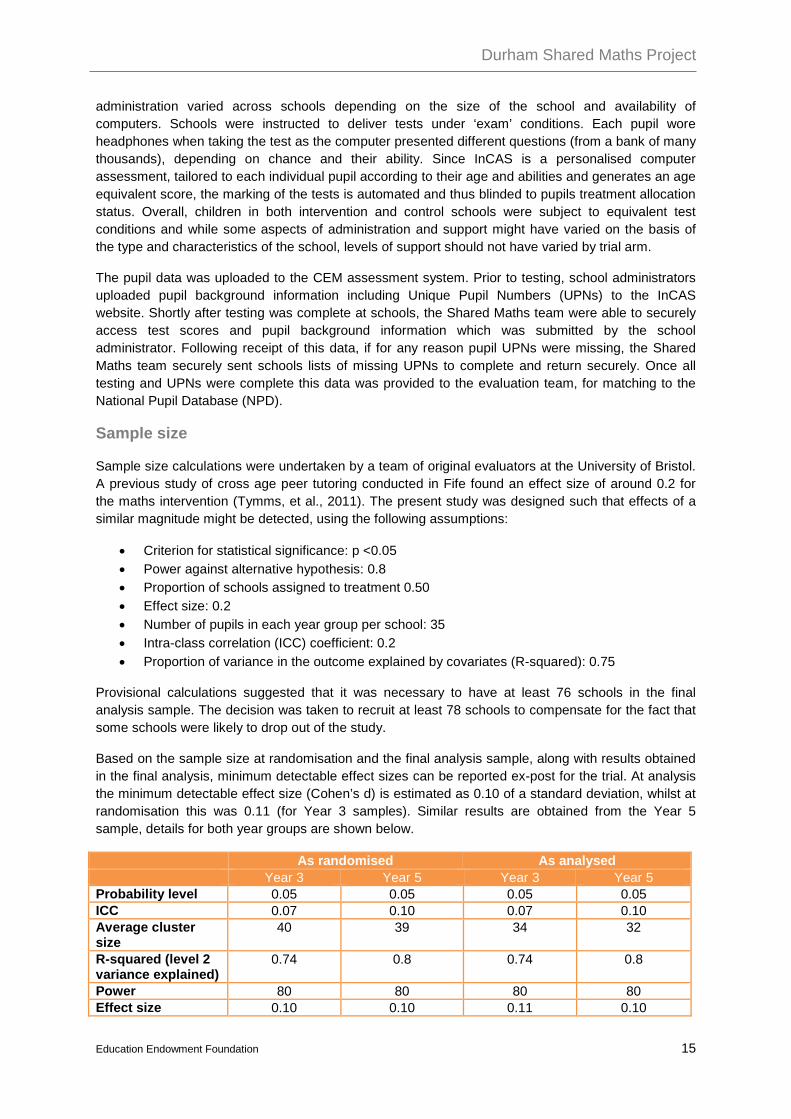
administration varied across schools depending on the size of the school and availability of computers. Schools were instructed to deliver tests under ‘exam’ conditions. Each pupil wore headphones when taking the test as the computer presented different questions (from a bank of many thousands), depending on chance and their ability. Since InCAS is a personalised computer assessment, tailored to each individual pupil according to their age and abilities and generates an age equivalent score, the marking of the tests is automated and thus blinded to pupils treatment allocation status. Overall, children in both intervention and control schools were subject to equivalent test conditions and while some aspects of administration and support might have varied on the basis of the type and characteristics of the school, levels of support should not have varied by trial arm.
The pupil data was uploaded to the CEM assessment system. Prior to testing, school administrators uploaded pupil background information including Unique Pupil Numbers (UPNs) to the InCAS website. Shortly after testing was complete at schools, the Shared Maths team were able to securely access test scores and pupil background information which was submitted by the school administrator. Following receipt of this data, if for any reason pupil UPNs were missing, the Shared Maths team securely sent schools lists of missing UPNs to complete and return securely. Once all testing and UPNs were complete this data was provided to the evaluation team, for matching to the National Pupil Database (NPD).
Sample size
Sample size calculations were undertaken by a team of original evaluators at the University of Bristol. A previous study of cross age peer tutoring conducted in Fife found an effect size of around 0.2 for the maths intervention (Tymms, et al., 2011). The present study was designed such that effects of a similar magnitude might be detected, using the following assumptions:
• Criterion for statistical significance: p <0.05 • Power against alternative hypothesis: 0.8 • Proportion of schools assigned to treatment 0.50 • Effect size: 0.2 • Number of pupils in each year group per school: 35 • Intra-class correlation (ICC) coefficient: 0.2 • Proportion of variance in the outcome explained by covariates (R-squared): 0.75
Provisional calculations suggested that it was necessary to have at least 76 schools in the final analysis sample. The decision was taken to recruit at least 78 schools to compensate for the fact that some schools were likely to drop out of the study.
Based on the sample size at randomisation and the final analysis sample, along with results obtained in the final analysis, minimum detectable effect sizes can be reported ex-post for the trial. At analysis the minimum detectable effect size (Cohen’s d) is estimated as 0.10 of a standard deviation, whilst at randomisation this was 0.11 (for Year 3 samples). Similar results are obtained from the Year 5 sample, details for both year groups are shown below.
As randomised As analysed Year 3 Year 5 Year 3 Year 5 Probability level 0.05 0.05 0.05 0.05 ICC 0.07 0.10 0.07 0.10 Average cluster size
40 39 34 32
R-squared (level 2 variance explained)
0.74 0.8 0.74 0.8
Power 80 80 80 80 Effect size 0.10 0.10 0.11 0.10
Durham Shared Maths Project
Education Endowment Foundation 16
Randomisation
The randomisation of whole schools for this study was undertaken by the University of Bristol. The 84 schools initially recruited to the trial were stratified by local authority area, and randomisation of schools was therefore conducted within each area. Within each local authority, schools that had agreed to take part were assigned a value drawn at random from a uniform distribution in Microsoft Excel. Schools were then ranked in descending order on the basis of the random number they were assigned. Subsequently, the first school in the ranking was assigned to the intervention group followed by every other school (all schools in odd number positions within the ranking) whilst the remainder were assigned to the control group.
The University of Bristol then informed the project team of the outcome of the randomisation process who in turn informed the schools.
Analysis
The analysis was conducted in STATA version 13 (Stata Corporation, College Station, Texas, USA). Impacts were estimated on the basis of intention to treat, whereby all schools and pupils who were involved in post-testing were analysed according to the study arm to which they were initially assigned, regardless of whether they went on to participate in the intervention.
General Mathematics score was used as the primary outcome in analysis as this reflects the pupils’ overall maths ability. Initial descriptive analysis, is based on age equivalent raw scores for pupils for whom post-test primary data were available. The raw scores are presented in years and months which provides an easy comparison to pupils’ expected maths ability. For example, if a pupil is performing as expected for their age, their age equivalent score is the same as his/her chronological age.
Multivariate regression analysis was then used to obtain effect sizes on the primary outcome using age standardised scores which provide an indication of whether pupils are performing at the average level for their age, below or higher than average.9 This involved fitting a multi-level linear regression model with random intercepts; the pupil being level one in the model and the school level two. The following covariates were included in the adjusted analysis:
• School level: a dummy variable indicating whether the school was an intervention school and a set of indicators for the local authority areas.
• Pupil level: baseline test score in maths, eligibility for free school meals, EAL, ethnic group, sex and month of birth. These covariates were included in the analysis to adjust for possible imbalances between intervention and control pupils.
Separate regression models were estimated for Year 3 and Year 5 pupils and for those who qualified for free school meals.10
9 Age standardised scores are based on the pupils’ raw score which has been adjusted for age and placed on a scale that makes a comparison with a nationally representative sample of pupils of the same age across the UK. The average score is 100. 10 The interaction models were implemented using a random intercept and random slope hierarchical regression model (multi-level model). We specified a random slope for the individual level variable indicating if the student was eligible for free school meals. This means that we allowed the effect (slope) of free school meal eligibility on the post-test to vary across school. We further specified that any difference in the variance of these slopes (i.e. in the effect receiving free school meals has on the outcome) is due to having been in a school which was in the treatment group versus the control. This latter specification was included through a cross-level interaction between receiving free school meals
Durham Shared Maths Project
Education Endowment Foundation 17
Effect sizes and their respective 95 per cent confidence intervals were calculated following the procedure set out in Tymms (2004):
Where represents the adjusted difference in outcomes between intervention and control groups obtained from the full regression model and 𝜎 the square root of the pupil level variance obtained from fitting an unadjusted multilevel model. The unadjusted model contains a constant, intervention dummy variable but no further covariates.
Summary descriptive statistics are produced below along with estimates of ICCs for each regression model estimated.
Only limited analysis of secondary outcomes was carried out as part of this study because of the extent of missing data relating to some of secondary outcomes of interest. Namely, due to the level of testing required as part of the project, the Shared Maths team prioritised encouraging schools to collect the InCAS general maths module over the modules relating to secondary outcomes. Therefore, analysis of some secondary outcomes was unfeasible due to the extent of missing data. For example, the post-test results for reading ability measured by the InCAS reading test were available for 1,444 pupils in 28 intervention schools (out of which 4 schools had information for less than 5 pupils) and for 745 pupils in 27 control schools (out of which 12 schools had information for 3 or less pupils). Nonetheless, analysis was carried out on three secondary outcomes: attitudes towards school, reading and maths. The analysis of these secondary outcomes followed the strategy discussed above for the analysis of the primary outcome.
Process evaluation methodology
A longitudinal approach was taken for the process evaluation involving observations and two stages of interviews with the first stage taking place when the programme was introduced in intervention schools and the second stage carried out after the programme was completed in intervention schools and introduced in control schools. Interviews were carried out with teachers, Local Co-ordinators and Shared Maths project team.
As part of the intervention itself the Durham team also collected additional information on the fidelity of implementation of the intervention, which is available from the project team on request (see Project Team for details) and will be published at a later date.
In the first stage, teachers in intervention schools were interviewed between October 2013 and January 2014 by two NatCen researchers. In the second stage, teachers in schools that were originally control schools were interviewed between May and June 2014. Teachers were selected to include both Year 3 and Year 5 teachers across participating local authority areas (see a breakdown of participating teachers by local authority is below). In total 14 teachers (one per school) delivering Shared Maths and opted into the process evaluation took part in depth-interviews.
All four Local Co-ordinators were interviewed at two points, at the midpoint in programme delivery in intervention schools (during early July 2013) and the start of programme delivery in control schools (during March 2014). Two of the Shared Maths project team (Vic Menzies and Kirsty Younger) were also interviewed at the midpoint of programme implementation for intervention schools and again before the programme was introduced in control schools. The rationale for this was to explore any changes made to delivery in control schools based on their experience of Shared Maths in
and the allocation into treatment or control schools. The results of this interaction indicate if being in a treatment versus control school has any impact on the effect FSM has on the outcome.
Durham Shared Maths Project
Education Endowment Foundation 18
intervention schools, before the teachers for that phase were interviewed. It also meant they could reflect on particular barriers and successes of initial programme delivery.
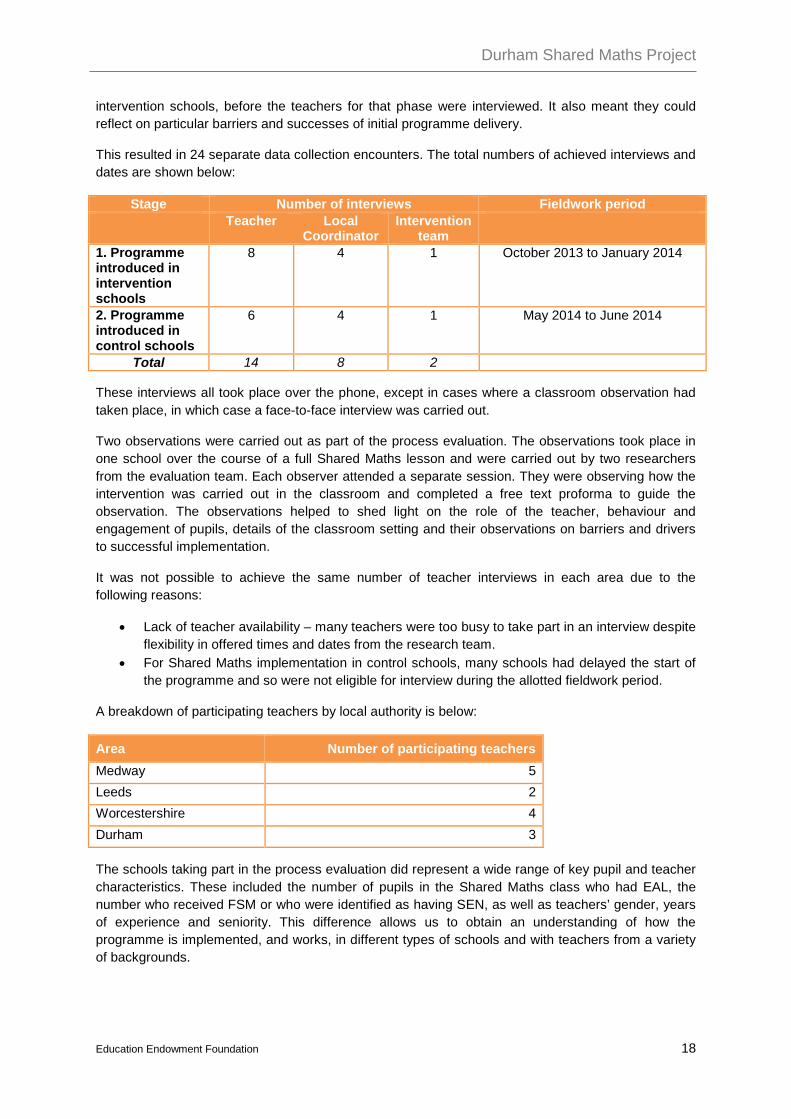
This resulted in 24 separate data collection encounters. The total numbers of achieved interviews and dates are shown below:
Stage Number of interviews Fieldwork period Teacher Local
Coordinator Intervention
team
1. Programme introduced in intervention schools
8 4 1 October 2013 to January 2014
2. Programme introduced in control schools
6 4 1 May 2014 to June 2014
Total 14 8 2
These interviews all took place over the phone, except in cases where a classroom observation had taken place, in which case a face-to-face interview was carried out.
Two observations were carried out as part of the process evaluation. The observations took place in one school over the course of a full Shared Maths lesson and were carried out by two researchers from the evaluation team. Each observer attended a separate session. They were observing how the intervention was carried out in the classroom and completed a free text proforma to guide the observation. The observations helped to shed light on the role of the teacher, behaviour and engagement of pupils, details of the classroom setting and their observations on barriers and drivers to successful implementation.
It was not possible to achieve the same number of teacher interviews in each area due to the following reasons:
• Lack of teacher availability – many teachers were too busy to take part in an interview despite flexibility in offered times and dates from the research team.
• For Shared Maths implementation in control schools, many schools had delayed the start of the programme and so were not eligible for interview during the allotted fieldwork period.
A breakdown of participating teachers by local authority is below:
Area Number of participating teachers Medway 5
Leeds 2
Worcestershire 4
Durham 3
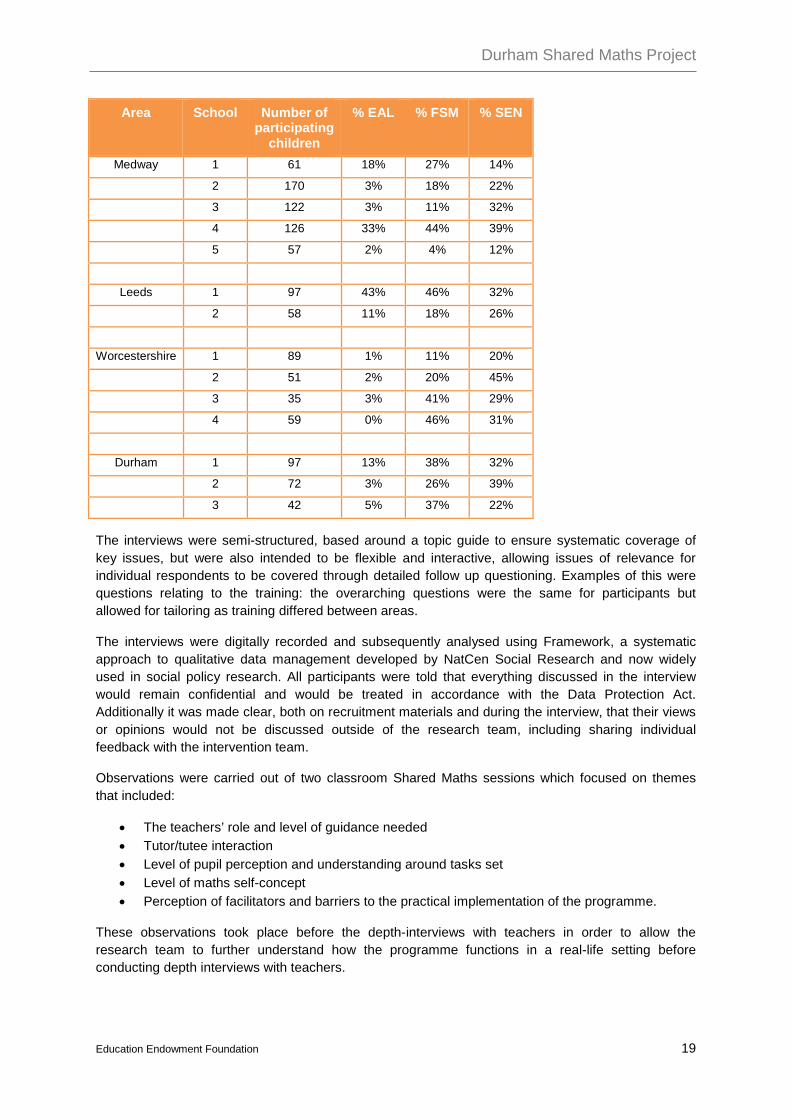
The schools taking part in the process evaluation did represent a wide range of key pupil and teacher characteristics. These included the number of pupils in the Shared Maths class who had EAL, the number who received FSM or who were identified as having SEN, as well as teachers’ gender, years of experience and seniority. This difference allows us to obtain an understanding of how the programme is implemented, and works, in different types of schools and with teachers from a variety of backgrounds.
Durham Shared Maths Project
Education Endowment Foundation 19
Area School Number of participating
children
% EAL % FSM % SEN
Medway 1 61 18% 27% 14%
2 170 3% 18% 22%
3 122 3% 11% 32%
4 126 33% 44% 39%
5 57 2% 4% 12%
Leeds 1 97 43% 46% 32%
2 58 11% 18% 26%
Worcestershire 1 89 1% 11% 20%
2 51 2% 20% 45%
3 35 3% 41% 29%
4 59 0% 46% 31%
Durham 1 97 13% 38% 32%
2 72 3% 26% 39%
3 42 5% 37% 22%
The interviews were semi-structured, based around a topic guide to ensure systematic coverage of key issues, but were also intended to be flexible and interactive, allowing issues of relevance for individual respondents to be covered through detailed follow up questioning. Examples of this were questions relating to the training: the overarching questions were the same for participants but allowed for tailoring as training differed between areas.
The interviews were digitally recorded and subsequently analysed using Framework, a systematic approach to qualitative data management developed by NatCen Social Research and now widely used in social policy research. All participants were told that everything discussed in the interview would remain confidential and would be treated in accordance with the Data Protection Act. Additionally it was made clear, both on recruitment materials and during the interview, that their views or opinions would not be discussed outside of the research team, including sharing individual feedback with the intervention team.
Observations were carried out of two classroom Shared Maths sessions which focused on themes that included:
• The teachers’ role and level of guidance needed • Tutor/tutee interaction • Level of pupil perception and understanding around tasks set • Level of maths self-concept • Perception of facilitators and barriers to the practical implementation of the programme.
These observations took place before the depth-interviews with teachers in order to allow the research team to further understand how the programme functions in a real-life setting before conducting depth interviews with teachers.
Durham Shared Maths Project
Education Endowment Foundation 20
In addition, when the intervention was made available to control group schools, researchers attended two of the training days for teachers in different areas in order to gain a deeper understanding of teacher training at different time points of Shared Maths delivery, to experience the introduction to the programme for teachers and to encourage teacher participation in the evaluation of the programme.

Durham Shared Maths Project
Education Endowment Foundation 21
Impact evaluation
Timeline
Date Activity
October 2011 Local Authorities agreed to take part in project
November 2011 to June 2012
Recruitment of schools
September 2012 to November 2012
Pre-test data collection
September 2012 Opt-out parental consent for data use
October 2012 Randomisation of schools to intervention and control groups
November 2012 Intervention school teacher Continued Professional Development (CPD) sessions for Years 3 and 5
January 2013 Intervention schools start first 16 week block of Programme
March 2013 Second teacher CPD session in intervention schools
March 2013 Lesson observations in all intervention schools by Local Co-ordinators
July 2013 or Sept 2013 Teacher CPD sessions for Years 4 and 6 in intervention schools
Sept 2013 Update to parental consent: new evaluator & data use
September 2013 Intervention schools start second 16 week block of Programme
w/c 21st October 2013 Second teacher CPD session in intervention schools
21st October to 7th December 2013
Lesson observations in all intervention schools by Local Co-ordinators
February 2014 Intervention delivery finishes
February to April 2014 Post-intervention data collection

Durham Shared Maths Project
Education Endowment Foundation 22
Participants
School recruitment
School recruitment was undertaken by the Shared Maths project team during November 2011 to June 2012. In total the delivery team approached 129 schools to consider taking part in the trial (see also Figure 1), 29 of these schools approached declined to participate in the study. A further five schools whose details were passed on by local authorities did not meet inclusion criteria (see also School eligibility and recruitment section above). Two schools withdrew at the beginning of pre-testing period (Sept – Nov 2012) due to the changes in staffing over the summer. Yet another school withdrew at the beginning of this period without expressing reasons for refusing to participate. Eight schools did not complete the pre-testing and were excluded before randomisation. In total, 11 schools did not complete the pre-test. In all, out of 129 schools approached, 84 were recruited yielding a recruitment rate of approximately 65 per cent.
As indicated above, it is important to note that even though 84 schools were randomised, the Shared Maths project team in consultation with the then evaluation team excluded two schools from the intervention arm that failed to complete the pre-testing in time. The excluded schools were never informed of their allocation status. Thus, the final randomised study sample consisted of 82 schools, with 40 allocated to the intervention arm and 42 to the control arm.
Pupil recruitment
All 82 schools sent opt-out letters to parents of all children in Year 3 and Year 5 in September 2012. The letter explained that parents were able to withdraw their child’s data from the trial analysis, but not from testing as this was taking place in school time and the results were given to schools to use for routine monitoring purposes. There were a few parent queries regarding the study. However, no parent opted that his/her child did not take part in the study.
Participant flow
Figure 1 shows the flow of participants in relevant cohorts through the study. There were a total of 6,472 pupils in the study at the point of randomisation (3,305 and 3,167 in Year 3 and Year 5 respectively).
In October 2012, 84 schools were randomised into intervention and control conditions. (As indicated above, 2 schools were excluded after randomisation due to the failure to complete pre-tests.) Of the remaining schools, 40 schools (containing 3,292 participating pupils) were randomly allocated to receive the intervention in 2013 and 42 schools (containing 3,180 participating pupils) to the control condition. There were 1,702 Year 3 pupils and 1,590 Year 5 pupils in the intervention condition and 1,603 Year 3 pupils and 1,577 Year 5 pupils in the control condition.
After randomisation and pre-testing, 3 schools failed to complete the post testing: 1 from the intervention arm and 2 from the control arm, Two of the schools were unable to complete the testing within the time frame due to technical / IT issues, and one school was no longer in contact with either the Durham Team nor the local authority. The number of pupils in the intervention arm lost to follow-up was 486 pupils (276 in Year 3 and 210 in Year 5). The loss to follow-up in the control arm was 517 pupils (243 in Year 3 and 274 in Year 5). Overall, the proportion of pupils allocated to intervention and to group lost to follow-up was 15% and 16% respectively.
The final number of pupils who had post-test data and were eligible for unadjusted primary analysis was 2,806 (85% of those allocated) in the intervention arm (1,426 who started in Year 3 and 1,380 in Year 5) and 2,663 (84% of those allocated) in the control arm (1,360 who started in Year 3 and 1,303 in Year 5).

Durham Shared Maths Project
Education Endowment Foundation 23
However, it is important to note that further participants were excluded from adjusted primary analysis due to missing pupil level covariates capturing baseline test scores in maths or relevant socio-demographics (e.g. whether the pupil qualified for free school meals, EAL, ethnic group, sex and month of birth). In the intervention arm, 41 Year 3 pupils and 5 Year 5 pupils were excluded from adjusted analysis due to not having pre-test measure. A further 2 pupils were excluded for missing socio-demographics. In total, 98 pupils in the intervention arm were excluded from the adjusted analysis sample. As for the control arm, 33 Year 3 pupils and 30 Year 5 pupils were excluded from adjusted analysis due to not having pre-test measure. One pupil was excluded due to missing key socio-demographics. In total, 64 pupils in the control arm were excluded from the adjusted analysis sample (please see Table 2 and Table 3 below for further details on pupils characteristics).
Figure 1: CONSORT diagram
Note: A further 98 pupils in the intervention arm and 64 in the control arm were excluded from adjusted primary analysis due to missing pupil level covariates capturing baseline test scores in maths or relevant socio-demographics.
School characteristics
In this section we look at the characteristics of schools in the sample at the time of randomisation, and those included in the primary analysis.
As we have seen, 82 schools were allocated at random to control and intervention groups on a 1:1 basis11, 42 schools assigned to control conditions, 40 to the intervention. Schools in control and 11 Please note that 2 schools in the intervention arm were excluded after randomisation which led to an uneven number of schools in the intervention and control arm.
Durham Shared Maths Project
Education Endowment Foundation 24
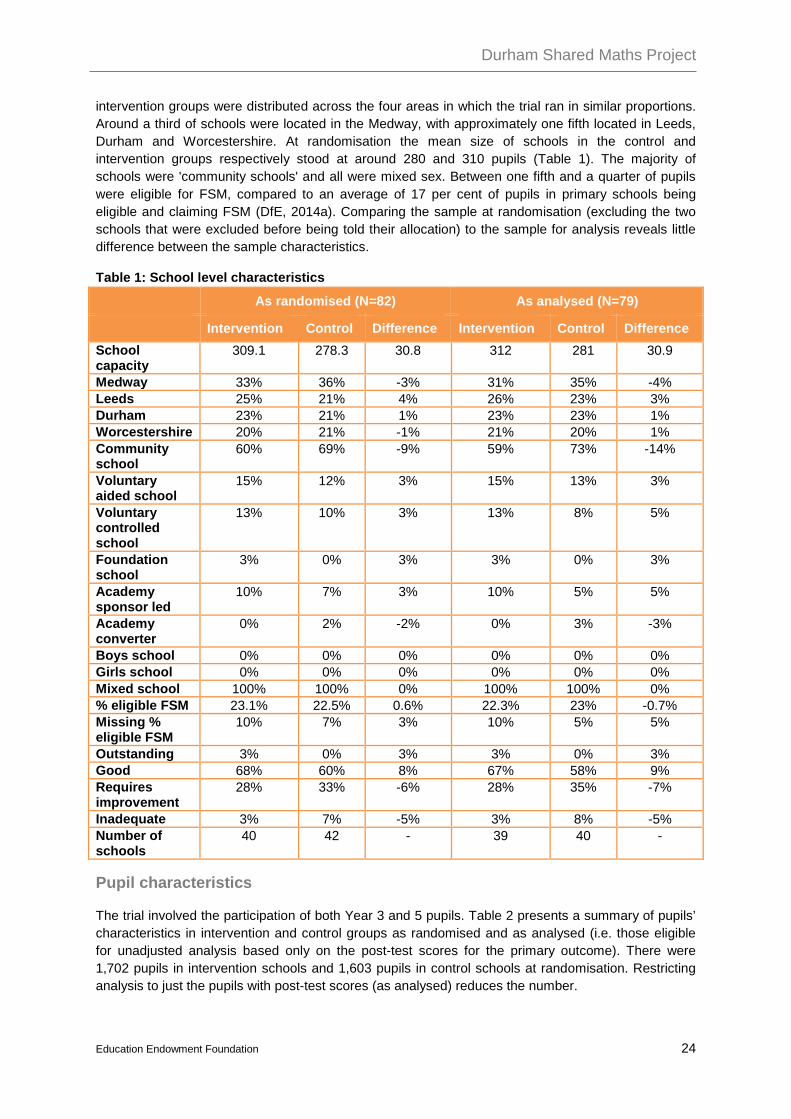
intervention groups were distributed across the four areas in which the trial ran in similar proportions. Around a third of schools were located in the Medway, with approximately one fifth located in Leeds, Durham and Worcestershire. At randomisation the mean size of schools in the control and intervention groups respectively stood at around 280 and 310 pupils (Table 1). The majority of schools were 'community schools' and all were mixed sex. Between one fifth and a quarter of pupils were eligible for FSM, compared to an average of 17 per cent of pupils in primary schools being eligible and claiming FSM (DfE, 2014a). Comparing the sample at randomisation (excluding the two schools that were excluded before being told their allocation) to the sample for analysis reveals little difference between the sample characteristics.
Table 1: School level characteristics
Pupil characteristics
The trial involved the participation of both Year 3 and 5 pupils. Table 2 presents a summary of pupils’ characteristics in intervention and control groups as randomised and as analysed (i.e. those eligible for unadjusted analysis based only on the post-test scores for the primary outcome). There were 1,702 pupils in intervention schools and 1,603 pupils in control schools at randomisation. Restricting analysis to just the pupils with post-test scores (as analysed) reduces the number.
As randomised (N=82) As analysed (N=79)
Intervention Control Difference Intervention Control Difference School capacity
309.1 278.3 30.8 312 281 30.9
Medway 33% 36% -3% 31% 35% -4% Leeds 25% 21% 4% 26% 23% 3% Durham 23% 21% 1% 23% 23% 1% Worcestershire 20% 21% -1% 21% 20% 1% Community school
60% 69% -9% 59% 73% -14%
Voluntary aided school
15% 12% 3% 15% 13% 3%
Voluntary controlled school
13% 10% 3% 13% 8% 5%
Foundation school
3% 0% 3% 3% 0% 3%
Academy sponsor led
10% 7% 3% 10% 5% 5%
Academy converter
0% 2% -2% 0% 3% -3%
Boys school 0% 0% 0% 0% 0% 0% Girls school 0% 0% 0% 0% 0% 0% Mixed school 100% 100% 0% 100% 100% 0% % eligible FSM 23.1% 22.5% 0.6% 22.3% 23% -0.7% Missing % eligible FSM
10% 7% 3% 10% 5% 5%
Outstanding 3% 0% 3% 3% 0% 3% Good 68% 60% 8% 67% 58% 9% Requires improvement
28% 33% -6% 28% 35% -7%
Inadequate 3% 7% -5% 3% 8% -5% Number of schools
40 42 - 39 40 -
Durham Shared Maths Project
Education Endowment Foundation 25
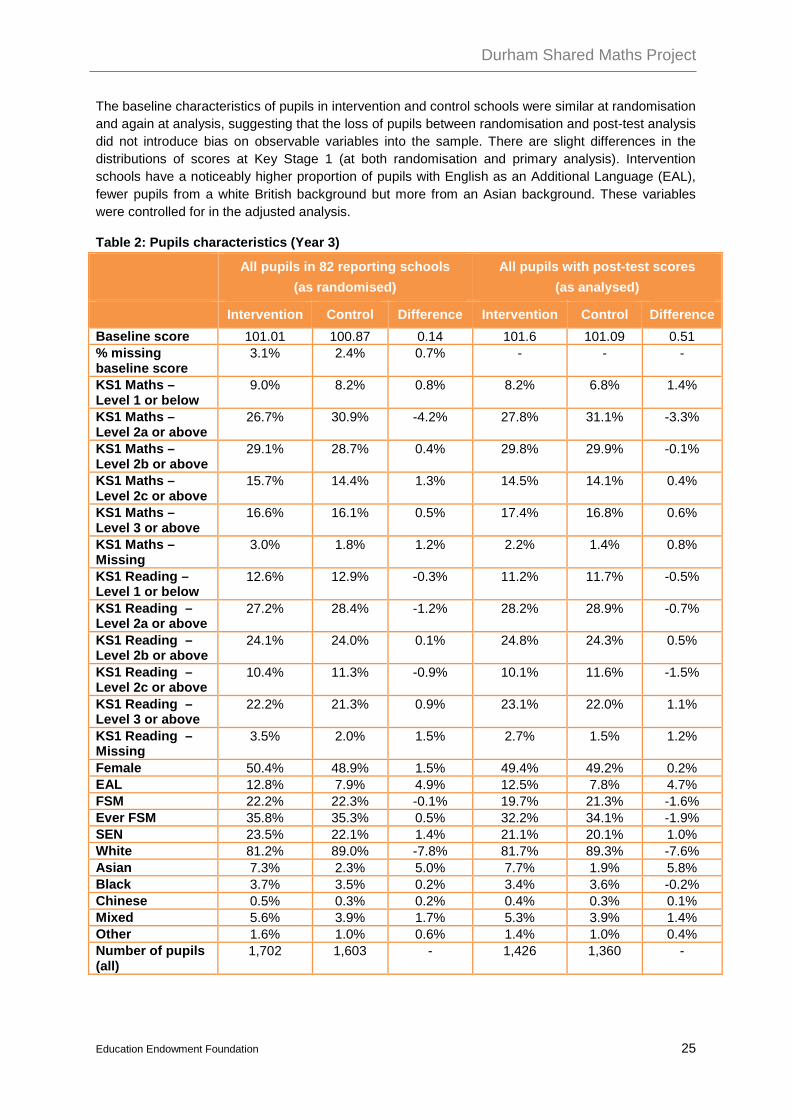
The baseline characteristics of pupils in intervention and control schools were similar at randomisation and again at analysis, suggesting that the loss of pupils between randomisation and post-test analysis did not introduce bias on observable variables into the sample. There are slight differences in the distributions of scores at Key Stage 1 (at both randomisation and primary analysis). Intervention schools have a noticeably higher proportion of pupils with English as an Additional Language (EAL), fewer pupils from a white British background but more from an Asian background. These variables were controlled for in the adjusted analysis.
Table 2: Pupils characteristics (Year 3)
All pupils in 82 reporting schools (as randomised)
All pupils with post-test scores (as analysed)
Intervention Control Difference Intervention Control Difference Baseline score 101.01 100.87 0.14 101.6 101.09 0.51 % missing baseline score
3.1% 2.4% 0.7% - - -
KS1 Maths – Level 1 or below
9.0% 8.2% 0.8% 8.2% 6.8% 1.4%
KS1 Maths – Level 2a or above
26.7% 30.9% -4.2% 27.8% 31.1% -3.3%
KS1 Maths – Level 2b or above
29.1% 28.7% 0.4% 29.8% 29.9% -0.1%
KS1 Maths – Level 2c or above
15.7% 14.4% 1.3% 14.5% 14.1% 0.4%
KS1 Maths – Level 3 or above
16.6% 16.1% 0.5% 17.4% 16.8% 0.6%
KS1 Maths – Missing
3.0% 1.8% 1.2% 2.2% 1.4% 0.8%
KS1 Reading – Level 1 or below
12.6% 12.9% -0.3% 11.2% 11.7% -0.5%
KS1 Reading – Level 2a or above
27.2% 28.4% -1.2% 28.2% 28.9% -0.7%
KS1 Reading – Level 2b or above
24.1% 24.0% 0.1% 24.8% 24.3% 0.5%
KS1 Reading – Level 2c or above
10.4% 11.3% -0.9% 10.1% 11.6% -1.5%
KS1 Reading – Level 3 or above
22.2% 21.3% 0.9% 23.1% 22.0% 1.1%
KS1 Reading – Missing
3.5% 2.0% 1.5% 2.7% 1.5% 1.2%
Female 50.4% 48.9% 1.5% 49.4% 49.2% 0.2% EAL 12.8% 7.9% 4.9% 12.5% 7.8% 4.7% FSM 22.2% 22.3% -0.1% 19.7% 21.3% -1.6% Ever FSM 35.8% 35.3% 0.5% 32.2% 34.1% -1.9% SEN 23.5% 22.1% 1.4% 21.1% 20.1% 1.0% White 81.2% 89.0% -7.8% 81.7% 89.3% -7.6% Asian 7.3% 2.3% 5.0% 7.7% 1.9% 5.8% Black 3.7% 3.5% 0.2% 3.4% 3.6% -0.2% Chinese 0.5% 0.3% 0.2% 0.4% 0.3% 0.1% Mixed 5.6% 3.9% 1.7% 5.3% 3.9% 1.4% Other 1.6% 1.0% 0.6% 1.4% 1.0% 0.4% Number of pupils (all)
1,702 1,603 - 1,426 1,360 -

Durham Shared Maths Project
Education Endowment Foundation 26
The results of a similar exploration of Year 5 pupils’ characteristics is provided in Table 3. The intervention schools had 1,590 pupils and control schools had 1,577 pupils at randomisation, with these numbers falling to 1,380 and 1,303 respectively in the sample for analysis. Similar slight differences in average characteristics between pupils in intervention and control schools are found among Year 5 pupils as among Year 3 pupils. There are small differences in the distribution of scores at Key Stage 1 at randomisation, and again as analysed. At randomisation and as analysed intervention schools have a smaller proportion of white students and a larger proportion of students from an Asian background.
Table 3: Pupils characteristics (Year 5) All pupils in reporting schools
(as randomised; 82 schools) All pupils with post-test scores (as
analysed; 79 schools)
Intervention Control Difference
Intervention Control Difference
Baseline score 94.56 94.87 -0.310 95.46 95.36 0.100 % missing baseline score
4.1% 3.2% 0.9% - - -
KS1 Maths – Level 1 or below
11.9% 9.2% 2.7% 10.40% 8.60% 1.8%
KS1 Maths – Level 2a or above
25.9% 25.8% 0.1% 26.40% 26.50% -0.1%
KS1 Maths – Level 2b or above
28.3% 28.4% -0.1% 29.20% 28.80% 0.4%
KS1 Maths – Level 2c or above
16.2% 17.1% -0.9% 15.90% 16.20% -0.3%
KS1 Maths – Level 3 or above
13.6% 14.4% -0.8% 14.60% 15.20% -0.6%
KS1 Maths – Missing
4.1% 5.1% -1.0% 3.40% 4.70% -1.3%
KS1 Reading – Level 1 or below
14.7% 14.3% 0.4% 12.80% 13.70% -0.9%
KS1 Reading – Level 2a or above
24.4% 24.1% 0.3% 25.20% 24.70% 0.5%
KS1 Reading – Level 2b or above
24.5% 23.3% 1.2% 24.90% 24.30% 0.6%
KS1 Reading – Level 2c or above
11.9% 12.7% -0.8% 12.40% 11.60% 0.8%
KS1 Reading – Level 3 or above
19.6% 20.2% -0.6% 20.60% 21.00% -0.4%
KS1 Reading – Missing
4.8% 5.3% -0.5% 4.10% 4.80% -0.7%
Female 48.8% 51.7% -2.9% 49.20% 52.10% -2.9% EAL 11.1% 9.4% 1.7% 10.60% 8.70% 1.9% FSM 22.8% 21.7% 1.1% 20.50% 20.70% -0.2% Ever FSM 37.8% 37.2% 0.6% 35.60% 36.80% -1.2% SEN 25.0% 22.9% 2.1% 23.20% 21.30% 1.9% White 84.2% 88.5% -4.3% 84.10% 89.30% -5.2% Asian 6.0% 3.2% 2.8% 6.20% 3.10% 3.1% Black 4.2% 3.3% 0.9% 4.10% 3.10% 1.0% Chinese 0.3% 0.4% -0.1% 0.40% 0.30% 0.1% Mixed 4.5% 3.6% 0.9% 4.40% 3.50% 0.9% Other 0.8% 1.0% -0.2% 0.80% 0.80% 0.0% Number of pupils (all)
1,590 1,577 - 1,380 1,303 -
Durham Shared Maths Project
Education Endowment Foundation 27
Outcomes and analysis
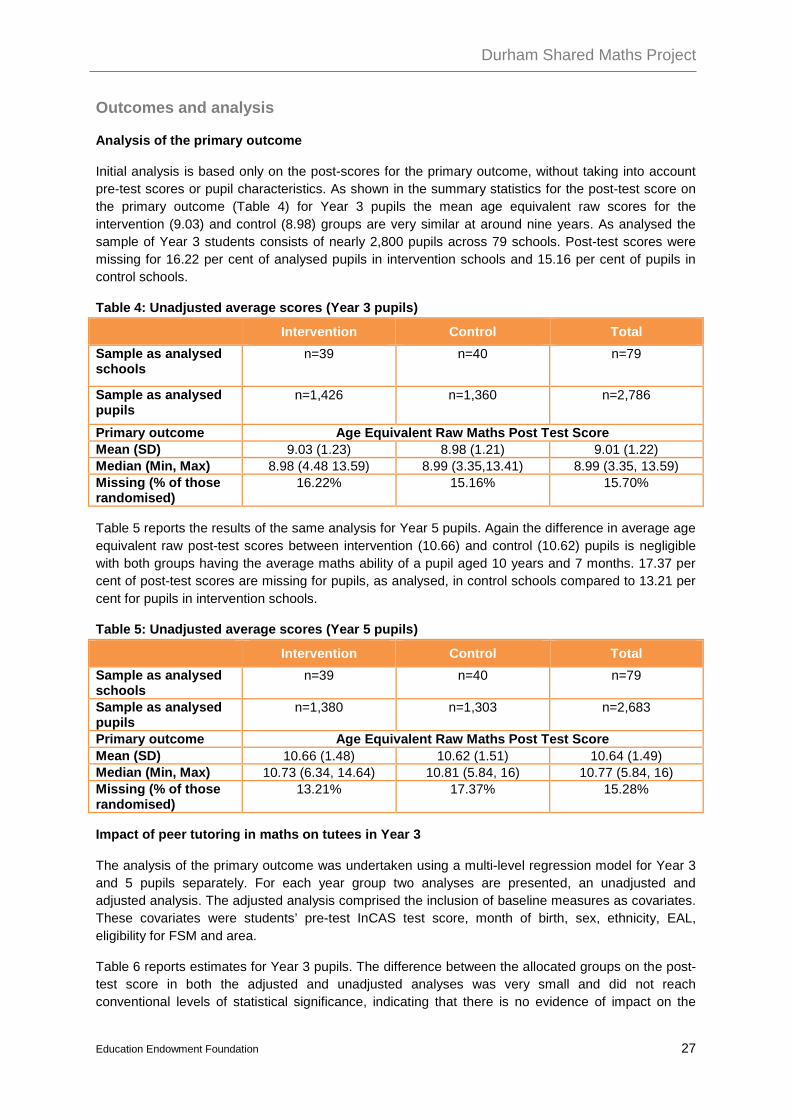
Analysis of the primary outcome
Initial analysis is based only on the post-scores for the primary outcome, without taking into account pre-test scores or pupil characteristics. As shown in the summary statistics for the post-test score on the primary outcome (Table 4) for Year 3 pupils the mean age equivalent raw scores for the intervention (9.03) and control (8.98) groups are very similar at around nine years. As analysed the sample of Year 3 students consists of nearly 2,800 pupils across 79 schools. Post-test scores were missing for 16.22 per cent of analysed pupils in intervention schools and 15.16 per cent of pupils in control schools.
Table 4: Unadjusted average scores (Year 3 pupils) Intervention Control Total Sample as analysed schools
n=39 n=40 n=79
Sample as analysed pupils
n=1,426 n=1,360 n=2,786
Primary outcome Age Equivalent Raw Maths Post Test Score Mean (SD) 9.03 (1.23) 8.98 (1.21) 9.01 (1.22) Median (Min, Max) 8.98 (4.48 13.59) 8.99 (3.35,13.41) 8.99 (3.35, 13.59) Missing (% of those randomised)
16.22% 15.16% 15.70%
Table 5 reports the results of the same analysis for Year 5 pupils. Again the difference in average age equivalent raw post-test scores between intervention (10.66) and control (10.62) pupils is negligible with both groups having the average maths ability of a pupil aged 10 years and 7 months. 17.37 per cent of post-test scores are missing for pupils, as analysed, in control schools compared to 13.21 per cent for pupils in intervention schools.
Table 5: Unadjusted average scores (Year 5 pupils) Intervention Control Total Sample as analysed schools
n=39 n=40 n=79
Sample as analysed pupils
n=1,380 n=1,303 n=2,683
Primary outcome Age Equivalent Raw Maths Post Test Score Mean (SD) 10.66 (1.48) 10.62 (1.51) 10.64 (1.49) Median (Min, Max) 10.73 (6.34, 14.64) 10.81 (5.84, 16) 10.77 (5.84, 16) Missing (% of those randomised)
13.21% 17.37% 15.28%
Impact of peer tutoring in maths on tutees in Year 3
The analysis of the primary outcome was undertaken using a multi-level regression model for Year 3 and 5 pupils separately. For each year group two analyses are presented, an unadjusted and adjusted analysis. The adjusted analysis comprised the inclusion of baseline measures as covariates. These covariates were students’ pre-test InCAS test score, month of birth, sex, ethnicity, EAL, eligibility for FSM and area.
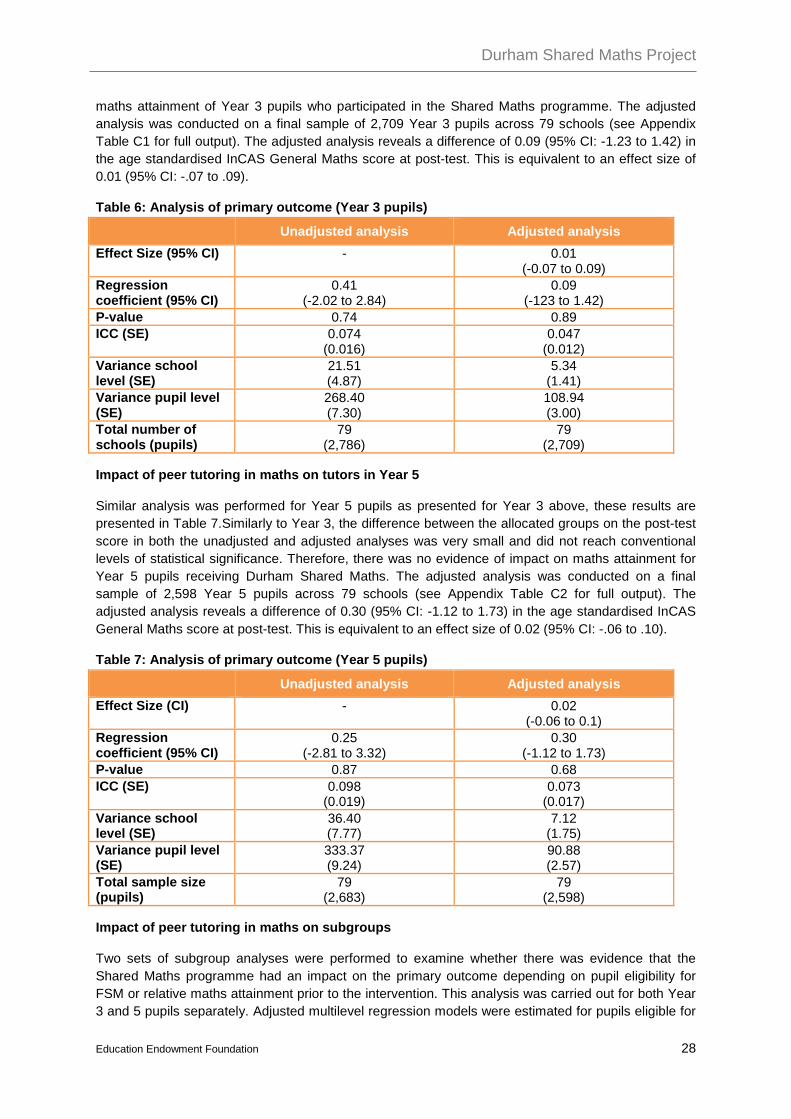
Table 6 reports estimates for Year 3 pupils. The difference between the allocated groups on the post-test score in both the adjusted and unadjusted analyses was very small and did not reach conventional levels of statistical significance, indicating that there is no evidence of impact on the
Durham Shared Maths Project
Education Endowment Foundation 28
maths attainment of Year 3 pupils who participated in the Shared Maths programme. The adjusted analysis was conducted on a final sample of 2,709 Year 3 pupils across 79 schools (see Appendix Table C1 for full output). The adjusted analysis reveals a difference of 0.09 (95% CI: -1.23 to 1.42) in the age standardised InCAS General Maths score at post-test. This is equivalent to an effect size of 0.01 (95% CI: -.07 to .09).
Table 6: Analysis of primary outcome (Year 3 pupils)
Unadjusted analysis Adjusted analysis Effect Size (95% CI) - 0.01
(-0.07 to 0.09) Regression coefficient (95% CI)
0.41 (-2.02 to 2.84)
0.09 (-123 to 1.42)
P-value 0.74 0.89 ICC (SE) 0.074
(0.016) 0.047
(0.012) Variance school level (SE)
21.51 (4.87)
5.34 (1.41)
Variance pupil level (SE)
268.40 (7.30)
108.94 (3.00)
Total number of schools (pupils)
79 (2,786)
79 (2,709)
Impact of peer tutoring in maths on tutors in Year 5
Similar analysis was performed for Year 5 pupils as presented for Year 3 above, these results are presented in Table 7.Similarly to Year 3, the difference between the allocated groups on the post-test score in both the unadjusted and adjusted analyses was very small and did not reach conventional levels of statistical significance. Therefore, there was no evidence of impact on maths attainment for Year 5 pupils receiving Durham Shared Maths. The adjusted analysis was conducted on a final sample of 2,598 Year 5 pupils across 79 schools (see Appendix Table C2 for full output). The adjusted analysis reveals a difference of 0.30 (95% CI: -1.12 to 1.73) in the age standardised InCAS General Maths score at post-test. This is equivalent to an effect size of 0.02 (95% CI: -.06 to .10).
Table 7: Analysis of primary outcome (Year 5 pupils)
Unadjusted analysis Adjusted analysis Effect Size (CI) - 0.02
(-0.06 to 0.1) Regression coefficient (95% CI)
0.25 (-2.81 to 3.32)
0.30 (-1.12 to 1.73)
P-value 0.87 0.68 ICC (SE) 0.098
(0.019) 0.073
(0.017) Variance school level (SE)
36.40 (7.77)
7.12 (1.75)
Variance pupil level (SE)
333.37 (9.24)
90.88 (2.57)
Total sample size (pupils)
79 (2,683)
79 (2,598)
Impact of peer tutoring in maths on subgroups
Two sets of subgroup analyses were performed to examine whether there was evidence that the Shared Maths programme had an impact on the primary outcome depending on pupil eligibility for FSM or relative maths attainment prior to the intervention. This analysis was carried out for both Year 3 and 5 pupils separately. Adjusted multilevel regression models were estimated for pupils eligible for

Durham Shared Maths Project
Education Endowment Foundation 29
FSM. In addition analysis specified in the EEF policy on analysis for evaluations (i.e. subgroup analysis on FSM pupils), separate exploratory analyses for those who scored below and above the mean on the InCAS General Maths assessment at pre-test.12
Amongst the 554 Year 3 pupils eligible for FSM there is no evidence of impact on the primary outcome by the allocation groups; results reveal a difference between allocated groups equivalent to an effect size of -0.05 but this did not reach conventional levels of statistical significance (95% CI:-.17 to .07). The equivalent result for the Year 5 sample, which comprised 535 pupils eligible for FSM, was an effect size of 0.05 and again did not reach conventional levels of statistical significance (95% CI: -.09 to .19). Full results from these analyses are presented in Appendix D (see Tables D1 to D4 for the Year 3 and Year 5 samples, including interaction analysis).
Separate analyses were conducted for pupils in Years 3 and 5 for those who scored above and below the mean on the InCAS General Maths score at pre-test. For Year 3 pupils who scored above the mean (n=1,412) an effect size of 0.05 (95% CI: -.17 to .07) was found whilst for those below the mean score (n=1,297) an effect size of -0.05 (95% CI: -.07 to .17) was observed. For Year 5 pupils who scored above the mean (n=1,025) at pre-test the equivalent effect size was 0.03 (95% CI:-.10 to .14) and for those who scored below (n=1,573) this was 0.02 (95% CI: -.10 to .14). However, none of these findings were statistically significant. Full results from these analyses, including interaction analysis are presented in Appendix D (Tables D5 to D12).
Analysis of the secondary outcomes: attitudes towards school
Similarly to the analysis of the primary outcome, the preliminary analysis based only on the post measurements of attitudes towards school was carried out. This analysis does not take into account the level of the attitudes measured in the pre-test or pupil characteristics. The results for Year 3 pupils are displayed in Table 8 and indicate that the mean level of these attitudes in the intervention group (57.42) and control group (57.90) are very similar. The sample of Year 3 students (with measurements on the post-test) consists of 2,429 pupils across 73 schools. Post-test scores were missing for 21.97 per cent of randomised pupils in intervention schools and 31.32 per cent of pupils in control schools.
Table 8: Unadjusted average scores Year 3 pupils (attitudes towards school) Intervention Control Total Sample as analysed schools
n=36 n=37 n=73
Sample as analysed pupils
n=1,328 n=1,101 n=2,429
Primary outcome Attitudes towards School Post Test Score Mean (SD) 57.42 (37.42) 57.90 (39.56) 57.64 (38.40) Median (Min, Max) 65.43 (-100. 100) 69.43 (-100,100)
67.14 (-100, 100) Missing (% of those randomised)
21.97% 31.32% 26.51%
12 Further exploratory analysis by the level of exposure to the programme and its various features would have been desirable. However, the trial design was determined prior to the NatCen evaluation team’s involvement and was not set up to address questions such as pupil attendance at the programme; teacher attendance to teacher training and pupil attendance at the tutor training. Thus, the analysis does not include the analysis of dose-response.

Durham Shared Maths Project
Education Endowment Foundation 30
A similar analysis was carried out for Year 5 pupils. Table 9 reports the results. While the difference in the mean level of attitudes towards school is slightly larger (compared to the one obtained for Year 3 pupils), the two values are still very close. The difference between the mean value for the intervention group (49.36) and control group (51.15) pupils is negligible. Post-test score were missing for 20.13% per cent of randomised pupils in the intervention schools and for 33.35% for pupils in control schools.
Table 9: Unadjusted average scores Year 5 pupils (attitudes towards school) Intervention Control Total Sample as analysed schools
n=37 n=37 n=74
Sample as analysed pupils
n=1,270 n=1,051 n=2,321
Primary outcome Attitudes towards School Post Test Score Mean (SD) 49.36 (35.03) 51.15 (34.71) 50.17 (34.89) Median (Min, Max) 54.93 (-92.86, 100) 56.86 (-100, 100) 56.43 (-100, 100) Missing (% of those randomised)
20.13% 33.35% 26.71%
Impact of peer tutoring in maths on the attitudes to school for tutees in Year 3
The analysis of the impact of the treatment on attitudes to school was carried out using a multi-level regression model. The analysis was implemented following the technical specification as set out for the analysis of the primary outcome. Following that strategy, data on Year 3 and Year 5 pupils were analysed in separate models. For each year group two models (analyses) were carried out. The unadjusted model only includes the allocation to treatment / control group as an explanatory variable. The second model, the adjusted model, includes baseline measures as covariates. These covariates were students’ attitudes towards school as measured in the pre-test, month of birth, sex, ethnicity, EAL, eligibility for FSM and area. The results of both the adjusted and unadjusted analyses are reported in the same table.
Table 10 displays the results for Year 3 pupils. The difference between the treatment and the control groups on the post-test measuring attitudes towards school was very small and did not attain statistical significance. This indicates that there is no evidence of any impact on the attitudes towards school for Year 3 pupils who participated in the Shared Maths programme. The adjusted analysis was implemented on a sample of 1,878 Year 3 pupils across 55 schools (see Appendix E, Table E1 for full regression results). The adjusted analysis reveals a difference of 0.05 (95% CI: -4.74 to 4.85) in the level of the attitudes towards school measured at post-test. This is equivalent to an effect size of 0.001 (95% CI: -0.0129 to 0.131).
Table 10: Analysis of secondary outcome - Year 3 pupils (attitudes towards school)
Unadjusted analysis Adjusted analysis Effect Size (95% CI) - 0.001
(-0.129 to 0.131) Regression coefficient (95% CI)
-1.26 (-6.79 to 4.27)
0.05 (-4.74 to 4.85)
P-value 0.65 0.98 ICC (SE) 0.062
(0.015) 0.030
(0.011) Variance school level (SE)
91.94 (23.00)
37.47 (14.45)
Variance pupil level (SE)
1382.21 (40.22)
1218.82 (40.32)
Total number of schools (pupils)
73 (2,429)
55 (1,878)

Durham Shared Maths Project
Education Endowment Foundation 31
Impact of peer tutoring in maths on the attitudes to school for tutors in Year 5
A similar analysis was conducted for pupils in Year 5. The results are displayed in Table 11. The difference between the treatment and control groups on the post-test measure of attitudes towards school was not statistically significant. Therefore, there was no evidence of impact on attitudes towards school for Year 5 pupils who acted as tutors in the Durham Shared Maths programme. The adjusted analysis was conducted on a final sample of 1,836 Year 5 pupils across 60 schools (see Appendix E, Table E2 for full regression output). The adjusted analysis reveals a difference of 0.96 (95% CI: -3.78 to 5.69) in the level of the attitudes towards school at post-test. This is equivalent to an effect size of 0.03 (95% CI: -0.11 to 0.17).
Table 11: Analysis of secondary outcome - Year 5 pupils (attitudes towards school)
Unadjusted analysis Adjusted analysis Effect Size (CI) - 0.03
(-0.11 to 0.17) Regression coefficient (95% CI)
-2.37 (-7.44 to 2.70)
0.96 (-3.78 to 5.69)
P-value 0.36 0.69 ICC (SE) 0.062
(0.015) 0.046
(0.015) Variance school level (SE)
74.84 (19.87)
44.43 (15.00)
Variance pupil level (SE)
1147.51 (34.21)
922.89 (30.94)
Total sample size (pupils)
74 (2,321)
60 (1,836)
Impact of peer tutoring in maths on attitudes to school for subgroups
In order to examine whether there was evidence of the Shared Maths programme having an impact on attitudes to school depending on pupil eligibility for FSM, the analyses for both Year 3 and Year 5 pupils were carried out. A multilevel modelling strategy was used to produce the results for the adjusted models.
There were 338 Year 3 pupils eligible for FSM who were included in the analysis. The results indicate that there is no evidence of impact on attitudes towards school by the allocation groups; results reveal a difference between the intervention and the control groups equivalent to an effect size of 0.09 which did not reach conventional levels of statistical significance (95% CI:-0.15 to 0.33). The equivalent result for the Year 5 sample, which comprised 345 pupils eligible for FSM, was an effect size of 0.13 and again did not reach conventional levels of statistical significance (95% CI: -0.11 to 0.37). Full results from these analyses are presented in Appendix E (see Tables E3 to E8 for the Year 3 and Year 5 samples, including interaction analysis).
Analysis of the secondary outcomes: Attitudes towards reading
Attitudes towards reading were included in the analysis as secondary outcomes. Following the same analytical approach as before, the analysis first focuses on the post-measurements of attitudes towards reading. The analysis was carried out separately for Year 3 and Year 5 pupils. Table 12 displays the results for Year 3 pupils. The results indicate that the mean levels of the attitude in the intervention group (48.55) and the control group (49.81) groups are very similar. The sample of Year 3 pupils consists of 2,429 pupils across 73 schools. Post-test scores were missing for 21.97 per cent of randomised pupils in intervention schools and 31.32 per cent of pupils in control schools.

Durham Shared Maths Project
Education Endowment Foundation 32
Table 12: Unadjusted average scores Year 3 pupils (attitudes towards reading) Intervention Control Total Sample as analysed schools
n=36 n=37 n=73
Sample as analysed pupils
n=1,328 n=1,101 n=2,429
Primary outcome Attitudes towards Reading Post Test Score Mean (SD) 48.55 (42.90) 49.81 (42.47) 49.12 (42.70) Median (Min, Max) 59.22 (-100. 100) 60.00 (-100,100)
59.8 (-100, 100) Missing (% of those randomised)
21.97% 31.32% 26.51%
The results of the analysis carried out for Year 5 pupils are displayed in Table 13. The difference in the mean, once again, shows very little movement between the two experimental groups. The average value for the intervention group (44.66) and control group (43.26) pupils is very small. Post-test score were missing for 20.13% per cent of randomised pupils in the intervention schools and for 33.35% for pupils in control schools. The analysis was carried out on a total sample of 2,321 pupils.
Table 13: Unadjusted average scores Year 5 pupils (attitudes towards reading) Intervention Control Total Sample as analysed schools
n=37 n=37 n=74
Sample as analysed pupils
n=1,270 n=1,051 n=2,321
Primary outcome Attitudes towards Reading Post Test Score Mean (SD) 44.66 (41.66) 43.26 (41.55) 44.03 (41.61) Median (Min, Max) 51.4 (-92.86, 100) 50.4 (-100, 100) 50.8 (-100, 100) Missing (% of those randomised)
20.13% 33.35% 26.71%
Impact of peer tutoring in maths on the attitudes towards reading for tutees in Year 3
The analysis of the impact of the Shared Maths programme on attitudes towards reading was conducted using a multi-level regression model. A similar modelling strategy to that described in the previous sections was implemented. The adjusted model includes a set of covariates which contain pupils’ attitudes towards reading as measured in the pre-test, month of birth, sex, ethnicity, EAL, eligibility for FSM and area. The results of both the adjusted and unadjusted analyses are reported in the same table.
The results for Year 3, displayed in Table 14, indicate that the difference between the intervention and the control groups on the post-test pertaining to attitudes towards reading did not reach statistical significance at conventional levels. This indicates that there is no evidence of any impact of the Shared Maths programme on the attitudes towards reading for Year 3 pupils. The adjusted analysis was implemented on a sample of 1,878 Year 3 pupils across 55 schools (see Appendix F, Table F1 for full regression results). The adjusted analysis indicates a difference of -2.74 (95% CI: -7.65 to 2.17) in the level of the attitudes towards reading. This is equivalent to an effect size of -0.06 (95% CI: -0.18 to 0.06).
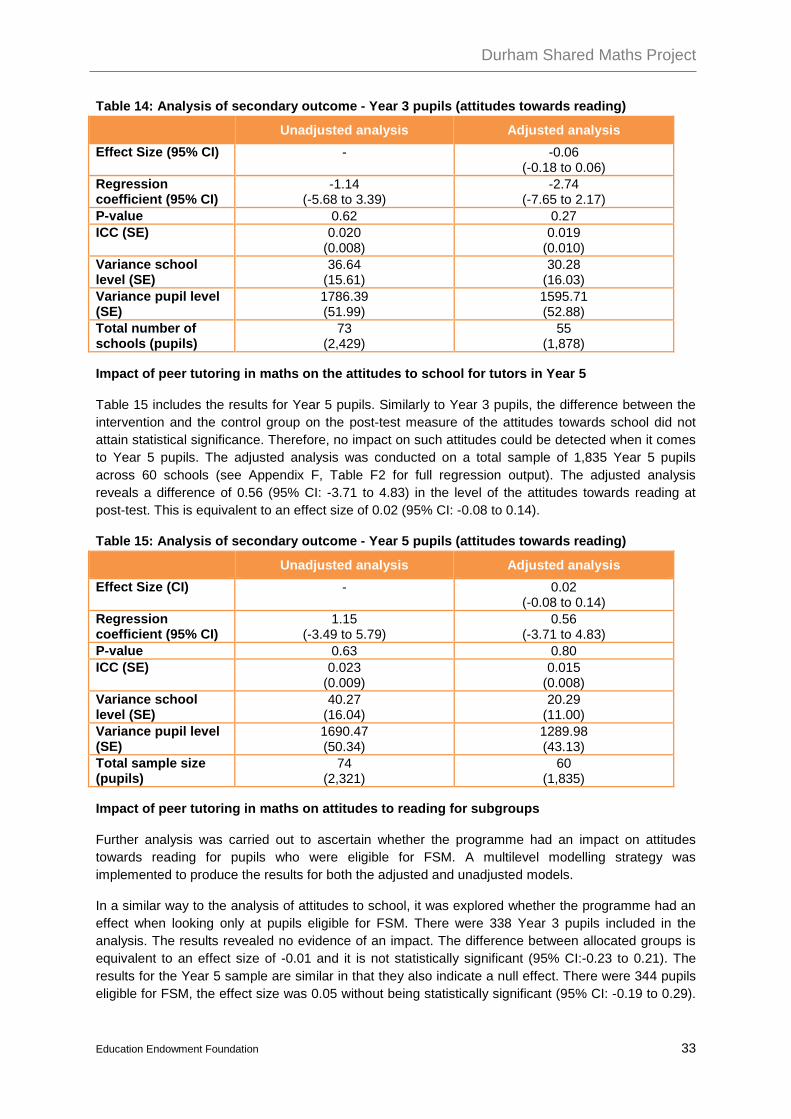
Durham Shared Maths Project
Education Endowment Foundation 33
Table 14: Analysis of secondary outcome - Year 3 pupils (attitudes towards reading)
Unadjusted analysis Adjusted analysis Effect Size (95% CI) - -0.06
(-0.18 to 0.06) Regression coefficient (95% CI)
-1.14 (-5.68 to 3.39)
-2.74 (-7.65 to 2.17)
P-value 0.62 0.27 ICC (SE) 0.020
(0.008) 0.019
(0.010) Variance school level (SE)
36.64 (15.61)
30.28 (16.03)
Variance pupil level (SE)
1786.39 (51.99)
1595.71 (52.88)
Total number of schools (pupils)
73 (2,429)
55 (1,878)
Impact of peer tutoring in maths on the attitudes to school for tutors in Year 5
Table 15 includes the results for Year 5 pupils. Similarly to Year 3 pupils, the difference between the intervention and the control group on the post-test measure of the attitudes towards school did not attain statistical significance. Therefore, no impact on such attitudes could be detected when it comes to Year 5 pupils. The adjusted analysis was conducted on a total sample of 1,835 Year 5 pupils across 60 schools (see Appendix F, Table F2 for full regression output). The adjusted analysis reveals a difference of 0.56 (95% CI: -3.71 to 4.83) in the level of the attitudes towards reading at post-test. This is equivalent to an effect size of 0.02 (95% CI: -0.08 to 0.14).
Table 15: Analysis of secondary outcome - Year 5 pupils (attitudes towards reading)
Unadjusted analysis Adjusted analysis Effect Size (CI) - 0.02
(-0.08 to 0.14) Regression coefficient (95% CI)
1.15 (-3.49 to 5.79)
0.56 (-3.71 to 4.83)
P-value 0.63 0.80 ICC (SE) 0.023
(0.009) 0.015
(0.008) Variance school level (SE)
40.27 (16.04)
20.29 (11.00)
Variance pupil level (SE)
1690.47 (50.34)
1289.98 (43.13)
Total sample size (pupils)
74 (2,321)
60 (1,835)
Impact of peer tutoring in maths on attitudes to reading for subgroups
Further analysis was carried out to ascertain whether the programme had an impact on attitudes towards reading for pupils who were eligible for FSM. A multilevel modelling strategy was implemented to produce the results for both the adjusted and unadjusted models.
In a similar way to the analysis of attitudes to school, it was explored whether the programme had an effect when looking only at pupils eligible for FSM. There were 338 Year 3 pupils included in the analysis. The results revealed no evidence of an impact. The difference between allocated groups is equivalent to an effect size of -0.01 and it is not statistically significant (95% CI:-0.23 to 0.21). The results for the Year 5 sample are similar in that they also indicate a null effect. There were 344 pupils eligible for FSM, the effect size was 0.05 without being statistically significant (95% CI: -0.19 to 0.29).

Durham Shared Maths Project
Education Endowment Foundation 34
The full results from these analyses are presented in Appendix F (see Tables F3 to F8 for the Year 3 and Year 5 samples, the interaction analyses are also included).
Analysis of the secondary outcomes: Attitudes towards maths
Attitudes towards maths formed the final secondary outcome that was analysed. The same analysis strategy was followed as before starting with the analysis of the post-test measurements of attitudes towards maths. The analysis was carried out separately for Year 3 and Year 5 pupils. Table 16 displays the results for Year 3 pupils and indicates that the mean levels of the attitude in the intervention group (46.40) and the control group (44.03) groups are very similar. The sample of Year 3 students consists of 2,429 pupils across 73 schools. Post-test scores were missing for 21.97 per cent of randomised pupils in intervention schools and 31.32 per cent of pupils in control schools.
Table 16: Unadjusted average scores Year 3 pupils (attitudes towards maths) Intervention Control Total Sample as analysed schools
n=36 n=37 n=73
Sample as analysed pupils
n=1,328 n=1,101 n=2,429
Primary outcome Attitudes towards Maths Post Test Score Mean (SD) 46.40 (44.79) 44.03 (45.84) 45.33 (45.28) Median (Min, Max) 52.5 (-100. 100) 50.75 (-100,100)
51.5 (-100, 100) Missing (% of those randomised)
21.97% 31.32% 26.51%
Table 17 displays the results for Year 5 pupils. The difference between the means indicates that there is very little difference between the pupils in two experimental arms. The difference between the average level of attitudes towards maths for the intervention group (32.61) and control group (35.99) pupils was small and did not attain statistical significance. Post-test score were missing for 20.13 per cent of randomised pupils in intervention schools and for 33.35 per cent for pupils in control schools. The analysis was carried out on a total sample of 2,321 pupils.
Table 17: Unadjusted average scores Year 5 pupils (attitudes towards maths) Intervention Control Total Sample as analysed schools
n=37 n=37 n=74
Sample as analysed pupils
n=1,270 n=1,051 n=2,321
Primary outcome Attitudes towards Maths Post Test Score Mean (SD) 32.61 (38.13) 35.99 (37.47) 34.14 (37.87) Median (Min, Max) 35.8 (-99.6, 100) 40.4 (-91.2, 100) 39.4 (-100, 100) Missing (% of those randomised)
20.13% 33.35% 26.71%
Impact of peer tutoring in maths on the attitudes towards maths for tutees in Year 3
Similarly to other outcomes of interest, a multi-level modelling was used to explore what effect the Shared Maths programme had on attitudes towards maths. A similar modelling strategy to that described in the previous sections was implemented. The adjusted model includes the same covariates as the previous models, except it now contains the pre-test scores for pupils’ attitudes towards maths.

Durham Shared Maths Project
Education Endowment Foundation 35
The results for both the unadjusted and adjusted model for Year 3 are presented in Table 18 and indicate that the difference between the intervention and the control groups on attitudes towards maths were not statistically significant at conventional levels. This indicates that there is no evidence of any impact of the Shared Maths programme on the attitudes towards maths for Year 3 pupils. The adjusted analysis was implemented on a sample of 1,876 Year 3 pupils across 55 schools (see Appendix G, Table G1 for full regression results). The adjusted analysis indicates a difference of 1.74 (95% CI: -3.93 to 7.41) in the level of the attitudes towards maths. This is equivalent to an effect size of -0.06 (95% CI: -3.93 to 7.41).
Table 18: Analysis of secondary outcome - Year 3 pupils (attitudes towards maths)
Unadjusted analysis Adjusted analysis Effect Size (95% CI) - 0.04
(-0.09 to 0.17) Regression coefficient (95% CI)
1.02 (-4.58 to 6.63)
1.74 (-3.93 to 7.41)
P-value 0.72 0.55 ICC (SE) 0.038
(0.011) 0.029
(0.012) Variance school level (SE)
77.83 (23.55)
51.19 (21.13)
Variance pupil level (SE)
1971.53 (57.36)
1745.01 (57.83)
Total number of schools (pupils)
73 (2,429)
55 (1,876)
Impact of peer tutoring in maths on the attitudes to school for tutors in Year 5
The results for Year 5 pupils are included in Table 19. The difference between the intervention and control groups in the post-test did not reach statistical significance at conventional levels. As such, there is no evidence that Shared Maths had any effect on Year 5 pupils. The adjusted analysis was conducted on a total sample of 1,836 pupils across 60 schools (see Appendix G, Table G2 for full regression output). The adjusted analysis reveals a difference of -3.31 (95% CI: -7.93 to 1.31) in the level of attitudes towards maths at post-test. This is equivalent to an effect size of -0.09 (95% CI: -0.22 to 0.04).
Table 19: Analysis of secondary outcome - Year 5 pupils (attitudes towards maths)
Unadjusted analysis Adjusted analysis Effect Size (CI) - -0.09
(-0.22 to 0.04) Regression coefficient (95% CI)
-3.19 (-7.56 to 1.17)
-3.31 (-7.93 to 1.31)
P-value 0.15 0.16 ICC (SE) 0.027
(0.010) 0.030
(0.011) Variance school level (SE)
38.79 (13.92)
34.83 (12.90)
Variance pupil level (SE)
1390.43 (41.38)
1119.13 (37.41)
Total sample size (pupils)
74 (2,321)
60 (1,836)

Durham Shared Maths Project
Education Endowment Foundation 36
Impact of peer tutoring in maths on attitudes to maths for subgroups
Finally, an analysis was implemented to ascertain whether the programme had an impact on attitudes towards maths for pupils who were eligible for FSM. A multilevel modelling strategy was used to produce the results for the adjusted models.
There were 338 Year 3 pupil included in the analysis exploring the effect of intervention on pupils eligible for FSM. The difference found between the intervention and the control groups is equivalent to an effect size of 0.19 but it does not reach conventional levels of statistical significance (95% CI:-0.05 to 0.43). There were 345 pupils eligible for FSM in Year 5. The effect size was -0.03 and was not statistical significant (95% CI: -0.25 to 0.19). The full results from these analyses are presented in Appendix G (see Tables G3 to G8 for the Year 3 and Year 5 samples, the interaction analyses are also included).
Cost
The costs connected with the delivery of the Shared Maths programme have been provided by the Durham Shared Maths delivery team. Several assumptions have been made when considering the cost of the programme to schools. These include:
• 20 schools take part per local authority area • 80 children per school take part • the programme lasts for 16 weeks of the school year
Local Co-ordinator costs include training the teachers, class observations, ongoing school support and coordinators’ own CPD. It is estimated that this would cost a total of £600 per school (or £7.50 per child).
Materials required for schools would just be a copy of the manual for each teacher involved. This is expected to cost £20 - £40 for each manual. For a Year 3 and Year 5 teacher to each have a copy, it is assumed this will cost £60 per school.
Teacher training – it is assumed that teachers would take part in twilight sessions. There would be no additional cost beyond ordinary CPD costs. In addition, training costs such as travel and the training venue are assumed to be negligible as these would take place within local authority venues or in schools.
Additional work-load for teachers – as it is recommended that Year 3 and Year 5 teachers meet to discuss the maths questions and to assess pupil progress on the programme incurring additional planning, preparation and assessment time. Over the 16 week period this has been estimated at 2 hours 40 minutes of each teacher’s time.
Based on the assumptions listed above the cost of the programme per 16 week block delivered over one academic year, is £660 per school. This translates into a unit cost of £8.25 per pupil per academic year.

Durham Shared Maths Project
Education Endowment Foundation 37
Process evaluation
As explained in the previous chapter, there is no evidence that the Shared Maths programme has an impact on the maths attainment of participating Year 3 or Year 5 pupils, compared to those pupils in the control schools. Therefore, the process evaluation helps us to explore three important questions:
1. Were there issues during implementation that made delivery of the Shared Maths pedagogy, as part of the existing maths curriculum, challenging?
2. Were there differences between the way the Shared Maths was designed as set out in the handbook and used in practice during the trial, resulting in a lack of fidelity to the programme?
3. Were there any perceived benefits reported by staff to pupils' maths ability, or other unintended consequences?
In this chapter findings from class observations and depth interviews are summarised in five themes:
• Implementation • Fidelity to the programme • Barriers • Perceived impacts, and • Sustainability.
Implementation
This section details issues around setting up the programme within schools, including the role of the Local Co-ordinators, the training provided to participating teachers, pupil pairing and issues around training the pupil tutors and tutees.
Overall, teachers received sufficient training to deliver the Shared Maths programme; Local Co-ordinators offered support when needed; pupils were paired up and received training. Whilst there was some variation in how easy teachers found implementation, they succeeded in developing questions that they considered appropriate for their class.
Local Co-ordinators
Local Co-ordinators were responsible for initial teacher training, observations to monitor delivery, providing support for schools and acted as an intermediary between schools and the Durham Shared Maths delivery team throughout the project.
Although the professional background of the Local Co-ordinators varied, there were two areas of expertise and experience that were considered as advantageous to successfully carrying out the role:
• A teaching background: this provided a good knowledge of the internal workings of schools and classrooms.
• Familiarity with the geographical area: this provided greater awareness of the pupil populations and issues in individual schools so Local Co-ordinators were able to tailor solutions to any issues arising more easily.
The Local Co-ordinators received training from the Shared Maths team during the school term prior to implementation. Overall, Local Co-ordinators were positive about the training received and felt that it ‘more than sufficiently’ prepared them for the programme - they reported feeling confident running training sessions for schools in their area, and supporting teachers with any issues they faced. Training materials were considered comprehensive and a helpful source for school training.

Durham Shared Maths Project
Education Endowment Foundation 38
Throughout delivery of the Shared Maths programme, Local Co-ordinators reported receiving an adequate level of support from the delivery team, who they found approachable. The Local Co-ordinators and delivery team were in frequent contact with each other with Co-ordinators, voicing any concerns and suggestions about changes for further delivery and these were taken on board by the delivery team.
The early stages of the programme set up and delivery was particularly resource intensive for Local Co-ordinators when they were working to engage schools in the programme. This was considered as an important investment and ‘time well spent’ to ensure that schools were fully ‘on board’ with the programme.
Teachers and Local Co-ordinators agreed that the demand for tailored support required after training was lower than they were expecting. There were a number of reasons why teachers did not try to access this support:
• Accessing support was impractical when in a classroom setting (e.g. during the Shared Maths sessions) and teachers felt comfortable finding quick on the spot solutions
• No queries or issues were experienced • Resolution was found elsewhere from the handbook or other school staff members to follow
school protocol.
Overall teachers who sought support or advice felt that they received this and found it helpful.
Local Co-ordinators observed Shared Maths taking place in classrooms and provided feedback to teachers. Teachers felt that observations were an important part of the programme as they needed reassurance that the programme was being delivered as intended. These data were also fed back to the Durham team for further analysis and feedback to Local Co-ordinators as part of the training and support.
Training for participating teachers
Local Co-ordinators delivered the teacher training and as a consequence the exact format and content differed slightly between areas. On the whole, the key principals of the programme were delivered to teachers consistently.
Most teachers attended two sessions:
• The first before the programme began, which included:
o An explanation of the programme and how it would be evaluated o Video examples of pupils taking part in the programme o Guidance on how to pair pupils.
• The second was a shorter session that took place once the programme had started and gave teachers the opportunity to:
o Discuss any issues that had arisen, o Share ideas and o Put questions to the trainer.
In general teachers found both training sessions were enjoyable, thorough, informative and helpful which enthused and motivated them to implement the programme.
For Local Co-ordinators, having a number of schools attend the same training session was a way of facilitating dialogue between teachers and encouraging them to interact with one another as the programme progressed as a form of peer support.

Durham Shared Maths Project
Education Endowment Foundation 39
“Because of the huge numbers of EAL pupils we have in our school, some of our teachers felt that [shared maths] might not work… they were worried about what to do with the children and how to pair them…but there were similar schools to ours at the training and it was quite nice to see that we were not the only school that was going to deal with these sorts of challenges…we had plenty of time to talk about this together…and that helped us and pushed us to go forward.”
Schools with a greater number of pupils with specific needs reported finding the training ‘challenging’ and were concerned that the videos showing the programme in practice featured children who were ‘middle class’ and from ‘leafy suburban’ schools. They expressed concerns that the programme would be difficult to implement in their school for pupils with EAL, high absenteeism and serious behaviour issues in class. Not all teachers felt that these concerns were addressed at the training, particularly questions around EAL pupils not being able to access the programme due to language barriers.
“We were constantly told that we need to step back and let the children do everything but people were kind of worried that the children would sit there and do nothing. We didn’t really get answers to those questions.”
Training pupils to be tutors and tutees
Teachers were responsible for training pupils and followed the Shared Maths Handbook for guidance on how to do this. However, teachers were given some flexibility in the format and exact content of this training which led to some variation in training delivery. During the training most teachers showed videos and explained the roles of the tutor and tutee in the programme.
Some teachers ‘sold’ the programme to their pupils in order to get them on board. In particular they wanted tutors ‘to feel that they are going to be doing something really important’.
Before the first Shared Maths session started, some teachers felt that it was very important that the pair felt comfortable with each other. This was believed to make the Shared Maths sessions feel less formal. To help with this some schools ran ‘get to know you’ activities within the training, introducing pairs and organising fun activities unrelated to maths. Some ran practice sessions to ensure the pairs worked well together and that the Shared Maths approach had been understood fully by pupils before the main paired work began.
Teachers reported that pupils were initially excited about taking part in Durham Shared Maths, particularly going into different classrooms, doing something new and different to their usual maths classes and, for tutors, there was a sense of responsibility attached to their role.
Pairing pupils
Most teachers put their pupils into pairs based almost solely on pupils’ Key Stage ability levels as guided. The concept of matching high ability Year 3 pupils with high ability Year 5 pupils and low ability Year 3 pupils with low ability Year 5 pupils made sense to teachers. As guided the second step to pairing was based on teachers’ professional judgement which took into account other factors such as personality, existing social relationships and additional needs (e.g. behaviour issues, SEN or EAL). Overall teachers considered pairing pupils a relatively straightforward process.
When reflecting on how paired pupils had worked together at the end of the project some teachers reported that in retrospect they would have placed more emphasis on pupils’ personalities when matching pairs as they could see once the programme was underway the effect this had. Teachers felt that it was important to regularly monitor the pairs in order to ensure they were still working effectively. For schools with highly transient pupil populations, the matching of pupils was more of a continual process than an exercise carried out at the start of the programme.
Durham Shared Maths Project
Education Endowment Foundation 40
Developing questions for Shared Maths sessions
Teachers, on the whole, reported that Shared Maths sessions took a similar time to prepare for as other maths lessons. However, there were differences between Year 3 and Year 5 teachers. Year 3 teachers often reported to be the ones responsible for preparing questions or problems suited to the ability levels of their pupils.
“As a Year 5 teacher it’s very, very straight forward for me to deliver. I’m really providing the tutors for [the Year 3 teacher] and then the rest of it is…well she does a lot of work to get that all sorted.”
Preparing the maths questions for Shared Maths sessions and ensuring these were suitable for both the tutors’ and the tutees’ current scheme of work was the largest and most complex preparation task.
“It has been a bit of a struggle to get resources together… pitching questions at the right level [for tutors and tutees], making sure there’s going to be enough questions, finding different questions each week, it can be a struggle to find them sometimes but we’re getting through it.”
For Local Co-ordinators, what set some schools apart from others was teachers who were more successful in devising questions that were appropriate for the range of both tutor and tutee abilities. This may have included real-world example questions, such as ‘If Polly had two loaves of bread and gave one to Tommy’ rather than simple maths equations. Participants were encouraged to share good ideas and add them to the online question bank. Inevitably, as individual teachers were creating their own questions, the appropriateness, style and level of these varied by teacher across the Shared Maths programme as aimed by the Shared Maths pedagogical approach.
Fidelity
Shared Maths has a prescribed format which includes working in pairs through a three step approach. Based on interviews and supported by the two lesson observations carried out in one school it appears that schools followed the approach well, with only minor differences. Pupil ability led to some variation in how well each step was applied and completed. Staff felt they had to support lower ability pupils more and that this could have reduced their support for the rest of the class. The ways in which schools deviated from the original model are discussed in this section.
Adhering to the model
The Shared Maths Handbook outlines how tutors should approach each maths question in three main steps:
1) Understanding the question; 2) Finding an answer to the question; and, 3) Finishing the question by checking, summarising and linking to other learning and real life.
Generally teachers were positive about this ‘stepped approach’ and believed it helped organise pupils’ thinking and break down the task. Interviews and observations gave an indication that there was some non-adherence to the steps set out in the original model reported. Sometimes the steps appeared to be only used when considered appropriate or their use was reduced over time, in other cases tutors developed their own style of questioning and tutoring, often finding a quicker way to answer the question. The variation in some of the key steps in the approach is described in more detail below.
Finding the answer to the question
Durham Shared Maths Project
Education Endowment Foundation 41
This was particularly challenging for lower ability tutors where both their maths and literacy levels were lower, meaning they struggled to access, understand and answer the questions themselves, let alone help their tutee. There were several ways in which teachers tried to tackle this particular issue:
• Year 5 teachers would use part of their normal maths class to explain how tutors would solve the problem set for the next day. Tutors were more prepared for the lesson and had the opportunity to ask their teacher or their Teaching Assistant for help.
• Teachers added in an additional step which gave pairs multiple-choice options to answer questions. This was to help them solve the maths problems with their tutee and provide the opportunity to talk about why methods were or were not appropriate for use.
• The teacher (or Teaching Assistant) gave struggling pairs additional support within the lesson. This allowed them to address specific issues and provide one-to-one support as needed. However, this meant that staff could be pre-occupied with one lower ability pair throughout the lesson which limited the time available to help other pairs.
Some teachers reported that lower ability tutors often told tutees how to solve the question rather than questioning them and listening to them.
‘A lot of them didn’t have the maturity really to kind of take on the teacher role, they found it really, really difficult to kind of sit back and see somebody doing something wrong and not point it out to them straight away…’
For some, this led to another training session being run with tutors where teachers modelled each step, discussed why it was important and provided practical tips.
Thinking out loud
Teachers considered that there was a gap between pupils’ abilities to solve the problems and their ability to explain how they did this through thinking out loud. This was an area they needed to develop more with pupils, and not just within Shared Maths.
The step was valued as vocalising and explaining concepts and resulted in tutors feeling they were ‘play acting at being teachers’ which increased their enjoyment of the session. The vocalisation of concepts was seen as leading to deeper learning by teachers and was extended to other parts of the curriculum.
Finishing the question
Checking other pupils’ answers was not something tutors were used to and only some pupils took to this part of the role easily. Unlike other steps, finishing the question proved challenging for pupils of all abilities, although some teachers reported it particularly affecting the lower ability pairs.
Teachers felt that the Shared Maths sessions were good for pupils, encouraging them to consistently practice the checking step.
‘It’s making them realise that it is a part of maths and that’s how we make sure we get the right answers.’
They also felt this checking practice could be applied to other areas of pupils’ work, including in exams. Some teachers reported that pupils checked their answers in other lessons having learnt it from Shared Maths.
How did you do it? How could you use it?
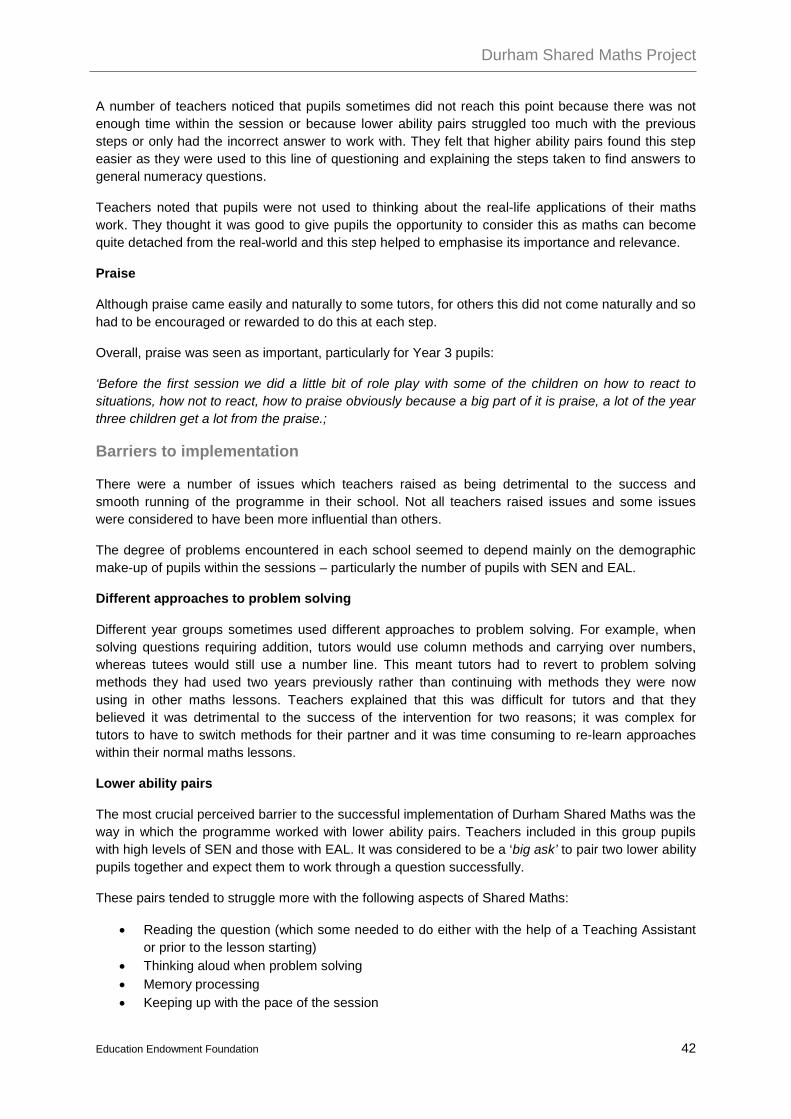
Durham Shared Maths Project
Education Endowment Foundation 42
A number of teachers noticed that pupils sometimes did not reach this point because there was not enough time within the session or because lower ability pairs struggled too much with the previous steps or only had the incorrect answer to work with. They felt that higher ability pairs found this step easier as they were used to this line of questioning and explaining the steps taken to find answers to general numeracy questions.
Teachers noted that pupils were not used to thinking about the real-life applications of their maths work. They thought it was good to give pupils the opportunity to consider this as maths can become quite detached from the real-world and this step helped to emphasise its importance and relevance.
Praise
Although praise came easily and naturally to some tutors, for others this did not come naturally and so had to be encouraged or rewarded to do this at each step.
Overall, praise was seen as important, particularly for Year 3 pupils:
‘Before the first session we did a little bit of role play with some of the children on how to react to situations, how not to react, how to praise obviously because a big part of it is praise, a lot of the year three children get a lot from the praise.;
Barriers to implementation
There were a number of issues which teachers raised as being detrimental to the success and smooth running of the programme in their school. Not all teachers raised issues and some issues were considered to have been more influential than others.
The degree of problems encountered in each school seemed to depend mainly on the demographic make-up of pupils within the sessions – particularly the number of pupils with SEN and EAL.
Different approaches to problem solving
Different year groups sometimes used different approaches to problem solving. For example, when solving questions requiring addition, tutors would use column methods and carrying over numbers, whereas tutees would still use a number line. This meant tutors had to revert to problem solving methods they had used two years previously rather than continuing with methods they were now using in other maths lessons. Teachers explained that this was difficult for tutors and that they believed it was detrimental to the success of the intervention for two reasons; it was complex for tutors to have to switch methods for their partner and it was time consuming to re-learn approaches within their normal maths lessons.
Lower ability pairs
The most crucial perceived barrier to the successful implementation of Durham Shared Maths was the way in which the programme worked with lower ability pairs. Teachers included in this group pupils with high levels of SEN and those with EAL. It was considered to be a ‘big ask’ to pair two lower ability pupils together and expect them to work through a question successfully.
These pairs tended to struggle more with the following aspects of Shared Maths:
• Reading the question (which some needed to do either with the help of a Teaching Assistant or prior to the lesson starting)
• Thinking aloud when problem solving • Memory processing • Keeping up with the pace of the session

Durham Shared Maths Project
Education Endowment Foundation 43
• Checking answers.
‘The EAL children, I don’t I don’t think it really had an effect on them at all. The EAL’s just didn’t have the language, they’d just sit there in their trios and tended to watch but they never really joined in.’
Pupils who had English as an additional language were sometimes a concern for teachers within Shared Maths classes. As explained above, some teachers did not feel they had received clear, consistent guidance on how to manage this within their classes (particularly in Phase 1). Therefore, when delivering Shared Maths sessions these concerns were realised and teachers reported that
In addition, teachers reported that lower ability pairs were more likely to be involved in behaviour incidents in class, and that tutors found it harder to be empathetic with their tutee and struggled more with communicating with their partner (both generally and in particular when using maths language).
There were also cases where the ability level of the tutor was lower than that of the tutee. When tutors were unable to help their tutees, this caused ‘disengagement, embarrassment and a reluctance to continue’.
‘Sometimes they were faced with a sheet with maybe question problems that they couldn’t do, and that can be really disheartening. From talking to the top set teachers that wasn’t so much of an issue but for the children who were in the lower end of my set that certainly was because when you’ve got a Year 3 coming to you with work that you cannot do and you’re two years above them. It can be … soul destroying actually.’
Teachers used a number of different approaches when lower ability pairs were struggling:
• Shared Maths was used as a ‘consolidation tool’. Tutees would explain to the tutors what they had been doing in their recent lessons so that tutors understood the methods and approaches and felt more able to help.
• Tutors were shown the questions in advance of the lesson (usually at the end of an existing Year 5 maths lesson). This gave tutors the opportunity to go through the problem as a group and feel confident that they knew how to approach it during the next Shared Maths session.
• Teachers would go through the task with all pupils in the class before the pairs worked together.
• Teachers produced different levels of questions for different ability levels which enabled the questions to be challenging yet attainable for every pair.
• Where schools had two classes of Shared Maths taking place at the same time some split these into higher and lower ability classes. This was particularly helpful when ‘debriefing’ at the end of the session as pairs would be more honest about what they found challenging.
• Teaching Assistants were used to assist with the lower ability pairs, particularly if there were a high number of SEN pupils in one class.
• Teachers provided more support to lower ability tutors to during the sessions. This meant in some cases that teachers focussed almost solely on certain pairs throughout the session.
• Tutors were given the answers to questions and the workings which teachers believed acted as a ‘comfort blanket’ for low ability tutors.
Some teachers felt that although lower ability pupils took longer to take to the programme, once they did they gained confidence from it to the same extent that higher ability pairs did.
‘In terms of confidence it has boosted both the high ability students and the low ability. In terms of what they are getting I think the higher ability ones are more into getting the answers correct…whereas my low ability benefit from just having a go and trying…I think they’ve all benefitted, they’re not scared of maths as much as I thought they’d be.’

Durham Shared Maths Project
Education Endowment Foundation 44
Perceived Impacts
Teachers reported a number of perceived benefits from participating in Shared Maths, although there were some exceptions, particularly concerning specific groups of children. This section explores the aspects in which teachers perceived the programme to be influencing pupil maths ability, attitudes and soft skills and other perceived benefits on tutees and tutors specifically.
Maths ability
Overall, there were four different opinions regarding whether or not the programme had increased maths ability amongst pairs.
1. The programme had no impact on maths ability but consolidated existing skills and maths knowledge.
2. Any increase in ability could not be associated with the Shared Maths lessons alone as the programme was running alongside normal maths lessons.
3. They had not been participating long enough in the programme to judge if maths ability had improved.
4. Pupils’ reasoning and problem solving abilities improved as the programme increased pupils’ confidence in maths and put into context why different numeracy methods are important.
Teachers spoke about impacts on ability in the context of pupil confidence in maths, problem solving skills, maths knowledge and use of maths language.
Maths confidence
Increased confidence with maths was commonly cited as a benefit by teachers:
• Tutees got a ‘huge boost’ in confidence in their maths ability. The effects of this differed between schools and whilst some reported that it was damaging the confidence of tutors, others felt that it made them more determined to learn and remember their maths skills in order to help their tutees in the future.
• Tutoring others showed the tutors how far they had come in the subject, increasing their confidence and self-esteem by making them ‘suddenly aware of their own progress’.
• Some teachers believed that Shared Maths would have long-lasting effects on their pupils’ confidence in maths and approach to other tasks:
‘I think it probably will have [an impact] on them as individuals and then ultimately in terms of how they approach other things. The impact might not be for us it might be when they go to high school and they do other things and they’ve got the confidence.’
Problem solving skills
Teachers fed back that generally pupils’ problem solving had ‘improved significantly’ since starting the programme.
‘We noticed that with our Year 3s, when they’re outside of Shared Maths their ability in problem solving is much better. And because the Year 5s have had to think through [the question] so that they’re in a position to be able to prompt and guide, they’ve also developed a much more concentrated approach to problem solving.’
For some they considered that the impact was most noticeable among middle and higher ability pupils as they were more able to access and engage with the questions. The stepped approach encouraged pupils to solve problems more logically, and to complete all steps within the problem solving process.

Durham Shared Maths Project
Education Endowment Foundation 45
Teachers reported that these steps were ‘just as relevant in their normal lessons’ and the transferability of these problem solving skills was valued.
‘[The pupils] are learning to ask - what is the problem, what do we know already, how do we solve it.’
Maths knowledge
There was a strong sense amongst teachers that the programme reinforced and consolidated existing maths knowledge and skills which is consistent with the aim of Durham Shared Maths but that these skills were not advanced. Some teachers did feel that under the right circumstances, tutees could benefit from the knowledge of their tutor. However, they needed the opportunity to advance their learning during the programme rather than just ‘gap filling’ or reinforcing existing maths knowledge and skills.
Maths language
The use of maths language is a key issue under the new curriculum and Shared Maths facilitated this. In some schools where speech and language issues due to EAL and disadvantage were prominent maths language and vocabulary amongst pairs was perceived to have improved.
Attitudes and soft skills
Teachers described how in both Year 3 and Year 5 some pupils’ attitudes to maths changed and that they developed important soft skills:
• Pupils enjoyed the Shared Maths lessons; they looked forward to them and found them fun. This was not the case in all schools however and a minority reported that pupils became bored of the process part way through the programme because the structure was the same each week and the ‘novelty’ had worn off
• Pupils’ general enthusiasm for maths, as a subject, improved and this extended to other maths lessons.
‘On a Friday afternoon they want to go and do maths and for us that has been – wow.’
Some teachers understood this be particularly the case amongst pupils who had been reluctant to take part in maths in the past. One explanation given for this was that tutees were more motivated to learn so that they could ‘impress’ their tutors during the Shared Maths sessions.
• Peer led co-learning was the focus of Shared Maths which resulted in minimal teacher instruction.
‘Our children are not by nature, independent learners. So we are always trying to find ways of tapping into that. This has been a good programme for that.’
• Social relationships between pupils in the two year groups had developed. These informal social relationships were perceived to be beneficial the school through the development of social skills and links between different aged children.
‘Across the playground, some of the year 5’s, you might often see them talking to some of the Year 3’s whereas the year before they might not have interacted as they didn’t have anything in common…now they’ve got Shared Maths in common.’
• Working together provided pupils with reassurance about maths and an understanding that maths is something which everybody struggles with at times.

Durham Shared Maths Project
Education Endowment Foundation 46
‘It really is shared, it really does bring everyone together to realise that [maths] is something we all tackle.’
Perceived benefits of participation on tutees and tutors
Some teachers described benefits of participating in Shared Maths on tutors and tutees.
For tutees these included:
• Benefiting from their tutor’s knowledge where pair relationships were good. • Getting ‘reassurance’ by having somebody sat with them to support them with their maths. • Developing and explaining their answers more when problem solving independently. This
included an increase in verbalising their thinking and problem-solving out loud. • Gaining confidence in communicating with older pupils in the school.
‘It’s interesting to see that when the tutor and the tutee are working well together, the ones who are shy do get involved and open up once I have prompted them a few times.’
For tutors the specific perceived benefits included:
• Enjoying the role and responsibility that came with being a tutor. This made tutors feel ‘important’ and as if they were ‘playing’ at being a real teacher for the lesson.
‘Its two o’clock, miss. We need to go and get the Year 3’s.’
• Increasing enthusiasm for the subject itself. Tutors wanted to learn so that they could teach their tutees.
• Improving communication skills as they were using and having to explain quite complex vocabulary.
‘It’s not just about giving them a problem and asking them to do it, it’s about how you then transfer that to someone else and guide someone else to do it… that becomes really useful in terms of just communication really as a key skill.’
• Being able to use and explain their maths knowledge and reinforcing their skills.
‘It means that they can say: ‘I know it really well because not only do I know it but I can actually explain it to someone else’ and that is a real boost.’
Perceived programme sustainability and future use
Future use
In schools where Durham Shared Maths was considered to have been a success, teachers were enthusiastic about continuing with it and were pro-actively seeking opportunities to expand or adapt the programme for use with more pupils.
In cases where teachers were unsure as to whether to continue, this was because they felt that only some pupils had benefited from Shared Maths or they were waiting to see the results of the evaluation to make a decision.
Extending the delivery of Shared Maths and its principles
There were a number of ways in which teachers had extended Shared Maths (or the peer-tutoring concept more generally) within their schools beyond the prescribed programme.
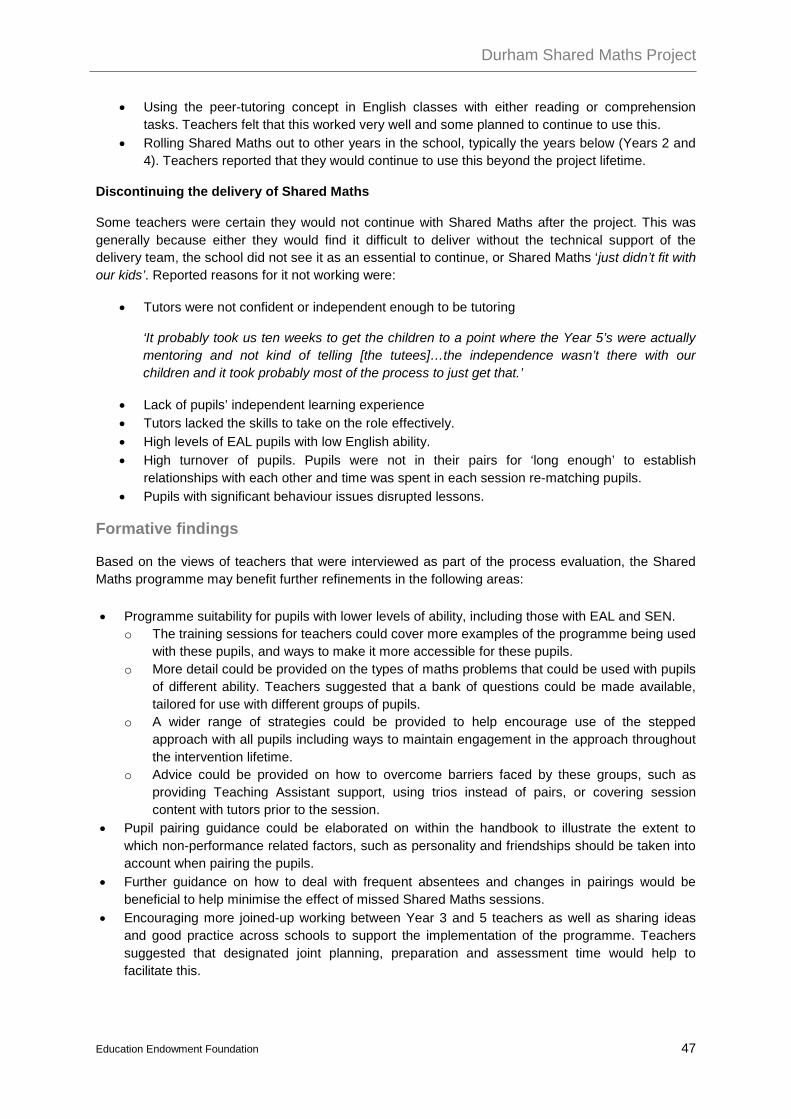
Durham Shared Maths Project
Education Endowment Foundation 47
• Using the peer-tutoring concept in English classes with either reading or comprehension tasks. Teachers felt that this worked very well and some planned to continue to use this.
• Rolling Shared Maths out to other years in the school, typically the years below (Years 2 and 4). Teachers reported that they would continue to use this beyond the project lifetime.
Discontinuing the delivery of Shared Maths
Some teachers were certain they would not continue with Shared Maths after the project. This was generally because either they would find it difficult to deliver without the technical support of the delivery team, the school did not see it as an essential to continue, or Shared Maths ‘just didn’t fit with our kids’. Reported reasons for it not working were:
• Tutors were not confident or independent enough to be tutoring
‘It probably took us ten weeks to get the children to a point where the Year 5’s were actually mentoring and not kind of telling [the tutees]…the independence wasn’t there with our children and it took probably most of the process to just get that.’
• Lack of pupils’ independent learning experience • Tutors lacked the skills to take on the role effectively. • High levels of EAL pupils with low English ability. • High turnover of pupils. Pupils were not in their pairs for ‘long enough’ to establish
relationships with each other and time was spent in each session re-matching pupils. • Pupils with significant behaviour issues disrupted lessons.
Formative findings
Based on the views of teachers that were interviewed as part of the process evaluation, the Shared Maths programme may benefit further refinements in the following areas:
• Programme suitability for pupils with lower levels of ability, including those with EAL and SEN. o The training sessions for teachers could cover more examples of the programme being used
with these pupils, and ways to make it more accessible for these pupils. o More detail could be provided on the types of maths problems that could be used with pupils
of different ability. Teachers suggested that a bank of questions could be made available, tailored for use with different groups of pupils.
o A wider range of strategies could be provided to help encourage use of the stepped approach with all pupils including ways to maintain engagement in the approach throughout the intervention lifetime.
o Advice could be provided on how to overcome barriers faced by these groups, such as providing Teaching Assistant support, using trios instead of pairs, or covering session content with tutors prior to the session.
• Pupil pairing guidance could be elaborated on within the handbook to illustrate the extent to which non-performance related factors, such as personality and friendships should be taken into account when pairing the pupils.
• Further guidance on how to deal with frequent absentees and changes in pairings would be beneficial to help minimise the effect of missed Shared Maths sessions.
• Encouraging more joined-up working between Year 3 and 5 teachers as well as sharing ideas and good practice across schools to support the implementation of the programme. Teachers suggested that designated joint planning, preparation and assessment time would help to facilitate this.

Durham Shared Maths Project
Education Endowment Foundation 48
• Provide pupils with refresher training in the approach part-way through each 16 week block of programme delivery. This could provide an opportunity to reinforce the steps and re-engage them in the process.

Durham Shared Maths Project
Education Endowment Foundation 49
Conclusion
Key Conclusions 1. This evaluation does not provide any evidence that the Durham Shared Maths programme
had an impact on attainment in maths, when used with Year 5 and 3 pupils. 2. There is no quantitative evidence of any impact on the attitudes towards school, reading and
maths for both Year 3 and Year 5 pupils who participated in the Shared Maths programme. 3. The process evaluation revealed teachers’ views that pupils with EAL, SEN and lower ability
were particularly struggling with the intervention. Teachers did not feel well equipped to support these pupils in accessing the intervention.
4. Teachers reported a number of wider perceived benefits from using Shared Maths - such as improvements in confidence in maths, approaches to problem-solving and social skills. These benefits may in time help support improvements in learning, and transfer to other lessons, although further work is needed here.
5. Given the concerns expressed by teachers about lower ability pupils finding adherence to the programme challenging, Shared Maths could benefit from further tailoring of the content and delivery to be better suited for pupils with different abilities prior to further testing.
Limitations
There have been multiple research teams involved in this study. The trial was originally designed by the Durham team, with the original evaluation design and roles and responsibilities being agreed with the team at Bristol University. The process evaluation was carried out and impact evaluation completed by NatCen.
Considering that all pupils in intervention cohorts received the Shared Maths programme, the pupil recruitment was successful. However, two schools were excluded from the study after randomisation due to the failure to complete the pre-test. Furthermore, three schools dropped out of the study before a post-test giving an overall school level attrition rate of approximately 6 per cent.13 However, the sample characteristics in terms of observable variables were similar for the randomised and the analysed sample, and assuming a robust randomisation process, the differences in intervention and control group composition are due to chance. Furthermore, the level of attrition was similar in both trial arms in terms of the number of schools (and pupils) lost to follow-up, which increases our confidence that there is no bias.
The tests were administered by schools with some support from the Shared Maths team and other employees from the Centre for Evaluating and Monitoring (CEM). Although schools were instructed to deliver tests under ‘exam’ conditions, and they were completed on computers, the testing was not fully ‘blind’.One of the key limitations of the study is the lack of data on control group activities (‘business as usual’). Anecdotal’ evidence from the LAs suggested that some of the control schools were independently making a focused effort to improve pupils’ maths attainment during the trial using alternative strategies. Considering that these schools were waiting list controls, and therefore interested in receiving Shared Maths after the trial this may have resulted in heightened awareness of maths performance. However, there is no reliable evidence to support this observation. It should be noted that schools were selected on the basis that they needed to improve their maths performance and had the capacity to do so.
Finally, even though the process evaluation provides some in-depth information about the implementation of the programme, and helps to identify areas where teachers perceived that 13 In terms of a total sample size when comparing the randomised sample based on 82 schools included in the study to the sample eligible for the unadjusted analysis of the primary outcome the pupil level attrition rate was 16 per cent.

Durham Shared Maths Project
Education Endowment Foundation 50
improvements might be made, the process evaluation was limited to the schools and interviewees that were willing to contribute to the research study. Furthermore, there was no systematic data collection to monitor implementation fidelity. As such, conclusions around the fidelity of implementation should be seen as indicative rather than conclusive.
Interpretation
The results of this cluster randomised controlled trial do not provide evidence that the Shared Maths intervention had an impact on attainment in maths (primary outcome) as well as on attitudes towards school, reading and maths (secondary outcomes). This finding is somewhat inconsistent with existing research that shows positive effects of peer tutoring on raising attainment in school-aged children across a number of subjects. The results of this study can be generalised to similar pupils in England. Namely, this trial was run as an effectiveness trial in four local authority areas – Medway, Worchester, Durham and Leeds. As the intervention was delivered by local authorities/independent Local Co-ordinators to the teachers and not by the developer of the approach who has in-depth knowledge of programme theory and implementation, the trial results are more likely to be applicable to a real-world setting. The four local authority areas were selected on the basis of providing a good spread of schools around England and therefore increase the external validity of the study. Furthermore, the sample characteristics suggest that the schools participating in the study were slightly more disadvantaged than the average primary school in England as was intended. The results of the study suggest that Durham Shared Maths version of cross-age peer tutoring on its own is unlikely to lead to an improvement in the mathematic performance of primary school aged pupils.
Teachers that were interviewed as part of the process evaluation indicated there may be wider benefits from using Shared Maths, such as improvements in confidence in maths, attitudes towards maths, approaches to problem-solving and social skills. They felt that these benefits may in time help support improvements in learning, and transfer to other lessons, although further work is needed here. This is particularly relevant in light of the fact that impact evaluation findings did not indicate any significant impact on the attitudes towards school, reading and maths for both Year 3 and Year 5 pupils who participated in the Shared Maths programme.
The process evaluation suggested a number of aspects that may have influenced the implementation of the Shared Maths intervention. For example, there was variation in how Local Co-ordinators trained teachers to deliver the programme in their schools. Similarly, whilst the handbook provided detailed guidance on pupil training, teachers were able to tailor the training according to their personal preferences. Whilst there was variation in the format and content of training, the extent of this and the impact on the study findings remains unclear, particularly when considering the qualitative evidence suggesting a relatively high degree of implementation fidelity.
The process evaluation revealed that EAL, SEN and low ability pupils were particularly struggling with the programme. At the same time teachers did not feel well equipped to support these pupils so they would have the opportunity to benefit from the programme in the same way as higher ability pupils. In addition to level of pupil ability there was variation in how successfully tutors and tutees adhered to the Shared Maths stepped approach in solving maths problems based on teachers’ views. Taking into account that some of the variation can be expected in a large-scale implementation of the intervention, and without knowing the extent of variation in peer tutoring, it is difficult to estimate the impact on programme effects.
Findings from the process evaluation suggest that a proportion of pupils were unable to attend all Shared Maths sessions during the intervention period. According to teachers that were interviewed as part of the process evaluation, this was partially due to absenteeism and highly transient pupil population in some of the participating schools. This also resulted in teachers having to re-match pupils into pairs or trios, in some cases several times throughout each 16 week block of Shared
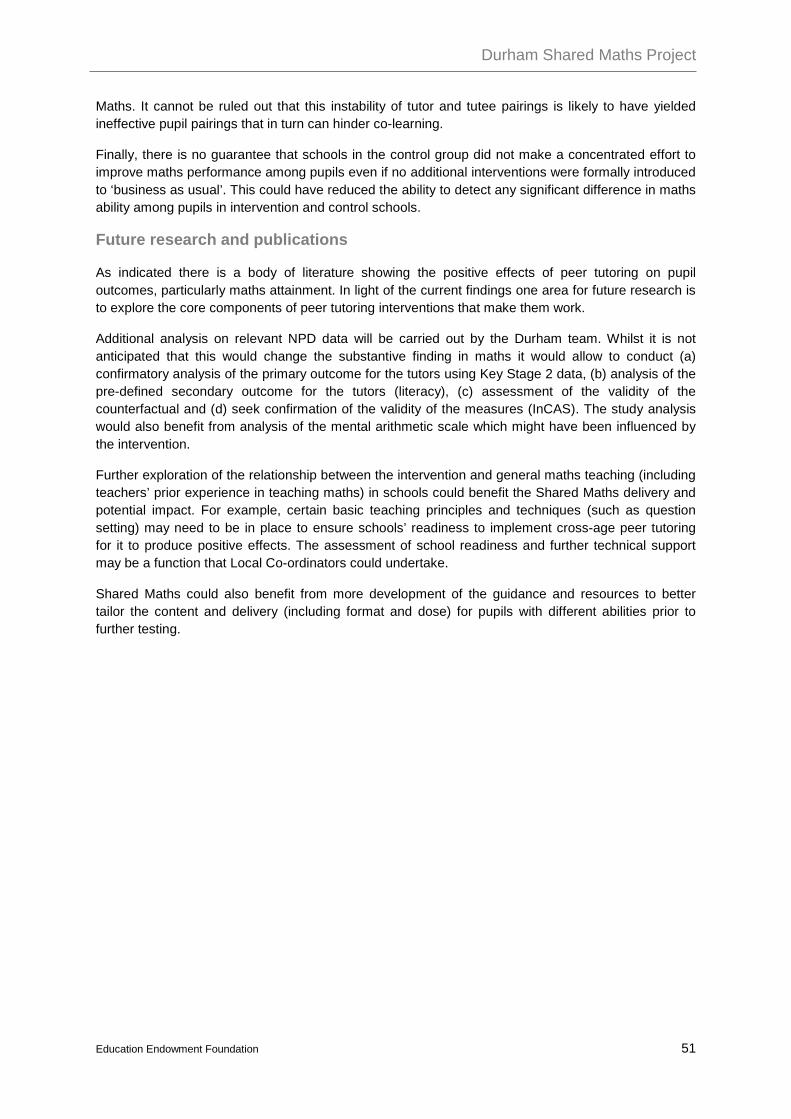
Durham Shared Maths Project
Education Endowment Foundation 51
Maths. It cannot be ruled out that this instability of tutor and tutee pairings is likely to have yielded ineffective pupil pairings that in turn can hinder co-learning.
Finally, there is no guarantee that schools in the control group did not make a concentrated effort to improve maths performance among pupils even if no additional interventions were formally introduced to ‘business as usual’. This could have reduced the ability to detect any significant difference in maths ability among pupils in intervention and control schools.
Future research and publications
As indicated there is a body of literature showing the positive effects of peer tutoring on pupil outcomes, particularly maths attainment. In light of the current findings one area for future research is to explore the core components of peer tutoring interventions that make them work.
Additional analysis on relevant NPD data will be carried out by the Durham team. Whilst it is not anticipated that this would change the substantive finding in maths it would allow to conduct (a) confirmatory analysis of the primary outcome for the tutors using Key Stage 2 data, (b) analysis of the pre-defined secondary outcome for the tutors (literacy), (c) assessment of the validity of the counterfactual and (d) seek confirmation of the validity of the measures (InCAS). The study analysis would also benefit from analysis of the mental arithmetic scale which might have been influenced by the intervention.
Further exploration of the relationship between the intervention and general maths teaching (including teachers’ prior experience in teaching maths) in schools could benefit the Shared Maths delivery and potential impact. For example, certain basic teaching principles and techniques (such as question setting) may need to be in place to ensure schools’ readiness to implement cross-age peer tutoring for it to produce positive effects. The assessment of school readiness and further technical support may be a function that Local Co-ordinators could undertake.
Shared Maths could also benefit from more development of the guidance and resources to better tailor the content and delivery (including format and dose) for pupils with different abilities prior to further testing.

Durham Shared Maths Project
Education Endowment Foundation 52
References
Britz, M. W. (1989). The effects of peer tutoring on mathematics performance: A recent review. B. C. Journal of Special Education, 13 (1), 17-33.
Cohen, P. A., Kulik, J. A., & Kulik, C-L. C. (1982). Educational outcomes of peer tutoring: A meta-analysis of findings. American Educational Research Journal, 19 (2), 237-248.
Higgins, S., Katsipataki, M., Coleman, R., Henderson, P., Major, L.E., & Coe, R. (2014). The Sutton Trust-Education Endowment Foundation Teaching and Learning Toolkit. October 2014. London: Education Endowment Foundation.
Higgins, S., Katsipataki, M., Kokotsaki, D., Coe, R., Major, L-E., & Coleman, R. (2013). The Sutton Trust-Education Endowment Foundation: Teaching and learning toolkit: Technical appendices. Available at: http://educationendowmentfoundation.org.uk/uploads/pdf/Technical_Appendices_(June_2013).pdf
Merrell, C., & Tymms, P. (2005). InCAS (Interactive Computerised Assessment System): Using individual diagnostic profiles in assessment for learning, Paper presented at EARLI Conference, Nicosia, Cyprus, August 2005. Available at: http://www.cem.org/attachments/publications/CEMWeb010%20EARLI%202005%20InCAS.pdf
Pennucci, A., & Lemon, M. (2014). Updated inventory of evidence- and research-based practices: Washington’s K–12 Learning Assistance Program. (Doc. No. 14-09-2201). Olympia: Washington State Institute for Public Policy. Available at: http://www.wsipp.wa.gov/ReportFile/1568/Wsipp_Updated-Inventory-of-Evidence-and-Research-Based-Practices-Washingtons-K-8209-12-Learning-Assistance-Program_Report.pdf
Rohrbeck, C. A., Ginsburg-Block, M. D., Fantuzzo, J. W., & Miller, T. R. (2003). Peer-assisted learning interventions with elementary school students: A meta-analytic review. Journal of Educational Psychology, 95 (2), 240–257.
Robinson, D., Schofield, J. W., & Steers-Wentzell, K. L. (2005). Peer and cross-age tutoring in math: Outcomes and their design implications. Educational Psychology Review, 17 (4), 327-362.
What Works Clearinghouse. (2013). Peer-assisted learning strategies. WWC Intervention Report. January 2013. Available at: http://ies.ed.gov/ncee/wwc/pdf/intervention_reports/wwc_pals_050112.pdf
Topping, K. J., Kearney, M., McGee, E., & Pugh, J. (2004). Tutoring in mathematics: A generic method. Mentoring and Tutoring, 12 (3), 353-370.
Tymms, P. (2004). Effect sizes in multilevel models. In I. Shagen & K. Elliot (Eds.), But what does it mean? The use of effect sizes in educational research (pp. 55-66). Slough, Berkshire: National Foundation for Educational Research.
Tymms, P., Merrell, C., Thurston, A., Andor, J., Topping, K., & Miller, D. (2011). Improving attainment across a whole district: School reform through peer tutoring in a randomised control trial. School Effectiveness and School Improvement, 22 (3), 265-289.

Durham Shared Maths Project
Education Endowment Foundation 53
Appendix A: Parent information sheet

Durham Shared Maths Project
Education Endowment Foundation 54
Appendix B: Parent opt-out letter

Durham Shared Maths Project
Education Endowment Foundation 55
Appendix C: Main analysis of primary outcome Table C1: Analysis of primary outcome - Year 3 pupils – Regression output
Coef. Std. Err. z P>z 95% Conf. Interval Pre-intervention score
0.939304 0.015687 59.88 0 0.908558 0.970051
FSM eligibility -2.39527 0.528206 -4.53 0 -3.43053 -1.36
EAL 1.677515 0.893017 1.88 0.06 -0.07277 3.427797
Ethnicity- Asian 0.09892 1.16593 0.08 0.932 -2.18626 2.384101
Ethnicity- Black 1.873546 1.203359 1.56 0.119 -0.48499 4.232086
Ethnicity- Chinese 3.964533 3.451227 1.15 0.251 -2.79975 10.72881
Ethnicity- Mixed 1.931561 0.993309 1.94 0.052 -0.01529 3.87841
Ethnicity- Other 0.025438 1.989923 0.01 0.99 -3.87474 3.925615
Gender -0.87726 0.406478 -2.16 0.031 -1.67394 -0.08058
Birth month - Feb -1.11208 1.00787 -1.1 0.27 -3.08747 0.863308
Mar -0.51835 0.9984 -0.52 0.604 -2.47518 1.438479
Apr -1.04025 0.972619 -1.07 0.285 -2.94655 0.86605
May -0.32281 1.003702 -0.32 0.748 -2.29003 1.644414
June 0.234198 0.995607 0.24 0.814 -1.71716 2.185552
July -0.9414 0.986315 -0.95 0.34 -2.87454 0.991746
Aug -0.9161 0.978054 -0.94 0.349 -2.83305 1.000851
Sept 0.054716 0.991151 0.06 0.956 -1.8879 1.997336
Oct 0.679963 0.992062 0.69 0.493 -1.26444 2.624369
Nov -0.24695 0.988859 -0.25 0.803 -2.18508 1.691172
Dec -0.68827 1.015973 -0.68 0.498 -2.67954 1.302998
Allocation 0.091153 0.67577 0.13 0.893 -1.23333 1.415638
Area2 -1.16136 0.899391 -1.29 0.197 -2.92413 0.601417
Area3 -0.29016 0.906846 -0.32 0.749 -2.06755 1.48722
Area4 -0.62885 0.976461 -0.64 0.52 -2.54268 1.284979
_cons 7.295349 1.869024 3.9 0 3.632129 10.95857
Number of pupils 2709
Number of schools 79

Durham Shared Maths Project
Education Endowment Foundation 56
Table C2: Analysis of primary outcome - Year 5 pupils – Regression output
Coef. Std. Err. z P>z 95% Conf. Interval Pre-intervention score
0.984081 0.012412 79.29 0 0.959754 1.008407
FSM eligibility -2.1841 0.500291 -4.37 0 -3.16465 -1.20355
EAL 1.232046 0.868222 1.42 0.156 -0.46964 2.933729
Ethnicity- Asian 0.551567 1.146688 0.48 0.631 -1.6959 2.799035
Ethnicity- Black 0.061327 1.111062 0.06 0.956 -2.11632 2.238969
Ethnicity- Chinese 6.914759 3.525147 1.96 0.05 0.005598 13.82392
Ethnicity- Mixed 1.900077 0.994818 1.91 0.056 -0.04973 3.849884
Ethnicity- Other 3.276124 2.264905 1.45 0.148 -1.16301 7.715256
Gender -0.70215 0.381226 -1.84 0.066 -1.44934 0.045042
Birth month - Feb 0.622318 0.969008 0.64 0.521 -1.2769 2.521537
Mar 0.088526 0.964636 0.09 0.927 -1.80213 1.979177
Apr 0.041032 0.910535 0.05 0.964 -1.74358 1.825647
May -0.46964 0.901407 -0.52 0.602 -2.23637 1.297082
June -0.03375 0.922412 -0.04 0.971 -1.84165 1.774139
July 1.012592 0.928532 1.09 0.275 -0.8073 2.832482
Aug 0.009075 0.915598 0.01 0.992 -1.78546 1.803613
Sept -0.76963 0.907016 -0.85 0.396 -2.54735 1.008089
Oct -0.06784 0.923937 -0.07 0.941 -1.87873 1.743042
Nov 0.818932 0.943382 0.87 0.385 -1.03006 2.667926
Dec 0.58738 0.919661 0.64 0.523 -1.21512 2.389882
Allocation 0.302408 0.726583 0.42 0.677 -1.12167 1.726484
Area2 0.073771 0.972911 0.08 0.94 -1.8331 1.980641
Area3 -1.45734 0.985988 -1.48 0.139 -3.38984 0.47516
Area4 -0.74056 1.03983 -0.71 0.476 -2.77859 1.297474
_cons 4.121568 1.569114 2.63 0.009 1.046162 7.196974
Number of pupils 2598
Number of schools 79
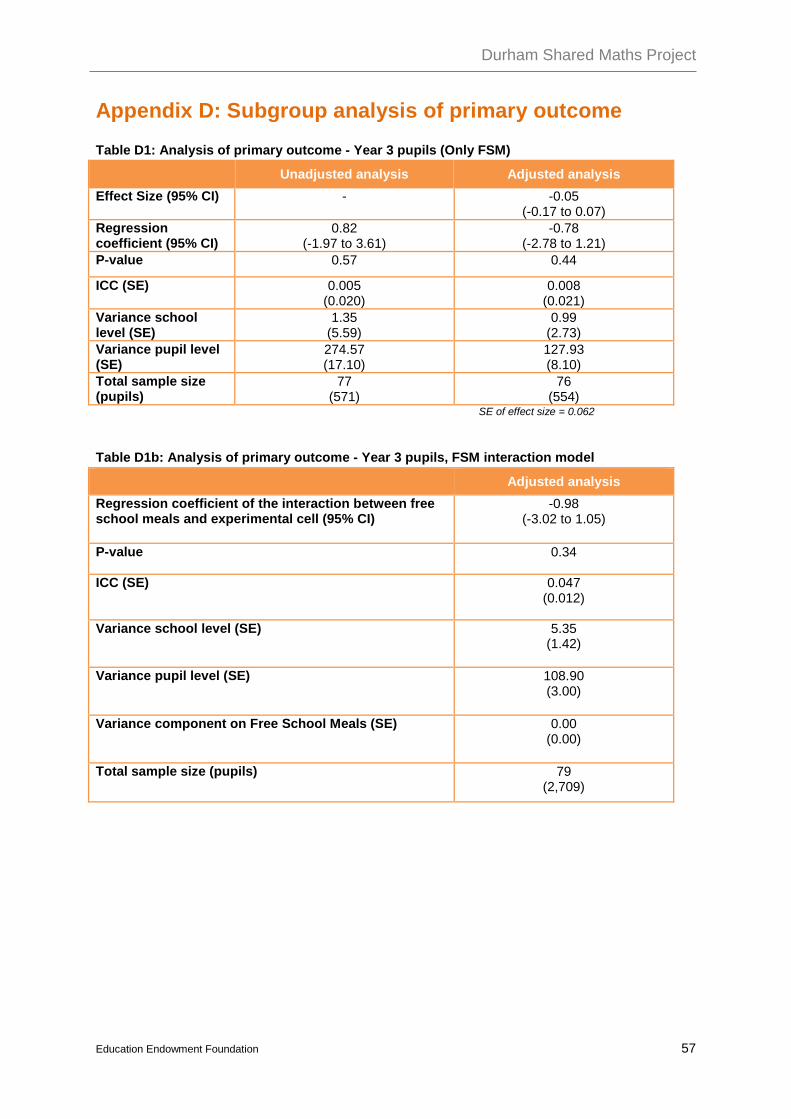
Durham Shared Maths Project
Education Endowment Foundation 57
Appendix D: Subgroup analysis of primary outcome Table D1: Analysis of primary outcome - Year 3 pupils (Only FSM)
Unadjusted analysis Adjusted analysis Effect Size (95% CI) - -0.05
(-0.17 to 0.07) Regression coefficient (95% CI)
0.82 (-1.97 to 3.61)
-0.78 (-2.78 to 1.21)
P-value 0.57 0.44
ICC (SE) 0.005 (0.020)
0.008 (0.021)
Variance school level (SE)
1.35 (5.59)
0.99 (2.73)
Variance pupil level (SE)
274.57 (17.10)
127.93 (8.10)
Total sample size (pupils)
77 (571)
76 (554) SE of effect size = 0.062
Table D1b: Analysis of primary outcome - Year 3 pupils, FSM interaction model
Adjusted analysis Regression coefficient of the interaction between free school meals and experimental cell (95% CI)
-0.98 (-3.02 to 1.05)
P-value 0.34
ICC (SE) 0.047 (0.012)
Variance school level (SE) 5.35 (1.42)
Variance pupil level (SE) 108.90 (3.00)
Variance component on Free School Meals (SE) 0.00 (0.00)
Total sample size (pupils) 79 (2,709)

Durham Shared Maths Project
Education Endowment Foundation 58
Table D2: Analysis of primary outcome - Year 3 pupils (Only FSM) Regression output
Coef. Std. Err. z P>z 95% Conf. Interval Pre-intervention score
0.911215 0.039082 23.32 0 0.834616 0.987815
EAL 0.601264 2.244241 0.27 0.789 -3.79737 4.999895
Ethnicity- Asian -3.57127 3.660274 -0.98 0.329 -10.7453 3.602738
Ethnicity- Black 1.174637 3.002223 0.39 0.696 -4.70961 7.058885
Ethnicity- Chinese 11.963 11.78709 1.01 0.31 -11.1393 35.06526
Ethnicity- Mixed 3.032531 1.939615 1.56 0.118 -0.76905 6.834107
Ethnicity- Other 4.712801 6.802958 0.69 0.488 -8.62075 18.04635
Gender -0.76442 0.981581 -0.78 0.436 -2.68828 1.159448
Birth month - Feb -1.24104 2.454076 -0.51 0.613 -6.05094 3.568856
Mar -0.99841 2.429219 -0.41 0.681 -5.75959 3.762775
Apr -1.13413 2.390618 -0.47 0.635 -5.81966 3.551393
May 1.557224 2.454541 0.63 0.526 -3.25359 6.368037
June 2.501314 2.496012 1 0.316 -2.39078 7.393409
July 1.493036 2.490063 0.6 0.549 -3.3874 6.373469
Aug 0.537526 2.355672 0.23 0.82 -4.07951 5.154558
Sept 0.516103 2.577412 0.2 0.841 -4.53553 5.567737
Oct 1.819975 2.450911 0.74 0.458 -2.98372 6.623672
Nov 0.660259 2.310425 0.29 0.775 -3.86809 5.18861
Dec 3.6104 2.527471 1.43 0.153 -1.34335 8.564152
Allocation -0.78341 1.01616 -0.77 0.441 -2.77505 1.208225
Area2 0.262654 1.342232 0.2 0.845 -2.36807 2.89338
Area3 -0.44109 1.395127 -0.32 0.752 -3.17549 2.293311
Area4 -1.17667 1.545821 -0.76 0.447 -4.20643 1.85308
_cons 6.539832 4.22421 1.55 0.122 -1.73947 14.81913
Number of pupils 554
Number of schools 76
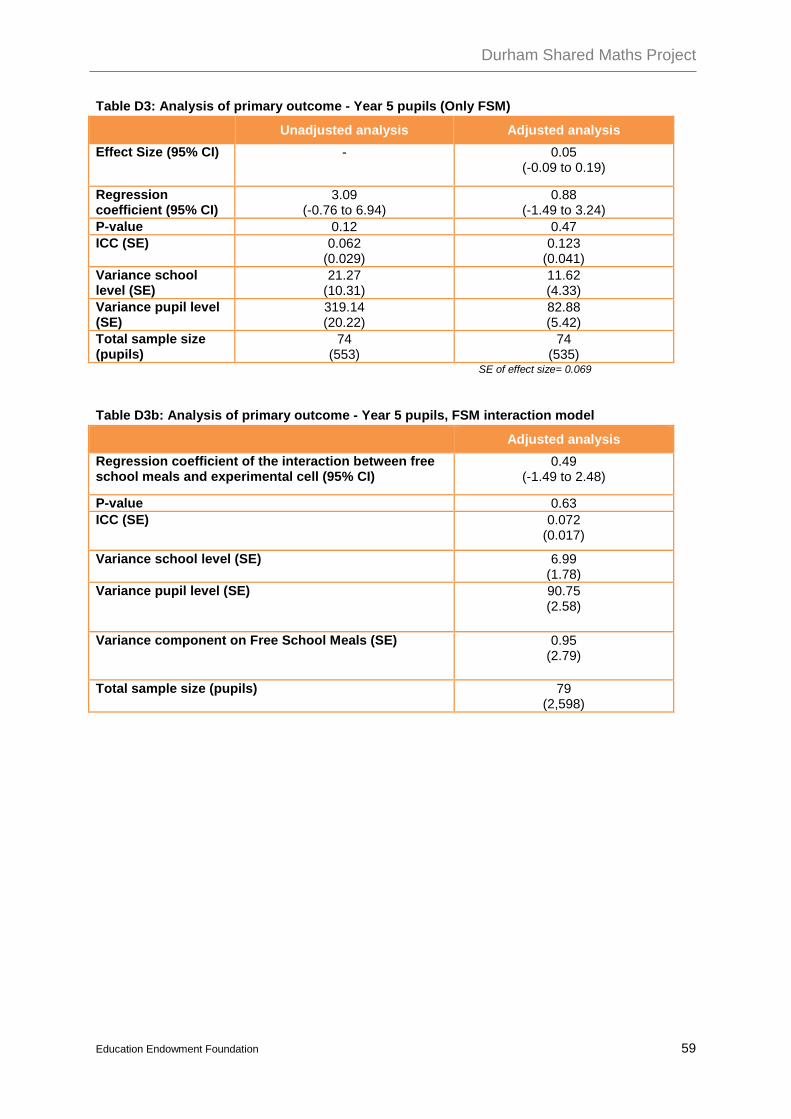
Durham Shared Maths Project
Education Endowment Foundation 59
Table D3: Analysis of primary outcome - Year 5 pupils (Only FSM)
Unadjusted analysis Adjusted analysis Effect Size (95% CI) - 0.05
(-0.09 to 0.19)
Regression coefficient (95% CI)
3.09 (-0.76 to 6.94)
0.88 (-1.49 to 3.24)
P-value 0.12 0.47 ICC (SE) 0.062
(0.029) 0.123
(0.041) Variance school level (SE)
21.27 (10.31)
11.62 (4.33)
Variance pupil level (SE)
319.14 (20.22)
82.88 (5.42)
Total sample size (pupils)
74 (553)
74 (535)
SE of effect size= 0.069
Table D3b: Analysis of primary outcome - Year 5 pupils, FSM interaction model
Adjusted analysis Regression coefficient of the interaction between free school meals and experimental cell (95% CI)
0.49 (-1.49 to 2.48)
P-value 0.63 ICC (SE) 0.072
(0.017)
Variance school level (SE) 6.99 (1.78)
Variance pupil level (SE) 90.75 (2.58)
Variance component on Free School Meals (SE) 0.95 (2.79)
Total sample size (pupils) 79 (2,598)

Durham Shared Maths Project
Education Endowment Foundation 60
Table D4: Analysis of primary outcome - Year 5 pupils (Only FSM) Adjusted analysis
Coef. Std. Err. z P>z 95% Conf. Interval Pre-intervention score
0.99714 0.02743 36.35 0 0.943378 1.050901
EAL 0.09833 2.024906 0.05 0.961 -3.87041 4.067073
Ethnicity- Asian 1.663433 2.750178 0.6 0.545 -3.72682 7.053683
Ethnicity- Black 0.366607 2.193761 0.17 0.867 -3.93309 4.666299
Ethnicity- Chinese 5.514462 9.718006 0.57 0.57 -13.5325 24.5614
Ethnicity- Mixed 0.998697 1.94846 0.51 0.608 -2.82021 4.817608
Ethnicity- Other -1.53187 5.75576 -0.27 0.79 -12.813 9.749216
Gender 0.810857 0.827904 0.98 0.327 -0.8118 2.433518
Birth month - Feb 4.981251 2.131832 2.34 0.019 0.802937 9.159565
Mar 4.12333 2.112079 1.95 0.051 -0.01627 8.26293
Apr 0.208345 2.138247 0.1 0.922 -3.98254 4.399233
May 0.209592 1.989761 0.11 0.916 -3.69027 4.109452
June 2.26599 2.025982 1.12 0.263 -1.70486 6.236842
July 2.919109 2.065793 1.41 0.158 -1.12977 6.967989
Aug 2.91758 2.071074 1.41 0.159 -1.14165 6.97681
Sept 1.292128 2.192522 0.59 0.556 -3.00514 5.589392
Oct 4.812558 2.179442 2.21 0.027 0.540931 9.084186
Nov 3.682147 2.162288 1.7 0.089 -0.55586 7.920153
Dec 3.336797 2.117925 1.58 0.115 -0.81426 7.487854
Allocation 0.876955 1.205943 0.73 0.467 -1.48665 3.240561
Area2 0.787703 1.606625 0.49 0.624 -2.36122 3.936631
Area3 -2.23202 1.62996 -1.37 0.171 -5.42668 0.962644
Area4 -0.49195 1.769644 -0.28 0.781 -3.96039 2.97649
_cons -2.74719 3.168027 -0.87 0.386 -8.95641 3.46203
Number of pupils 535
Number of schools 74

Durham Shared Maths Project
Education Endowment Foundation 61
Table D5: Analysis of primary outcome - Year 3 pupils (below average on pre- test)
Unadjusted analysis Adjusted analysis Effect Size (95% CI) - -0.05
(-0.17 to 0.07) Regression coefficient (95% CI)
-0.02 (-1.94 to 1.91)
-0.63 (-2.08 to 0.82)
P-value 0.97 0.40 ICC (SE) 0.051
(0.018) 0.026
(0.014) Variance school level (SE)
8.40 (2.97)
3.04 (1.67)
Variance pupil level (SE)
155.54 (6.29)
113.58 (4.60)
Total sample size (pupils)
79 (1,299)
79 (1,297)
SE of effect size= 0.060

Durham Shared Maths Project
Education Endowment Foundation 62
Table D6: Analysis of primary outcome - Year 3 pupils (below average on pre- test) Regression output
Coef. Std. Err. z P>z 95% Conf. Interval Pre-intervention score
0.800518 0.039276 20.38 0 0.723538 0.877498
FSM eligibility -2.6785 0.687192 -3.9 0 -4.02537 -1.33162
EAL 1.141626 1.213101 0.94 0.347 -1.23601 3.51926
Ethnicity- Asian 0.889722 1.712714 0.52 0.603 -2.46714 4.24658
Ethnicity- Black 4.04018 1.714333 2.36 0.018 0.680148 7.400211
Ethnicity- Chinese 10.42634 6.350665 1.64 0.101 -2.02073 22.87342
Ethnicity- Mixed 1.432844 1.411544 1.02 0.31 -1.33373 4.199419
Ethnicity- Other -1.5374 3.146192 -0.49 0.625 -7.70383 4.629021
Gender -0.86903 0.60319 -1.44 0.15 -2.05127 0.313198
Birth month - Feb -0.86102 1.454979 -0.59 0.554 -3.71273 1.990688
Mar -1.06792 1.427866 -0.75 0.455 -3.86649 1.730643
Apr -0.60789 1.461898 -0.42 0.678 -3.47315 2.25738
May 0.82593 1.429044 0.58 0.563 -1.97495 3.626805
June 0.009541 1.500318 0.01 0.995 -2.93103 2.950111
July 0.16295 1.433921 0.11 0.91 -2.64748 2.973384
Aug -0.46487 1.525171 -0.3 0.761 -3.45415 2.524409
Sept -0.32422 1.359416 -0.24 0.811 -2.98862 2.340188
Oct 1.51115 1.382436 1.09 0.274 -1.19838 4.220676
Nov -0.85624 1.370238 -0.62 0.532 -3.54186 1.829372
Dec -1.39913 1.466342 -0.95 0.34 -4.2731 1.474851
Allocation -0.62628 0.739516 -0.85 0.397 -2.0757 0.823147
Area2 -2.04178 0.990247 -2.06 0.039 -3.98263 -0.10093
Area3 -0.57065 0.98611 -0.58 0.563 -2.50339 1.362088
Area4 -0.52704 1.08201 -0.49 0.626 -2.64775 1.593657
_cons 20.21366 3.784352 5.34 0 12.79647 27.63086
Number of pupils 1297
Number of schools 79
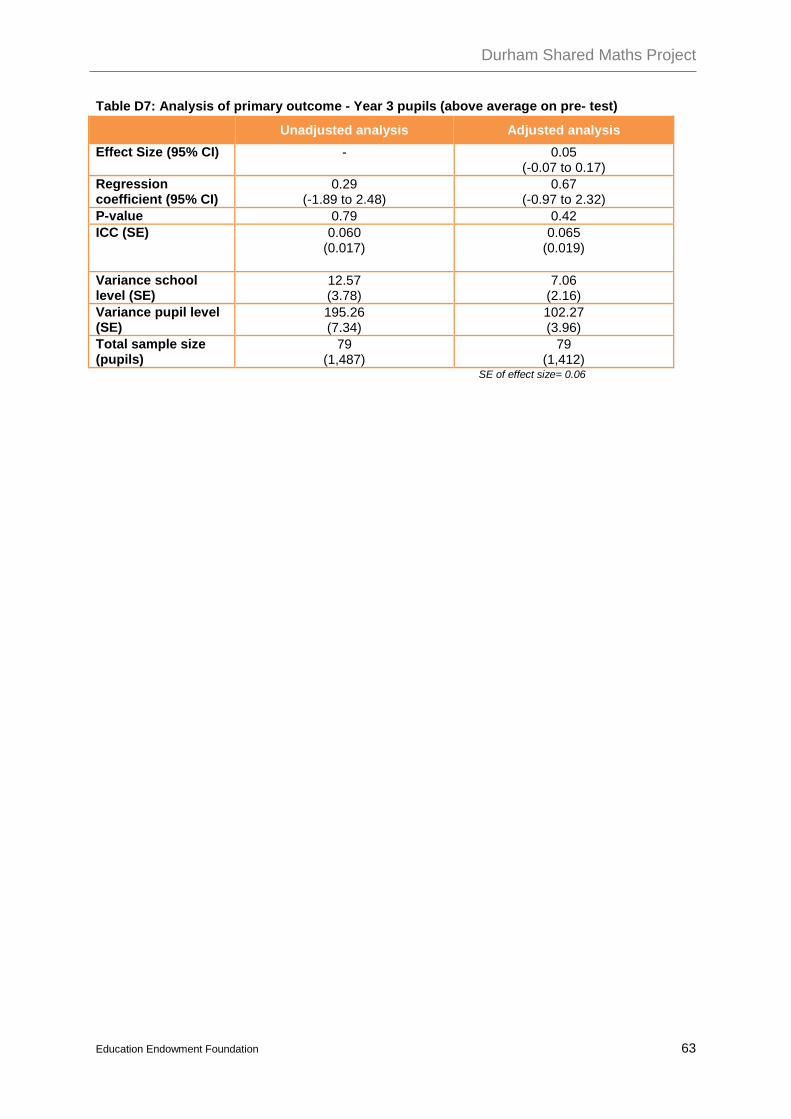
Durham Shared Maths Project
Education Endowment Foundation 63
Table D7: Analysis of primary outcome - Year 3 pupils (above average on pre- test)
Unadjusted analysis Adjusted analysis Effect Size (95% CI) - 0.05
(-0.07 to 0.17) Regression coefficient (95% CI)
0.29 (-1.89 to 2.48)
0.67 (-0.97 to 2.32)
P-value 0.79 0.42 ICC (SE) 0.060
(0.017) 0.065
(0.019)
Variance school level (SE)
12.57 (3.78)
7.06 (2.16)
Variance pupil level (SE)
195.26 (7.34)
102.27 (3.96)
Total sample size (pupils)
79 (1,487)
79 (1,412)
SE of effect size= 0.06

Durham Shared Maths Project
Education Endowment Foundation 64
Table D8: Analysis of primary outcome - Year 3 pupils (above average on pre- test) Regression output
Coef. Std. Err. z P>z 95% Conf. Interval Pre-intervention score
1.016487 0.032341 31.43 0 0.9531 1.079875
FSM eligibility -2.08956 0.82352 -2.54 0.011 -3.70363 -0.47549
EAL 1.315182 1.32556 0.99 0.321 -1.28287 3.913232
Ethnicity- Asian 1.091834 1.575564 0.69 0.488 -1.99621 4.179882
Ethnicity- Black 0.667013 1.683372 0.4 0.692 -2.63234 3.966361
Ethnicity- Chinese 1.955636 4.134502 0.47 0.636 -6.14784 10.05911
Ethnicity- Mixed 2.210416 1.40191 1.58 0.115 -0.53728 4.958109
Ethnicity- Other 2.004375 2.583417 0.78 0.438 -3.05903 7.067779
Gender -0.89016 0.552583 -1.61 0.107 -1.97321 0.192879
Birth month - Feb -1.671 1.406487 -1.19 0.235 -4.42767 1.085661
Mar -0.59199 1.407392 -0.42 0.674 -3.35043 2.166445
Apr -1.57029 1.319807 -1.19 0.234 -4.15706 1.016489
May -1.39261 1.406763 -0.99 0.322 -4.14982 1.364592
June 0.216675 1.342375 0.16 0.872 -2.41433 2.847681
July -2.12589 1.367103 -1.56 0.12 -4.80536 0.553583
Aug -1.20288 1.304471 -0.92 0.356 -3.7596 1.353836
Sept 0.157205 1.456707 0.11 0.914 -2.69789 3.012298
Oct -0.47642 1.425525 -0.33 0.738 -3.2704 2.317556
Nov 0.196497 1.4352 0.14 0.891 -2.61644 3.009437
Dec -0.54848 1.40916 -0.39 0.697 -3.31038 2.213425
Allocation 0.671128 0.839852 0.8 0.424 -0.97495 2.317207
Area2 -0.24672 1.118743 -0.22 0.825 -2.43941 1.94598
Area3 0.378308 1.118748 0.34 0.735 -1.8144 2.571014
Area4 -0.66969 1.214382 -0.55 0.581 -3.04984 1.710455
_cons -1.53327 3.865256 -0.4 0.692 -9.10903 6.042497
Number of pupils 1412
Number of schools 79
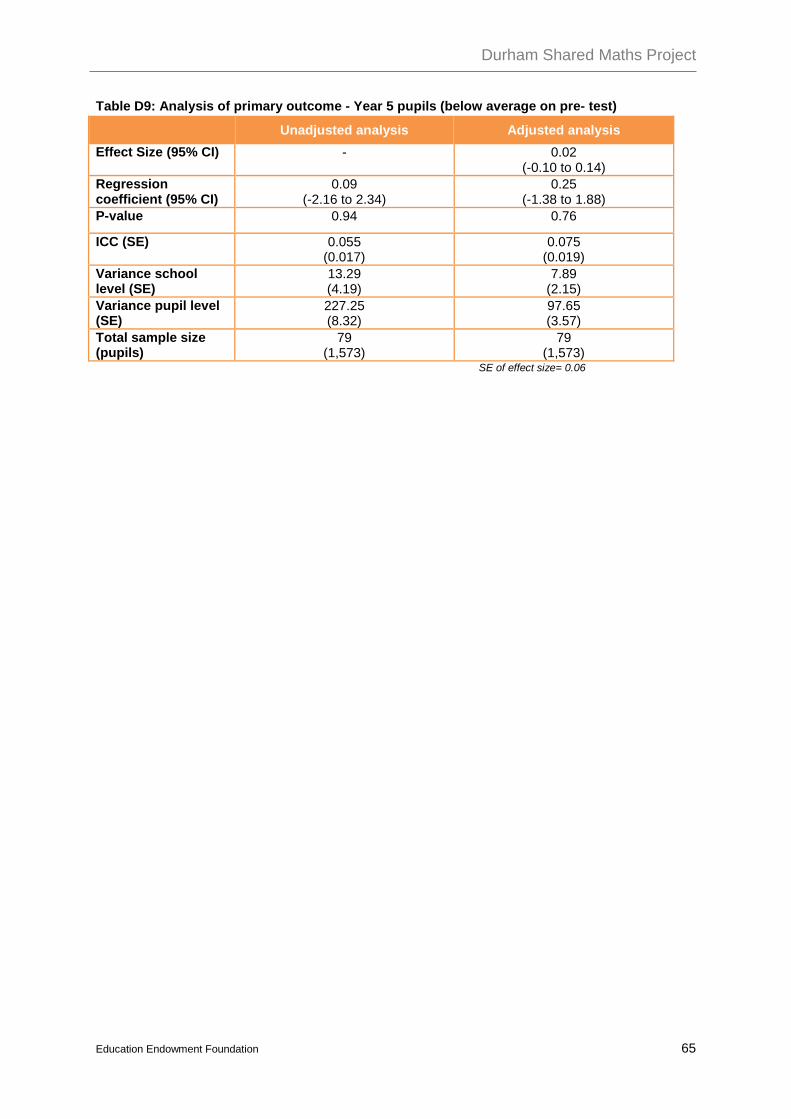
Durham Shared Maths Project
Education Endowment Foundation 65
Table D9: Analysis of primary outcome - Year 5 pupils (below average on pre- test)
Unadjusted analysis Adjusted analysis Effect Size (95% CI) - 0.02
(-0.10 to 0.14) Regression coefficient (95% CI)
0.09 (-2.16 to 2.34)
0.25 (-1.38 to 1.88)
P-value 0.94 0.76
ICC (SE) 0.055 (0.017)
0.075 (0.019)
Variance school level (SE)
13.29 (4.19)
7.89 (2.15)
Variance pupil level (SE)
227.25 (8.32)
97.65 (3.57)
Total sample size (pupils)
79 (1,573)
79 (1,573)
SE of effect size= 0.06

Durham Shared Maths Project
Education Endowment Foundation 66
Table D10: Analysis of primary outcome - Year 5 pupils (below average on pre- test) Regression output
Coef. Std. Err. z P>z 95% Conf. Interval Pre-intervention score
1.038966 0.02408 43.15 0 0.99177 1.086162
FSM eligibility -1.86725 0.607512 -3.07 0.002 -3.05795 -0.67655
EAL 1.970838 1.071053 1.84 0.066 -0.12839 4.070064
Ethnicity- Asian 0.416818 1.499972 0.28 0.781 -2.52307 3.356709
Ethnicity- Black 0.864076 1.446454 0.6 0.55 -1.97092 3.699073
Ethnicity- Chinese 10.13381 5.147166 1.97 0.049 0.045547 20.22207
Ethnicity- Mixed 2.142531 1.331637 1.61 0.108 -0.46743 4.752491
Ethnicity- Other 1.706212 2.763182 0.62 0.537 -3.70952 7.121949
Gender -0.39699 0.510508 -0.78 0.437 -1.39757 0.603583
Birth month - Feb 0.738201 1.277453 0.58 0.563 -1.76556 3.241963
Mar 0.126019 1.279705 0.1 0.922 -2.38216 2.634196
Apr 0.259875 1.219005 0.21 0.831 -2.12933 2.64908
May -1.64099 1.213315 -1.35 0.176 -4.01905 0.737061
June -0.27224 1.253456 -0.22 0.828 -2.72897 2.184486
July 0.562338 1.232859 0.46 0.648 -1.85402 2.978698
Aug 0.248626 1.282315 0.19 0.846 -2.26466 2.761917
Sept 0.145381 1.178686 0.12 0.902 -2.1648 2.455564
Oct 1.179639 1.221872 0.97 0.334 -1.21519 3.574463
Nov 1.075122 1.231317 0.87 0.383 -1.33822 3.48846
Dec 0.451136 1.216872 0.37 0.711 -1.93389 2.836161
Allocation 0.251849 0.831301 0.3 0.762 -1.37747 1.881169
Area2 -0.17092 1.11123 -0.15 0.878 -2.34889 2.007052
Area3 -1.49148 1.12781 -1.32 0.186 -3.70195 0.718983
Area4 -1.89201 1.19851 -1.58 0.114 -4.24104 0.45703
_cons -0.70667 2.393368 -0.3 0.768 -5.39759 3.984243
Number of pupils 1573
Number of schools 79

Durham Shared Maths Project
Education Endowment Foundation 67
Table D11: Analysis of primary outcome - Year 5 pupils (above average on pre- test)
Unadjusted analysis Adjusted analysis Effect Size (95% CI) - 0.03
(-0.08 to 0.14) Regression coefficient (95% CI)
0.42 (-2.05 to 2.88)
0.40 (-0.94 to 1.73)
P-value 0.74 0.56
ICC (SE) 0.087 (0.025)
0.027 (0.016)
Variance school level (SE)
16.02 (4.88)
2.16 (1.29)
Variance pupil level (SE)
167.87 (7.38)
78.23 (3.57)
Total sample size (pupils)
78 (1,110)
78 (1,025)
SE of effect size= 0.053

Durham Shared Maths Project
Education Endowment Foundation 68
Table D12: Analysis of primary outcome - Year 5 pupils (above average on pre- test) Regression output
Coef. Std. Err. z P>z 95% Conf. Interval Pre-intervention score
0.876198 0.032242 27.18 0 0.813006 0.93939
FSM eligibility -2.78557 0.89725 -3.1 0.002 -4.54415 -1.02699
EAL -0.50659 1.511839 -0.34 0.738 -3.46974 2.456558
Ethnicity- Asian 1.506031 1.785917 0.84 0.399 -1.9943 5.006364
Ethnicity- Black -1.04752 1.73081 -0.61 0.545 -4.43984 2.34481
Ethnicity- Chinese 5.441331 4.74018 1.15 0.251 -3.84925 14.73191
Ethnicity- Mixed 1.722418 1.476277 1.17 0.243 -1.17103 4.615868
Ethnicity- Other 8.536543 4.078313 2.09 0.036 0.543197 16.52989
Gender -1.67393 0.569694 -2.94 0.003 -2.79051 -0.55735
Birth month - Feb -0.11588 1.470169 -0.08 0.937 -2.99736 2.765594
Mar -0.54026 1.447508 -0.37 0.709 -3.37733 2.296801
Apr -0.1453 1.354238 -0.11 0.915 -2.79955 2.50896
May 0.738865 1.33545 0.55 0.58 -1.87857 3.3563
June -0.30358 1.340277 -0.23 0.821 -2.93048 2.323312
July 1.850815 1.393012 1.33 0.184 -0.87944 4.581068
Aug -0.24111 1.29825 -0.19 0.853 -2.78563 2.303417
Sept -2.91792 1.420584 -2.05 0.04 -5.70221 -0.13362
Oct -2.60078 1.398908 -1.86 0.063 -5.34259 0.141028
Nov 0.422652 1.465841 0.29 0.773 -2.45034 3.295647
Dec 0.464869 1.390275 0.33 0.738 -2.26002 3.189757
Allocation 0.395922 0.681881 0.58 0.561 -0.94054 1.732384
Area2 -0.02801 0.923698 -0.03 0.976 -1.83842 1.782405
Area3 -1.50032 0.919042 -1.63 0.103 -3.30161 0.300973
Area4 1.422783 0.96966 1.47 0.142 -0.47772 3.323282
_cons 16.75102 3.811545 4.39 0 9.280531 24.22151
Number of pupils 1025
Number of schools 78

Durham Shared Maths Project
Education Endowment Foundation 69
Appendix E: Analysis of secondary outcome: Attitudes towards school Table E1: Analysis of attitudes towards school - Year 3 pupils - Regression output
Coefficient Std. Error z P>z 95% Conf. Interval Pre-intervention score
0.273497 0.022828 11.98 0 0.228755 0.318238
FSM eligibility 1.549831 2.17677 0.71 0.476 -2.71656 5.816221
EAL 3.60528 3.737872 0.96 0.335 -3.72082 10.93137
Ethnicity- Asian 3.874161 4.794593 0.81 0.419 -5.52307 13.27139
Ethnicity- Black -4.4984 5.182991 -0.87 0.385 -14.6569 5.660071
Ethnicity- Chinese 6.633021 12.34479 0.54 0.591 -17.5623 30.82837
Ethnicity- Mixed 2.368178 3.957647 0.6 0.55 -5.38867 10.12502
Ethnicity- Other -11.6933 8.446577 -1.38 0.166 -28.2483 4.86172
Gender 8.748223 1.675845 5.22 0 5.463626 12.03282
Birth month - Feb -4.19928 4.063663 -1.03 0.301 -12.1639 3.765352
Mar 0.81124 4.065151 0.2 0.842 -7.15631 8.77879
Apr -1.87626 3.924395 -0.48 0.633 -9.56793 5.815414
May -1.52579 3.960897 -0.39 0.7 -9.289 6.23743
June -0.76226 4.046997 -0.19 0.851 -8.69423 7.169713
July -1.96491 4.061679 -0.48 0.629 -9.92565 5.995834
Aug -3.4872 3.87716 -0.9 0.368 -11.0863 4.111891
Sept 3.08638 4.009014 0.77 0.441 -4.77114 10.9439
Oct 0.607014 4.004979 0.15 0.88 -7.2426 8.456629
Nov 0.328193 3.960457 0.08 0.934 -7.43416 8.090546
Dec -2.08107 4.123121 -0.5 0.614 -10.1622 6.000095
Allocation 0.051337 2.44654 0.02 0.983 -4.74379 4.846466
Area2 2.782098 3.264521 0.85 0.394 -3.61625 9.180442
Area3 11.47986 3.417775 3.36 0.001 4.781148 18.17858
Area4 7.779841 3.256489 2.39 0.017 1.39724 14.16244
_cons 33.39979 3.890832 8.58 0.000 25.7739 41.02568
Number of pupils 1878
Number of schools 55
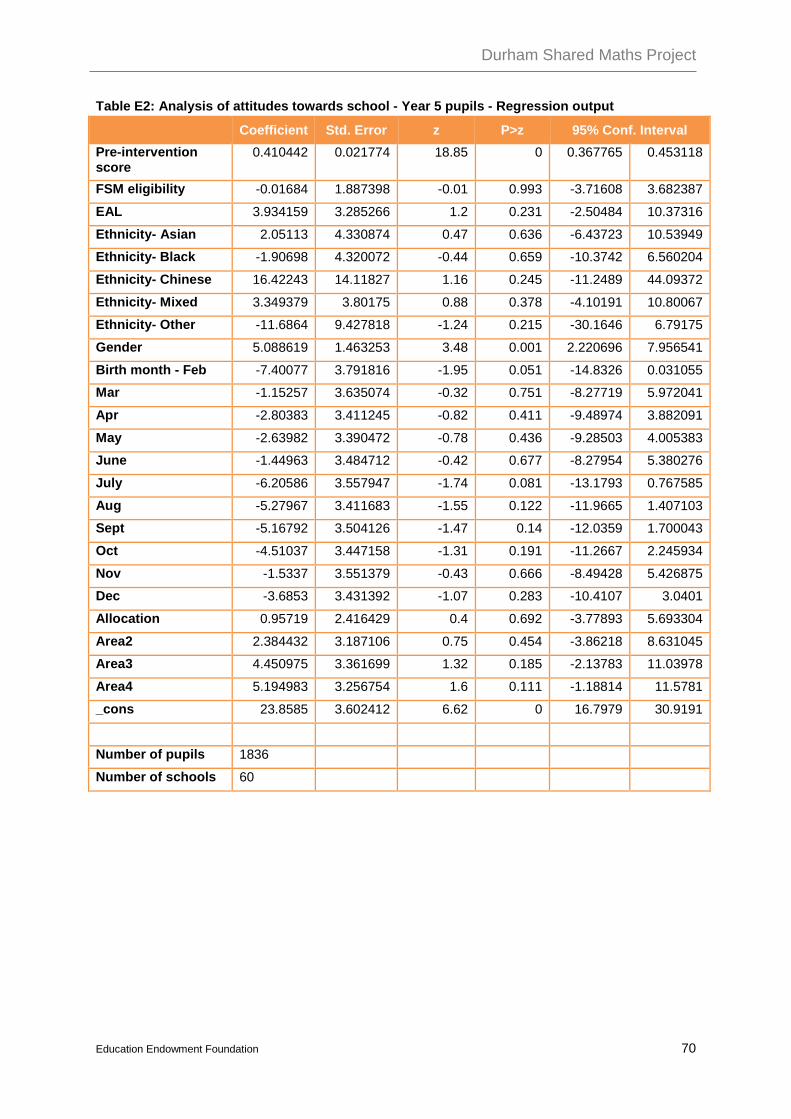
Durham Shared Maths Project
Education Endowment Foundation 70
Table E2: Analysis of attitudes towards school - Year 5 pupils - Regression output
Coefficient Std. Error z P>z 95% Conf. Interval Pre-intervention score
0.410442 0.021774 18.85 0 0.367765 0.453118
FSM eligibility -0.01684 1.887398 -0.01 0.993 -3.71608 3.682387
EAL 3.934159 3.285266 1.2 0.231 -2.50484 10.37316
Ethnicity- Asian 2.05113 4.330874 0.47 0.636 -6.43723 10.53949
Ethnicity- Black -1.90698 4.320072 -0.44 0.659 -10.3742 6.560204
Ethnicity- Chinese 16.42243 14.11827 1.16 0.245 -11.2489 44.09372
Ethnicity- Mixed 3.349379 3.80175 0.88 0.378 -4.10191 10.80067
Ethnicity- Other -11.6864 9.427818 -1.24 0.215 -30.1646 6.79175
Gender 5.088619 1.463253 3.48 0.001 2.220696 7.956541
Birth month - Feb -7.40077 3.791816 -1.95 0.051 -14.8326 0.031055
Mar -1.15257 3.635074 -0.32 0.751 -8.27719 5.972041
Apr -2.80383 3.411245 -0.82 0.411 -9.48974 3.882091
May -2.63982 3.390472 -0.78 0.436 -9.28503 4.005383
June -1.44963 3.484712 -0.42 0.677 -8.27954 5.380276
July -6.20586 3.557947 -1.74 0.081 -13.1793 0.767585
Aug -5.27967 3.411683 -1.55 0.122 -11.9665 1.407103
Sept -5.16792 3.504126 -1.47 0.14 -12.0359 1.700043
Oct -4.51037 3.447158 -1.31 0.191 -11.2667 2.245934
Nov -1.5337 3.551379 -0.43 0.666 -8.49428 5.426875
Dec -3.6853 3.431392 -1.07 0.283 -10.4107 3.0401
Allocation 0.95719 2.416429 0.4 0.692 -3.77893 5.693304
Area2 2.384432 3.187106 0.75 0.454 -3.86218 8.631045
Area3 4.450975 3.361699 1.32 0.185 -2.13783 11.03978
Area4 5.194983 3.256754 1.6 0.111 -1.18814 11.5781
_cons 23.8585 3.602412 6.62 0 16.7979 30.9191
Number of pupils 1836
Number of schools 60

Durham Shared Maths Project
Education Endowment Foundation 71
Table E3: Analysis of attitudes to school - Year 3 pupils FSM only
Unadjusted analysis Adjusted analysis Effect Size (CI) - 0.09
(-0.15 to 0.33) Regression coefficient (95% CI)
-1.17 (-9.27 to 6.93)
3.47 (-5.55 to 12.50)
P-value 0.78 0.45 ICC (SE) 0.035
(0.026) 0.016
(0.035) Variance school level (SE)
53.25 (40.30)
22.89 (49.74)
Variance pupil level (SE)
1470.07 (100.62)
1395.58 (115.83)
Total sample size (pupils)
68 (470)
51 (338)
Table E4: Analysis of attitudes to school - Year 3 pupils FSM interaction model
Adjusted analysis Regression coefficient of the interaction between free school meals and experimental cell (95% CI)
5.30 (-4.27 to 14.86)
P-value 0.28
ICC (SE) 0.028 (0.011)
Variance school level (SE) 35.35 (14.37)
Variance pupil level (SE) 1212.68 (40.44)
Variance component on Free School Meals (SE) 38.95 (46.90)
Total sample size (pupils) 55 (1,878)

Durham Shared Maths Project
Education Endowment Foundation 72
Table E5: Analysis of attitudes to school - Year 3 pupils (Only FSM) – Regression output
Coefficient Std. Error z P>z 95% Conf. Interval Pre-intervention score
0.139941 0.054857 2.55 0.011 0.032424 0.247458
EAL -8.71382 10.30592 -0.85 0.398 -28.9131 11.48542
Ethnicity- Asian -0.06153 14.82283 0 0.997 -29.1137 28.99067
Ethnicity- Black 5.797332 13.75138 0.42 0.673 -21.1549 32.74954
Ethnicity- Chinese 24.05992 29.04183 0.83 0.407 -32.861 80.98087
Ethnicity- Mixed -3.7575 8.622237 -0.44 0.663 -20.6568 13.14178
Ethnicity- Other -23.0126 20.66199 -1.11 0.265 -63.5094 17.48411
Gender 8.785549 4.239273 2.07 0.038 0.476727 17.09437
Birth month - Feb 5.277471 10.11887 0.52 0.602 -14.5551 25.11008
Mar -2.89298 11.25985 -0.26 0.797 -24.9619 19.17591
Apr 8.069901 9.547892 0.85 0.398 -10.6436 26.78343
May 12.331 9.91671 1.24 0.214 -7.1054 31.76739
June 11.4302 10.46699 1.09 0.275 -9.08473 31.94513
July 6.683451 10.92687 0.61 0.541 -14.7328 28.09972
Aug 2.470116 9.634261 0.26 0.798 -16.4127 21.35292
Sept -5.5959 11.43525 -0.49 0.625 -28.0086 16.81678
Oct 8.782005 10.10029 0.87 0.385 -11.0142 28.57821
Nov 13.14757 9.324964 1.41 0.159 -5.12902 31.42417
Dec 8.060916 10.49618 0.77 0.442 -12.5112 28.63304
Allocation 3.470549 4.604665 0.75 0.451 -5.55443 12.49553
Area2 0.139941 0.054857 2.55 0.011 0.032424 0.247458
Area3 -8.71382 10.30592 -0.85 0.398 -28.9131 11.48542
Area4 -0.06153 14.82283 0 0.997 -29.1137 28.99067
_cons 5.797332 13.75138 0.42 0.673 -21.1549 32.74954
Number of pupils 338
Number of schools 51

Durham Shared Maths Project
Education Endowment Foundation 73
Table E6: Analysis of attitudes to school - Year 5 pupils FSM only
Unadjusted analysis Adjusted analysis Effect Size (CI) - 0.13
(-0.11 to 0.37) Regression coefficient (95% CI)
0.85 (-8.42 to 10.11)
4.78 (-4.01 to 13.60)
P-value 0.86 0.29 ICC (SE) 0.087
(0.038) 0.055
(0.043) Variance school level (SE)
127.14 (58.78)
60.29 (47.73)
Variance pupil level (SE)
1330.71 (94.08)
1032.16 (84.92)
Total sample size (pupils)
66 (454)
51 (345)
Table E7: Analysis of attitudes to school - Year 5 pupils FSM interaction model
Adjusted analysis Regression coefficient of the interaction between free school meals and experimental cell (95% CI)
3.53 (-4.87 to 11.92)
P-value 0.41
ICC (SE) 0.043 (0.015)
Variance school level (SE) 41.51 (15.14)
Variance pupil level (SE) 919.00 (31.02)
Variance component on Free School Meals (SE) 29.57 (39.22)
Total sample size (pupils) 60 (1,836)
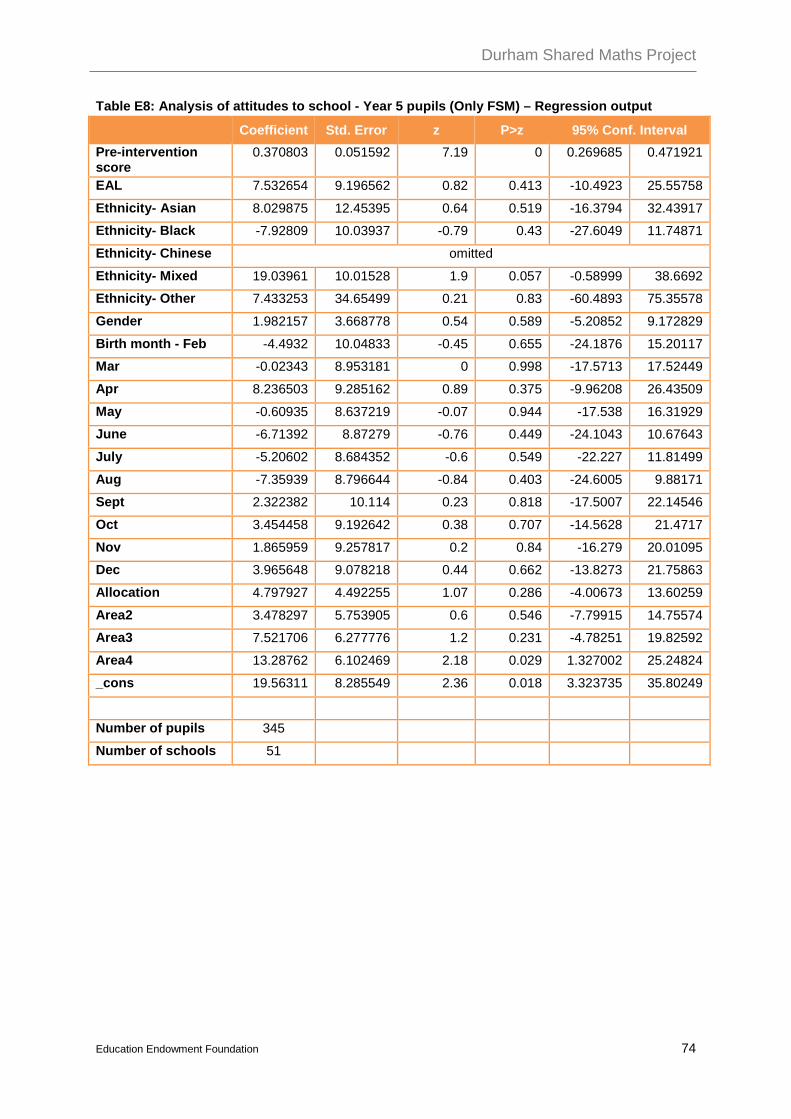
Durham Shared Maths Project
Education Endowment Foundation 74
Table E8: Analysis of attitudes to school - Year 5 pupils (Only FSM) – Regression output
Coefficient Std. Error z P>z 95% Conf. Interval Pre-intervention score
0.370803 0.051592 7.19 0 0.269685 0.471921
EAL 7.532654 9.196562 0.82 0.413 -10.4923 25.55758
Ethnicity- Asian 8.029875 12.45395 0.64 0.519 -16.3794 32.43917
Ethnicity- Black -7.92809 10.03937 -0.79 0.43 -27.6049 11.74871
Ethnicity- Chinese omitted
Ethnicity- Mixed 19.03961 10.01528 1.9 0.057 -0.58999 38.6692
Ethnicity- Other 7.433253 34.65499 0.21 0.83 -60.4893 75.35578
Gender 1.982157 3.668778 0.54 0.589 -5.20852 9.172829
Birth month - Feb -4.4932 10.04833 -0.45 0.655 -24.1876 15.20117
Mar -0.02343 8.953181 0 0.998 -17.5713 17.52449
Apr 8.236503 9.285162 0.89 0.375 -9.96208 26.43509
May -0.60935 8.637219 -0.07 0.944 -17.538 16.31929
June -6.71392 8.87279 -0.76 0.449 -24.1043 10.67643
July -5.20602 8.684352 -0.6 0.549 -22.227 11.81499
Aug -7.35939 8.796644 -0.84 0.403 -24.6005 9.88171
Sept 2.322382 10.114 0.23 0.818 -17.5007 22.14546
Oct 3.454458 9.192642 0.38 0.707 -14.5628 21.4717
Nov 1.865959 9.257817 0.2 0.84 -16.279 20.01095
Dec 3.965648 9.078218 0.44 0.662 -13.8273 21.75863
Allocation 4.797927 4.492255 1.07 0.286 -4.00673 13.60259
Area2 3.478297 5.753905 0.6 0.546 -7.79915 14.75574
Area3 7.521706 6.277776 1.2 0.231 -4.78251 19.82592
Area4 13.28762 6.102469 2.18 0.029 1.327002 25.24824
_cons 19.56311 8.285549 2.36 0.018 3.323735 35.80249
Number of pupils 345
Number of schools 51

Durham Shared Maths Project
Education Endowment Foundation 75
Appendix F: Analysis of secondary outcome: Attitudes towards reading Table F1: Analysis of attitudes towards reading - Year 3 pupils - Regression output
Coefficient Std. Error z P>z 95% Conf. Interval Pre-intervention score
0.281766 0.024081 11.7 0 0.234568 0.328965
FSM eligibility -0.86425 2.473418 -0.35 0.727 -5.71206 3.983564
EAL -0.06288 4.257913 -0.01 0.988 -8.40824 8.282473
Ethnicity- Asian 10.22136 5.448506 1.88 0.061 -0.45751 20.90024
Ethnicity- Black 11.1272 5.901724 1.89 0.059 -0.43997 22.69436
Ethnicity- Chinese -1.89901 14.09401 -0.13 0.893 -29.5228 25.72475
Ethnicity- Mixed 11.05402 4.519081 2.45 0.014 2.196784 19.91126
Ethnicity- Other 8.822985 9.647972 0.91 0.36 -10.0867 27.73266
Gender 7.648739 1.899195 4.03 0 3.926386 11.37109
Birth month - Feb 0.60052 4.641738 0.13 0.897 -8.49712 9.69816
Mar 5.393345 4.641583 1.16 0.245 -3.70399 14.49068
Apr 1.707408 4.480469 0.38 0.703 -7.07415 10.48897
May 3.871299 4.523528 0.86 0.392 -4.99465 12.73725
June 2.382914 4.626238 0.52 0.606 -6.68435 11.45017
July 2.675747 4.636516 0.58 0.564 -6.41166 11.76315
Aug 5.395616 4.430652 1.22 0.223 -3.2883 14.07954
Sept 6.72876 4.591569 1.47 0.143 -2.27055 15.72807
Oct 6.520984 4.573857 1.43 0.154 -2.44361 15.48558
Nov 4.798168 4.519356 1.06 0.288 -4.05961 13.65594
Dec 5.27408 4.705326 1.12 0.262 -3.94819 14.49635
Allocation -2.74024 2.50741 -1.09 0.274 -7.65468 2.174192
Area2 1.86691 3.3434 0.56 0.577 -4.68604 8.419855
Area3 2.294489 3.493722 0.66 0.511 -4.55308 9.142057
Area4 3.622675 3.345659 1.08 0.279 -2.9347 10.18005
_cons 25.62927 4.167146 6.15 0 17.46181 33.79672
Number of pupils 1878
Number of schools 55

Durham Shared Maths Project
Education Endowment Foundation 76
Table F2: Analysis of attitudes towards reading - Year 5 pupils - Regression output
Coefficient Std. Error z P>z 95% Conf. Interval Pre-intervention score
0.493419 0.022501 21.93 0 0.449318 0.53752
FSM eligibility -2.83676 2.20048 -1.29 0.197 -7.14962 1.4761
EAL 2.911857 3.840518 0.76 0.448 -4.61542 10.43913
Ethnicity- Asian -2.10423 5.06607 -0.42 0.678 -12.0335 7.825083
Ethnicity- Black -1.53791 5.054979 -0.3 0.761 -11.4455 8.36967
Ethnicity- Chinese -15.0056 16.6176 -0.9 0.367 -47.5755 17.56433
Ethnicity- Mixed 2.213464 4.468228 0.5 0.62 -6.5441 10.97103
Ethnicity- Other -21.7939 11.11886 -1.96 0.05 -43.5865 -0.00133
Gender 6.125377 1.717279 3.57 0 2.759572 9.491182
Birth month - Feb 0.44674 4.47168 0.1 0.92 -8.31759 9.211071
Mar -5.21962 4.290449 -1.22 0.224 -13.6287 3.189509
Apr 0.643068 4.015941 0.16 0.873 -7.22803 8.514169
May 0.928532 3.996968 0.23 0.816 -6.90538 8.762446
June -2.31184 4.104697 -0.56 0.573 -10.3569 5.733215
July -2.37119 4.188411 -0.57 0.571 -10.5803 5.837946
Aug 4.246531 4.016534 1.06 0.29 -3.62573 12.11879
Sept -4.59212 4.131036 -1.11 0.266 -12.6888 3.504566
Oct 2.362612 4.061234 0.58 0.561 -5.59726 10.32249
Nov -3.14323 4.18194 -0.75 0.452 -11.3397 5.053219
Dec -4.17927 4.031846 -1.04 0.3 -12.0815 3.723007
Allocation 0.561854 2.180917 0.26 0.797 -3.71267 4.836373
Area2 3.968025 2.873348 1.38 0.167 -1.66363 9.599683
Area3 7.88154 3.03311 2.6 0.009 1.936753 13.82633
Area4 -5.55415 2.958846 -1.88 0.06 -11.3534 0.24508
_cons 13.70447 3.803228 3.6 0 6.250279 21.15866
Number of pupils 1835
Number of schools 60

Durham Shared Maths Project
Education Endowment Foundation 77
Table F3: Analysis of attitudes to reading - Year 3 pupils FSM only
Unadjusted analysis Adjusted analysis Effect Size (CI) - -0.01
(-0.23 to 0.21) Regression coefficient (95% CI)
1.27 (-7.10 to 9.64)
-0.44 (-10.30 to 9.41)
P-value 0.77 0.93 ICC (SE) 0.000
(0.000) 0.000
(0.000) Variance school level (SE)
0.00 (0.00)
0.00 (0.00)
Variance pupil level (SE)
2119.53 (138.26)
1909.14 (146.86)
Total sample size (pupils)
68 (470)
51 (338)
Table F4: Analysis of attitudes to reading - Year 3 pupils FSM interaction model
Adjusted analysis Regression coefficient of the interaction between free school meals and experimental cell (95% CI)
3.79 (-6.09 to 13.66)
P-value 0.45
ICC (SE) 0.019 (0.010)
Variance school level (SE) 31.17 (16.27)
Variance pupil level (SE) 1594.72 (52.85)
Variance component on Free School Meals (SE) 0.000 (0.000)
Total sample size (pupils) 55 (1,878)

Durham Shared Maths Project
Education Endowment Foundation 78
Table F5: Analysis of attitudes to reading - Year 3 pupils (Only FSM) – Regression output
Coefficient Std. Error z P>z 95% Conf. Interval Pre-intervention score
0.096796 0.060335 1.6 0.109 -0.02146 0.215052
EAL 1.044444 11.94847 0.09 0.93 -22.3741 24.46301
Ethnicity- Asian 9.802471 17.09975 0.57 0.566 -23.7124 43.31736
Ethnicity- Black 1.984773 15.75349 0.13 0.9 -28.8915 32.86104
Ethnicity- Chinese -3.28161 33.70963 -0.1 0.922 -69.3513 62.78804
Ethnicity- Mixed 17.96279 9.942895 1.81 0.071 -1.52492 37.45051
Ethnicity- Other 13.77149 24.03394 0.57 0.567 -33.3342 60.87713
Gender 14.21285 4.921659 2.89 0.004 4.566579 23.85913
Birth month - Feb 2.480873 11.70127 0.21 0.832 -20.4532 25.41494
Mar -1.77888 13.01294 -0.14 0.891 -27.2838 23.726
Apr -0.20649 11.00902 -0.02 0.985 -21.7838 21.37079
May 4.945059 11.53527 0.43 0.668 -17.6637 27.55376
June -7.06031 12.15545 -0.58 0.561 -30.8845 16.76393
July -4.78688 12.62937 -0.38 0.705 -29.54 19.96624
Aug -0.02256 11.16675 0 0.998 -21.909 21.86386
Sept -9.33374 13.28081 -0.7 0.482 -35.3637 16.69618
Oct 19.79681 11.68377 1.69 0.09 -3.10296 42.69658
Nov -8.1373 10.71688 -0.76 0.448 -29.142 12.86739
Dec 23.40608 11.97322 1.95 0.051 -0.061 46.87315
Allocation -0.44376 5.028291 -0.09 0.93 -10.299 9.411514
Area2 7.337483 6.464648 1.14 0.256 -5.333 20.00796
Area3 11.06099 7.217873 1.53 0.125 -3.08578 25.20776
Area4 9.795561 6.883039 1.42 0.155 -3.69495 23.28607
_cons 27.99766 10.20096 2.74 0.006 8.00415 47.99117
Number of pupils 338
Number of schools 51

Durham Shared Maths Project
Education Endowment Foundation 79
Table F6: Analysis of attitudes to reading - Year 5 pupils FSM only
Unadjusted analysis Adjusted analysis Effect Size (CI) - 0.05
(-0.19 to 0.29) Regression coefficient (95% CI)
2.39 (-7.09 to 11.86)
2.13 (-8.48 to 12.73)
P-value 0.62 0.70 ICC (SE) 0.030
(0.028) 0.035
(0.038) Variance school level (SE)
61.27 (59.76)
60.90 (67.26)
Variance pupil level (SE)
2018.62 (141.92)
1693.92 (139.10)
Total sample size (pupils)
66 (454)
51 (344)
Table F7: Analysis of attitudes to reading - Year 5 pupils FSM interaction model
Adjusted analysis Regression coefficient of the interaction between free school meals and experimental cell (95% CI)
1.87 (-9.02 to 12.76)
P-value 0.74
ICC (SE) 0.010 (0.008)
Variance school level (SE) 13.16 (10.09)
Variance pupil level (SE) 1277.97 (43.05)
Variance component on Free School Meals (SE) 100.81 (66.26)
Total sample size (pupils) 60 (1,835)

Durham Shared Maths Project
Education Endowment Foundation 80
Table F8: Analysis of attitudes to reading - Year 5 pupils (Only FSM) – Regression output
Coefficient Std. Error z P>z 95% Conf. Interval Pre-intervention score
0.331225 0.060364 5.49 0 0.212913 0.449536
EAL 6.995758 11.70665 0.6 0.55 -15.9489 29.94038
Ethnicity- Asian 21.71712 15.7869 1.38 0.169 -9.22464 52.65889
Ethnicity- Black 2.211569 12.80433 0.17 0.863 -22.8845 27.30759
Ethnicity- Chinese Omitted
Ethnicity- Mixed 33.31562 12.7544 2.61 0.009 8.31746 58.31378
Ethnicity- Other 37.92898 44.21522 0.86 0.391 -48.7313 124.5892
Gender 3.308852 4.619516 0.72 0.474 -5.74523 12.36294
Birth month - Feb -7.05893 12.85541 -0.55 0.583 -32.2551 18.13722
Mar 1.135562 11.49609 0.1 0.921 -21.3964 23.66748
Apr 5.458684 11.81281 0.46 0.644 -17.694 28.61137
May 6.029897 10.97557 0.55 0.583 -15.4818 27.54161
June -4.48763 11.32869 -0.4 0.692 -26.6915 17.7162
July 3.039341 11.07613 0.27 0.784 -18.6695 24.74816
Aug 14.56292 11.20061 1.3 0.194 -7.38988 36.51572
Sept -2.03231 12.79773 -0.16 0.874 -27.1154 23.05078
Oct 10.42926 11.73506 0.89 0.374 -12.571 33.42955
Nov -2.73109 11.80523 -0.23 0.817 -25.8689 20.40674
Dec -2.39229 11.61457 -0.21 0.837 -25.1564 20.37186
Allocation 2.125545 5.412556 0.39 0.695 -8.48287 12.73396
Area2 -1.69401 6.898471 -0.25 0.806 -15.2148 11.82674
Area3 4.649404 7.514354 0.62 0.536 -10.0785 19.37727
Area4 -4.0644 7.312718 -0.56 0.578 -18.3971 10.26827
_cons 16.23586 10.36932 1.57 0.117 -4.08764 36.55936
Number of pupils 344
Number of schools 51

Durham Shared Maths Project
Education Endowment Foundation 81
Appendix G: Analysis of secondary outcome: Attitudes towards maths Table G1: Analysis of attitudes towards maths - Year 3 pupils - Regression output
Coefficient Std. Error z P>z 95% Conf. Interval Pre-intervention score
0.315927 0.021956 14.39 0 0.272895 0.358959
FSM eligibility 3.591074 2.602344 1.38 0.168 -1.50943 8.691574
EAL 8.361775 4.470191 1.87 0.061 -0.39964 17.12319
Ethnicity- Asian 0.618183 5.732523 0.11 0.914 -10.6174 11.85372
Ethnicity- Black -16.6922 6.197788 -2.69 0.007 -28.8396 -4.54476
Ethnicity- Chinese 12.97884 14.77343 0.88 0.38 -15.9766 41.93422
Ethnicity- Mixed 1.824719 4.735418 0.39 0.7 -7.45653 11.10597
Ethnicity- Other -10.4483 10.10412 -1.03 0.301 -30.2521 9.355369
Gender -9.41595 1.95618 -4.81 0 -13.25 -5.5819
Birth month - Feb -8.85247 4.860951 -1.82 0.069 -18.3798 0.674821
Mar -3.07999 4.859308 -0.63 0.526 -12.6041 6.444081
Apr -4.63921 4.69351 -0.99 0.323 -13.8383 4.559897
May -3.19534 4.740973 -0.67 0.5 -12.4875 6.096801
June -0.67883 4.842258 -0.14 0.889 -10.1695 8.811823
July -0.05119 4.856711 -0.01 0.992 -9.57017 9.467785
Aug -11.398 4.649084 -2.45 0.014 -20.51 -2.28597
Sept -2.41037 4.808345 -0.5 0.616 -11.8346 7.013814
Oct -6.0261 4.793598 -1.26 0.209 -15.4214 3.369175
Nov -4.91562 4.735039 -1.04 0.299 -14.1961 4.364884
Dec -10.1895 4.925775 -2.07 0.039 -19.8439 -0.53518
Allocation 1.741568 2.894109 0.6 0.547 -3.93078 7.413917
Area2 -0.14385 3.862663 -0.04 0.97 -7.71452 7.426834
Area3 8.648432 4.0322 2.14 0.032 0.745465 16.5514
Area4 2.828435 3.856494 0.73 0.463 -4.73015 10.38702
_cons 33.76249 4.491741 7.52 0 24.95884 42.56614
Number of pupils 1878
Number of schools 55

Durham Shared Maths Project
Education Endowment Foundation 82
Table G2: Analysis of attitudes towards maths - Year 5 pupils - Regression output
Coefficient Std. Error z P>z 95% Conf. Interval Pre-intervention score
0.392786 0.020586 19.08 0 0.352439 0.433133
FSM eligibility -3.75345 2.065772 -1.82 0.069 -7.80229 0.295385
EAL 5.21876 3.601967 1.45 0.147 -1.84097 12.27849
Ethnicity- Asian 3.396927 4.747948 0.72 0.474 -5.90888 12.70273
Ethnicity- Black 4.965885 4.73997 1.05 0.295 -4.32429 14.25606
Ethnicity- Chinese 16.75618 15.51971 1.08 0.28 -13.6619 47.17425
Ethnicity- Mixed 2.916874 4.177367 0.7 0.485 -5.27061 11.10436
Ethnicity- Other -6.58558 10.3713 -0.63 0.525 -26.913 13.74178
Gender -4.74897 1.586459 -2.99 0.003 -7.85837 -1.63956
Birth month - Feb -6.55222 4.171167 -1.57 0.116 -14.7276 1.623116
Mar -4.61164 3.994185 -1.15 0.248 -12.4401 3.216819
Apr -2.87891 3.751574 -0.77 0.443 -10.2319 4.474042
May 3.960733 3.725521 1.06 0.288 -3.34116 11.26262
June -1.30323 3.831026 -0.34 0.734 -8.8119 6.205445
July -8.62312 3.909653 -2.21 0.027 -16.2859 -0.96035
Aug -5.42327 3.749898 -1.45 0.148 -12.7729 1.926394
Sept -1.6172 3.855486 -0.42 0.675 -9.17382 5.93941
Oct -0.31659 3.790039 -0.08 0.933 -7.74493 7.111748
Nov -3.82666 3.905088 -0.98 0.327 -11.4805 3.827168
Dec -2.34745 3.771042 -0.62 0.534 -9.73855 5.043658
Allocation -3.31143 2.355778 -1.41 0.16 -7.92867 1.305814
Area2 3.626297 3.104773 1.17 0.243 -2.45895 9.71154
Area3 1.430112 3.2772 0.44 0.663 -4.99308 7.853306
Area4 3.966428 3.184055 1.25 0.213 -2.27421 10.20706
_cons 21.66429 3.68832 5.87 0 14.43532 28.89327
Number of pupils 1835
Number of schools 60
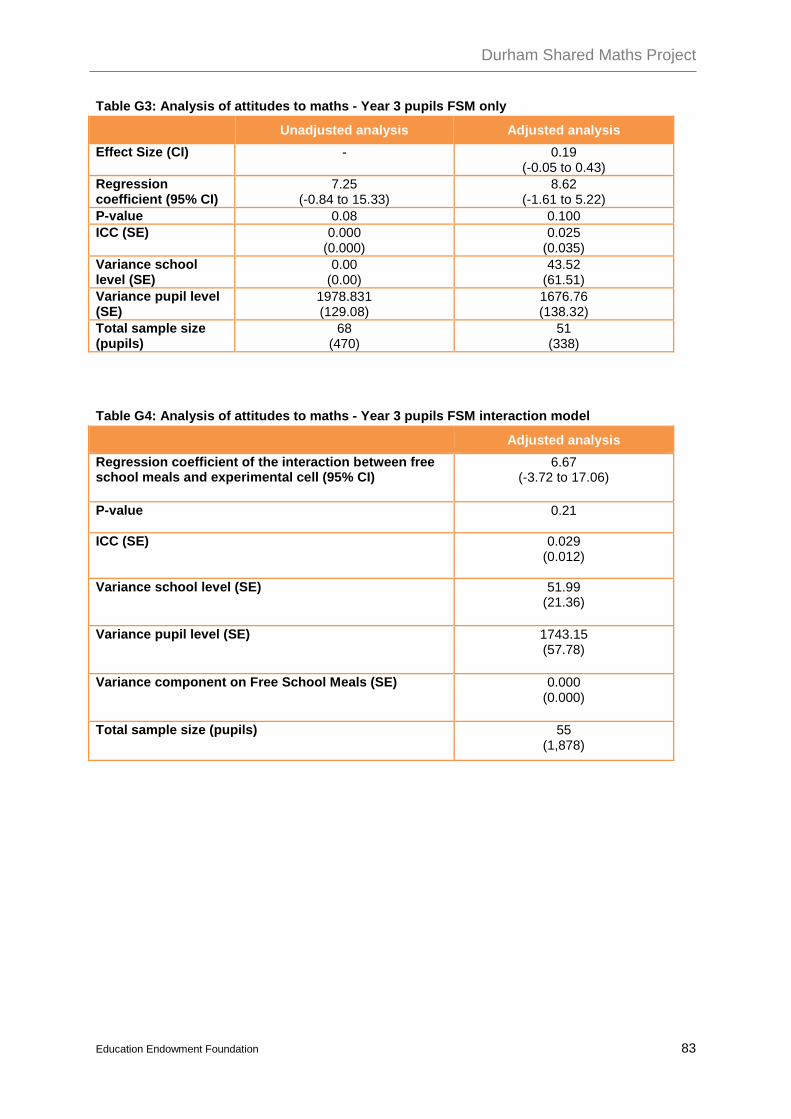
Durham Shared Maths Project
Education Endowment Foundation 83
Table G3: Analysis of attitudes to maths - Year 3 pupils FSM only
Unadjusted analysis Adjusted analysis Effect Size (CI) - 0.19
(-0.05 to 0.43) Regression coefficient (95% CI)
7.25 (-0.84 to 15.33)
8.62 (-1.61 to 5.22)
P-value 0.08 0.100 ICC (SE) 0.000
(0.000) 0.025
(0.035) Variance school level (SE)
0.00 (0.00)
43.52 (61.51)
Variance pupil level (SE)
1978.831 (129.08)
1676.76 (138.32)
Total sample size (pupils)
68 (470)
51 (338)
Table G4: Analysis of attitudes to maths - Year 3 pupils FSM interaction model
Adjusted analysis Regression coefficient of the interaction between free school meals and experimental cell (95% CI)
6.67 (-3.72 to 17.06)
P-value 0.21
ICC (SE) 0.029 (0.012)
Variance school level (SE) 51.99 (21.36)
Variance pupil level (SE) 1743.15 (57.78)
Variance component on Free School Meals (SE) 0.000 (0.000)
Total sample size (pupils) 55 (1,878)
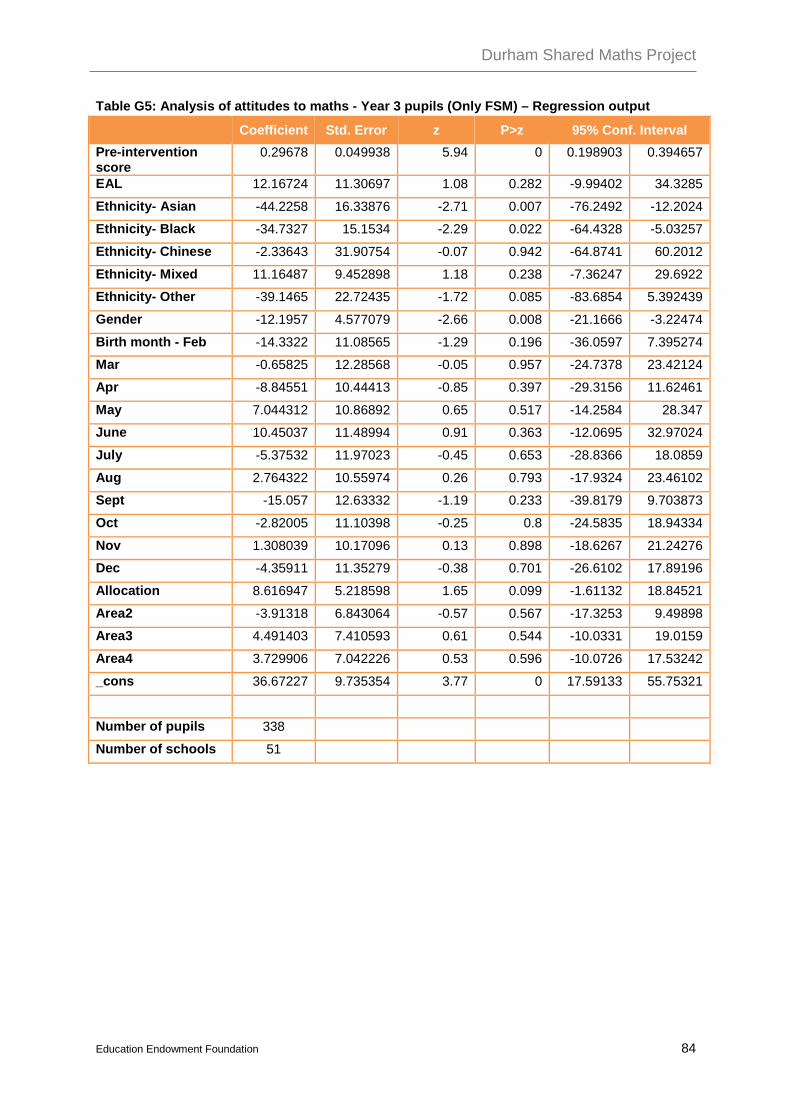
Durham Shared Maths Project
Education Endowment Foundation 84
Table G5: Analysis of attitudes to maths - Year 3 pupils (Only FSM) – Regression output
Coefficient Std. Error z P>z 95% Conf. Interval Pre-intervention score
0.29678 0.049938 5.94 0 0.198903 0.394657
EAL 12.16724 11.30697 1.08 0.282 -9.99402 34.3285
Ethnicity- Asian -44.2258 16.33876 -2.71 0.007 -76.2492 -12.2024
Ethnicity- Black -34.7327 15.1534 -2.29 0.022 -64.4328 -5.03257
Ethnicity- Chinese -2.33643 31.90754 -0.07 0.942 -64.8741 60.2012
Ethnicity- Mixed 11.16487 9.452898 1.18 0.238 -7.36247 29.6922
Ethnicity- Other -39.1465 22.72435 -1.72 0.085 -83.6854 5.392439
Gender -12.1957 4.577079 -2.66 0.008 -21.1666 -3.22474
Birth month - Feb -14.3322 11.08565 -1.29 0.196 -36.0597 7.395274
Mar -0.65825 12.28568 -0.05 0.957 -24.7378 23.42124
Apr -8.84551 10.44413 -0.85 0.397 -29.3156 11.62461
May 7.044312 10.86892 0.65 0.517 -14.2584 28.347
June 10.45037 11.48994 0.91 0.363 -12.0695 32.97024
July -5.37532 11.97023 -0.45 0.653 -28.8366 18.0859
Aug 2.764322 10.55974 0.26 0.793 -17.9324 23.46102
Sept -15.057 12.63332 -1.19 0.233 -39.8179 9.703873
Oct -2.82005 11.10398 -0.25 0.8 -24.5835 18.94334
Nov 1.308039 10.17096 0.13 0.898 -18.6267 21.24276
Dec -4.35911 11.35279 -0.38 0.701 -26.6102 17.89196
Allocation 8.616947 5.218598 1.65 0.099 -1.61132 18.84521
Area2 -3.91318 6.843064 -0.57 0.567 -17.3253 9.49898
Area3 4.491403 7.410593 0.61 0.544 -10.0331 19.0159
Area4 3.729906 7.042226 0.53 0.596 -10.0726 17.53242
_cons 36.67227 9.735354 3.77 0 17.59133 55.75321
Number of pupils 338
Number of schools 51

Durham Shared Maths Project
Education Endowment Foundation 85
Table G6: Analysis of attitudes to maths - Year 5 pupils FSM only
Unadjusted analysis Adjusted analysis Effect Size (CI) - -0.03
(-0.25 to 0.19) Regression coefficient (95% CI)
-2.34 (-10.51 to 5.83)
-1.38 (-10.20 to 7.45)
P-value 0.57 0.76 ICC (SE) 0.015
(0.026) 0.005
(0.029) Variance school level (SE)
25.47 (45.09)
7.27 (43.07)
Variance pupil level (SE)
1691.57 (119.03)
1463.93 (118.85)
Total sample size (pupils)
66 (454)
51 (345)
Table G7: Analysis of attitudes to maths - Year 5 pupils FSM interaction model
Adjusted analysis Regression coefficient of the interaction between free school meals and experimental cell (95% CI)
1.22 (-8.04 to 10.48)
P-value 0.80
ICC (SE) 0.030 (0.011)
Variance school level (SE) 34.98 (13.22)
Variance pupil level (SE) 1112.89 (37.79)
Variance component on Free School Meals (SE) 38.53 (49.74)
Total sample size (pupils) 60 (1,836)

Durham Shared Maths Project
Education Endowment Foundation 86
Table G8: Analysis of attitudes to maths - Year 5 pupils (Only FSM) – Regression output
Coefficient Std. Error z P>z 95% Conf. Interval Pre-intervention score
0.262347 0.052821 4.97 0 0.158819 0.365874
EAL 14.21941 10.6885 1.33 0.183 -6.72968 35.16849
Ethnicity- Asian 0.880901 14.3593 0.06 0.951 -27.2628 29.02461
Ethnicity- Black 8.201419 11.69054 0.7 0.483 -14.7116 31.11446
Ethnicity- Chinese Omitted
Ethnicity- Mixed 19.58942 11.71686 1.67 0.095 -3.3752 42.55405
Ethnicity- Other -37.1966 40.7877 -0.91 0.362 -117.139 42.74579
Gender -7.04253 4.235361 -1.66 0.096 -15.3437 1.258621
Birth month - Feb -6.63504 11.80703 -0.56 0.574 -29.7764 16.5063
Mar -13.0747 10.51346 -1.24 0.214 -33.6807 7.531293
Apr -6.86913 10.8558 -0.63 0.527 -28.1461 14.40786
May -0.96798 10.12993 -0.1 0.924 -20.8223 18.88631
June -16.7283 10.46963 -1.6 0.11 -37.2484 3.791772
July -19.2432 10.21832 -1.88 0.06 -39.2707 0.784367
Aug -5.19402 10.31164 -0.5 0.614 -25.4045 15.01642
Sept -6.85821 11.754 -0.58 0.56 -29.8956 16.17921
Oct 6.683428 10.83767 0.62 0.537 -14.558 27.92487
Nov 1.042106 10.89563 0.1 0.924 -20.3129 22.39716
Dec -15.5861 10.70446 -1.46 0.145 -36.5664 5.394281
Allocation -1.37585 4.501817 -0.31 0.76 -10.1993 7.447546
Area2 4.496068 5.70175 0.79 0.43 -6.67916 15.67129
Area3 4.570336 6.237808 0.73 0.464 -7.65554 16.79621
Area4 10.47598 6.20216 1.69 0.091 -1.68003 22.63199
_cons 24.82165 9.143552 2.71 0.007 6.900617 42.74268
Number of pupils 345
Number of schools 51

Durham Shared Maths Project
Education Endowment Foundation 87
Appendix H: Security classification of trial findings
Rating 1. Design 2. Power (MDES)
3. Attrition 4. Balance 5. Threats to validity
5 Fair and clear experimental design (RCT) < 0.2 < 10% Well-balanced on
observables No threats to validity
4 Fair and clear experimental design (RCT, RDD) < 0.3 < 20%
3 Well-matched comparison (quasi-experiment) < 0.4 < 30%
2 Matched comparison (quasi-experiment) < 0.5 < 40%
1 Comparison group with poor or no matching < 0.6 < 50%
0 No comparator > 0.6 > 50% Imbalanced on observables Significant threats
The final security rating for this trial is 4 . This means that the conclusions have moderate to high security.
The trial was designed as an efficacy trial and could achieve a maximum of 5 . This was a well conducted, and well powered, RCT. There was very low attrition at the school-level, although higher attrition among pupils (16%), and only small differences between arms that appeared to have arisen due to chance. However, the tests were administered by the schools and the delivery team. Therefore, the overall padlock rating is 4 .

Durham Shared Maths Project
Education Endowment Foundation 88
Appendix I: Cost rating
Cost rating Description
£ Very low: less than £80 per pupil per year.
£ £ Low: up to about £200 per pupil per year.
£ £ £ Moderate: up to about £700 per pupil per year.
£ £ £ £ High: up to £1,200 per pupil per year.
£ £ £ £ £ Very high: over £1,200 per pupil per year.

You may re-use this document/publication (not including logos) free of charge in any format or medium, under the terms of the Open Government Licence v2.0.
To view this licence, visit www.nationalarchives.gov.uk/doc/open-government-licence/version/2 or email: [email protected]
Where we have identified any third party copyright information you will need to obtain permission from the copyright holders concerned. The views expressed in this report are the authors’ and do not necessarily reflect those of the Department for Education.
This document is available for download at www.educationendowmentfoundation.org.uk
The Education Endowment Foundation 9th Floor, Millbank Tower 21–24 Millbank London SW1P 4QP www.educationendowmentfoundation.org.uk