durability of geosynthetic soil reinforcement elements...
TRANSCRIPT

46 TRANSPORTATION RESEARCH RECORD 1439
Durability of Geosynthetic Soil Reinforcement Elements in Tanque Verde Retaining Wall Structures
DONALD G. BRIGHT, JAMES G. COLLINS, AND RYAN R. BERG
The findings of an investigation into the stability and durability of high-density polyethylene (HOPE) geogrid soil reinforcing elements used in grade separation structures on a project at the Tanque VerdeWrightstown - Pantano Roads intersection in Tucson, Arizona, is documented. The project represents the first use of geogrid reinforcement in concrete-faced, mechanically stabilized earth retaining walls in a major transportation-related application in North America. The reinforced soil walls were constructed in 1984 and 1985, and the geogrids have been in service for 8 to 9 years in an elevated temperature environment that accelerates the mechanisms of degradation. The combined effects of age and temperature exposure made this project a candidate for evaluation of geosynthetic reinforcement stability and durability. A sample retrieved from the project was subjected to a series of laboratory procedures and tests. Results of the tests are presented as topological analysis, ultimate tensile strength, ultimate tensile strain, 1,000-hr creep response, melt rheology, melt temperature range, crystallinity, and oxidative induction times. Test results are compared to archived geogrid values. Soil samples also were retrieved and analyzed. It is concluded that after more than 8 years of exposure to an elevated temperature environment, the exhumed HOPE geogrid has not experienced any significant change in the physical and performance properties of the geogrid or the morphological properties of the HOPE.
The durability of a specific geogrid soil reinforcing element used in a specific project is examined. The geogrid elements have been in service for between 8 and 9 years in concrete-faced, mechanically stabilized earth (MSE) retaining wall structures. The project is located in the southwestern United States and is exposed to high summer temperatures.
A summary description of the project is presented and references providing detailed design and performance information are noted. The mechanical instrumentation program and monitored results are referenced. The procedure used for exhumation of a geogrid sample is described, and a description and illustration of the geogrid reinforcing element is presented. The test methods used in this durability evaluation and a rationale are summarized along with tabulated test results and a discussion of the findings. Conclusions are stated regarding the durability of the geogrid based on interpretation of test results from archived and exhumed samples.
PROJECT DESCRIPTION
Forty-six geogrid-reinforced retaining walls were constructed to created grade separations for the Tanque Verde-Wrightstown-
D. G. Bright, Tensar Corporation, 1210 Citizens Parkway, Morrow, Ga. 30260. J. G. Collin, Tensar Earth Technologies, Inc., 5775-B Glenridge Drive, Lakeside Center, Suite 450, Atlanta, Ga. 30238-5363. R. R. Berg, R.R. Berg & Associates, Inc., 2190 Leyland Alcove, Woodbury, Minn. 55125.
Pantano Roads intersection in Tucson, Arizona (Figure 1). Approximately 1600 lineal meters (m) of wall were constructed between December 1984 and September 1985. The walls vary in height from 1 to 6 m.
The precast concrete wall face panels are 0.15 m thick, 3 m wide, and full height. Four cross-section wall geom~tries, as illustrated in Figure 2, were used for the 46 wall structures. Comprehensive details of the wall design are presented in a value engineering study, the design report (J), and in the project construction drawings (2). Two of the Type D wall sections were instrumented in September 1985 and have been monitored since then. The goal of the instrumentation program is to assess the performance of the wall structures. Stresses and strains in the soil and strain in the geogrid are monitored with pneumatic load cells, inductance coils, and resistance strain gauges. Internal and external wall temperatures are monitored with resistance thermometers. Panel displacements during and immediately after construction were monitored using optical survey techniques. Brief descriptions of the instrumentation program and instrumentation readings during and immediately after construction have been presented by Berg et al. (3). Reports of the post-construction monitoring program have been presented by Desert Earth Engineering (4,5).
A comprehensive report on the project, incorporating the Dames and Moore design report and the Desert Earth Engineering monitoring results and an interpretation, has been published by the FHWA (6) and by Fishman et al. (7). A summary of monitoring results through the first 4 years in service was presented at the 1991 TRB Annual Meeting (8). A summary of monitoring results through the first 8 years in service was presented at the Seiken Symposium in Japan by Collin and Berg (9).
Based on resistance thermometer readings from one of the two monitored Type D wall sections, transient temperatures up to approximately 49°C (120°F) on the concrete wall face panels were recorded, and up to approximately 38°C (100°F) behind the panels. Figure 3 shows the temperature readings at various elevations within a Type D wall section as recorded in March and June 1986.
Mechanical response over time is the focus of the still-active instrumentation program. Based on readings of the two monitored wall sections, the geogrid reinforcement has experienced low tensile loads, resulting in maximum ·strains of less than 1 percent. Typical strains of 0.5 percent and 1.0 percent have been recorded for the two instrumented sections.
Although instrument readings taken as recently as September 1992 indicate no significant change in performance over time, an investigation into the stability of the geogrid soil reinforcing elements was initiated in 1993. An analysis of the geogrids used in this project was deemed appropriate because it is the oldest struc-

(a)
(c)
FIGURE 1 Tanque Verde- Wrightstown -Pantano Roads intersection.
1--------;J:(
---~~ ----"'---"---- LEVELING PAD
TRAFFIC BARRIER
'~"w-
I I I I I __ _)
I I I
(d)
SLOPE VARIES
CONCRETE FACING PANEL
FINAL GROUND ELEVATION VARIES
(b)
GEOGRID REINFORCEMENT
::,I.( "- . -~~
- - ~EINFORCED FILL
-.C- RETAINED FILL "°"""'Y
CONCRETE PAVEMENT
I I
II _ _)
- - _CL- ''Y-.'\{~ -
I I I
I I I
FIGURE 2 Four wall geometries used in Tanque Verde retaining wall structures. a, Type A wall; b, Type B wall; c, Type C wall; d, Type D walL
48
Wall Face
11 (52)
45(113)
12(53)
51 ( 124)
13(55)
36(96)
Pavement
16(60)
35(95)
16(60)
36(97)
Temperature C(F) I March 1986
Temperature C(F) I June 1986
14(57)
33(92)
15(59)
30(85)
12(64)
29(85)
18(65)
25(77)
m(ft)
5.33(17.5)
4.57(15.0)
3.81 (12.5)
3 .05(10.0)
2.29(7 .5)
1.50(5.0)
0 . 76(2 .5)
0(0)
0(0) 0 . 76(2.5) 1 .5(5 .0)
m(ft)
2.29(7.5) 3 .05( 10.0)
FIGURE 3 Temperature readings within a wall section.
TRANSPORTATION RESEARCH RECORD 1439
ture of this type in service and because of the elevated temperatures associated with the project's location in the Sonoran Desert of Arizona.
EXHUMATION
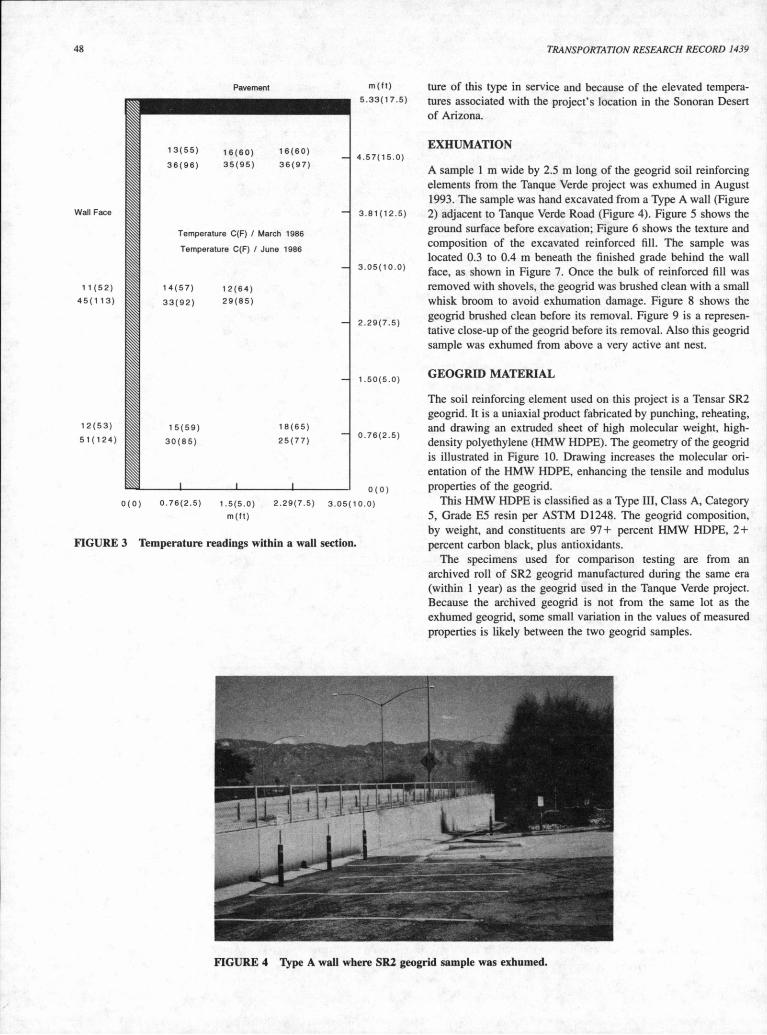
A sample 1 m wide by 2.5 m long of the geogrid soil reinforcing elements from the Tanque Verde project was exhumed in August 1993. The sample was hand excavated from a Type A wall (Figure 2) adjacent to Tanque Verde Road (Figure 4). Figure 5 shows the ground surface before excavation; Figure 6 shows the texture and composition of the excavated reinforced fill. The sample was located 0.3 to 0.4 m beneath the finished grade behind the wall face, as shown in Figure 7. Once the bulk of reinforced fill was removed with shovels, the geogrid was brushed clean with a small whisk broom to avoid exhumation damage. Figure 8 shows the geogrid brushed clean before its removal. Figure 9 is a representative close-up of the geogrid before its removal. Also this geogrid sample was exhumed from above a very active ant nest.
GEOGRID MATERIAL
The soil reinforcing element used on this project is a Tensar SR2 geogrid. It is a uniaxial product fabricated by punching, reheating, and drawing an extruded sheet of high molecular weight, highdensity polyethylene (HMW HDPE). The geometry of the geogrid is illustrated in Figure 10. Drawing increases the molecular orientation of the HMW HDPE, enhancing the tensile and modulus properties of the geogrid.
This HMW HDPE is classified as a Type III, Class A, Category 5, Grade ES resin per ASTM D 1248. The geogrid composition, by weight, and constituents are 97 + percent HMW HDPE, 2 + percent carbon black, plus antioxidants.
The specimens used for comparison testing are from an archived roll of SR2 geogrid manufactured during the same era (within 1 year) as the geogrid used in the Tanque Verde project. Because the archived geogrid is not from the same lot as the exhumed geogrid, some small variation in the values of measured properties is likely between the two geogrid samples.
FIGURE 4 Type A wall where SR2 geogrid sample was exhumed.

FIGURE 5 Ground surface at excavation site of SR2 geogrid sample.
FIGURE 6 Representative texture and composition of excavated reinforced fill.
FIGURE 7 Uncovered SR2 geogrid toward 'fype A wall.

FIGURE 8 SR2 geogrid brushed clean, showing no evidence of physical damage.
FIGURE 9 Close-up of SR2 geogrid, showing no evidence of physical damage and presence of a glossy surface.
0 ~
:::c: < I- 0 oz -< ~ 1-
1/l ..J
c5 t ~
ROLL LENGTH
(98.5 Fi. STANDARD)
4.2 In.
BAR
L_RIB
FIGURE 10 Geometry of SR2 geogrid

Bright et al.
TEST PROTOCOL AND STANDARDS
Deterioration of geosynthetics may occur due to physical damage (i.e., installation damage), mechanical deformation (i.e., dimensional change, ~ensile and elongation behavior, creep response), thermal degradation (i.e., transition temperatures, crystallinity, oxidation), and biological degradation (i.e., attack by macro- and microorganisms). Thus visual, physical, mechanical, thermal, and compositional tests have been performed with specimens from the archived and exhumed geogrid samples.
Visual analysis, using a photographic record, assesses the presence and extent of installation, exhumation, and macroorganism damage across the surface topology. Scanning electron micrographs show the extent of such damage, that is, surface degradation due to attack by oxidation (surface dullness), soil chemistries, and microorganisms. Physical tests assess dimensional stability due to annealing, as well as subsequent densification via geogrid shrinkage due to prolonged exposure to an elevated temperature environment. Mechanical tests assess retention of tensile and elongation properties and the behavioral response to a constant sustained load. But these tests cannot necessarily differentiate between the mechanisms of mechanical deformation. Thermal tests, however, may assess any significant changes in the morphological status of the HMW HDPE that may relate to changes in mechanical properties. Composition tests indicate the residual amount of the principal additive, carbon black. Comparison with original formulations documents any concentration changes, thus indicating the duration of long-term stability.
The parameters evaluated, the related tests and applicable standards, and the number of specimens (i.e., archived and exhumed) per test are summarized in Table 1. The ASTM standards are taken from the 1993 Annual Book of ASTM Standards published by ASTM, Philadelphia. The ORI standards are taken from Test Methads and Standards published by the Geosynthetic Research Insti~te at Drexel University in Philadelphia. The industrial standard for oxidative induction times (OITs) stipulates that a specimen be heated in a calorimeter at a rapid rate in an inert atmosphere (i.e., nitrogen) to a temperature usually above the melt range of the polymer (e.g., 200°C), allowed to thermally equilibrate, and then be switched to an oxygen atmosphere and timed and recorded
51
to the onset of an exotherm. An exotherm indicates oxidative degradation in progress.
TEST RESULTS
Physical and mechanical test results and resin properties are summarized in Table 2. For tests using multiple specimens, results in Table 2 are reported as arithmetic averages with standard deviation. Figure 11 shows the unconfined tension creep evaluation of the exhumed SR2 geogrid in progress. Figure 12 shows the creep response of specimens taken from two rolls of SR2 geogrid manufactured in the 1984-1985 era, but within 1 year, and loaded to 31.7 kN/m, equivalent to 2, 170 lb/ft. One roll was chosen for quality control (QC) testing following its manufacture; the other roll went into the Tanque Verde project and was exhumed more than 8 years later for evaluation. Figure 13 shows the creep response of specimens taken from two rolls of SR2 geogrid manufactured in the 1984-1985 era also, and within 1 year; both specimens are loaded to the design loading of 29 kN/m (2,000 lb/ft). One roll was archived; the other roll is the same as in Figure 12. Results of thermal analysis of geogrid components are summarized in Table 3. Melt transition and crystallinity sample sizes ranged from 9.4 to 10.2 mg. Only one thermogram was run per component because specimens were taken at random and results were typical of HMW HDPE.
A soil sample was taken from the exhumation site at Tanque Verde in Tucson, Arizona, for analysis; the soil fractions were 15.5/81.8/2.7, by weight percent, for gravel, sand, and fines, respectively. Soil pH was 8.0 and 8.7 in distilled water, and 7.6 and 7.8 in a 0.01 molal solution of CaCii. respectively.
DISCUSSION OF RESULTS
Visual Assessment
Photographs of the exhumation site at the Tanque VerdeWrightstown - Pantano Roads intersection are presented as Figures 4 and 5. Figure 6 shows the texture and nature in the reinforced
TABLE 1 Properties and Related Tests and Specific Standards
Number of Seecimens Tests Parameters Standards Archived Exhumed
Samele Samele
Physical Mass I Area ASTM D 3776 1 1 Thickness, Rib ASTM D 5199 10 10 Thickness, Node ASTM D 5199 10 10
Mechanical Rib Strength GRIGGl 10 10 Junction Strength GRIGG2 10 10 Wide Width Strength ASTM D 4595 10 10 Tension Creep Behavior ASTM D 5262 1 1
Thermal Transition Temperatures ASTM D 3418 3 3 Heat of Crystallization ASTM D 3417 3 3 Oxidative Induction Time Industry 3 3
Resin Density/Specific Gravity ASTM D 0792 2 2 Melt Flow Index ASTM D 1238 2 2 Carbon Black Content ASTM D 4218 1 1
Soil pH ASTM D 4972 n/a 2

TABLE 2 Physical and Mechanical Test Results and Resin Properties
Parameters
Mass I Area {g/ m2) Rib Thickness (in) Junction Thickness {in)
Single Rib Strength (kN/ m) Max. Load @ % Strain Load @ 5 % Strain Load @ 2 % Strain
Junction Strength (kN/m) Max. Load @ % Strain Load @ 5 % Strain Load @ 2 % Strain
Wide Width Strength (kN/ m) Max. Load @ % Strain Load @ 5 % Strain Load @ 2 % Strain
Density (glee) Melt Flow Index (g/10 min)
Carbon Black Concentration {%)
FIGURE 11 Unconfined tension creep evaluation of exhumed SR2 geogrid (center).
Number of Specimens Number of Specimens
Average Value 912. 0.054 0.178
85.0/ 15.2 46.8 26.2
84.6/16.4 46.1 26.1
78.0/ 15.3 44.6 25.6
0.9530 0.225
2.06
Standard Average Standard Deviation Value Deviation
930. 0.009 0.054 0.004 0.002 0.177 0.001
1.79/ 1.15 85.0/ 14.0 0.45/ 0.64 0.85 48.6 0.35 0.65 26.5 0.29
0.63/0.59 83.7/16.0 0.42/0.55 0.40 47.0 0.57 0.42 25.9 0.41
3.0/1.28 78.0/ 14.0 2.2/ 1.21 0.40 43.3 0.30 0.45 23.6 0.37
0.0005 0.9595 0.0002 0.007 0.207 0.004
0.020 2.96 0.031
Total Strain 16%~~~~~~.,...-,-,.,..,.,.....,---,.-m-rmr-r-rrrr.....r---rrTTTI"rrr-rTT"TTTTll
12% 1-1--1-1-1-Wll-~f-l-™.m.-~'-Htlll-+-++1-++f!l--t--+-+ttfl!l---H+tttllt-t-H-tttttt
8% Hiftl-+H-fl-Hllil:li!$~+tl41lmfllf--t-t-HI f'I'"'"
4% 1-l---l-l-l-l.JIU..o~+mili--1--l-+j4Hl!--+-f-++111ffi-++IH-+Hll-+-+++++lll--H-++tttff
0% L.iJ...llWJL....L.L.lliliJL..J-1...1..JLllilL--'-WJ..1JWL_..L.Ul.lllllL-l.--1...L.J.illJ.L_LJ...llllW 0 .001 0.01 0.1 1 10 100 1000 10000
Elapsed Time (hr)
- Exhumed '93 - Quality Control '84
FIGURE 12 Creep response of quality control and exhumed SR2 geogrids at 31.7 kN/m.
16%
12%
8% 4%
Total Strain
I ..,,, .. r-
11 I
....,- -
I - -
~-
I
0% 0.001 0.01 0.1 1 10 100 1000 10000
Elapsed Time (hr)
- Exhumed ---+- Archive
FIGURE 13 Creep response of archived and exhumed SR2 geogrids at 29 kN/m.

Bright et al.
TABLE 3 Thermal Analysis Results
Number of Specimens
Parameter Rib@ Node
Mid Length
Melt Range (°C) 90-139 93-134
Melt Peak (°C) 130 130
Crystallinity (%) 58 54
OIT (minutes) 6.7 8.0
fill, which was well-compacted and uniform. Figure 8 shows no broken or cut ribs over the surface of the exhumed geogrid sample; thus this sample experienced no significant installation or exhumation damage. There was no evidence of surface degradation due to attack by the resident ant colony; apparently the ants simply were not interested in a geogrid of HMW HDPE. Typically oxidation starts on the surface and progresses inward. An oxidized surface of a polyolefin, like polyethylene, will appear dull or tarnished. But surface quality is glossy, as evident in Figure 9, indicating no oxidative degradation in progress. Thus topological analysis by scanning electron microscopy was not warranted.
Physical Tests
Physical test results show no significant change in dimensional properties throughout 8-plus years .. Rib and junction thicknesses exhibit zero change. The change recorded for mass per unit area is within the variance of specification for SR2 geogrid.
Mechanical Test Results
Test results show no significant change in tensile strength measured at 2 percent and 5 percent strain levels and at maximum loading and corresponding strain between the two samples of geogrid. The ultimate tensile strength values for a single rib are above the 79.0-kN/m product specification. The ~verage tensile strength values plus one standard deviation for the exhumed sample fall within, or significantly overlap, the corresponding average values plus one standard deviation for the archived sample. Thus there is no significant change in single-rib, junction, or wide-width tensile strengths between archived and exhumed geogrid manufactured during the same era (within 1 year). There is also no indication of loss in ductility, or embrittlement, of the exhumed geogrid with time.
Creep Response
Figure 12 shows the creep response of two SR2 geogrid specimens manufactured in the 1984-1985 era; one taken from a roll selected for QC assessment and the other exhumed from the
53
Number of Specimens
In-Between Rib@ Node In-Between
Nodes Mid Length Nodes
91-136 90-134 93-133 92-133
130
57
7.4
130 130 130
58 55 56
4.7 4.3 3.9
Tanque Verde project, both at the same loading of 31.7 kN/m. After 1,000 hr, both specimens exhibited a parallel response to the same constant, sustained loading, indicating that the mechanism by which creep occurs is the same. This behavior indicates that more than 8 years of exposure to an elevated temperature environment has not changed the creep response of aged versus production SR2 geogrid. Figure 13 shows the creep response of exhumed and archived SR2 geogrid specimens at the design loading, 29 kN/m for a total strain response of less than 10 percent. The archived geogrid has been in storage since its manufacture in 1984. At about 1000 hours, the two specimens are becoming asymptotic to less than 8.5 percent total strain. The two response curves are essentially parallel, indicating that the mechanism by which creep occurs is the same within the two geogrid specimens. Although these two geogrids are from different lot numbers, as discussed earlier, their response with time to a constant, sustained load is essentially the same; in addition, the mechanism by which the geogrid specimens respond is identical and thus has not changed over more than 8 years' duration and exposure to different aging temperatures, ambient and elevated, as documented in Figure 3.
Resin Properties
Resin density was determined from the extrudate from a melt flow index tester; no significant changes in morphology occurred over the duration. Melt flow index values indicate no change in the molecular weight of the resin over the duration. Any significant change in molecular weight would be reflected in corresponding changes in mechanical strength, for which there were no changes. However a 0.022-g/10-min difference does indicate that the samples came from different production lots, also indicated by the values on carbon black (CB) concentration.
CB specification for SR2 was 1 to 3 percent by weight in 1984, and 2 + percent is known and accepted to be sufficient to retard long-term degradation of HDPE due to exposure to ultraviolet light, which is of no concern here. The difference in CB concentration has not affected the mechanical properties of the exhumed geogrid relative to the archived geogrid; a higher CB concentration, if anything, would slightly lower mechanical properties initially. Any significant change in ductility or embrittlement would increase strength values with a corresponding decrease in strain values. As discussed earlier, this has not occurred.

54
Thermal Test Results
Melt range, peak temperature, and crystallinity data indicate no significant changes in the morphological state of the HMW HDPE geogrid, at various locations within the geogrid configuration, over the duration of the project in an elevated temperature environment. Crystallinity data verify that there was no significant change in the resin density reported in Table 2, because for semicrystalline thermoplastics, changes in morphological density are usually reflected in corresponding crystallinity. Any significant changes in either density or crystallinity should be reflected in mechanical property results, which is not the case. Such changes would not necessarily reflect a change in molecular weight.
OITs for the archived and exhumed samples are given in Table 3. A single test was run for each specimen identified by location within the basic geogrid configuration. OIT values of the archived SR2 sample are 7 to 8 min, typical of values reported by the resin supplier for the antioxidant package used in 1984 and evaluated at 200°C. OIT values for the exhumed sample are 4 to 5 min. For an average time duration of 6 ± 2 min, the OIT values of the archived and exhumed specimens are, within experimental reproducibility and significance for this test, essentially equal. The mass/area, melt flow index, and CB values clearly indicate that the test samples are from different production lots, as do the OIT values. Thus some difference in OIT values is expected between the archived and exhumed samples.
CONCLUSIONS
The Tanque Verde and archived geogrid samples were produced about 1984 but were from different production lots. The HMW HDPE. geogrid experienced no significant installation or exhumation damage and exhibited no evidence of biological attack or surface oxidation. No significant change in physical, mechanical, thermal, or resin properties occurred throughout 8 or more years in service. The. creep behavior of the archived and exhumed Tanque Verge geogrids is essentially identical and indicates that
TRANSPORTATION RESEARCH RECORD 1439
the mechanism by which creep occurs has not changed throughout the years in service. Thus assessment has shown that the first project using a geogrid of HMW HDPE as reinforcement in a concrete-faced, MSE retaining wall in a major transportationrelated application in North America has not experienced any significant change in the performance and physical properties of the geogrid or in the morphological properties of its resin in more than 8 years of exposure to an elevated temperature environment.
REFERENCES
1. Dames and Moore. Tensar SR2 Reinforced Retaining Wall for Tanque Verde, Tucson, Arizona. Pima County Department of Transportation and Flood Control District, Tucson, Ariz. 1984.
2. Dames and Moore. Tensar SR2 Reinforced Retaining Walls at Tanque Verde Road, Tucson, Arizona. M. M. Sundt Construction Company, 1985.
3. Berg, R.R., et al. Design Construction and Performance of Two Reinforced Soil Retaining Walls. Proc. 3rd International Conference on Geotextiles, Vienna, Austria, 1986, pp. 401-406.
4. Desert Earth Engineering. Tensar Earth-Reinforcement Wall Monitoring at Tanque Verde-Wrightstown-Pantano Roads, Tucson, Arizona. (Preliminary report) Pima County Department of Transportation and Flood Control District, Tucson, Ariz., 1986.
5. Desert Earth Engineering. Tensar Earth-Reinforcement Wall Monitoring at Tanque Verde-Wrightstown-Pantano Roads, Tucson, Arizona. Final Report. Pima County Department of Transportation and Flood Control District, Tucson, Ariz. 1987.
6. Tensar Geogrid-Reinforced Soil Wall Grade-Separation Structures on the Tanque Verde-Wrightstown-Pantano Roads Intersections. Report FHWA-EP-90-001-005. U.S. Department of Transportation, 1990.
7. Fishman, K. L., et al. Field Behavior of Instrumented Geogrid Soil Reinforced Wall. Journal of Geotechnical Engineering, Vol. 119, No. 3, Aug. 1993, pp. 1293-1307.
8. Fishman, K. L., et al. Geosynthetic-Reinforced Soil Wall: 4-Year History. In Transportation Research Record 1330, National Research Council, Washington, D.C., 1991, pp. 30-39.
9. Collin, J. G., and R.R. Berg. Permanent Geogrid Reinforced Soil Retaining Walls-U.S. Experience. Presented at Seiken Symposium, Japan, 1992.