durability assessment of welded structures based on
TRANSCRIPT

14th
International LS-DYNA Users Conference Session: Automotive
June 12-14, 2016 1-1
Durability assessment of welded structures based on
welding simulation with LS-DYNA®
Andriy Krasovskyy1, Antti Virta
2, Thomas Klöppel
3
1DYNAmore Swiss GmbH
2Winterthur Gas & Diesel Ltd
3DYNAmore GmbH
Abstract
The importance of welding for modern structural engineering cannot be emphasized enough.
Different techniques are currently applied in the industrial environment offering almost
unlimited possibilities regarding manufacturability with high cost effectiveness. At the same time
the requirements on welded structures are increasing and so the requirements on the design
methods. This paper presents an advanced calculation method for fatigue assessment of welds
based on the simulation of a welding process in LS-DYNA®
, thermophysical material modeling
and fracture mechanics. The proposed method considers the most important aspects for
durability prediction of welds. Applying worst-case assumptions, fatigue limits derived by the
weight function method can be used in the lifetime assessment of complex welded structures
together with the critical plane approach in order to consider a multiaxial nonproportional
loading.
Introduction
Practical experience and experimental observations clearly show that fatigue damage in the
welded structures generally originates from weld notches (toe or root). The fatigue behavior of
the whole structure is therefore dominated by local stress concentrations in the vicinity of the
welding fusion line, which is considered to be the weakest link. Apart from the purely
geometrical weakening there are many other factors which may promote failure initiation in this
area. During the arc welding, high thermal impact induces alterations in the microstructure and
material properties of the weld metal and the surrounding heat affected zone. Surface conditions
on the weld notch are typically poor, including many randomly distributed defects and small
cracks, which can be seen as additional stress raisers. Moreover residual stresses are inevitably
present after the welding as a result of plastic deformation induced by non-homogeneous thermal
expansion, liquid-to-solid transformation and phase transformations in the solid state [1][2].
Welded structures can be very complex and involve many different types of welds, thus the
accurate fatigue assessment becomes very demanding. Therefore, the biggest challenge for a
product development in industrial environment is how to achieve a compromise between the
accurate lifetime estimation and fast calculation procedure for the entire welded structure in
order to be able to perform a design optimization in affordable amount of time. Design codes
[3][4] can greatly reduce the analysis effort providing a suitable balance between computational
accuracy and ease of use for many industrial applications. However the proposed S-N curve
Copyr
ight
by
DYNAm
ore
Session: Automotive 14th
International LS-DYNA Users Conference
1-2 June 12-14, 2016
approach is rather generalized in respect of material or welding process. Various assumptions
have to be made in a very conservative way so that the full cost and weight optimization
potential cannot be achieved.
For less conservative fatigue estimation and a better design-to-cost a coupled analysis of welding
process, operational loading and mechanism based failure modeling can be performed. Such a
method starts at the extensive level of modeling of a welding process for prediction of
microstructure, following by the micromechanical analysis of defects at the welding notch with
help of the fracture mechanics. Finally the evidence from the detailed analysis (analog to the
effective notch stress concept at IIW-recommendations), can be used to define a macroscopic
criterion (analog to the structural hot spot stress concept at IIW-recommendations) for a large
FE-model of entire structure. This approach would additionally offer a better understanding of
interactions between welding and fatigue behavior and so more possibilities to optimize the
welding process specifically for the considered material, weld type or loading.
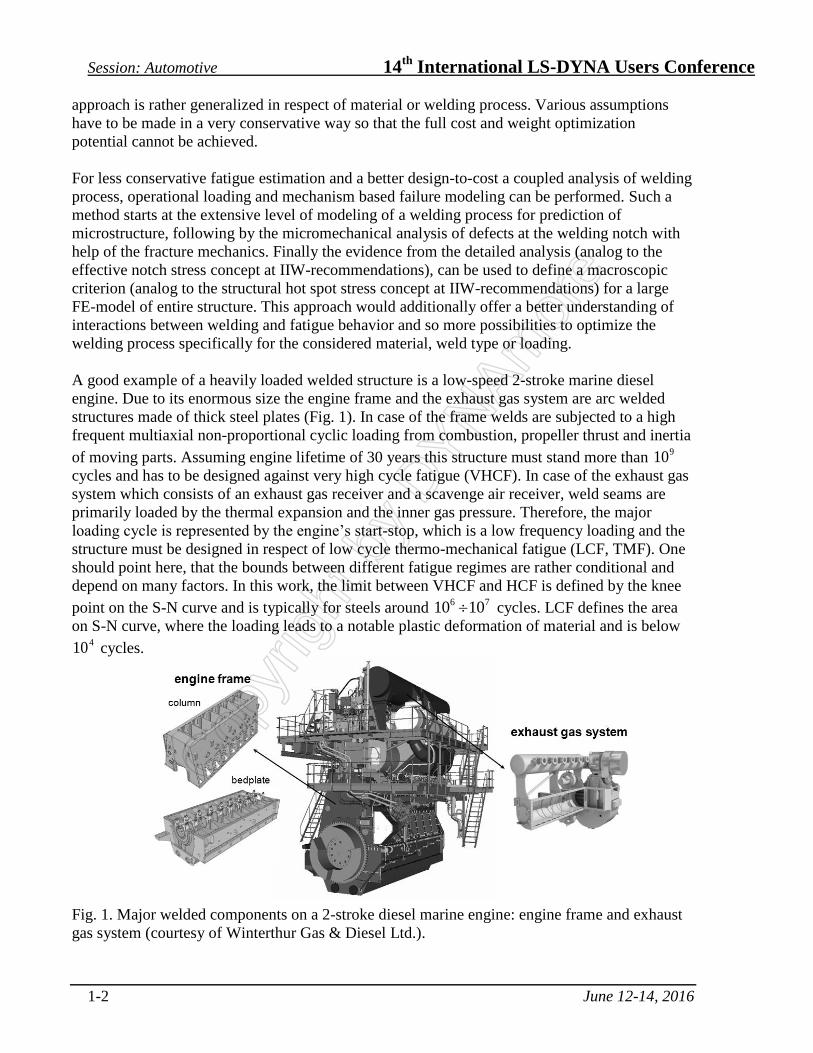
A good example of a heavily loaded welded structure is a low-speed 2-stroke marine diesel
engine. Due to its enormous size the engine frame and the exhaust gas system are arc welded
structures made of thick steel plates (Fig. 1). In case of the frame welds are subjected to a high
frequent multiaxial non-proportional cyclic loading from combustion, propeller thrust and inertia
of moving parts. Assuming engine lifetime of 30 years this structure must stand more than 910
cycles and has to be designed against very high cycle fatigue (VHCF). In case of the exhaust gas
system which consists of an exhaust gas receiver and a scavenge air receiver, weld seams are
primarily loaded by the thermal expansion and the inner gas pressure. Therefore, the major
loading cycle is represented by the engine’s start-stop, which is a low frequency loading and the
structure must be designed in respect of low cycle thermo-mechanical fatigue (LCF, TMF). One
should point here, that the bounds between different fatigue regimes are rather conditional and
depend on many factors. In this work, the limit between VHCF and HCF is defined by the knee
point on the S-N curve and is typically for steels around 76 1010 cycles. LCF defines the area
on S-N curve, where the loading leads to a notable plastic deformation of material and is below 410 cycles.
Fig. 1. Major welded components on a 2-stroke diesel marine engine: engine frame and exhaust
gas system (courtesy of Winterthur Gas & Diesel Ltd.).
Copyr
ight
by
DYNAm
ore

14th
International LS-DYNA Users Conference Session: Automotive
June 12-14, 2016 1-3
Fatigue of welded joints
The fatigue nature for the majority of weld seams differs significantly from that of non-welded
materials. In contrary to the fatigue investigations in laboratory conditions where welding quality
can be well specified, it is difficult to make the detailed characterization for complex structures
in industrial environment. A fatigue assessment therefore has to be done based on reasonable
stochastically motivated assumptions containing the worst possible or worst allowable case in
practice. Analysis of the fatigue resistance for welds therefore has to presume that cracks on
weld seam are present after the welding process. In this case, the stage of a fatigue crack
nucleation is relatively insignificant [5][6] and the threshold for the initial crack propagation can
be taken as a criterion for VHCF whereas crack growth analysis can be used for HCF and LCF.
Fig. 2 illustrates the differences between the S-N curves for welded and non-welded structures:
while for non-welded metals with good surface condition and small size of inclusions a
considerable amount of lifetime has to be spent for a crack nucleation, crack growth is dominant
for welds.
Fig. 2. Typical S-N curve (a) and crack growth diagram (b) with three areas representing crack
nucleation, propagation and fracture.
Another reasonable assumption can be made regarding the location and the type of defects. Since
weld notches are the highest loaded areas on a weld seam, one can assume that the surface crack-
like defects are the most critical. This is proven by many years of field experience in marine
industry and different investigations. For 2-stroke diesel engines the maximum allowable depth
of cracks or crack-like flaws, identified by non-destructive testing, is 1 mm. Therefore, as the
worst case, a semi-elliptical surface crack with a depth a of 1 mm and an aspect ratio .10/ ca
in the vicinity of the weld notch can be assumed as the most critical defect [3].
Welding simulation
An accurate fatigue assessment of weld seams requires information about residual stresses,
microstructure and mechanical properties. Nowadays, the thermomechanical simulation of
welding process can significantly facilitate this and provide more understanding of the relevant
phenomena and their dependencies. However a reliable welding simulation is very demanding,
not only in respect of calculation time but also regarding a comprehensive characterization of the
material behavior [2]. Material models available in LS-DYNA® provide different possibilities for
welding simulation [7]. In this study a semi-empirical temperature dependent elastic-viscoplastic
a) b)
Copyr
ight
by
DYNAm
ore

Session: Automotive 14th
International LS-DYNA Users Conference
1-4 June 12-14, 2016
material model with transformation kinetics based on Johnson-Mehl-Avrami-Kolmogorov and
Koistinen-Marburger was used.
First, validation of the welding process simulation was performed on the 5-pass full penetration
GMAW welding (Ø1.2 mm solid wire, CO2) on the single side clamped cantilever beams of
steel S235JR with a width of 1000 mm (Fig. 3, a). During the welding process, the bending of
the sample was restricted by clamps in order to simulate constraint in the real engine structure.
After the welding, each of the 1000 mm long specimens was cut into 12 clamped samples for the
cyclic bending fatigue tests (Fig. 3, b). Additionally measurements of the welding residual
stresses were carried out using an X-ray diffraction technique. A microstructural and chemical
analysis as well as hardness measurements at different areas of the weld seam were performed.
For more information see [8] [9] [10].
Fig. 3. a) clamped cantilever beams before welding; b) samples used in fatigue tests (courtesy of
Winterthur Gas & Diesel Ltd.).
Thermal analysis
In the thermal analysis, both the preheating and the inter-pass temperature were taken into
account. Goldak formulation of the equivalent heat source was used in the welding process
simulation [2]. The arc efficiency factor and the energy distribution between the surface and
volume were adjusted according to the size of the weld pool from the weld microsections.
Temperature dependent thermal convection, radiation and the contact with the clamping tools
were considered. Fig. 4 shows the results of the thermal calculation in comparison to the
measured temperature evolution at different locations and the weld pool geometry (red area
represents a liquid state).
Fig. 4. Comparison between measured and calculated temperature evolution (a) and the weld
pool geometry (b).
Copyr
ight
by
DYNAm
ore

14th
International LS-DYNA Users Conference Session: Automotive
June 12-14, 2016 1-5
Since the thermal history during the welding is a crucial factor for microstructure and
mechanical properties of the weld seam, it is possible to predict them already based on the fast
thermal analysis. By exporting the cooling rate close to the notch of the last welding pass to the
program JMatPro one can predict the final microstructure and therefore hardness of the material.
Fig. 5 shows the results of the predicted phase ferritic-bainitic phase composition and observed
microstructure. The predicted hardness value of HV217 on the fusion line was very close to the
measured value of HV213.
Fig. 5. Comparison between the measured microstructure (b) and the prediction by JMatPro (a).
Thereby, a relatively fast thermal simulation of the welding process is able to predict
microstructure and so mechanical material properties at any location of the weld seam. In order
to get welding induced residual stresses mechanical analysis has to be performed.
Mechanical analysis and residual stresses
In the mechanical analysis, the elastic-viscoplastic temperature dependent material behavior
including the phase dependent dilatation and the transformation-induced plasticity has to be
considered. One of the twelve fatigue specimens was extracted from the middle of the model for
a comparison of measured residual stresses. Fig. 6 shows measured and calculated residual
stresses in longitudinal (parallel to the weld seam) and transversal direction on the upper side of
the specimen.
Fig. 6. Comparison between measured and calculated residual stresses in longitudinal and
transversal direction on the upper notch.
Copyr
ight
by
DYNAm
ore

Session: Automotive 14th
International LS-DYNA Users Conference
1-6 June 12-14, 2016
Welding induced residual stresses can have either a beneficial or a harmful effect on the lifetime,
depending on sign, magnitude and distribution with respect to the load-induced stresses.
Typically tensile residual stresses reduce the fatigue resistance of components by assisting the
fatigue crack growth while compressive residual stresses decrease it. Using available commercial
software for welding simulation, it is often difficult, without extensive material characterization,
to estimate accurately the welding induced residual stresses even for idealized boundary
conditions at laboratory or for simple geometries. For many real welded structures with complex
geometry and welding sequence, local stress state on the welding notch can be additionally
affected during the assembling stage. Another aspect, which has to be taken into account if
welding residual stresses need to be considered in the fatigue analysis, is their alternation during
the cyclic loading or at high temperature.
All mentioned above difficulties related to the accurate calculation of residual stresses, make it
currently impossible (at least quantitatively) to use the information for lifetime prediction of
complex structures. For the derivation of macroscopic fatigue limits therefore, stress ratio R=0.5
seems to be a reasonable conservative assumption.
Fatigue crack analysis
Due to the presence of weld notches, the through-thickness stress has a nonlinear distribution and
classic analytical solution for the stress intensity factors is no longer valid. An accurate solution
by using FE-analysis is can be very time consuming. Convenient and efficient is in contrast the
weight function method. The weight function can be understood as the stress intensity factor
induced by the simplest load configuration, i.e. a pair of unit splitting forces attached to the crack
surface. For the fatigue analysis, range of the stress intensity factor for semi-elliptical surface
crack subjected to Mode I loading can be obtained by integrating the product of the stress
distribution )(x in the anticipated crack plane and the weight function ),( axm along the
crack length a [11]:
dxaxmxKa
BABA 0
,, ),()( (1)
where A and B are points on the crack front (Fig. 7). According to [12], conservatism of the
weight function method can be provided up to the crack depth of 80% of the plate thickness.
Fig. 7. Weight function notation for a semi-elliptical surface crack [11].
For the calculation of stress intensity factors by the weight function method, information about
stress distribution along the crack front and the potential crack path is essential. In a typical
Copyr
ight
by
DYNAm
ore
14th
International LS-DYNA Users Conference Session: Automotive
June 12-14, 2016 1-7
structure with different weld seams, complex geometry and loading, various through-thickness
stress distributions are possible. In order to perform fatigue assessment for complex parts in a
reasonable amount of calculation time a worst-case assumption in regards to the through-
thickness stress distribution can be made. Assuming Mode I as a dominant for crack growth, the
most critical stress state is the one with the highest range of the maximum normal stress, means
where the entire section is under the tension.
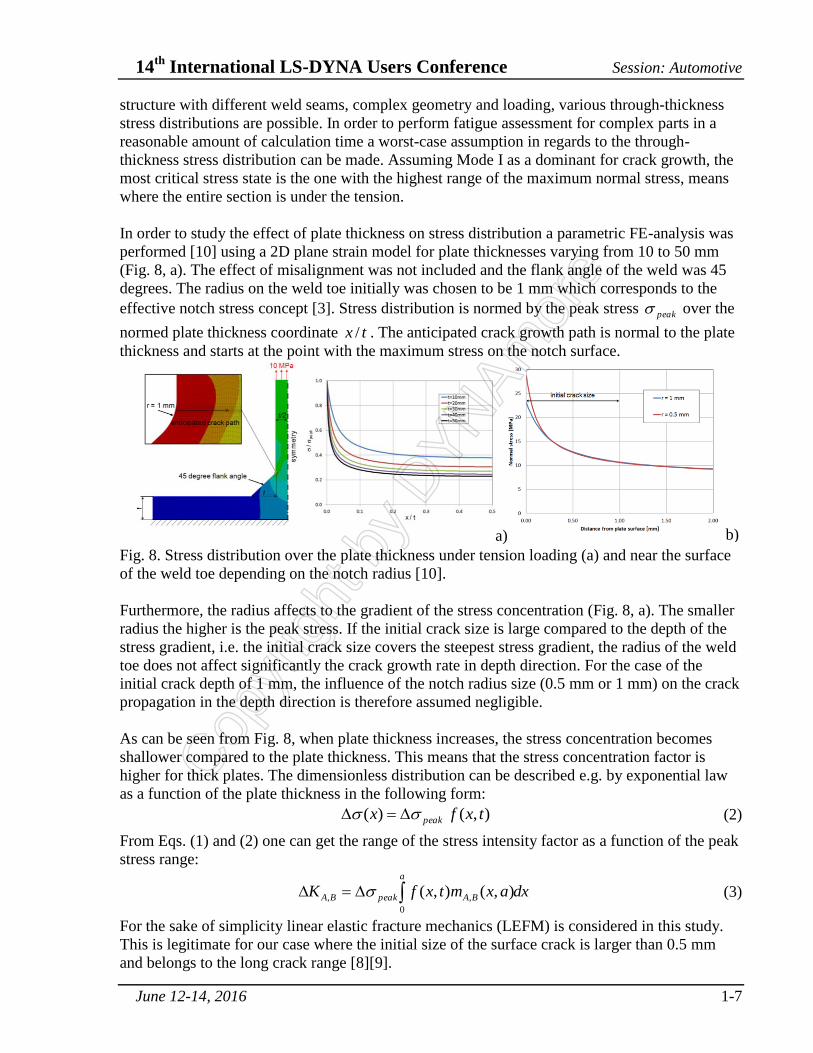
In order to study the effect of plate thickness on stress distribution a parametric FE-analysis was
performed [10] using a 2D plane strain model for plate thicknesses varying from 10 to 50 mm
(Fig. 8, a). The effect of misalignment was not included and the flank angle of the weld was 45
degrees. The radius on the weld toe initially was chosen to be 1 mm which corresponds to the
effective notch stress concept [3]. Stress distribution is normed by the peak stress peak over the
normed plate thickness coordinate tx / . The anticipated crack growth path is normal to the plate
thickness and starts at the point with the maximum stress on the notch surface.
Fig. 8. Stress distribution over the plate thickness under tension loading (a) and near the surface
of the weld toe depending on the notch radius [10].
Furthermore, the radius affects to the gradient of the stress concentration (Fig. 8, a). The smaller
radius the higher is the peak stress. If the initial crack size is large compared to the depth of the
stress gradient, i.e. the initial crack size covers the steepest stress gradient, the radius of the weld
toe does not affect significantly the crack growth rate in depth direction. For the case of the
initial crack depth of 1 mm, the influence of the notch radius size (0.5 mm or 1 mm) on the crack
propagation in the depth direction is therefore assumed negligible.
As can be seen from Fig. 8, when plate thickness increases, the stress concentration becomes
shallower compared to the plate thickness. This means that the stress concentration factor is
higher for thick plates. The dimensionless distribution can be described e.g. by exponential law
as a function of the plate thickness in the following form:
),()( txfx peak (2)
From Eqs. (1) and (2) one can get the range of the stress intensity factor as a function of the peak
stress range:
dxaxmtxfKa
BApeakBA 0
,, ),(),( (3)
For the sake of simplicity linear elastic fracture mechanics (LEFM) is considered in this study.
This is legitimate for our case where the initial size of the surface crack is larger than 0.5 mm
and belongs to the long crack range [8][9].
a) b)
Copyr
ight
by
DYNAm
ore

Session: Automotive 14th
International LS-DYNA Users Conference
1-8 June 12-14, 2016
Very high cycle fatigue
Flaws and crack-like defects on weld seams can propagate under fatigue loading if the stress
intensity factor is above its threshold value thK . If K is below that value, theoretically infinite
fatigue life can be obtained. Murakami [15] proposed a simple relation that predicts the fatigue
crack propagation threshold for small initial defects (short crack range) short
thK 1 at the loading
ratio 1KR assuming the crack opening mode, or Mode I, as the dominant. He found a
correlation between the material hardness VH , the effective area of the defect projected onto the
plane normal to the first principal stress, area , and the fatigue strength:
31
3
1 ))(120(103.3 areaHK V
short
th
(4)
where VH is a Vickers hardness in kgf/mm2, area in m and short
thK 1 in mMPa .
Eq. (4) has been successfully validated for different classes of materials. However, it is only
defined for the short cracks. For the long crack range it is no longer valid [16]. In order to extend
the applicability of Murakami’s model, Chapetti [17] proposed the upper bound for the Eq. (4):
5.1501239.01 V
long
th HK (5)
Combination of (4) and (5) provides the general threshold value: long
th
short
thth KKK 111 ,min (6)
The mean stress sensitivity which includes effect of residual stresses and loading asymmetry
over one cycle can be described by different models. Using experimental data for steel St 37
(former designation for S235) from [4] a very accurate approximation can be achieved by the
following function of the mean stress intensity factor mK :
mK
k
ththththR
ea
KKKK
1
5.015.0 (7)
where ka and are material parameters. Fig. 9 presents the description of measured values with
001.0ka . The values at 1KR ( maxmin KKRK ) were predicted by Eq. (6) based
on MPaRm 415 ( Vm HR 26.3 ). Stress intensity factor ratio, KR , is defined as:
Fig. 9. Mean stress dependency for steel St 37: experimental values and described by Eq. (7).
Copyr
ight
by
DYNAm
ore
14th
International LS-DYNA Users Conference Session: Automotive
June 12-14, 2016 1-9
Using the information about the through-thickness stress distribution and shape of the surface
crack, fatigue limit can now be derived by the weight function method. Substituting the range of
stress intensity factor on the left side in (3) by its threshold value (7) one can derive a limit for
stress range in VHCF regime:
dxaxmtxfdxaxmtxf
Ka
B
a
A
thRVHCF
wR00
00
),(),(,),(),(max
(8)
where 0a corresponds to the initial crack length. In this case the fatigue limit is related to the
peak stress on the notch surface.
High and low cycle fatigue
For regimes of the high and low cycle fatigue, K from external load exceeds its threshold
value and crack growth up to its critical size (specified by the structural requirements) must be
modeled in order to predict lifetime. In terms of LEFM crack growth in the direction normal to
plate surface can be described by the Paris law:
m
AKCdN
da)( (9)
where N is a number of loading cycles, C and m are the material constants. In this simple form
it is not able to consider effect of the loading ratio as well as a crack closure on crack growth
rate. However, for industrial applications it is sufficient to assume a constant high R-value due to
the following reasons: difficulty in prediction of residual stress distribution and their relaxation
for complex structures, inability to consider local stress redistribution during the crack
propagation, high gradients of material properties along the anticipated crack path.
The total life can be calculated as:
fa
am
AK
da
CN
0)(
1 (10)
where the criterion for failure can be defined by fracture toughness IcK and the critical crack
size fa , specified e.g. by validity of the Glinka’s weight function method ta f 8.0 .
Combining Eqs. (3) and (10) one can derive the allowable stress range for the HCF and LCF
regimes:
m
a
a
ma
A
HCF
wR dadxaxmtxfNC
f
0 0
),(),(1
(11)
Multiaxiality and non-proportionality of loading
Until now, stress acting normal to the crack plane is considered, because of the Mode I
assumption. Real welded structures however have a random orientation of initial defects and are
typically subjected to a complex loading. For a general case of a multiaxial and non-proportional
loading [18], one can formulate the fatigue criterion based on the critical plane approach as
follows:
Copyr
ight
by
DYNAm
ore

Session: Automotive 14th
International LS-DYNA Users Conference
1-10 June 12-14, 2016
1
max ;0,
wR
nD
(12)
where D is fracture parameter, which represents a ratio between the maximum value of the
normal stress range n over all plane orientations, defined by spherical coordinates and ,
and a fatigue limit. If residual stresses are not known, a conservative assumption regarding the
KR -value has to be made (e.g. 5.0KR according to [3]).
Accurate simulation with critical plane method requires small angular step and can lead to very
high calculation times. For complex structures calculation times can be reduced if only planes
which are parallel to the welding fusion line ( 0 ) are considered. For even faster analysis the
first principal stress range defined as a function of ranges of each stress component can be used
for calculation of the maximum normal stress. In case of the plane stress state, e.g. on the plate
surface:
2
12
2
22112211
22
n
(13)
Eq. (13) presumes that the maxima and the minima for each stress component occur
simultaneously and the loading is proportional.
Fatigue life prediction
Based on the theory and assumptions presented above as well as on the results from the welding
simulation one can now derive an S-N curve for S235JR. Validation of the results is done by the
fatigue limits from IIW. For that purpose the effective notch stress concept can be chosen.
FAT 225 represents a survival probability of 97.7% at stress ratio 5.0R . Since FAT 225
provided above can be used. For the calculation of crack growth material constants from [4] for
S235JR (base material) at 5.0R were used: 971.9 EC and 71.2m (units: MPa, m). For
the calculation of the stress intensity threshold hardness HV213 was taken. Plate thickness was
selected to be 10 mm. Resulting S-N curve compared to the one from IIW can be seen on
Fig. 10. As mentioned before, LEFM presumes an existence of the endurance limit defined by
the stress intensity threshold, which is however disputed in the fatigue world. Therefore thK is
used here only for estimation of the knee point on S-N curve. For the number of cycles higher
than at the knee point, a further decline in stress range of 10% per decade is assumed [3].
Fig. 10. Fatigue limits for welds from IIW and predicted by the crack growth calculation.
Copyr
ight
by
DYNAm
ore

14th
International LS-DYNA Users Conference Session: Automotive
June 12-14, 2016 1-11
Fig. 11 presents evolution of stress intensity factors at position A and B as well as crack
dimensions (for notation see Fig. 7) during the crack growth loaded by MPapeak 1000 .
Fig. 11. Development of stress intensity factors (a) and crack dimensions (b) during the crack
growth.
In opposite to IIW, predicted by the presented here approach limits can be derived for particular
material, welding process and stress state. This provides more additional possibilities for design
and process optimizing. Fig. 12 shows predicted fatigue limits (defined by knee point) for the
same material by variation of hardness and initial flaw size.
Fig. 12. Fatigue limits as a function of hardness (a) and initial crack size (b).
It can be seen, that there is still a lot of potential regarding the optimization of welding process.
Such as reducing material hardness at the notch area to the level of HV150 would increase
fatigue limit by almost 10%. This can be achieved by reduction of cooling rate - either by
reduction of the heat input during the last welding pass or by pre-heating of the welding area.
Any further increase of the cooling rate would lead to more brittle microstructure and as
sequence to the reduction of fatigue strength. Even more improvements can be achieved with
increase of the welding quality. Reduction of the initial depth of the surface crack to 0.4 mm will
provide fatigue limit of 186 MPa – an increase by 28%.
Application for complex structures
Derived by the proposed approach limits can now be used for the fatigue assessment of complex
welded structures. In order to reduce calculation time, fatigue limits can be defined as a function
of plate thickness and temperature. All other factors, including through-thickness stress
distribution, can be first considered based on the worst-case assumptions. Since the component
size is typically much bigger compared to the size of weld seams and notches, they are not
a) b)
a) b)
Copyr
ight
by
DYNAm
ore

Session: Automotive 14th
International LS-DYNA Users Conference
1-12 June 12-14, 2016
included in the FE-model and the mesh size is coarser than the one for the effective notch stress
concept. For this case, fatigue limits derived by LEFM-approach must be scaled accordingly.
Mesh requirements as for the structural hot spot concept [3] can be applied. Fig. 13
presents calculated by Eq. (14) fracture parameters for the engine frame, which is loaded in
VHCF regime at room temperature. Using simplified approach (15) for the maximum normal
stress, the post-processing time for calculation of the fracture parameter D takes only a few
seconds.
Fig. 13. Fatigue analysis of complex welded structures: engine frame – VHCF at room
temperature (courtesy of Winterthur Gas & Diesel Ltd.).
Conclusions
The emphasis throughout this study has been to formulate and validate an accurate approach for
the fatigue life assessment of welded joints, in order to achieve the full cost and weight
optimization potential for industrial applications. The proposed method starts at the extensive
level of modeling of a welding process. Thermomechanical welding simulation assisted by
metallurgical material modeling is able to predict the microstructure, mechanical properties and
the welding induced residual stresses. Using this information lifetime of weld seam can
accurately be estimated by the weight function method associated with threshold for crack
propagation and crack growth rate. Derived by this method fatigue limits in combination with the
critical plane approach can successfully be used in the analysis of complex parts subjected to a
multiaxial and non-proportional loading. The capability of the approach is validated by S-N
curves provided at the IIW-recommendations [3].
References
[1] Radaj, D. (2003), Welding residual stresses and distortion – Calculation and measurement, Düsseldorf: DVS-
Verlag
[2] Radaj, D. (1999), Schweissprozesssimulation: Grundlagen und Anwendungen. Düsseldorf: DVS-Verlag
[3] Hobbacher, A. (2008), Recommendations for fatigue design of welded joints and components. IIW document
IIW-1823-07/XIII-2151r4-07/XV-1254r4-07
[4] FKM-Richtlinie (2002), Rechnerischer Festigkeitsnachweis für Maschinenelemente aus Stahl, Eisenguss- und
Aluminiumwerkstoffen, 4., erweiterte Ausgabe, VDMA Verlag
[5] Jaureghizahar, L., Martinez del Pezzo, A., Chapetti, M. (2007), “Some results on the estimation of fatigue
resinstance of welded joints”, in Congreso SAM/CONAMET, pp. 796-801
[6] Chapetti, M. (2011), “Estimating the fatigue behaviour of welded joints”, Proc. Engineering, 10, pp. 959-964
Copyr
ight
by
DYNAm
ore

14th
International LS-DYNA Users Conference Session: Automotive
June 12-14, 2016 1-13
[7] Klöppel, T., Loose, T. (2015), Recent developments for thermo-mechanically coupled simulations in LS-DYNA
with focus on welding processes, 10th European LS-DYNA Conference 2015, Würzburg, Germany
[8] Krasovskyy, A., Virta, A. (2015), “Fatigue life assessment of welded structures based on fracture mechanics”,
International Journal of Structural Integrity, Vol. 6 Iss 1 pp. 2 – 25
[9] Krasovskyy A., Virta A. (2014), “Fracture mechanics based estimation of fatigue life of welds”, Procedia
Engineering 74 27 – 32
[10] Krasovskyy, A., D. Bachmann (2012), “Estimating the fatigue behavior of welded joints in the VHCF regime”,
Int. J. of Structural Integrity, Vol. 3, Iss: 4, pp.326-343
[11] Chattopadhyay, A., Glinka, G., El-Zein, M., Qian, J., Formas, R. (2013), “Stress Analysis and Fatigue of
Welded Structures”, IIW Document IIW-2201
[12] Goyal, R., Glinka, G. (2012), “Fracture Mechanics Based Estimation of Fatigue Lives of Welded Structures”,
IIW Document XIII-2413-12
[13] Kitagawa, H., Takahashi, S. (1976), “Applicability of fracture mechanics to very small cracks or the cracks in
the early stages”, in The Second International Conference on Mechanical Behavior of Materials. Metals Park, OH:
American Society for Metals pp. 627–631
[14] El Haddad, M. H., Smith, K. N., Topper, T. H. (1979), “Fatigue Crack Propagation of Short Cracks”, J. of Eng.
Mat. And Tech., 101, pp. 42-46
[15] Murakami, Y. (2002), Metal Fatigue: Effects of Small Defects and Nonmetallic Inclusions. Elsevier
[16] Taylor, D. (1986) “Fatigue of Short Cracks: the Limitations of Fracture Mechanics. The behaviour of Short
Fatigue Cracks.”, Mechanical Engineering Publications, EGF Pub.1, London, pp. 479-490
[17] Chapetti, M. (2010), “Prediction of threshold for very high cycle fatigue (N > 107 cycles)”, Proc. Engineering,
2, pp. 257-264
[18] Socie, D. and Marquis G. (2000), Multiaxial Fatigue.Society of Automotive Engineers, Inc.
[19] Rice, J. R., Paris, P. C. (1976), Mechanics of Crack Growth, American Society for Testing and Materials
Copyr
ight
by
DYNAm
ore