dublin seismic hazard zone report 112 -...
TRANSCRIPT

SEISMIC HAZARD ZONE REPORT 112
SEISMIC HAZARD ZONE REPORT FOR THE
DUBLIN 7.5-MINUTE QUADRANGLE, ALAMEDA COUNTY, CALIFORNIA
2008
DEPARTMENT OF CONSERVATION California Geological Survey
STATE OF CALIFORNIA
ARNOLD SCHWARZENEGGER GOVERNOR
THE RESOURCES AGENCY MIKE CHRISMAN
SECRETARY FOR RESOURCES
DEPARTMENT OF CONSERVATION BRIDGETT LUTHER
DIRECTOR CALIFORNIA GEOLOGICAL SURVEY
JOHN G. PARRISH, PH.D. STATE GEOLOGIST
Copyright © 2008 by the California Department of Conservation. All rights reserved. No part of this publication may be reproduced without written consent of the Department of Conservation.
The Department of Conservation makes no warrantees as to the suitability of this product for any particular purpose.

How to view or obtain Seismic Hazard Zone maps
Seismic Hazard Zone Maps, Seismic Hazard Zone Reports, and related information are available on the California Geological Survey’s (CGS) Internet page: http://www.consrv.ca.gov/cgs/shzp/Pages/Index.aspx.
The maps and reports are also available for reference at CGS offices in Sacramento, Menlo Park, and Los Angeles at the addresses presented below.
Paper copies of Official Seismic Hazard Zone Maps are available for purchase from: BPS Reprographic Services 945 Bryant Street San Francisco, CA 94103 (415) 495-8700
The Seismic Hazard Zone Report documents the methods and data used to construct the Seismic Hazard Zone Map for each 7.5-minute quadrangle evaluated by CGS. The information should be particularly helpful to site investigators and local government reviewers of geotechnical reports. NOTE: Seismic Hazard Zone Reports are not available through BPS Reprographic Services.
CALIFORNIA GEOLOGICAL SURVEY'S PUBLICATION SALES OFFICES:
Publications and Information Office 801 K Street, MS 14-34 Sacramento, CA 95814-3531 (916) 445-5716
Bay Area Regional Office 345 Middlefield Road, MS-520 Menlo Park, CA 94025 (650) 688-6327
Reports and maps can be viewed at the CGS Southern California Regional Office at the following address:
888 S. Figueroa Street, Suite 475 Los Angeles, CA 90017
(213) 239-0878

SHZR 112 SEISMIC HAZARD ZONATION OF THE DUBLIN QUADRANGLE i
TABLE OF CONTENTS
EXECUTIVE SUMMARY ...................................................................................................................................v THE CALIFORNIA SEISMIC HAZARDS MAPPING PROGRAM ............................................................... vii
SECTION 1: EVALUATION REPORT FOR LIQUEFACTION HAZARD ........................ 1 INTRODUCTION .............................................................................................................................................1
Background....................................................................................................................................................1 Methodology..................................................................................................................................................2 Scope and Limitations ...................................................................................................................................3
PART I: GEOGRAPHIC AND GEOLOGIC SETTING....................................................................... 3 PHYSIOGRAPHY ............................................................................................................................................3
Location .........................................................................................................................................................3 Land Use........................................................................................................................................................4 Topography....................................................................................................................................................4
GEOLOGY........................................................................................................................................................4 Bedrock Units ................................................................................................................................................5 Quaternary Sedimentary Deposits .................................................................................................................5
Older Quaternary Units.............................................................................................................................5 Young Quaternary Units............................................................................................................................7
Structure.........................................................................................................................................................7 ENGINEERING GEOLOGY............................................................................................................................8
Groundwater ..................................................................................................................................................8 Soil Testing..................................................................................................................................................10
PART II: LIQUEFACTION HAZARD ASSESSMENT ..................................................................... 13 MAPPING TECHNIQUES .............................................................................................................................13 LIQUEFACTION SUSCEPTIBILITY............................................................................................................13 GROUND SHAKING OPPORTUNITY.........................................................................................................14 LIQUEFACTION ANALYSIS .......................................................................................................................15 ZONATION CRITERIA: LIQUEFACTION ..................................................................................................15 DELINEATION OF SEISMIC HAZARD ZONES: LIQUEFACTION .........................................................16
Areas of Past Liquefaction...........................................................................................................................16 Artificial Fills ..............................................................................................................................................17 Areas with Sufficient Existing Geotechnical Data ......................................................................................17 Areas with Insufficient Existing Geotechnical Data....................................................................................18
ACKNOWLEDGMENTS ...............................................................................................................................18 REFERENCES ................................................................................................................................................18
ii CALIFORNIA GEOLOGICAL SURVEY 2008
SECTION 2: EVALUATION REPORT FOR EARTHQUAKE-INDUCED LANDSLIDE HAZARD.................................................................................................................................................................... 23
INTRODUCTION ...........................................................................................................................................23 Purpose ........................................................................................................................................................23 Background..................................................................................................................................................24 Methodology................................................................................................................................................24 Scope and Limitations .................................................................................................................................25
PART I: GEOGRAPHIC AND GEOLOGIC SETTING...................................................................... 25 PHYSIOGRAPHY ..........................................................................................................................................25
Location .......................................................................................................................................................25 Land Use......................................................................................................................................................26 Topography..................................................................................................................................................26 Digital Topography......................................................................................................................................26
GEOLOGY......................................................................................................................................................27 Bedrock Units ..............................................................................................................................................27 Quaternary Sedimentary Deposits ...............................................................................................................28 Structure.......................................................................................................................................................28
ENGINEERING GEOLOGY..........................................................................................................................29 Landslide Inventory .....................................................................................................................................29 Geologic Material Strength..........................................................................................................................30 Adverse Bedding Conditions .......................................................................................................................31 Existing Landslides......................................................................................................................................31
PART II: EARTHQUAKE-INDUCED LANDSLIDE HAZARD ASSESSMENT............................. 34 GROUND SHAKING OPPORTUNITY.........................................................................................................34 LANDSLIDE DISPLACEMENT CALCULATION ......................................................................................35 SLOPE STABILITY ANALYSIS...................................................................................................................36 ZONATION CRITERIA: EARTHQUAKE-INDUCED LANDSLIDES .......................................................37 DELINEATION OF SEISMIC HAZARD ZONES: EARTHQUAKE-INDUCED LANDSLIDES...............37
Existing Landslides......................................................................................................................................37 Hazard Potential Analysis............................................................................................................................38
ACKNOWLEDGMENTS ...............................................................................................................................38 REFERENCES ................................................................................................................................................39
AIR PHOTOS..............................................................................................................................................41 APPENDIX A: Source of Rock Strength Data...............................................................................................42
SECTION 3: GROUND SHAKING ASSESSMENT .............................................................. 43 INTRODUCTION ...........................................................................................................................................43 2002 PROBABILISTIC SEISMIC HAZARD ANALYSIS MODEL.............................................................44 APPLICATION TO LIQUEFACTION AND LANDSLIDE HAZARD ASSESSMENT..............................46 USE AND LIMITATIONS .............................................................................................................................48 REFERENCES ................................................................................................................................................51
SHZR 112 SEISMIC HAZARD ZONATION OF THE DUBLIN QUADRANGLE iii
FIGURES
Figure 2.1. Yield acceleration vs. Newmark displacement for the Corralitos record of the 1989 Loma Prieta Earthquake................................................................................................................................................35
Figure 3.1. Map of Dublin and parts of adjacent 7.5-minute quadrangles showing peak ground acceleration for firm rock at 10 percent exceedance in 50 years. .................................................................................45
Figure 3.2. Map of the Dublin and parts of adjacent 7.5-Minute quadrangles showing magnitude of and distance to the Predominant Earthquake at 10 percent exceedance in 50 years. ......................................47
Figure 3.3. Liquefaction opportunity map of the Dublin and parts of adjacent 7.5-minute quadrangles....................49
TABLES
Table 1.1. Correlation chart of Quaternary stratigraphic nomenclatures used in previous studies...............................6
Table 1.2. Summary of lithology types for Quaternary map units in the Dublin 7.5-Minute Quadrangle. ................11
Table 1.3. Summary of geotechnical characteristics of Quaternary map units in the entire Livermore Valley..........12
Table 2.1. Summary of the Shear Strength Statistics for the Dublin Quadrangle.......................................................32
Table 2.2. Summary of shear strength groups for the Dublin Quadrangle. ................................................................33
Table 2.3. Hazard potential matrix for earthquake-induced landslides in the Dublin Quadrangle. ............................37
Table 3.1. 1994 NEHRP soil factors for peak ground acceleration ............................................................................46
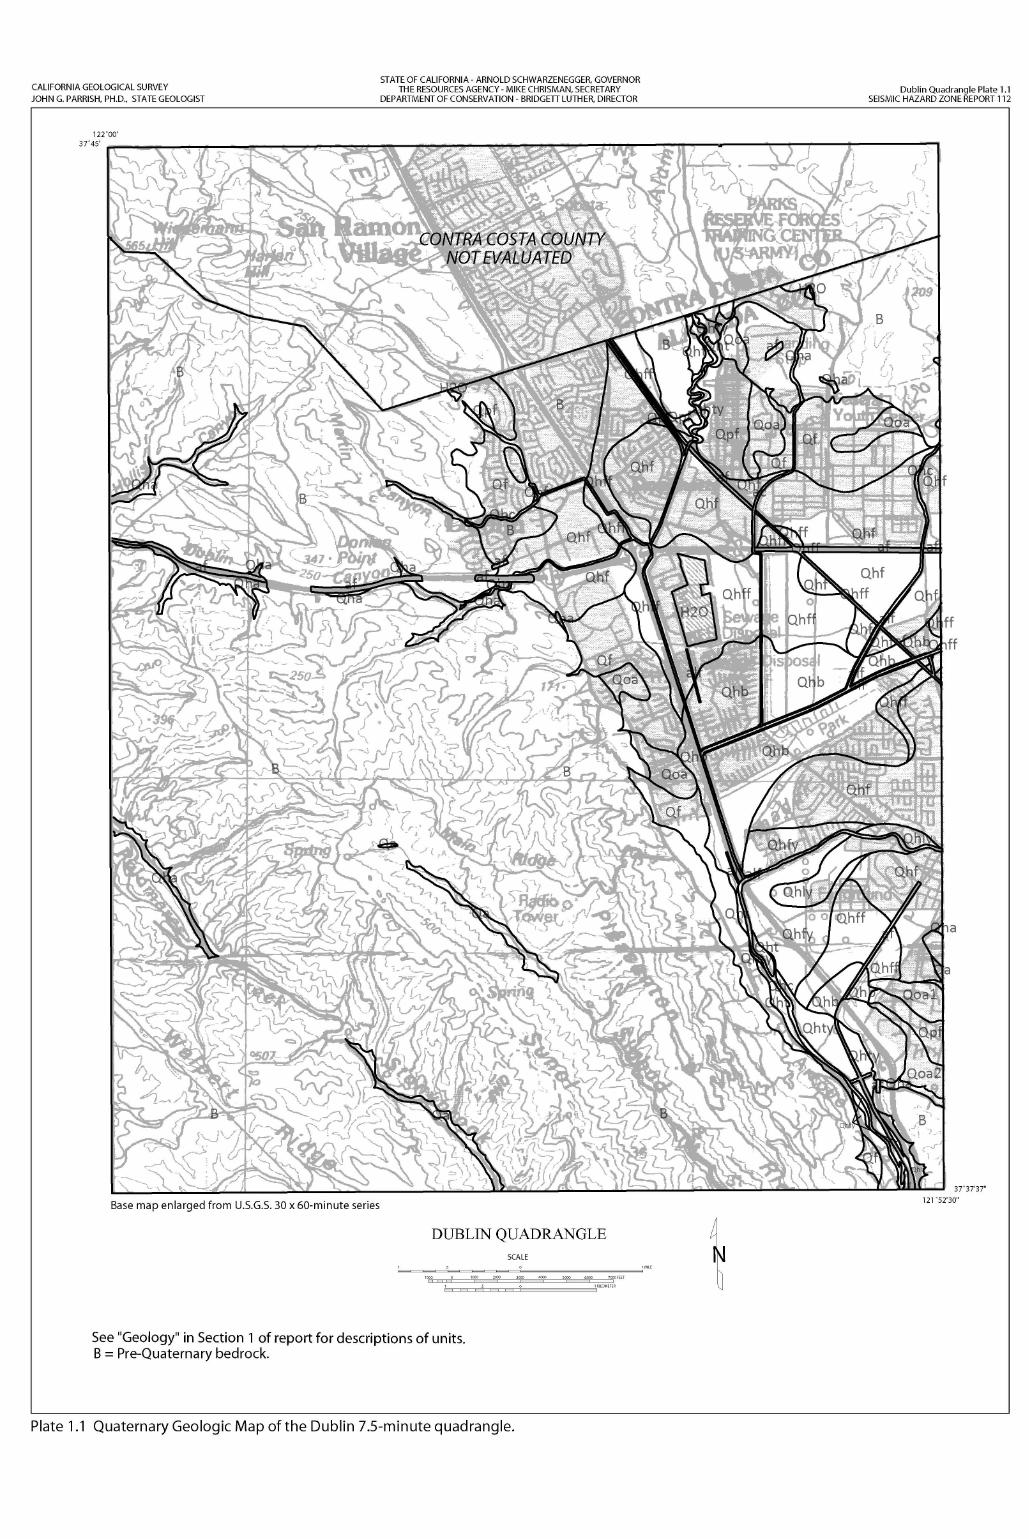
PLATES Plate 1.1. Quaternary Geologic Materials Map, Dublin 7.5-Minute Quadrangle.
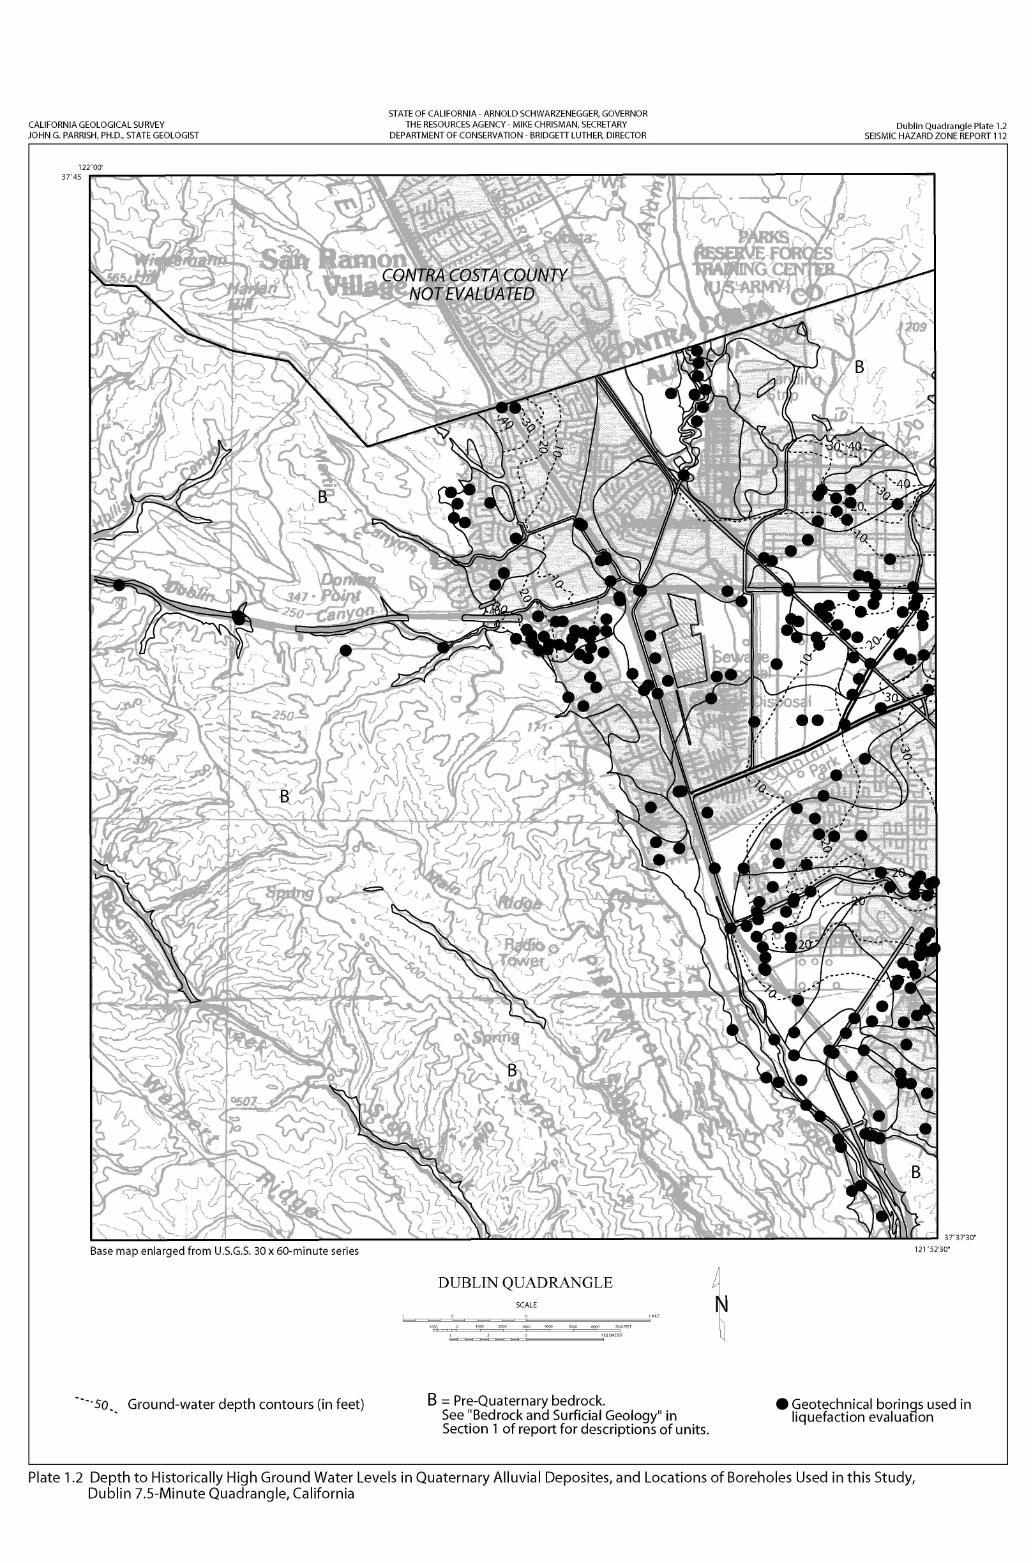
Plate 1.2. Depth to Historically High Groundwater Levels in Quaternary Alluvial Deposits and Locations of Boreholes Used in the Evaluating Liquefaction Potential, Dublin 7.5-Minute Quadrangle.
Plate 2.1. Landslide Inventory, Shear Test Sample Locations, and Areas of Significant Grading, Dublin 7.5-Minute Quadrangle.
iv CALIFORNIA GEOLOGICAL SURVEY 2008
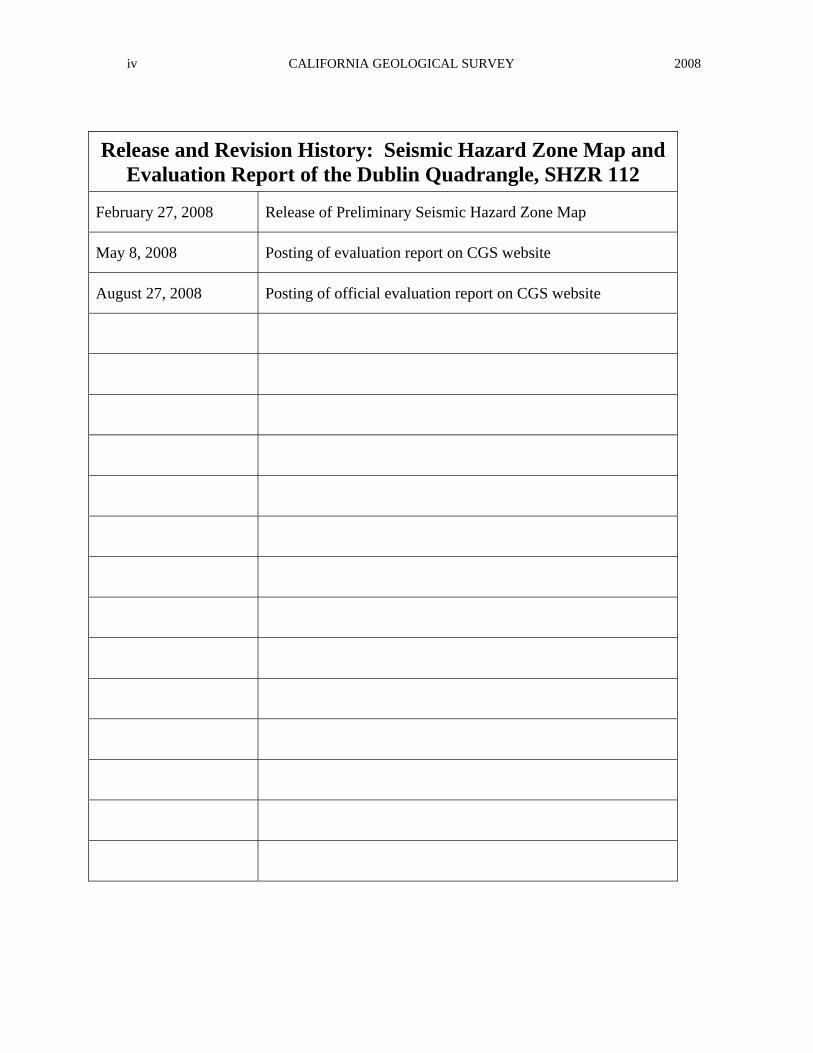
Release and Revision History: Seismic Hazard Zone Map and Evaluation Report of the Dublin Quadrangle, SHZR 112
February 27, 2008 Release of Preliminary Seismic Hazard Zone Map
May 8, 2008 Posting of evaluation report on CGS website
August 27, 2008 Posting of official evaluation report on CGS website

SHZR 112 SEISMIC HAZARD ZONATION OF THE DUBLIN QUADRANGLE v
EXECUTIVE SUMMARY This report summarizes the methods and sources of information used to prepare the Seismic Hazard Zone Map for the Dublin 7.5-Minute Quadrangle, Alameda County, California. The map, which covers approximately 59 square miles at a scale of 1 inch = 2,000 feet, displays the boundaries of Zones of Required Investigation for liquefaction and earthquake-induced landslides in eastern Alameda County.
About 10 square miles of land in the Dublin Quadrangle is designated as Zones of Required Investigation for liquefaction hazard. Within the quadrangle, this constitutes about two-thirds of Livermore Valley. In addition, liquefaction zones are designated on the floors of several canyons flowing to the west toward Hayward. Borehole logs of test holes drilled in Livermore Valley indicate the widespread presence of near-surface soil layers composed of saturated, loose sandy sediments. Geotechnical tests conducted downhole and in labs indicate that these soils generally have a moderate to high likelihood of liquefying, given the level of strong ground motions that this region could be subjected.
Approximately 30 square miles of hilly land in the southwestern half of the Dublin Quadrangle are, with the exception of intervening ridges and isolated gentle slopes, designated as Zones of Required Investigation for earthquake-induced landsliding. Also delineated are a few of the steeper slopes in the Dougherty Hills and Tassajara Creek State Park north of Livermore Valley.
Seismic hazard maps are prepared by the California Geological Survey (CGS) using geographic information system (GIS) technology, which allows the manipulation of three-dimensional data. Information analyzed in these studies includes topography, surface and subsurface geology, borehole log data, recorded groundwater levels, existing landslide features, slope gradient, rock-strength measurements, geologic structure, and probabilistic earthquake shaking estimates. Ground shaking inputs are based upon probabilistic seismic hazard maps that depict peak ground acceleration, mode magnitude, and mode distance with a 10 percent probability of exceedance in 50 years.
City, county, and state agencies are required by the California Seismic Hazards Mapping Act to use the seismic hazard zone maps in their land-use planning and permitting processes. They must withhold building permits for sites being developed within Zones of Required Investigation until the geologic and soil conditions of the project site are investigated and appropriate mitigation measures, if any, are incorporated into development plans. The Act also requires sellers of real property within these zones to disclose that fact at the time such property is sold.

SHZR 112 SEISMIC HAZARD ZONATION OF THE DUBLIN QUADRANGLE vii
THE CALIFORNIA SEISMIC HAZARDS MAPPING PROGRAM
The Seismic Hazards Mapping Act (the Act) of 1990 (Public Resources Code, Chapter 7.8, Division 2) directs the State Geologist to prepare maps identifying seismic hazard zones. The purpose of the Act is to reduce the threat to public health and safety and to minimize the loss of life and property by identifying and mitigating seismic hazards. City, county, and state agencies are directed to use the seismic hazard zone maps in their land-use planning and permitting processes. They must withhold development permits for a site within a zone until the geologic and soil conditions of the project site are investigated and appropriate mitigation measures, if any, are incorporated into development plans. The Act also requires sellers (and their agents) of real property within a mapped hazard zone to disclose at the time of sale that the property lies within such a zone. Evaluation and mitigation of seismic hazards are to be conducted under guidelines adopted by the California State Mining and Geology Board (SMGB) (DOC, 1997). The text of this report is online at http://gmw.consrv.ca.gov/shmp/webdocs/sp117.pdf
The Act directs SMGB to appoint and consult with the Seismic Hazards Mapping Act Advisory Committee (SHMAAC) in developing criteria for the preparation of the seismic hazard zone maps. SHMAAC consists of geologists, seismologists, civil and structural engineers, representatives of city and county governments, the state insurance commissioner and the insurance industry. In 1991, the SMGB adopted initial criteria for delineating seismic hazard zones to promote uniform and effective statewide implementation of the Act. These initial criteria, which were published in 1992 as California Geological Survey (CGS) Special Publication 118, were revised in 2004. They provide detailed standards for mapping regional liquefaction and landslide hazards. The Act also directed the State Geologist to develop a set of probabilistic seismic maps for California and to research methods that might be appropriate for mapping earthquake-induced landslide hazards.
In 1996, working groups established by SHMAAC reviewed the prototype maps and the techniques used to create them. The reviews resulted in recommendations that 1) the process for zoning liquefaction hazards remain unchanged and 2) earthquake-induced landslide zones be delineated using a modified Newmark analysis.
In April 2004, significant revisions of liquefaction zone mapping criteria relating to application of historically high groundwater level data in desert regions of the state were adopted by the SMGB. These modifications are reflected in the revised CGS Special Publication 118, which is available on online at: http://gmw.consrv.ca.gov/shmp/webdocs/sp118_revised.pdf.
This Seismic Hazard Zone Report summarizes the development of the Preliminary Seismic Hazard Zone Map for the Dublin 7.5-Minute Quadrangle. The process of zonation for liquefaction hazard involves an evaluation of Quaternary geologic mapping, groundwater information, and subsurface geotechnical data. The process of zonation for earthquake-induced landslide hazard incorporates evaluations of earthquake loading, existing landslides, slope gradient, rock strength, and geologic structure. A statewide Earthquake Shaking Potential Map,
viii CALIFORNIA GEOLOGICAL SURVEY 2008
based on probabilistic seismic hazard analysis (PSHA), has been prepared so that uniformly generated ground motion parameters (peak ground acceleration, mode magnitude, mode distance) are applied to all CGS liquefaction and earthquake-induced landslide hazard assessments.
SHZR 112 SEISMIC HAZARD ZONATION OF THE DUBLIN QUADRANGLE 1
SECTION 1: EVALUATION REPORT FOR LIQUEFACTION HAZARD
in the
DUBLIN 7.5-MINUTE QUADRANGLE, ALAMEDA COUNTY, CALIFORNIA
By
Anne M. Rosinski
Department of Conservation California Geological Survey
INTRODUCTION
Background The Seismic Hazards Mapping Act of 1990 (Public Resources Code, Chapter 7.8, Division 2) directs the California State Geologist to compile maps that identify Seismic Hazard Zones consistent with requirements and priorities established by the California State Mining and Geology Board (SMGB; DOC, 1997). The text of the guidelines is available online at: http://www.conservation.ca.gov/cgs/shzp/webdocs/sp117.pdf. The Act requires that site-specific geotechnical investigations be performed for most urban development projects situated within seismic hazard zones before lead agencies can issue the building permit.
Following the release of CGS Special Publication 117 (Department of Conservation, 1997), lead agencies in the Los Angeles metropolitan region sought more definitive guidance in the review of geotechnical investigations that address liquefaction hazard. The agencies made their request through the Geotechnical Engineering Group of the Los Angeles Section of the American Society of Civil Engineers (ASCE). This group convened an implementation committee under the auspices of the Southern California Earthquake Center (SCEC). The committee, which consisted of practicing geotechnical engineers and engineering geologists, released an overview of the practice of liquefaction analysis, evaluation, and mitigation techniques (Southern California Earthquake Center, 2002). This text is also online at: http://www.scec.org/.
CALIFORNIA GEOLOGICAL SURVEY 2008 2
This section of the evaluation report summarizes seismic hazard zone mapping for potentially liquefiable soils in the Dublin 7.5-Minute Quadrangle. Section 2 (addressing earthquake-induced landslide hazard) and Section 3 (addressing potential ground shaking) complete the evaluation report, which is one of a series that summarizes seismic hazard zone mapping by CGS in areas of the state where there is potential for strong ground motion (Smith, 1996). Additional information on seismic hazards zone mapping in California can be accessed on CGS’s web page: http://gmw.consrv.ca.gov/shmp/.
Liquefaction-induced ground failure historically has been a major cause of earthquake damage in northern California. During the 1989 Loma Prieta and 1906 San Francisco earthquakes, significant damage to roads, utility pipelines, buildings, and other structures in the San Francisco Bay area was caused by liquefaction-induced ground displacement.
Localities most susceptible to liquefaction-induced damage are underlain by loose, water-saturated, granular sediment within 40 feet of the ground surface. These geological and groundwater conditions are widespread in the San Francisco Bay Area, most notably in some densely populated valley regions and alluviated floodplains. In addition, the potential for strong earthquake ground shaking is high because of the many nearby active faults. The combination of these factors constitutes a significant seismic hazard, including areas in the Dublin Quadrangle.
Methodology CGS’s evaluation of liquefaction potential and preparation of seismic hazard zone maps requires the collection, compilation, and analysis of various geotechnical information and map data. The data are processed into a series of geographic information system (GIS) layers using commercially available software. In brief, project geologists complete the following principal tasks to generate a seismic hazard zone map for liquefaction potential:
• Compile digital geologic maps to delineate the spatial distribution of Quaternary sedimentary deposits.
• Collect geotechnical borehole log data from public agencies and engineering geologic consultants.
• Enter boring log data into the GIS.
• Generate digital cross sections to evaluate the vertical and lateral extent of Quaternary deposits and their lithologic and engineering properties.
• Evaluate and digitize historically highest groundwater levels in areas containing Quaternary deposits.
• Characterize expected earthquake ground motion, also referred to as ground-shaking opportunity (see Section 3 of this report).
• Perform quantitative analyses of geotechnical and ground motion data to assess the liquefaction potential of Quaternary deposits.
SHZR 112 SEISMIC HAZARD ZONATION OF THE DUBLIN QUADRANGLE 3
• Synthesize, analyze, and interpret above data to create maps delineating Zones of Required Investigation according to criteria adopted by the SMGB (DOC, 2004).
Scope and Limitations Evaluation for potentially liquefiable soils generally is confined to areas covered by Quaternary (less than about 1.6 million years) sedimentary deposits. Such areas within the Dublin Quadrangle consist of a main alluviated valley, several smaller stream valleys, and several isolated canyons. CGS’s liquefaction hazard evaluations are based on information on earthquake ground shaking, surface and subsurface lithology, geotechnical soil properties, and groundwater depth, all of which are gathered from various sources. Although selection of data used in this evaluation was rigorous, the quality of the data used varies. Therefore, the State of California and the Department of Conservation make no representations or warranties regarding the accuracy of the data obtained from outside sources.
Liquefaction zone maps are intended to prompt more detailed, site-specific geotechnical investigations, as required by the Act. As such, liquefaction zone maps identify areas where the potential for liquefaction is relatively high. The maps do not predict the amount or direction of liquefaction-related ground displacements, or the amount of damage to facilities that may result from liquefaction. Factors that control liquefaction-induced ground failure are the extent, depth, density, and thickness of liquefiable materials, depth to groundwater, rate of drainage, slope gradient, proximity to free faces, and intensity and duration of ground shaking. These factors must be evaluated on a site-specific basis to assess the potential for ground failure at any given project site.
This section of the report is presented in two parts. Part I addresses the geographic and geologic setting of the study area while Part II documents the data and parameters used to evaluate liquefaction hazard and to delineate Zones of Required Investigation within the Dublin 7.5-Minute Quadrangle.
PART I: GEOGRAPHIC AND GEOLOGIC SETTING
PHYSIOGRAPHY
Location The Dublin 7.5-Minute Quadrangle covers approximately 59 square miles of land in Alameda and Contra Costa counties at the eastern fringe of the San Francisco Bay Area. Currently, only Alameda County is subject to seismic hazard zonation. Therefore, the seismic hazard zone map excludes about 9.7 square miles of land in the northern margin of the quadrangle (about 16 % of the total area). Incorporated cities in the Alameda County part of the quadrangle are Pleasanton and Dublin, along with sparsely populated hilly land within the city limits of Hayward. Major transportation routes in the map area include east-west trending Interstate Highway 580 and northwest-southeast trending Interstate Highway 680. Additional access is provided by a

CALIFORNIA GEOLOGICAL SURVEY 2008 4
network of county roads and private roads in developed areas and by fire roads and trails in undeveloped areas.
Land Use Up until the last several decades, land use in the Livermore Valley and surrounding hill country was devoted mainly to cattle ranching, farming, and aggregate mining. Since then, considerable light commercial and residential development have occurred throughout most of the valley, although large-scale mining activity and agriculture associated with the local wine making industry still continue.
Topography The northeast corner of the map is occupied by foothills of the Diablo Range, while the western half of the map area includes portions of the northwest-trending East Bay hills, the western extent of the Diablo Range. The Diablo Range is part of the Coast Range Geomorphic province. The axis of the Diablo Range is aligned roughly parallel to the northwest-trending trace of the Calaveras Fault, which extends through the quadrangle. West-trending Dublin Canyon, cuts through the foothills near the center of the map area. Numerous creeks and small streams originate in the East Bay hills. Gold and Laurel Creeks, as well as many small unnamed creeks, flow eastward into Arroyo de la Laguna which drains to the south along the base of the hills. In addition, Palomares and Sinbad Creeks, confined to Stonybrook Canyon and the unnamed canyon between Sunol and Pleasanton Ridges respectively, flow southeast. In the northeast corner of the map area along the eastern side of the Dougherty Hills, Alamo Creek flows south out of the foothills of the Diablo Range towards the Livermore-Amador valley floor. Elevations within the map area range from 1839 feet near the central crest of Sunol Ridge, to less than 300 feet, in the eastern end of the valley floor. Portions of the west end of the Livermore Valley that now underlie the city of Pleasanton were once occupied by willow swamp, however in the late 19th Century, the area was drained in order to allow for increased development http://www.elivermore.com/photos/Hist_lvr_Aerial_03.htm.
GEOLOGY
Geologic units that generally are susceptible to liquefaction include late Quaternary alluvial and fluvial sedimentary deposits and artificial fill. To evaluate the areal and vertical distribution of shallow Quaternary deposits, gather information on subsurface geologic, lithologic and engineering properties, and relate sediment types to surrounding bedrock sources, we obtained from the U.S. Geological Survey recently completed digital maps covering the nine-county San Francisco Bay Area showing Quaternary deposits (Witter et al., 2006) and bedrock units (Wentworth and others, 1999). These GIS maps were combined, with minor modifications along the bedrock/Quaternary contact, to form a single, 1:24,000-scale geologic map of the Dublin Quadrangle. The distribution of Quaternary deposits on this map (summarized on Plate 1.1) was used in combination with other data, discussed below, to evaluate liquefaction susceptibility and develop the Seismic Hazard Zone Map.
SHZR 112 SEISMIC HAZARD ZONATION OF THE DUBLIN QUADRANGLE 5
Bedrock Units Although bedrock is not considered liquefiable material, the various units mapped in the Dublin Quadrangle are briefly described in this section because the composition and texture of sediments that accumulate in lowland basins such as Livermore Valley are governed in large part by the lithology of rocks exposed in the surrounding highlands. Most of the bedrock exposed in the hilly areas within the Dublin Quadrangle consists of Cretaceous marine sedimentary rocks, parts of which belong to an assemblage commonly referred to as the Great Valley Sequence. In general, the Cretaceous units exposed in the area are composed of varying amounts of graywacke, sandstone, siltstone, shale, and conglomerate. In the northwest part of the quadrangle these units are unconformably overlain by Miocene age marine sedimentary rocks that have been divided into a series of map units that include the Sobrante Sandstone, Claremont Shale, Oursan Sandstone, Rodeo Shale, Hambre Sandstone, Tice Shale, Neroly Sandstone, and sandstone and conglomerate beds of the Briones Formation. A few of these Miocene units include minor volcanic rocks within their sections. For more detail on bedrock exposed in the Dublin Quadrangle, see Section 2 of this report, Evaluation Report for Earthquake-Induced Landslide Hazard.
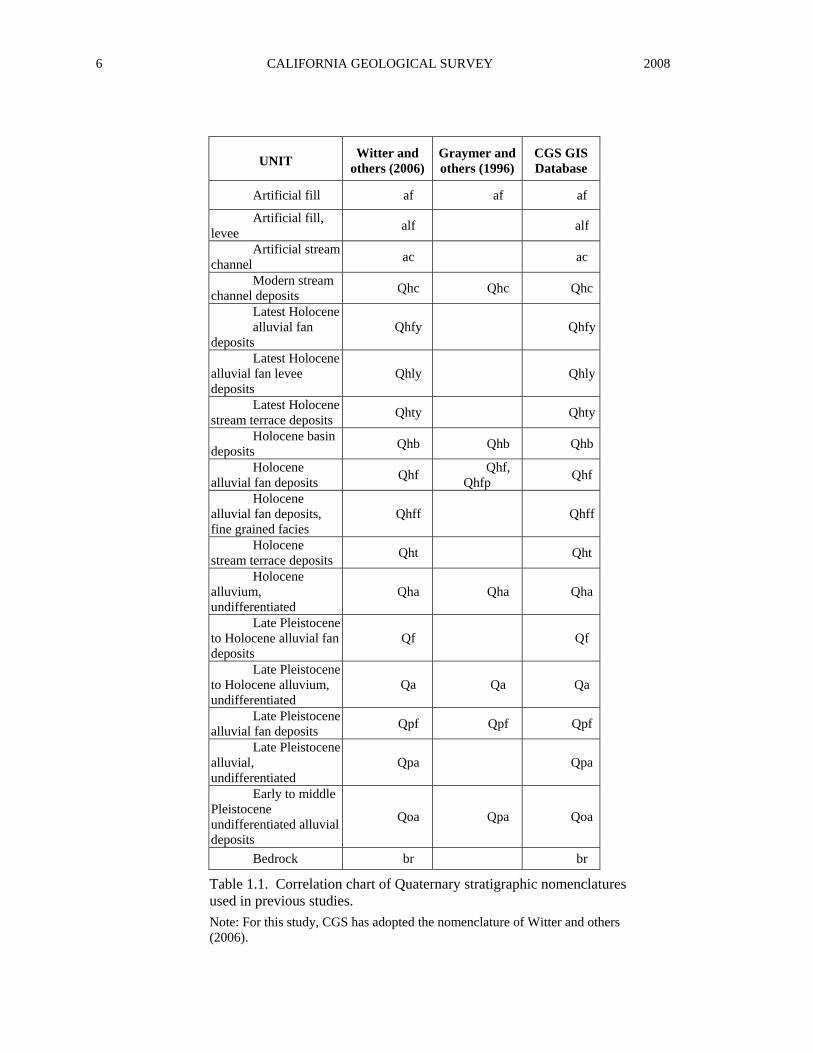
Quaternary Sedimentary Deposits The Quaternary geologic mapping methods described by Witter and others (2006) consist of interpretation of topographic maps, aerial photographs, and soil surveys, as well as compiled published and unpublished geologic maps. The authors estimate the ages of deposits using: landform shape, relative geomorphic position, cross cutting relationships, superposition, depth and degree of surface dissection, and relative degree of soil profile development. Table 1.1 compares stratigraphic nomenclature used in Knudsen and others (2000) and the CGS GIS database, with that of several previous studies performed in northern California.
Using the above mapping methods, Witter and others (2006) divide Quaternary deposits into 17 separate units that cover roughly half of the area encompassed by the Dublin Quadrangle. These alluvial sediments were mainly shed from the northwest-trending East Bay hills that occupy the western half of the quadrangle (Plate 1.1).
Older Quaternary Units
Early to middle Pleistocene alluvium, undifferentiated (Qoa) is mapped in small quantities at the base of upland areas, including the Tenan Canyon area near the center of the map area. Late Pleistocene alluvial fan (Qpf) and Qoa are mapped near the intersection of Sunol Boulevard and Sycamore Road in the southeast portion of the map area. These deposits are also mapped and at the base of the foothills in the northeast corner of the map area near Alamo Creek and along Broder Boulevard. Late Pleistocene alluvial fan (Qpf) deposits are also mapped near the intersection of State Highway 680 and Alcosta Boulevard in the northern part of the quadrangle evaluated. Late Pleistocene alluvial, undifferentiated (Qpa) are mapped in a narrow, semi-continuous band along the base of the hills near the center of the map, from just north of the interchange between State Highways 680 and 580, to the southeast corner of the map area.
CALIFORNIA GEOLOGICAL SURVEY 2008 6
UNIT Witter and others (2006)
Graymer and others (1996)
CGS GIS Database
Artificial fill af af af
Artificial fill, levee alf alf
Artificial stream channel ac ac
Modern stream channel deposits Qhc Qhc Qhc
Latest Holocene alluvial fan
deposits Qhfy Qhfy
Latest Holocene alluvial fan levee deposits
Qhly Qhly
Latest Holocene stream terrace deposits Qhty Qhty
Holocene basin deposits Qhb Qhb Qhb
Holocene alluvial fan deposits Qhf Qhf,
Qhfp Qhf
Holocene alluvial fan deposits, fine grained facies
Qhff Qhff
Holocene stream terrace deposits Qht Qht
Holocene alluvium, undifferentiated
Qha Qha Qha
Late Pleistocene to Holocene alluvial fan deposits
Qf Qf
Late Pleistocene to Holocene alluvium, undifferentiated
Qa Qa Qa
Late Pleistocene alluvial fan deposits Qpf Qpf Qpf
Late Pleistocene alluvial, undifferentiated
Qpa Qpa
Early to middle Pleistocene undifferentiated alluvial deposits
Qoa Qpa Qoa
Bedrock br br
Table 1.1. Correlation chart of Quaternary stratigraphic nomenclatures used in previous studies. Note: For this study, CGS has adopted the nomenclature of Witter and others (2006).
SHZR 112 SEISMIC HAZARD ZONATION OF THE DUBLIN QUADRANGLE 7
Young Quaternary Units
Latest Pleistocene to Holocene alluvium, undifferentiated (Qa), is mapped in small upland valleys, along Sinbad Creek and in Stonybrook Canyon in the southwest portion of the map area. Late Pleistocene to Holocene alluvial fan deposits (Qf) are mapped along with Qpa in a narrow, semi-continuous band along the base of the hills near the center of the map. In addition, late Pleistocene to Holocene alluvial fan deposits (Qf) are mapped in the northeast corner of the quadrangle in the vicinity of Broder Boulevard.
Holocene alluvium, undifferentiated (Qha) is mapped in long, narrow bands in canyons and along the banks of several creeks, including Hollis Canyon and Palomares Creek in the western half of the quadrangle. Holocene alluvium, undifferentiated (Qha), is also found along State Highway 580 through Dublin Canyon, and near the convergence of Devaney and Donlan Canyons in the central western portion of the quadrangle. Holocene stream terrace deposits (Qht) and latest Holocene stream terrace deposits (Qhty) are mapped along Alamo Creek in the northeast corner of the map area, and, along Arroyo de la Laguna in the southeast corner of the map area. Coarser grained Holocene alluvial fan (Qhf) deposits cover the steepest parts of the Livermore Valley, and as the gradient decreases, grade into Holocene alluvial fan deposits, fine facies (Qhff), in the vicinity of the interchange between State Highways 580 and 680. Holocene basin deposits (Qhb) are mapped near the center of the quadrangle in the vicinity of the intersection of Arroyo Mocho and Hopyard Road. Latest Holocene alluvial fan levee (Qhly) and Latest Holocene alluvial fan (Qhfy) deposits are found at the down-stream end of Arroyo Valle near the confluence of Arroyo de la Laguna in the southeast corner of the quadrangle.
Modern stream channel deposits (Qhc) “fluvial deposits within active, natural stream channels” (Witter and others, 2006) are only mapped along Alamo Creek in the northeast corner of the quadrangle and along Arroyo Valle and Arroyo de la Laguna in the southeast corner of the quadrangle. The remaining creeks and streams in the Livermore Valley have been modified. To accommodate larger flows in the winter months, some reaches of these watercourses as well as numerous other watercourses in the Livermore Valley have been engineered within concrete-lined structures and are mapped as artificial channel (ac). Artificial levee fill (alf) and artificial stream channels (ac) are mapped along most of the altered watercourses. Finally, artificial fill (af) is mapped as small, isolated bodies throughout the Dublin Quadrangle, and is commonly associated with infrastructure such as highways and rail lines, as well as small-scale construction projects.
Structure The Dublin Quadrangle lies within the San Andreas Fault system, which constitutes one of Earth’s major tectonic plate boundaries, separating the North American and Pacific plates. The two plates are moving past each other in a right lateral sense at the rate of about 4 centimeters a year. At the latitude of the San Francisco Bay area, about three-fourths of this relative movement is accommodated by shearing distributed across a broad, complex belt of major northwest-trending faults that include the San Andreas, Hayward, and Calaveras, as well as many parallel secondary faults such as the Greenville, Green Valley, and San Ramon-Concord. Furthermore, differential strike-slip movement among these faults generates additional thrust faulting, folding, and related structures throughout the belt, including the area covered by the
CALIFORNIA GEOLOGICAL SURVEY 2008 8
Livermore Quadrangle. From the Livermore Valley region north through the Diablo Range, this intense zone of deformation is referred to as the Mt. Diablo fold and thrust belt by Unruh and Sawyer, 1997.
The Livermore and Amador Valleys are a westerly-trending synclinal basin bounded on the east by the Greenville Fault and on the west by the Calaveras Fault. The basin is also bounded on the southeast by the Las Positas Fault and on the southwest by hills underlain by the northeast-dipping Verona Thrust Fault. The northern edge of the basin is bounded by the Mocho Fault (Unruh and Sawyer, 1997). In addition, groundwater basin studies by the Department of Water Resources (DWR) show evidence of a buried fault, referred to as the Pleasanton Fault, which extends through part of the Dublin Quadrangle below Amador Valley, paralleling the Calaveras Fault about 1.5 miles to the east (DWR, 1974). The existence of this and other concealed faults is based largely on differences in depth to groundwater on either side of their inferred traces as recorded from water well measurements.
CGS has officially delineated Earthquake Fault Zones for all of the Calaveras and parts of the Pleasanton and Verona Faults mapped within the Dublin Quadrangle (DOC, 1982a; 1982b; 1982c; 1997b)
ENGINEERING GEOLOGY
Groundwater Saturation reduces the effective normal stress of near-surface sediment, thereby increasing the likelihood of earthquake-induced liquefaction (Youd, 1973). CGS compiles and interprets groundwater data to identify areas presently or potentially characterized by near-surface saturated soils. For purposes of seismic hazard zonation, "near-surface" means at a depth less than 40 feet.
Natural hydrologic processes and human activities can cause groundwater levels to fluctuate over time. Therefore, it is impossible to predict depths to saturated soils during future earthquakes. One method of addressing time-variable depth to saturated soils is to establish an anticipated high groundwater level based on historical groundwater data. In areas where groundwater is either currently near-surface or could return to near-surface levels within a land-use planning interval of 50 years, CGS constructs regional contour maps that depict these levels.
Also, keep in mind that large-scale, artificial recharge programs, similar to the ones already established in Livermore Valley, could significantly affect future groundwater levels. In such cases, CGS will periodically evaluate their impact relative to liquefaction potential and revise official seismic hazard zone maps if necessary. Plate 1.2 depicts areas characterized by present or anticipated shallow groundwater within the Dublin Quadrangle.
Groundwater conditions were investigated in the Dublin Quadrangle to evaluate the depth to saturated materials. The evaluation was based on first-encountered water noted in geotechnical borehole logs acquired from the cities of Dublin and Livermore, as well as from Alameda County and the California Department of Transportation (CalTrans). Additional data were collected from the State Water Resources Control Board (SWRCB), and Alameda County Flood
SHZR 112 SEISMIC HAZARD ZONATION OF THE DUBLIN QUADRANGLE 9
Control and Water Conservation District Zone 7 Water Agency (Zone 7 Water Agency). The depths to first-encountered unconfined groundwater were plotted onto a map of the project area to constrain the estimate of historically shallowest groundwater. Water depths from boreholes known to penetrate confined aquifers were not used.
According to a recent study of sequence stratigraphy in the Livermore basin prepared for the Zone 7 Water Agency by Figures and Ehman (2004), “The current subsurface geologic model of the Livermore basin was developed by the California Department of Water Resources (DWR) in the early 1970’s (California Department of Water Resources, 1966; 1974). A large amount of surface and subsurface data has been collected since the DWR model was developed, but there has been no reevaluation or modification of the basin geologic model.” The Zone 7 Water Agency, which is responsible for managing both surface and groundwater supplies in the Livermore Valley basin, has been monitoring groundwater levels for over 30 years. Well data cover the period from 1900 through 2005 and show significant fluctuation in overall water depth during that period. It is the practice of the Zone 7 Water Agency to use water levels measured in 1983-1984 as the historical maximum groundwater depth for basin management purposes (Jones & Stokes, 2006). CGS reviewed the groundwater elevation map prepared by Zone 7 Water Agency with respect to groundwater elevations recorded on geotechnical boring logs collected for this liquefaction study, as well as well data from the State Water Resources Control Board (SWRCB), and Zone 7 Water Agency. CGS notes that for the most part groundwater elevations from individual boring/well data agree with historical high groundwater elevations on the map prepared by the Zone 7 Water Agency depicting 1983-1984 water elevations. CGS digitized groundwater elevation contours from the map produced by the Zone 7 Water Agency and constructed a 10-meter grid of groundwater elevation values from the groundwater contours on the figure. CGS assigned a groundwater elevation value to each boring in the study area by reading the value from the groundwater elevation grid at the location of each boring. In order to convert groundwater elevation to groundwater depth, CGS subtracted the groundwater elevation at each boring location from the ground surface elevation at the top of the boring. Finally, we created a depth to groundwater contour map by converting the depth to groundwater grid to depth to groundwater contours (Plate 1.2).
The boundary of the Zone 7 Water Agency map of historical high groundwater elevations roughly coincides with the base of the foothills that surround the Livermore Valley. Borings located in the foothills and in alluviated upland valleys fall outside the groundwater basin boundary and are not included in the historical high groundwater elevation grid described above. For borings located in areas outside the groundwater basin boundary as defined by the Zone 7 Water Agency, we were guided by data and analysis of shallow groundwater as recorded on geotechnical boring logs, where available.
Historical highest groundwater levels in the Dublin Quadrangle range from approximately 0 to 170 feet deep. Within the groundwater basin boundary as defined by the Zone 7 Water Agency, the average groundwater depth is less than approximately 20 feet, however, near the eastern central edge of the Livermore Valley groundwater may be as deep as 40 feet. Historical high groundwater depths become shallower toward the basin boundary. Depths to groundwater for many of the borings located in the foothills outside of the groundwater basin are greater than 60 feet.
CALIFORNIA GEOLOGICAL SURVEY 2008 10
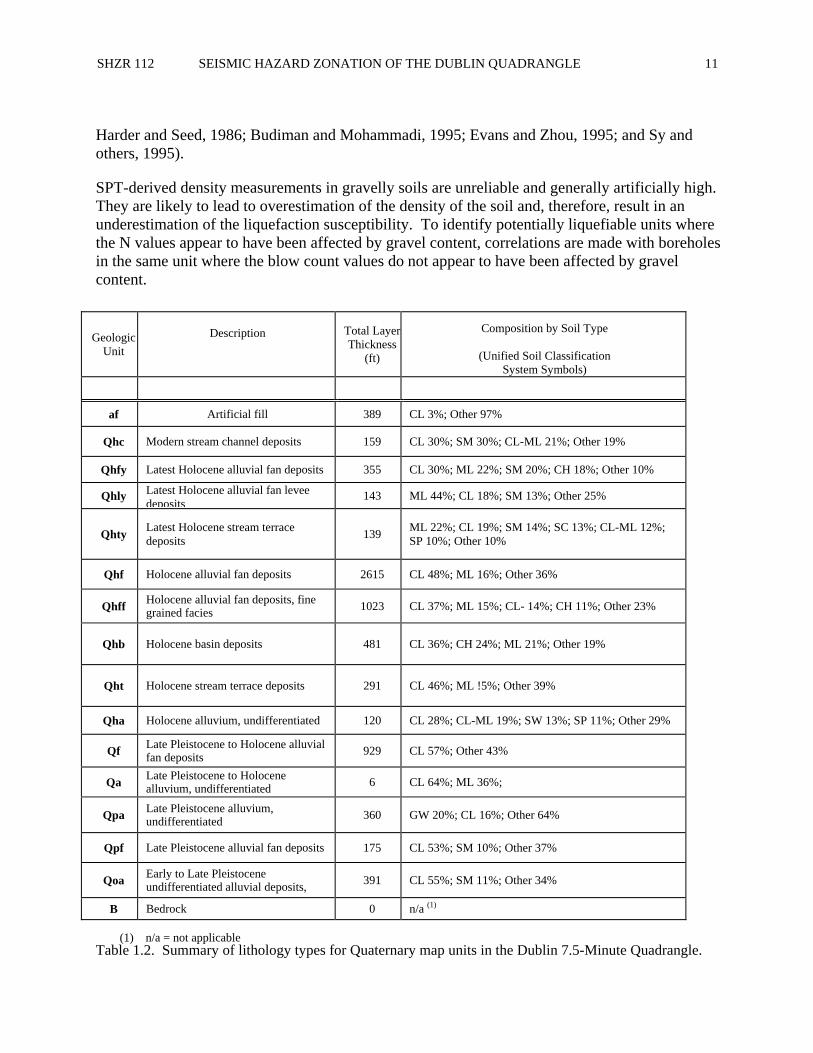
Soil Testing During this investigation, 240 borehole logs were collected and entered into a CGS geotechnical GIS database from the files of the cities of Dublin and Livermore, as well as from Alameda County, the State Department of Transportation, and the Division of the State Architect. As stated above, soils that are generally susceptible to liquefaction are mainly late Quaternary alluvial and fluvial sedimentary deposits and artificial fill. Deposits that contain saturated loose sandy and silty soils are most susceptible to liquefaction. Lithologic descriptions and soil test results reported in geotechnical borehole logs provide valuable information regarding subsurface geology, groundwater levels, and the engineering characteristics of sedimentary deposits. Furthermore, the application of GIS technology greatly enhances the ability to synthesize and manipulate voluminous amounts of geotechnical data. For example, Table 1.2 characterizes the various depositional environments present in Dublin 7.5-Minute Quadrangle by showing proportions of the different subsurface sediment types penetrated by the boreholes and recorded on logs.
Of particular value in liquefaction evaluations are logs that report the results of downhole standard penetration tests. Standard Penetration Test (SPTs) method provides a standardized measure of the penetration resistance of sedimentary deposits and is commonly used as an index of soil density. This in-situ test consists of counting the number of blows required to drive a split-spoon sampler (1.375-inch inside diameter) one foot into the soil at the bottom of a borehole at chosen intervals while drilling. The driving force is provided by dropping a 140-pound hammer weight a distance of 30 inches. The SPT method is formally defined and specified by the American Society for Testing and Materials in test method D1586 (ASTM, 2004). Recorded blow counts for non-SPT geotechnical sampling where the sampler diameter, hammer weight or drop distance differs from that specified for an SPT (ASTM D1586), are converted to SPT-equivalent blow counts. The actual and converted SPT blow counts are normalized to a common reference, effective-overburden pressure of 1 atmosphere (approximately 1 ton per square foot) and a hammer efficiency of 60 percent, using a method described by Seed and Idriss (1982) and Seed and others (1985). This normalized blow count is referred to as (N1)60.
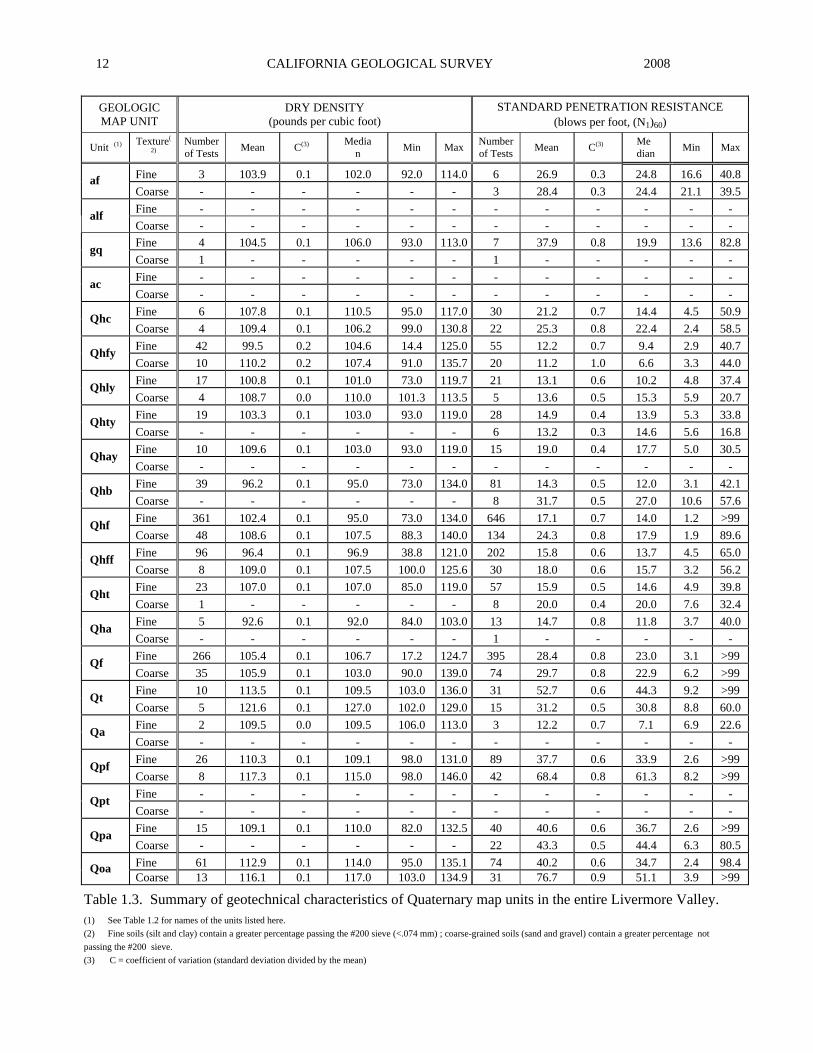
Geotechnical borehole logs provide information on lithologic and engineering characteristics of Quaternary deposits in and around Livermore Valley. The characteristics reported in Table 1.2 summarize conditions in the Dublin 7.5-Minute Quadrangle. The characteristics reported in Table 1.3 summarize conditions in the entire Livermore Valley (Dublin, Livermore and Altamont 7.5-minute quadrangles).
The Seed-Idriss Simplified Procedure for liquefaction evaluation was developed primarily for clean sand and silty sand. As described above, results depend greatly on accurate evaluation of in-situ soil density as measured by the number of soil penetration blow counts using an SPT sampler. However, many of the Holocene alluvial deposits in the study area contain significant amounts of gravel. In the past, gravel and gravelly materials were considered not to be susceptible to liquefaction because the high permeability of these soils presumably would allow the dissipation of pore pressures before liquefaction could occur. However, liquefaction in gravel has been reported during earthquakes and recent laboratory studies have confirmed the phenomena (Ishihara, 1985;
SHZR 112 SEISMIC HAZARD ZONATION OF THE DUBLIN QUADRANGLE 11
Harder and Seed, 1986; Budiman and Mohammadi, 1995; Evans and Zhou, 1995; and Sy and others, 1995).
SPT-derived density measurements in gravelly soils are unreliable and generally artificially high. They are likely to lead to overestimation of the density of the soil and, therefore, result in an underestimation of the liquefaction susceptibility. To identify potentially liquefiable units where the N values appear to have been affected by gravel content, correlations are made with boreholes in the same unit where the blow count values do not appear to have been affected by gravel content.
Composition by Soil Type
(Unified Soil Classification
Total LayerDescription Geologic Unit Thickness
(ft)
System Symbols)
af Artificial fill 389 CL 3%; Other 97%
Qhc Modern stream channel deposits 159 CL 30%; SM 30%; CL-ML 21%; Other 19%
Qhfy Latest Holocene alluvial fan deposits 355 CL 30%; ML 22%; SM 20%; CH 18%; Other 10%
Qhly Latest Holocene alluvial fan levee deposits
143 ML 44%; CL 18%; SM 13%; Other 25%
Qhty Latest Holocene stream terrace deposits 139 ML 22%; CL 19%; SM 14%; SC 13%; CL-ML 12%;
SP 10%; Other 10%
Qhf Holocene alluvial fan deposits 2615 CL 48%; ML 16%; Other 36%
Qhff Holocene alluvial fan deposits, fine grained facies 1023 CL 37%; ML 15%; CL- 14%; CH 11%; Other 23%
Qhb Holocene basin deposits 481 CL 36%; CH 24%; ML 21%; Other 19%
Qht Holocene stream terrace deposits 291 CL 46%; ML !5%; Other 39%
Qha Holocene alluvium, undifferentiated 120 CL 28%; CL-ML 19%; SW 13%; SP 11%; Other 29%
Qf Late Pleistocene to Holocene alluvial fan deposits 929 CL 57%; Other 43%
Qa Late Pleistocene to Holocene alluvium, undifferentiated 6 CL 64%; ML 36%;
Qpa Late Pleistocene alluvium, undifferentiated 360 GW 20%; CL 16%; Other 64%
Qpf Late Pleistocene alluvial fan deposits 175 CL 53%; SM 10%; Other 37%
Qoa Early to Late Pleistocene undifferentiated alluvial deposits, 391 CL 55%; SM 11%; Other 34%
B Bedrock 0 n/a (1)
(1) n/a = not applicable Table 1.2. Summary of lithology types for Quaternary map units in the Dublin 7.5-Minute Quadrangle.
CALIFORNIA GEOLOGICAL SURVEY 2008 12
GEOLOGIC MAP UNIT
DRY DENSITY (pounds per cubic foot)
STANDARD PENETRATION RESISTANCE (blows per foot, (N1)60)
Unit (1) Texture(
2) Number of Tests Mean C(3) Media
n Min Max Number of Tests Mean C(3) Me
dian Min Max
Fine 3 103.9 0.1 102.0 92.0 114.0 6 26.9 0.3 24.8 16.6 40.8 af Coarse - - - - - - 3 28.4 0.3 24.4 21.1 39.5 Fine - - - - - - - - - - - - alf Coarse - - - - - - - - - - - - Fine 4 104.5 0.1 106.0 93.0 113.0 7 37.9 0.8 19.9 13.6 82.8 gq Coarse 1 - - - - - 1 - - - - - Fine - - - - - - - - - - - - ac Coarse - - - - - - - - - - - - Fine 6 107.8 0.1 110.5 95.0 117.0 30 21.2 0.7 14.4 4.5 50.9 Qhc Coarse 4 109.4 0.1 106.2 99.0 130.8 22 25.3 0.8 22.4 2.4 58.5 Fine 42 99.5 0.2 104.6 14.4 125.0 55 12.2 0.7 9.4 2.9 40.7 Qhfy Coarse 10 110.2 0.2 107.4 91.0 135.7 20 11.2 1.0 6.6 3.3 44.0 Fine 17 100.8 0.1 101.0 73.0 119.7 21 13.1 0.6 10.2 4.8 37.4 Qhly Coarse 4 108.7 0.0 110.0 101.3 113.5 5 13.6 0.5 15.3 5.9 20.7 Fine 19 103.3 0.1 103.0 93.0 119.0 28 14.9 0.4 13.9 5.3 33.8 Qhty Coarse - - - - - - 6 13.2 0.3 14.6 5.6 16.8 Fine 10 109.6 0.1 103.0 93.0 119.0 15 19.0 0.4 17.7 5.0 30.5 Qhay Coarse - - - - - - - - - - - - Fine 39 96.2 0.1 95.0 73.0 134.0 81 14.3 0.5 12.0 3.1 42.1 Qhb Coarse - - - - - - 8 31.7 0.5 27.0 10.6 57.6 Fine 361 102.4 0.1 95.0 73.0 134.0 646 17.1 0.7 14.0 1.2 >99 Qhf Coarse 48 108.6 0.1 107.5 88.3 140.0 134 24.3 0.8 17.9 1.9 89.6 Fine 96 96.4 0.1 96.9 38.8 121.0 202 15.8 0.6 13.7 4.5 65.0 Qhff Coarse 8 109.0 0.1 107.5 100.0 125.6 30 18.0 0.6 15.7 3.2 56.2 Fine 23 107.0 0.1 107.0 85.0 119.0 57 15.9 0.5 14.6 4.9 39.8 Qht Coarse 1 - - - - - 8 20.0 0.4 20.0 7.6 32.4 Fine 5 92.6 0.1 92.0 84.0 103.0 13 14.7 0.8 11.8 3.7 40.0 Qha Coarse - - - - - - 1 - - - - - Fine 266 105.4 0.1 106.7 17.2 124.7 395 28.4 0.8 23.0 3.1 >99 Qf Coarse 35 105.9 0.1 103.0 90.0 139.0 74 29.7 0.8 22.9 6.2 >99 Fine 10 113.5 0.1 109.5 103.0 136.0 31 52.7 0.6 44.3 9.2 >99 Qt Coarse 5 121.6 0.1 127.0 102.0 129.0 15 31.2 0.5 30.8 8.8 60.0 Fine 2 109.5 0.0 109.5 106.0 113.0 3 12.2 0.7 7.1 6.9 22.6 Qa Coarse - - - - - - - - - - - - Fine 26 110.3 0.1 109.1 98.0 131.0 89 37.7 0.6 33.9 2.6 >99 Qpf Coarse 8 117.3 0.1 115.0 98.0 146.0 42 68.4 0.8 61.3 8.2 >99 Fine - - - - - - - - - - - - Qpt Coarse - - - - - - - - - - - - Fine 15 109.1 0.1 110.0 82.0 132.5 40 40.6 0.6 36.7 2.6 >99 Qpa Coarse - - - - - - 22 43.3 0.5 44.4 6.3 80.5 Fine 61 112.9 0.1 114.0 95.0 135.1 74 40.2 0.6 34.7 2.4 98.4 Qoa Coarse 13 116.1 0.1 117.0 103.0 134.9 31 76.7 0.9 51.1 3.9 >99
Table 1.3. Summary of geotechnical characteristics of Quaternary map units in the entire Livermore Valley. (1) See Table 1.2 for names of the units listed here. (2) Fine soils (silt and clay) contain a greater percentage passing the #200 sieve (<.074 mm) ; coarse-grained soils (sand and gravel) contain a greater percentage not passing the #200 sieve. (3) C = coefficient of variation (standard deviation divided by the mean)
SHZR 112 SEISMIC HAZARD ZONATION OF THE DUBLIN QUADRANGLE 13
Most of the 240 geotechnical borehole logs analyzed in this study (Plate 1.3) include blow-count data from SPTs or from penetration tests that allow reasonable blow count conversions to SPT-equivalent values. Few of the borehole logs collected, however, include all of the information (e.g. soil density, moisture content, sieve analysis, etc.) required for an ideal analysis using the Seed-Idriss Simplified Procedure. For boreholes having acceptable penetration tests, liquefaction analysis is performed using recorded density, moisture, and sieve test values or using averaged test values of similar materials.
PART II: LIQUEFACTION HAZARD ASSESSMENT
MAPPING TECHNIQUES
Liquefaction may occur in water-saturated sediment during moderate to great earthquakes. When this occurs, sediment loses strength and may fail, causing damage to buildings, bridges, and other structures. Many methods for mapping liquefaction hazard have been proposed. Youd (1991) highlights the principal developments and notes some of the widely used criteria. Youd and Perkins (1978) demonstrate the use of geologic criteria as a qualitative characterization of liquefaction susceptibility and introduce the mapping technique of combining a liquefaction susceptibility map and a liquefaction opportunity map to produce a liquefaction potential map. Liquefaction susceptibility is a function of the capacity of sediment to resist liquefaction. Liquefaction opportunity is a function of potential seismic ground shaking intensity.
The method applied in this study to evaluate liquefaction potential is similar to that of Tinsley and others (1985) in the Los Angeles region. These investigators, in turn, applied a combination of the techniques developed by Seed and others (1983) and Youd and Perkins (1978). CGS’s method combines geotechnical analyses, geologic and hydrologic mapping, and probabilistic earthquake shaking estimates employing criteria adopted by the SMGB (DOC, 2004).
LIQUEFACTION SUSCEPTIBILITY
Liquefaction susceptibility reflects the relative resistance of a soil to loss of strength when subjected to ground shaking. Physical properties of soil such as sediment grain-size distribution, compaction, cementation, saturation, and depth from the surface govern the degree of resistance to liquefaction. Some of these properties can be correlated to the geologic age and environment of deposition. With increasing age, relative density may increase through cementation of the particles or compaction caused by the weight of the overlying sediment.
Grain size characteristics of a soil also influence susceptibility to liquefaction. Recent work by Boulanger and Idriss (2006) has shown that non-plastic silt and clay-sized particles may liquefy. Typically, sand is more susceptible than silt or gravel, although silt of low plasticity is treated as liquefiable in this investigation. Cohesive soils generally are not considered susceptible to liquefaction. Such soils may be vulnerable to strength loss with remolding and represent a hazard that is not specifically addressed in this investigation.
CALIFORNIA GEOLOGICAL SURVEY 2008 14
Soil characteristics that result in higher measured penetration resistances generally indicate lower liquefaction susceptibility. In summary, soils that lack resistance (susceptible soils) typically are saturated, loose, granular, and non-plastic. Soils resistant to liquefaction include all soil types that are dry, cohesive, or sufficiently dense.
CGS’s inventory of areas containing soils susceptible to liquefaction begins with evaluation of geologic maps and historical occurrences, cross-sections, geotechnical test data, geomorphology, and groundwater hydrology. Soil properties and soil conditions such as type, age, texture, color, and consistency, along with historical depths to groundwater are used to identify, characterize, and correlate susceptible soils. Because Quaternary geologic mapping is based on similar soil observations, liquefaction susceptibility maps typically are often similar to Quaternary geologic maps, depending on local groundwater levels. The western end of the Livermore-Amador Valley in the study area is underlain by an indeterminate thickness of Holocene sediment and ground water is within 40 feet of the ground surface throughout the part of the Livermore-Amador Valley within the quadrangle. Holocene sediments deposited in the basin are composed primarily of clays and silts with interbedded layers of loose sands and gravels. However, boring log information indicates that from place to place, the general composition of some geologic units differs from their average basin-wide composition. For example, of the samples collected from Holocene alluvial fan (Qhf), Holocene stream terrace (Qht), late Pleistocene to Holocene alluvial fan (Qf), late Pleistocene alluvial fan (Qpf), late Pleistocene alluvium, undifferentiated (Qpa) and early to middle Pleistocene undifferentiated alluvium (Qoa) deposits, they appear to be somewhat more clay rich than the basin-wide average. On the other hand, of the samples collected from modern stream channel (Qhc) deposits, they appear to be somewhat sandier than the unit’s basin-wide average, while the Holocene alluvial fan, fine facies unit (Qhff) appears to be somewhat less clay rich than the unit’s basin-wide average. It should be noted that the apparent change in the relative abundance of the various lithologic materials may simply reflect an increase or decrease in the frequency that the material was sampled rather than a change in the actual abundance of the material.
GROUND SHAKING OPPORTUNITY
Ground shaking opportunity is a calculated measure of the intensity and duration of strong ground motion normally expressed in terms of peak horizontal ground acceleration (PGA). Ground motion calculations used by CGS exclusively for regional liquefaction zonation assessments are currently based on the 2002 California Probabilistic Seismic Hazard Assessment (PSHA) Model developed jointly by the CGS and USGS (Frankel and others, 2002; Cao and others, 2003). The model is set to calculate ground motion hazard at a 10 percent in 50 years exceedance level. CGS calculations of probabilistic peak ground acceleration deviate slightly from the model by incorporating additional programming that weights each earthquake’s estimated ground shaking contribution by a scaling factor derived as a function of its magnitude. The function is simply the inverse of the liquefaction threshold-scaling factor used in the Seed-Idriss Simplified Procedure, the quantitative analysis method used by CGS to generate seismic hazard zone maps for liquefaction (see Liquefaction Analysis). The result is a magnitude-weighted, pseudo-PGA that CGS refers to as Liquefaction Opportunity (LOP). LOP is then used to calculate cyclic stress ratio (CSR), the seismic load imposed on a soil column at a particular
SHZR 112 SEISMIC HAZARD ZONATION OF THE DUBLIN QUADRANGLE 15
site. This approach provides an improved estimate of liquefaction hazard in a probabilistic sense, ensuring that large, infrequent, distant earthquakes, as well as smaller, more frequent, nearby events are appropriately accounted for (Real et al., 2000).
Calculated LOP for alluviated valley areas in the Dublin Quadrangle range from 0.433 to 0.568 g (see Section 3, Figure 3.3). These values were obtained by applying the NEHRP corrections (FEMA, 1994; Table 3.1) to the firm-rock LOP values derived from the CGS liquefaction application of the 2002 probabilistic ground motion model. The calculations are based on an earthquake of Moment Magnitude 6.75 with a Modal Distance of 0 to 9.0 miles.
LIQUEFACTION ANALYSIS
CGS performs quantitative analysis of geotechnical data to evaluate liquefaction potential using an in-house developed computer program based on the Seed-Idriss Simplified Procedure Seed and Idriss, (1971), Seed and others (1983), National Research Council 1985, Seed and others (1985), Seed and Harder (1990), Youd and Idriss (1997), and Youd and others (2001). The procedure first calculates the resistance to liquefaction of each soil layer penetrated at a test-drilling site, expressed in terms of cyclic resistance ratio (CRR). The calculations are based on standard penetration test (SPT) results, groundwater level, soil density, grain-size analysis, moisture content, soil type, and sample depth. The procedure then estimates the factor of safety relative to liquefaction hazard for each of the soil layers logged at the site by dividing their calculated CRR by the pseudo PGA-derived CSR described in the previous section.
CGS uses a factor of safety (FS) of 1.0 or less, where CSR equals or exceeds CRR, to indicate the presence of potentially liquefiable soil layers. The liquefaction analysis program calculates an FS for each geotechnical sample where blow counts were collected. Typically, multiple samples are collected for each borehole. The program then independently calculates an FS for each non-clay layer that includes at least one penetration test using the minimum (N1)60 value for that layer. The minimum FS value of the layers penetrated by the borehole is used to determine the liquefaction potential for each borehole location. The reliability of FS values varies according to the quality of the geotechnical data. . In addition to FS, consideration is given to the proximity to stream channels, which accounts in a general way for factors such as slopes or free faces that contribute to severity of liquefaction-related ground deformation.
ZONATION CRITERIA: LIQUEFACTION
Areas underlain by materials susceptible to liquefaction during an earthquake are included in liquefaction zones using criteria developed by the Seismic Hazards Mapping Act Advisory Committee and adopted by the SMGB (DOC, 2004). Under those guideline criteria, liquefaction zones are areas meeting one or more of the following:
1. Areas known to have experienced liquefaction during historical earthquakes
CALIFORNIA GEOLOGICAL SURVEY 2008 16
2. All areas of uncompacted artificial fill that are saturated, nearly saturated, or may be expected to become saturated
3. Areas where sufficient existing geotechnical data and analyses indicate that the soils are potentially liquefiable
4. Areas where existing subsurface data are not sufficient for quantitative evaluation of liquefaction hazard. Within such areas, zones may be delineated by geologic criteria as follows:
a) Areas containing soil deposits of late Holocene age (current river channels and their historic floodplains, marshes and estuaries), where the M7.5-weighted peak acceleration that has a 10 percent probability of being exceeded in 50 years is greater than or equal to 0.10 g and the anticipated depth to saturated soil is less than 40 feet; or
b) Areas containing soil deposits of Holocene age (less than 11,000 years), where the M7.5-weighted peak acceleration that has a 10 percent probability of being exceeded in 50 years is greater than or equal to 0.20 g and the anticipated depth to saturated soil is less than 30 feet; or
c) Areas containing soil deposits of latest Pleistocene age (11,000 to 15,000 years), where the M7.5-weighted peak acceleration that has a 10 percent probability of being exceeded in 50 years is greater than or equal to 0.30 g and the anticipated depth to saturated soil is less than 20 feet.
Application of the above criteria allows compilation of Zones of Required Investigation for liquefaction hazard, which are useful for preliminary evaluations, general land-use planning and delineation of special studies zones (Youd, 1991).
DELINEATION OF SEISMIC HAZARD ZONES: LIQUEFACTION
Upon completion of a liquefaction hazard evaluation within a project quadrangle, CGS applies the above criteria to its findings in order to delineate Zones of Required Investigation. Following is a description of the criteria-based factors that governed the construction of the Seismic Hazard Zone map for the Dublin Quadrangle.
Areas of Past Liquefaction Knudsen and others (2000) compiled ground failure data from Tinsley and others (1998) and Youd and Hoose (1978) for earthquakes in the San Francisco Bay region. Tinsley and others (1998) compiled observations of evidence for liquefaction for the 1989 Loma Prieta earthquake. Youd and Hoose (1978) compiled observations for earlier earthquakes, including 1868 Hayward and 1906 San Francisco earthquakes. The Knudsen and others’ (2000) digital database differs from earlier compilation efforts in that the observations were located on a 1:24,000-scale base map versus the smaller-scale base maps used in the earlier publications. Sites were reevaluated and some single sites were broken into two or more where the greater base-map scale allowed.
SHZR 112 SEISMIC HAZARD ZONATION OF THE DUBLIN QUADRANGLE 17
In the Dublin Quadrangle, Youd and Hoose (1978) catalogued one instance of documented historical liquefaction recorded by Lawson and others (1908) in association with the 1906 earthquake. The incident recorded by Lawson and others (1908) occurred near the northeast corner of the intersection of Santa Rita Road and State Highway 580, along the east bank of Tassajara Creek. Lawson and others (1908) reported “…several somewhat crescentic cracks along which the ground had slipt down and toward the creek from 1 to 3 inches. These cracks extended farther south, according to local settlers, and crost the road”.
Artificial Fills Non-engineered fill placements vary in size and type and because they are often composed of uncompacted, silty or sandy material, they are generally considered to have a high potential for liquefaction when saturated. No significant placements of non-engineered artificial fill were identified in the study area. Conversely, significant amounts of engineered artificial fill have been used in the construction of levees and elevated freeways within the Dublin Quadrangle. However, seismic hazard zonation for liquefaction in areas where engineered fill has been placed does not depend on the fill, but on soil conditions in underlying strata.
Areas with Sufficient Existing Geotechnical Data Sufficient geotechnical data were available for the central portion of the Livermore Valley in the Dublin Quadrangle to enable quantitative analysis (Seed-Idriss Simplified Procedure) for estimating liquefaction potential of Quaternary deposits. Analysis of blow count values and other soil property measurements reported in the logs inside the zone boundary indicate that most of the boreholes penetrated one or more layers of liquefiable material where seismic stress ratio (CSR) is greater than the soils’ seismic resistance ratio (CRR). Accordingly, all areas covered by Holocene alluvium that is saturated within 40 feet of the surface are designated Zones of Required Investigation.
The majority of the boundary for the Zones of Required Investigation is defined by the contact between Holocene and late Pleistocene deposits and/or bedrock, and extends along base of the foothills that surrounds the Livermore Valley. Along the northern margin of the valley, in the vicinity of the intersection of Hacienda Drive and Central Parkway sediment mapped as late Pleistocene to Holocene alluvial fan deposits (Qf) is included in the Zones of Required Investigation. Although the age of the unit suggests that the sediment has had sufficient time to consolidate, thus rendering it unlikely to liquefy, subsurface data indicate that the deposit in question includes a greater abundance of silt and lower penetration resistance compared to occurrences of Qf mapped in other portions of the Dublin Quadrangle. It is therefore is included in the Zones of Required Investigation.
The area near the intersection of Hopyard Road and Arroyo Mocho, which was once occupied by what was known as “Willow Swamp”, is excluded from the Zones of Required Investigation. Although ground water is within 10 to 20 feet of the ground surface throughout much of this area, it is underlain by Holocene basin sediments (Qhb) locally made up of approximately 32% clay. According to the geologic model of the Livermore basin developed by the California Department of Water Resources (DWR) in the early 1970’s (DWR, 2003; 2007), “Up to 60 feet of clay was deposited in this lake [swamp] that now forms a clay cap referred to as the upper aquiclude.” CGS

CALIFORNIA GEOLOGICAL SURVEY 2008 18
analysis of borehole data in the vicinity of the lake show that the shallowest liquefiable layers are overlain by a minimum of 35 feet of sediment and are less than approximately 5 feet thick, therefore, even if these sediments were to liquefy, they likely would not produce surface deformation. An exception is a small Holocene basin deposit (Qhb) near the intersection of State Highway 680 and the Western Pacific Rail line, in the southeastern corner of the quadrangle. This area is included in the Zones of Required Investigation because the underlying sedimentary deposits contain a significantly smaller percentage of clay.
Areas with Insufficient Existing Geotechnical Data Isolated deposits of Holocene alluvium, undifferentiated (Qha) and Holocene alluvial fan (Qhf) in upland areas as well as narrow bands of Holocene deposits associated with active stream channels (ac, Qhty, Qhc, Qha, Qhf) are present within the Dublin Quadrangle. All of these deposits are likely to contain loose, granular materials that are saturated because of near-surface groundwater. Those conditions, along with the strong ground motions expected to occur in the region, combine to form a sufficient basis for designating areas underlain by these types of deposits Zones of Required Investigation for liquefaction.
ACKNOWLEDGMENTS
The author thanks Matt Katen and Tom Rooze at Zone 7 Water Agency, planning and building department staff of the cities of Pleasanton and Dublin. The author also appreciates the assistance and support of CGS staff, particularly Keith Knudsen, Teri Mcguire, Barbara Wanish, Candace Hill, Bob Moscovitz, Rick Wilson, Marvin Woods, Elise Mattison, Jackie Bott, and Tully Simoni.
REFERENCES
American Society for Testing and Materials, 2004, Standard test method for penetration test and split-barrel sampling of soils, Test Method D1586-99, in Annual Book of ASTM Standards, v. 4.08.
Bergmann, M.C., and Rockwell, T.K., 1989, The Dublin Creek Fault, a new branch of the Elsinore Fault, Rancho California area, Alameda County, California, in Abstracts with Programs, Geological Society of America, v. 21, n. 5, p. 57.
Boulanger, R.W., and Idriss, I.M.., 2006, Liquefaction susceptibility criteria for silts and clays: Journal of Geotechnical and Geoenvironmental Engineering v. 132, no.11, p. 1413-1426.
Budiman, J.S., and Mohammadi, Jamshid, 1995, Effect of large inclusions on liquefaction of sands, in Evans, M.D., and Fragaszy, R.J., editors, Static and Dynamic properties of Gravelly Soils: American Society of Civil Engineers Geotechnical Special Publication no. 56, p. 48-63.
California Department of Conservation, Division of Mines and Geology, 1997, Guidelines for evaluating and mitigating seismic hazards in California: California Division of Mines and Geology Special Publication 117, 74 p.

SHZR 112 SEISMIC HAZARD ZONATION OF THE DUBLIN QUADRANGLE 19
California Department of Conservation, Division of Mines and Geology, 2004, Recommended criteria for delineating seismic hazard zones in California: California Division of Mines and Geology Special Publication 118, 12 p.
California Department of Water Resources, 2003, California’s Groundwater, Bulletin 118, Update 2003, http://www.groundwater.water.ca.gov/bulletin118/update2003/index.cfm (January, 2007).
California Department of Water Resources, 2007, Groundwater Level Data, Water Data Library, http://wdl.water.ca.gov/gw/ .
Cao, T., Bryant, W.A., Rowshandel, B., Branum, D., and Wills, C.J., 2003, The Revised 2002 California Probabilistic Seismic Hazard Maps; California Geological Survey, Online Report, 12 p. http://www.consrv.ca.gov/cgs/rghm/psha/fault_parameters/pdf/2002_CA_Hazard_Maps.pdf
Giessner, R.W., Winters, B.A., and McLean, J.S., 1971, Water wells and springs in the western part of the upper Santa Margarita River watershed, Alameda and San Diego Counties, California: California Department of Water Resources, Bulletin No. 91-20, 377 p.
Evans, M.D., and Zhou, Shengping, 1995, Liquefaction behaviour of sand-gravel composites: American Society of Civil Engineers, Journal of Geotechnical Engineering, v. 121, no. 3, p. 287-298.
FEMA, 1994, NEHRP Recommended Provisions for Seismic Regulations for New Buildings and Other Structures: Washington, D.C., FEMA 222A.
Figures, S., and Ehman, K.D., 2004, Preliminary Stratigraphic Evaluation West Side of the Main Basin Livermore-Amador Groundwater Basin; prepared by Norfleet Consultants and Skyline Ridge, Inc. for Alameda County Flood Control and Water Conservation District Zone 7 Water Agency
Frankel, A.D., Petersen, M.D., Mueller, C.S., Haller, K.M., Wheeler, R.L., Leyendecker, E.V., Wesson, R.L., Harmsen, S.C., Cramer, C.H., Perkins, D.M., and Rukstales, K.S., 2002, Documentation for the 2002 update of the National Seismic Hazard Maps: U.S. Geological Survey Open-File Report 02-420, 33 pp.
Harder, L.F., and Seed, H.B., 1986, Determination of penetration resistance for coarse-grained soils using the Becker hammer drill: University of California at Berkeley, College of Engineering, Earthquake Engineering Research Center, report no. UCB/EERC-86/06, 126 p.
Hart, E.W., 1980 Calaveras and Verona faults, Dublin Quadrangle, California: California Division of Mines and Geology Fault Evaluation Report FER-108, with Supplement No. 1 in Bryant, W.A., and Wong, P., 2003 Fault Evaluation Reports Prepared Under the Alquist-Priolo Earthquake Fault Zoning Act, Region 1, Central California; CGS CD 2002-01.

CALIFORNIA GEOLOGICAL SURVEY 2008 20
Hart, E.W., 1981, Pleasanton and related faults, Dublin Quadrangle vicinity, California: California Division of Mines and Geology Fault Evaluation Report FER-109, with Supplement No. 1 in Bryant, W.A., and Wong, P., 2003 Fault Evaluation Reports Prepared Under the Alquist-Priolo Earthquake Fault Zoning Act, Region 1, Central California; CGS CD 2002-01.
Hart, E.W., and Bryant, W.A., 1997, Fault rupture hazard zones in California: California Division of Mines and Geology, Special Publication 42, 38 p.
Ishihara, Kenji, 1985, Stability of natural deposits during earthquakes, in Proceedings of the Eleventh International Conference on Soil Mechanics and Foundation Engineering, San Francisco, v. 1, p. 321-376.
Jones & Stokes, 2006, Annual report for the groundwater management plan, 2005 Water Year; prepared for the Alameda County Flood Control and Water Conservation District Zone 7 Water Agency, 52 p.
Kennedy, M.P., and Morton, D.M., 2003, Preliminary Geologic Map of the Dublin 7.5' Quadrangle, Alameda County, California: On line version: http://geopubs.wr.usgs.gov/open-file/of03-189
Kennedy, M.P., 1977, Recency and Character of faulting along the Elsinore Fault Zone in southern Alameda County, California: California Division of Mines, Special Report 131, 12 p., map scale 1:24,000.
Kupferman, S.A., 1992, Alameda County, CA: Stout, M.L., editor, Proceedings from the 35th Annual Meeting of the Association of Engineering Geologists, pp. 170-174.
Kupferman, S.A., 1995, Regulating land use and development in areas subject to subsidence and ground fissures, an update, Alameda County, California: Association of Engineering Geologists 38th Annual Meeting, Abstracts with Programs, p. 65.
Kupferman, S.A., 1998, Regulating land use and development in areas subject to subsidence and ground fissures, an update, Alameda County, California: Borchers, J.W., editor, Land Subsidence, case studies and current research, Association of Engineering Geologists, Special Publication No. 8, pp. 541-548.
Mann, J.F., 1955, Geology of a portion of the Elsinore Fault Zone, California: California Division of Mines, Special Report 43, 22 p., map scale 1:48,000.
Morton, D.M., 2004, Preliminary Digital Geologic Map of the Santa Ana 30’ X 60’ Quadrangle, southern California, version 2.0: U.S. Geological Survey Open-File Report 99-172. http://pubs.usgs.gov/of/1999/of99-172/
National Research Council, 1985, Liquefaction of soils during earthquakes: National Research Council Special Publication, Committee on Earthquake Engineering, National Academy Press, Washington, D.C., 240 p.
SHZR 112 SEISMIC HAZARD ZONATION OF THE DUBLIN QUADRANGLE 21
Figures, S., and Ehman, K.D., 2004, Preliminary Stratigraphic Evaluation West Side of the Main Basin Livermore-Amador Groundwater Basin; prepared by Norfleet Consultants and Skyline Ridge, Inc. for Alameda County Flood Control and Water Conservation District Zone 7 Water Agency.
Real, C.R., Petersen, M.D., McCrink, T.P., and Cramer, C.H., 2000, Seismic Hazard Deaggregation in zoning earthquake-induced ground failures in southern California: Proceedings of the Sixth International Conference on Seismic Zonation, November 12-15, Palm Springs, California, EERI, Oakland, CA.
Shlemon, R.J, and Davis, P., 1992, Ground fissures in the Temecula area, Alameda County, California: Pipkin, B.W., and Proctor, R.J., editors, Engineering Geology Practice in Southern California, AEG Special Publication 4, pp.275-288.
Shlemon, R.J., and Hakakian, M., 1992, Fissures produced both by groundwater rise and groundwater fall: a geological paradox in the Temecula-Dublin area, southwestern Alameda County, California: Stout, M.L., editor, Proceedings from the 35th Annual Meeting of the Association of Engineering Geologists, pp. 143-150.
Seed, H.B., and Idriss, I.M., 1971, Simplified procedure for evaluating soil liquefaction potential: Journal of the Soil Mechanics and Foundations Division of ASCE, v. 97: SM9, p. 1,249-1,273.
Seed, H.B., and Idriss, I.M., 1982, Ground motions and soil liquefaction during earthquakes: Monograph Series, Earthquake Engineering Research Institute, Berkeley, California, 134 p.
Seed, H.B., Idriss, I.M., and Arango, Ignacio, 1983, Evaluation of liquefaction potential using field performance data: Journal of Geotechnical Engineering, v. 109, no. 3, p. 458-482.
Seed, H.B., Tokimatsu, Kohji, Harder, L.F., and Chung, R.M., 1985, Influence of SPT procedures in soil liquefaction resistance evaluations: Journal of Geotechnical Engineering, ASCE, v. 111, no. 12, p. 1,425-1,445.
Seed, R.B., and Harder, L.F., 1990, SPT-based analysis of cyclic pore pressure generation and undrained residual strength: Proceedings of the H. Bolton Seed Memorial Symposium, v. 2, p. 351-376.
Smith, T.C., 1996, Preliminary maps of seismic hazard zones and draft guidelines for evaluating and mitigating seismic hazards: California Geology, v. 49, no. 6, p. 147-150.
Southern California Earthquake Center, 2002, Recommended procedures for implementation of DMG Special Publication 117 guidelines for analyzing and mitigating landslide hazards in California: T.F. Blake, R.A. Hollingsworth, and J.P. Stewart, editors, Southern California Earthquake Center, University of Southern California, 108 p.
CALIFORNIA GEOLOGICAL SURVEY 2008 22
Sy, Alex, Campanella, R.G., and Stewart, R.A., 1995, BPT-SPT correlations for evaluations of liquefaction resistance in gravelly soils, in Evans, M.D., and Fragaszy, R.J., editors, Static and Dynamic Properties of Gravelly Soils: American Society of Civil Engineers Geotechnical Special Publication no. 56, p. 1-19.
Tinsley, J.C., Youd, T.L., Perkins, D.M., and Chen, A.T.F., 1985, Evaluating liquefaction potential, in Ziony, J.I., editor, Evaluating earthquake hazards in the Los Angeles region — An earth science perspective: U.S. Geological Survey Professional Paper 1360, p. 263-316.
Waring, G.A., 1919, Groundwater in the San Jacinto and Temecula Basins, California: U.S. Geological Survey Water-Supply Paper 429, 113 pp.
Wills, Christopher J., 1988, Ground Cracks in Wolf and Temecula Valleys, Alameda County: California Department of Conservation, Division of Mines and Geology, Fault Evaluation Report FER-195, 12 p.
Witter, R.C., Knudsen, K.L, Sowers, J.M., Wentworth, C.M., Koehler, R.D., Randolph, C.E., Brooks, S.K., and Gans, K.D., 2006, Maps of Quaternary deposits and liquefaction susceptibility in the central San Francisco Bay region, California: U.S. Geological Survey Open-File Report 2006-1037 --- available on the World Wide Web at URL http://pubs.usgs.gov/of/2006/1037/
Wong, P., Bryant, W.A., and Treiman, J.A., 2003, Fault Investigation Reports for development sites within Alquist-Priolo Earthquake Fault Zones, in Southern California, 1974-2000: California Geological Survey CD 2003-02, pdf files of 2161 AP site reports.
Youd, T.L., 1973, Liquefaction, flow and associated ground failure: U.S. Geological Survey Circular 688, 12 p.
Youd, T.L., 1991, Mapping of earthquake-induced liquefaction for seismic zonation: Earthquake Engineering Research Institute, Proceedings, Fourth International Conference on Seismic Zonation, v. 1, p. 111-138.
Youd, T.L., and Idriss, I.M., 1997, editors, Proceedings of the NCEER workshop on evaluation of liquefaction resistance of soils: National Center for Earthquake Engineering Research Technical Report NCEER-97-0022, 276 p.
Youd, T.L., Idriss, I.M., Andrus, R.D., Arango, I., Castro, G., Christian, J.T., Dobry, R., Finn, W.D.L., Harder, L.F. Jr., Hynes, M.E., Ishihara, K., Koester, J.P., Liao, S.S.C., Marcusson, W.F., Martin, G.R., Mitchell, J.K., Moriwaki, Y., Power, M.S., Robertson, P.K., Seed, R.B., and Stokoe, K.H., 2001, Liquefaction resistance of soils; Summary report from the 1996 NCEER and 1998 NCEER/NSF workshops on evaluation of liquefaction resistance of soils: Journal of Geotechnical and Geoenvironmental Engineering, October 2001, p. 817-833.
Youd, T.L., and Perkins, D.M., 1978, Mapping liquefaction-induced ground failure potential: Journal of Geotechnical Engineering, v. 104, p. 433-446.

SHZR 112 SEISMIC HAZARD ZONATION OF THE DUBLIN QUADRANGLE 23
SECTION 2: EVALUATION REPORT FOR EARTHQUAKE-INDUCED LANDSLIDE HAZARD
in the
DUBLIN 7.5-MINUTE QUADRANGLE, ALAMEDA COUNTY, CALIFORNIA
By
Mark O. Wiegers and Florante G. Perez Department of Conservation California Geological Survey
INTRODUCTION
Purpose The Seismic Hazards Mapping Act (the Act) of 1990 (Public Resources Code, Chapter 7.8, Division 2) directs the California Department of Conservation (DOC), Division of Mines and Geology (DMG) [now called California Geological Survey (CGS)] to delineate Seismic Hazard Zones. The purpose of the Act is to reduce the threat to public health and safety and to minimize the loss of life and property by identifying and mitigating seismic hazards. Cities, counties, and state agencies are directed to use seismic hazard zone maps prepared by CGS in their land-use planning and permitting processes. The Act requires that site-specific geotechnical investigations be performed prior to permitting most urban development projects within the hazard zones. Evaluation and mitigation of seismic hazards are to be conducted under guidelines established by the California State Mining and Geology Board (DOCa, 1997). The text of this report is on the Internet at http://www.conservation.ca.gov/cgs/shzp/webdocs/sp117.pdf
Following the release of DMG Special Publication 117 (DOC, 1997b), agencies in the Los Angeles metropolitan region sought more definitive guidance in the review of geotechnical investigations addressing landslide hazards. The agencies made their request through the Geotechnical Engineering Group of the Los Angeles Section of the American Society of Civil Engineers (ASCE). This group convened an implementation committee in 1998 under the auspices of the Southern California Earthquake Center (SCEC). The committee, which consisted of practicing geotechnical engineers and engineering geologists, released an overview of the practice of landslide analysis, evaluation, and mitigation techniques (SCEC, 2002). This text is also on the Internet at: http://www.scec.org/
CALIFORNIA GEOLOGICAL SURVEY 2008 24
This section of the evaluation report summarizes seismic hazard zone mapping for earthquake-induced landslides in the Dublin 7.5-minute Quadrangle. Section 1 (addressing liquefaction hazard) and Section 3 (addressing earthquake shaking hazard) complete the report, which is one of a series that summarizes the preparation of seismic hazard zone maps within the state (Smith, 1996). Additional information on seismic hazard zone mapping in California can be accessed on the CGS Internet page: http://www.conservation.ca.gov/cgs/shzp/.
Background Landslides triggered by earthquakes historically have been a significant cause of earthquake damage. In California, large earthquakes such as the 1971 San Fernando, 1989 Loma Prieta, and 1994 Northridge earthquakes triggered landslides that were responsible for destroying or damaging numerous structures, blocking major transportation corridors, and damaging lifeline infrastructure. Areas that are most susceptible to earthquake-induced landslides are steep slopes in poorly cemented or highly fractured rocks, sloped areas underlain by loose, weak soils, and areas on or adjacent to existing landslide deposits. These geologic and terrain conditions exist in many parts of California, including numerous hillside areas that have already been developed or are likely to be developed in the future. The opportunity for strong earthquake ground shaking is high in many parts of California because of the presence of numerous active faults. The combination of these factors constitutes a significant seismic hazard throughout much of California, including the mountainous and hilly areas within the Dublin Quadrangle.
Methodology
The mapping of earthquake-induced landslide hazard zones presented in this report is based on the best available terrain, geologic, geotechnical, and seismological data. If unavailable or significantly outdated, new forms of these data were compiled or generated specifically for this project. The following were collected or generated for this evaluation:
• Digital terrain data were collected or generated to provide an up-to-date representation of slope gradient and slope aspect in the study area.
• Geologic mapping was compiled to provide an accurate representation of the spatial distribution of geologic materials in the study area. In addition, a map of existing landslides, whether or not triggered by earthquakes, was prepared.
• Geotechnical laboratory test data were collected and statistically analyzed to quantitatively characterize the strength properties and dynamic slope stability of geologic materials in the study area.
• Seismological data in the form of CGS probabilistic shaking maps and catalogs of strong-motion records were compiled and used to characterize future earthquake shaking within the mapped area.
The data collected for this evaluation were processed into a series of GIS layers using commercially available software. A slope stability analysis was performed using the Newmark method (Newmark, 1965), in order to generate a map showing landslide hazard potential. The earthquake-induced landslide hazard zone was derived from the landslide hazard potential map
SHZR 112 SEISMIC HAZARD ZONATION OF THE DUBLIN QUADRANGLE 25
according to criteria developed in a CGS pilot study (McCrink and Real, 1996; McCrink, 2001) and subsequently adopted by the State Mining and Geology Board (DOC, 2000).
Scope and Limitations The methodology used to make this map is based on earthquake ground-shaking estimates, geologic material-strength characteristics and slope gradient. These data are gathered from a variety of outside sources. Although the selection of data used in this evaluation was rigorous, the quality of the data is variable. The State of California and the Department of Conservation make no representations or warranties regarding the accuracy of the data gathered from outside sources.
Earthquake-induced landslide zone maps are intended to prompt more detailed, site-specific geotechnical investigations as required by the Act. As such, these zone maps identify areas where the potential for earthquake-induced landslides is relatively high. Due to limitations in methodology, it should be noted that these zone maps do not necessarily capture all potential earthquake-induced landslide hazards. Earthquake-induced ground failures that are not addressed by this map include those associated with ridge-top spreading and shattered ridges. It should also be noted that no attempt has been made to map potential run-out areas of triggered landslides. Such run-out areas may extend beyond the zone boundaries. The potential for ground failure resulting from liquefaction-induced lateral spreading of alluvial materials, considered by some to be a form of landsliding, is not specifically addressed by the earthquake-induced landslide zone or this report.
This section of the report is presented in two parts. Part I addresses the natural setting of the area covered by the Dublin Quadrangle, namely the physiographic, geologic and engineering geology conditions. Part II covers the preparation of landslide hazard potential and landslide zone maps.
PART I: GEOGRAPHIC AND GEOLOGIC SETTING
PHYSIOGRAPHY
Location The Dublin 7.5-Minute Quadrangle map covers approximately 60 square miles in Alameda and Contra Costa Counties in the eastern part of the San Francisco Bay area. The central and southern portions of the quadrangle, about 80 percent of the map area, lie in Alameda County. This area includes the City of Dublin, parts of the City of Pleasanton, a sparsely developed part of the City of Hayward, and large areas of unincorporated county land.
The northern edge of the quadrangle, about 20 percent of the map area, lies in Contra Costa County. This area includes part of the City of San Ramon and adjoining areas of unincorporated county land. The Seismic Hazard Zone map and this report address earthquake-induced landslide zones only for those parts of the Dublin Quadrangle that lie within Alameda County. Seismic Hazard Zone maps will be prepared in Contra Costa County in the future. At that time, this report will be updated to include those parts of the Dublin Quadrangle that lie within Contra Costa County.

CALIFORNIA GEOLOGICAL SURVEY 2008 26
Land Use Most of the development in the map area is on the floor of the Livermore, Amador, and San Ramon Valleys, in and around the towns of Pleasanton, Dublin and San Ramon. A significant amount of hillside development has also occurred on slopes on the west side of Amador Valley. Some of this hillside development is on ancient deep-seated landslide deposits, as discussed later in this report. West of Pleasanton Ridge, most of the steep hillsides are sparsely developed.
Topography The western and southern parts of the map area are occupied by steep northwest trending ridges at the south end of the Oakland-Berkeley Hills. The eastern and northern parts of the map area are occupied by the Amador and San Ramon Valleys, which are western arms of the Livermore Valley. The northeastern part of the map area is occupied by the Dougherty Hills.
Prominent ridges in the map area include Walpert Ridge, Sunol Ridge and Pleasanton Ridge in the south and southwest parts of the quadrangle. These ridges are cut by deeply incised stream canyons. The most prominent canyon is Dublin Canyon, which cuts eastward through the hills and flows into the Amador Valley at Dublin. Dublin Canyon forms a natural topographic pass through the hills. Both Highway 580 and the Bay Area Rapid Transit System follow Dublin Canyon from the Amador Valley to the summit of the East Bay hills. Other prominent canyons are drained by Palomares Creek, Sinbad Creek and Stoneybrook Creek.
The highest point in the map area is on the crest of the Sunol Ridge, which reaches a maximum elevation of 2061 feet in the southwest corner of the quadrangle. The lowest point in the map area is along Arroyo de la Laguna, which extends south from the Amador Valley and reaches a minimum elevation of about 300 feet in the southeast corner of the map area.
Digital Topography The calculation of slope gradient is an essential part of the evaluation of slope stability under earthquake conditions. An accurate slope gradient calculation begins with an up-to-date map representation of the earth’s surface in the form of a digital topographic map. Within the Dublin Quadrangle, a Digital Terrain Model (DTM) was obtained from Intermap’s Interferometric Synthetic Aperture Radar (IFSAR) system. This DTM was derived from the original radar data, the Digital Surface Model (DSM), where vegetation, buildings, and other cultural features were digitally removed using Intermap’s proprietary software called TerrainFit (Intermap, 2003). This terrain data, which was acquired in 2003, presents elevations at five-meter postings with two meters RSME horizontal positional accuracy and one-meter vertical positional accuracy (Intermap, 2003). Furthermore, the DTM was resampled using bilinear method to minimize the presence of false geometric artifacts in the radar data. A slope gradient map was generated from the DTM using a third-order finite difference, center-weighted algorithm (Horn, 1981). The DTM was also used to make a slope aspect map. The manner in which the slope and aspect maps were used to prepare the zone map will be described in subsequent sections of this report.

SHZR 112 SEISMIC HAZARD ZONATION OF THE DUBLIN QUADRANGLE 27
GEOLOGY
The primary source of bedrock geologic information used in this slope stability evaluation was Graymer and others (1996), which was compiled in digital format at a scale of 1:24,000 from previously published reports and from new mapping and field checking. Geologic mapping by Dibblee (1980) was also reviewed. Quaternary surficial geologic mapping was prepared by Witter and others (2006) at a scale of 1:24,000. Bedrock geology is discussed in detail in this section. Quaternary geologic units are briefly described here and are discussed in more detail in Section 1, Liquefaction Evaluation Report.
CGS geologists modified the digital geologic map in the following ways: first, we merged the surficial and bedrock geologic map units from the above maps. Contacts between surficial and bedrock units were then modified in some areas to resolve differences between the two maps. Geologic field reconnaissance was performed to assist in adjusting contacts and to review the lithology and structure of the various geologic units.
Bedrock Units Rocks of two main basement complexes juxtaposed by major regional faults are exposed in the East Bay hills and Diablo Range. These are the Franciscan Assemblage and the Coast Range Ophiolite. The basement complexes are unconformably overlain by Mesozoic and Cenozoic sedimentary and volcanic rocks.
Outcrop of basement rock in the Dublin quadrangle is limited to a single exposure belonging to the Coast Range Ophiolite. It consists of a small, fault-bounded body of serpentinite (sp) mapped along the Calaveras Fault near the town of Dublin. This small serpentine body may be a sliver of basement rock that was caught up and brought to the surface by movement on the Calaveras Fault.
The Coast Range Ophiolite is overlain by Upper Cretaceous rocks of the Great Valley Sequence. Several units of the Great Valley Sequence are widely exposed in the hills on the west side of the map area. Unnamed Cretaceous sedimentary rocks (KuII) consisting of graywacke, siltstone and mudstone are exposed along Sunol Ridge and Pleasanton Ridge in the south part of the map area. These unnamed rocks contain lenses of pebble to boulder conglomerate (Kc). A second sequence of unnamed Cretaceous rocks (KsVII) consisting of sandstone with siltstone and shale are exposed along a portion of Walpert Ridge in the southwestern part of the map area. The Oakland Conglomerate (Ko) consists of medium- to coarse-grained sandstone with prominent lenses of pebble to cobble conglomerate and underlies a small area in the southwestern part of the quadrangle. An unnamed unit of sandstone, conglomerate and shale that is widely exposed in the Castro Valley area (Kcv) also extends into the southwestern part of the map area.
The Cretaceous rocks are overlain by a sequence of Miocene marine sedimentary rocks and minor volcanic rocks that are exposed in the northwest part of the quadrangle. The Sobrante Sandstone (Ts) consists of white, fine- to medium-grained sandstone. The Claremont Shale (Tcs) consists of brown siliceous shale with minor interbedded chert. The Oursan Sandstone (To) consists of greenish-gray sandstone with carbonate concretions. The Rodeo Shale (Tr) consists of brown siliceous shale with carbonate concretions. An undivided map unit (Tro)
CALIFORNIA GEOLOGICAL SURVEY 2008 28
includes the Rodeo Shale, Hambre Sandstone, Tice Shale and Oursan Sandstone. The Briones Formation (Tbr) includes sandstone, siltstone, conglomerate and shell breccia. Some of the coarse-grained beds of the Briones Formation form prominent resistant ridges. The Briones Formation is divided into several members, including: 1) massive feldspathic sandstone (Tbi); 2) massive sandstone, pebble conglomerate and shell breccia (Tbg); 3) medium-grained sandstone with shell breccia beds (Tbe); and, 4) massive medium-grained sandstone with local conglomerate layers (Tbd). The Neroly Sandstone (Tn) consists of brown massive sandstone with abundant clasts of volcanic rocks. An unnamed unit of sedimentary and volcanic rocks (Tusv) includes conglomerate, sandstone and siltstone. This unit also contains thin limestone beds (Tul) that are mapped locally.
Quaternary Sedimentary Deposits The Plio-Pleistocene Livermore Gravels (QTl) are exposed around the margins of the Amador Valley on the west side of the Calaveras Fault. These deposits consist of poorly to moderately consolidated conglomerate, pebble- and cobble-bearing sand and coarse sand. Unconsolidated Quaternary deposits overlie the Livermore and other bedrock units on the East Bay Plain, in Sunol Valley, and in smaller alluvial areas and terraces in the hillside areas. Quaternary deposits in the map area are described in detail in Section 1.
Structure The project area is in a region of transpressive tectonics that includes both major strike slip faults of the San Andreas Fault system and contractional fold-and-thrust belts that deform rocks in between the strike slip faults. The Calaveras Fault, a major branch of the San Andreas Fault system, extends diagonally across the middle of the map area and forms the structural boundary between the East Bay hills and the Livermore and Amador Valleys. The Diablo fold-and-thrust belt lies east of the Calaveras Fault and includes the synformal Livermore basin (Unruh, 2000).
The Calaveras Fault is about 131 kilometers long and extends from north from Hollister through the Danville area. In the northern and central parts of the Dublin quadrangle, the fault is well expressed by linear depressions, sag ponds, deflected drainages and tonal lineaments (Hart, 1981). In the southern part of the quadrangle, the Calaveras Fault is largely covered by massive deep-seated landslide complexes. The Calaveras Fault exhibits virtually no recorded seismicity north of Calaveras Reservoir with the possible exception of a single large earthquake in 1861 where rupture reportedly occurred in the Dublin-San Ramon area (Toppozada, 1981). South of the Calaveras Reservoir, contemporary seismicity along the fault has generated several moderate historic earthquakes (Simpson and others, 1992). The fault is considered to be active, based on historic seismicity and well-defined geomorphic features. CGS has designated the Calaveras Fault as an Official Earthquake Fault Zone under authority of the Alquist-Priolo Act of 1972 (DOC, 1997b).
The Mt. Diablo fold-and-thrust belt is a broad northeast-trending zone of crustal shortening associated with the blind, west-vergent Diablo Thrust Fault. Deformation within the belt may be driven by a left-restraining transfer of dextral slip from the Greenville Fault to the Concord Fault (Sawyer, 1999; Unruh, 2000). Crustal shortening along the Mt. Diablo Thrust Fault is accommodated by fault propagation folds in the hanging, including the Mt. Diablo antiform and the Tassajara anticline. Contraction in the southern part of the belt has caused deformation in the
SHZR 112 SEISMIC HAZARD ZONATION OF THE DUBLIN QUADRANGLE 29
Livermore basin and resulted in uplift and deformation of the Livermore Gravels and younger alluvial deposits.
Deformation in the Oakland-Berkeley Hills west of the Calaveras Fault is characterized by folds and thrust faults in Cretaceous and Tertiary rocks. These contractional structures in the East Bay hills indicate that there is a significant component of compressive stress between the Calaveras Fault and the Hayward Fault, which is located several miles west of the map area. Folding of late Miocene to early Pliocene rocks indicates that deformation has occurred in late Miocene and younger time (Graymer, 2000). A prominent northwest-trending anticline and overturned syncline are exposed in resistant beds of Briones Sandstone in northwest part of the quadrangle.
ENGINEERING GEOLOGY
Landslide Inventory As a part of the geologic data compilation, an inventory of existing landslides in the Dublin quadrangle was prepared by field reconnaissance, analysis of stereo-paired aerial photographs and a review of previously published landslide mapping. Landslides were mapped at a scale of 1:24,000. For each landslide included on the map a number of characteristics (attributes) were compiled. These include recency of activity, thickness, associated geologic unit(s), and the confidence of interpretation (definite, probable and questionable). Landslides rated as definite and probable were incorporated into the landslide zoning as described later in this report. Landslides rated as questionable were not carried into the landslide zoning due to the uncertainty of their existence. The completed landslide map was scanned, digitized, and the attributes were compiled in a database. A small-scale version of the inventory map is shown on Plate 2.1.
The most significant landslides in the Dublin Quadrangle are on the northeast side of Pleasanton Ridge. This area contains a number of very large deep-seated landslide complexes that cover large portions of the slope below the crest of Pleasanton Ridge. These landslides are heavily modified by erosion, appearing to be very old. In many areas, these old landslides contain numerous smaller, more recent landslides.
Individual landslide masses are several thousand feet in diameter and form irregular terrain. Some of the landslide masses were found to be more than 100 feet deep (Terrasearch, 1990, 1996; Kleinfelder, 1998). Steep headwall areas from which the landslides originated typically extend above the landslides masses. Northeast of the Castlewood Country Club, there is a well-developed linear trough (sackungen) that extends for nearly a mile along the top of Pleasanton Ridge directly above several large landslide masses. This feature probably formed by ridgetop spreading associated with strong earthquake shaking.
One of the largest slides in the map area is the Castlewood Landslide, which underlies Castlewood Country Club. Several other large slides extend to the north and south. A considerable amount of development has occurred on these large landslide complexes. Detailed geotechnical studies indicate that the slides consist primarily of sheared and broken Great Valley Sequence rocks that slid over the Calaveras Fault and cover Tertiary rocks and Pleistocene gravels at the base of the slope (Rogers and Halliday, 1992). Some of the geotechnical borings encountered chlorite schist and glaucophane schist within the slide masses. These materials
CALIFORNIA GEOLOGICAL SURVEY 2008 30
probably originated along the Calaveras Fault and displaced down slope by landslides (Kleinfelder, 1998).
Clay gouge zones were encountered in geotechnical cores at the base of the landslide debris in a number of locations near the Castlewood Country Club. However, discrete slip planes were typically not observed within the gouge. A dynamic slope stability analysis performed at Castlewood Landslide indicates that the slide could undergo 12 to 16 inches of total displacement and 1 to 2 inches of differential displacement across a typical residential pad in a Design Basis Earthquake (approximately 475 year return period) (Kleinfelder, 1998). CGS used results from shear strength tests of the clay gouge recovered in the vicinity of Castlewood Country Club for the slope stability analysis performed for preparation of our landslide potential map, as discussed later in this report.
Some of the subsurface findings presented in consulting reports provide strong evidence that the deep slide complexes are very old. At Oak Tree Farm near Castlewood Country Club, a redwood log was encountered beneath deep landslide debris. The log was carbon dated and found to be at least 40,000 years old (Terrasearch, 1996). At the toe of some of the ancient landslides near Castlewood Country Club, the basal slip surface was found to be as much as 40 feet below the adjoining valley floor. This indicates that there was a long period of alluvial deposition after these slide masses formed. Some of the smaller slides within the ancient slide masses are much younger.
Compared to the Pleasanton Ridge area, there are generally fewer landslides in most other parts of the Dublin Quadrangle. One area that contains a number of relatively large landslides is in the hills west of San Ramon Valley. Landslides in this area occur primarily in fine-grained Miocene rocks such as map units Tus (unnamed sedimentary and volcanic rocks) and Tro (Rodeo, Hambre, Tice and Oursan Formations, undivided). These rocks appear to contain beds of incompetent, possibly expansive clay shale. There are some existing and planned subdivisions in these landslide prone areas. Much of the remaining hillside areas are underlain by relatively resistant rocks of the Great Valley Sequence. Landslides occur in these rocks in some of the steep canyons, mostly in sparsely developed areas.
Because it is not within the scope of the Act to review and monitor grading practices to ensure past slope failures have been properly mitigated, all documented slope failures, whether or not surface expression currently exists, are included in the landslide inventory.
Geologic Material Strength To evaluate the stability of geologic materials under earthquake conditions, the geologic map units described above were ranked and grouped based on their shear strength. Generally, the primary source for shear-strength measurements is geotechnical reports prepared by consultants on file with local government permitting departments. Shear-strength data for the units identified on the Dublin Quadrangle geologic map were obtained from the City of Dublin and Alameda County (see Appendix A). The locations of rock and soil samples taken for shear testing within the Dublin Quadrangle are shown on Plate 2.1. Shear tests from the adjoining quadrangles were used to augment data for several geologic formations for which little or no shear test information was available within the Dublin Quadrangle.
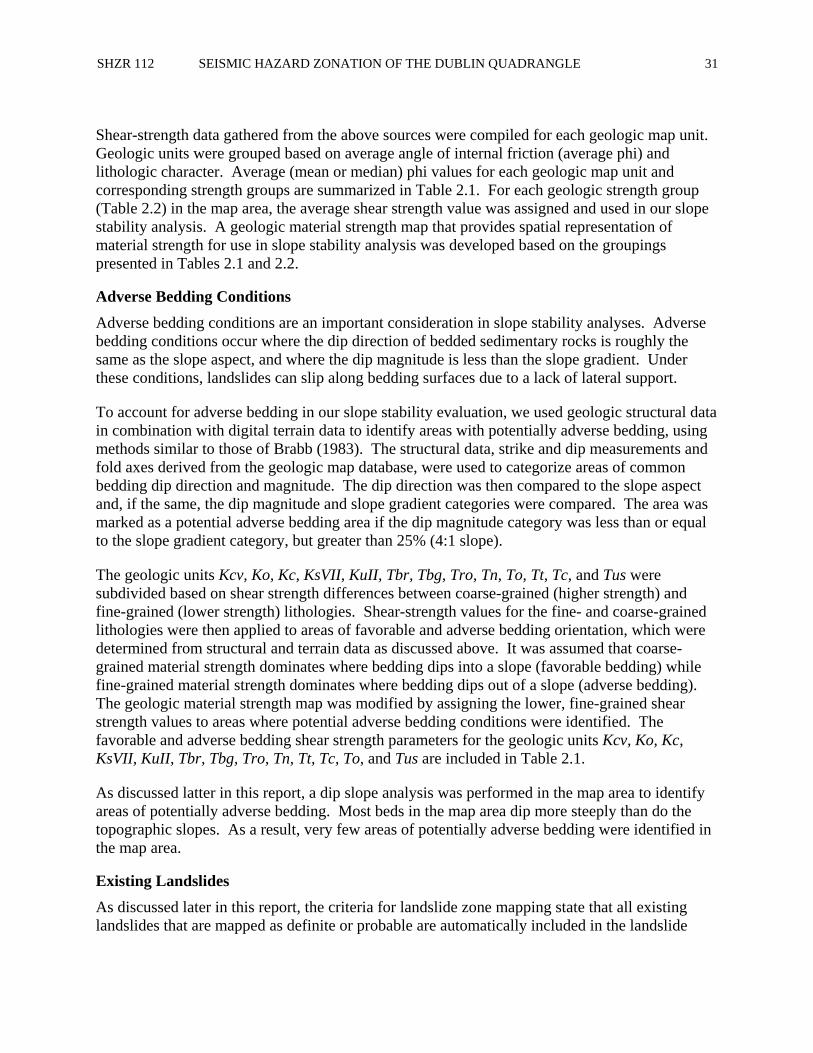
SHZR 112 SEISMIC HAZARD ZONATION OF THE DUBLIN QUADRANGLE 31
Shear-strength data gathered from the above sources were compiled for each geologic map unit. Geologic units were grouped based on average angle of internal friction (average phi) and lithologic character. Average (mean or median) phi values for each geologic map unit and corresponding strength groups are summarized in Table 2.1. For each geologic strength group (Table 2.2) in the map area, the average shear strength value was assigned and used in our slope stability analysis. A geologic material strength map that provides spatial representation of material strength for use in slope stability analysis was developed based on the groupings presented in Tables 2.1 and 2.2.
Adverse Bedding Conditions Adverse bedding conditions are an important consideration in slope stability analyses. Adverse bedding conditions occur where the dip direction of bedded sedimentary rocks is roughly the same as the slope aspect, and where the dip magnitude is less than the slope gradient. Under these conditions, landslides can slip along bedding surfaces due to a lack of lateral support.
To account for adverse bedding in our slope stability evaluation, we used geologic structural data in combination with digital terrain data to identify areas with potentially adverse bedding, using methods similar to those of Brabb (1983). The structural data, strike and dip measurements and fold axes derived from the geologic map database, were used to categorize areas of common bedding dip direction and magnitude. The dip direction was then compared to the slope aspect and, if the same, the dip magnitude and slope gradient categories were compared. The area was marked as a potential adverse bedding area if the dip magnitude category was less than or equal to the slope gradient category, but greater than 25% (4:1 slope).
The geologic units Kcv, Ko, Kc, KsVII, KuII, Tbr, Tbg, Tro, Tn, To, Tt, Tc, and Tus were subdivided based on shear strength differences between coarse-grained (higher strength) and fine-grained (lower strength) lithologies. Shear-strength values for the fine- and coarse-grained lithologies were then applied to areas of favorable and adverse bedding orientation, which were determined from structural and terrain data as discussed above. It was assumed that coarse-grained material strength dominates where bedding dips into a slope (favorable bedding) while fine-grained material strength dominates where bedding dips out of a slope (adverse bedding). The geologic material strength map was modified by assigning the lower, fine-grained shear strength values to areas where potential adverse bedding conditions were identified. The favorable and adverse bedding shear strength parameters for the geologic units Kcv, Ko, Kc, KsVII, KuII, Tbr, Tbg, Tro, Tn, Tt, Tc, To, and Tus are included in Table 2.1.
As discussed latter in this report, a dip slope analysis was performed in the map area to identify areas of potentially adverse bedding. Most beds in the map area dip more steeply than do the topographic slopes. As a result, very few areas of potentially adverse bedding were identified in the map area.
Existing Landslides As discussed later in this report, the criteria for landslide zone mapping state that all existing landslides that are mapped as definite or probable are automatically included in the landslide
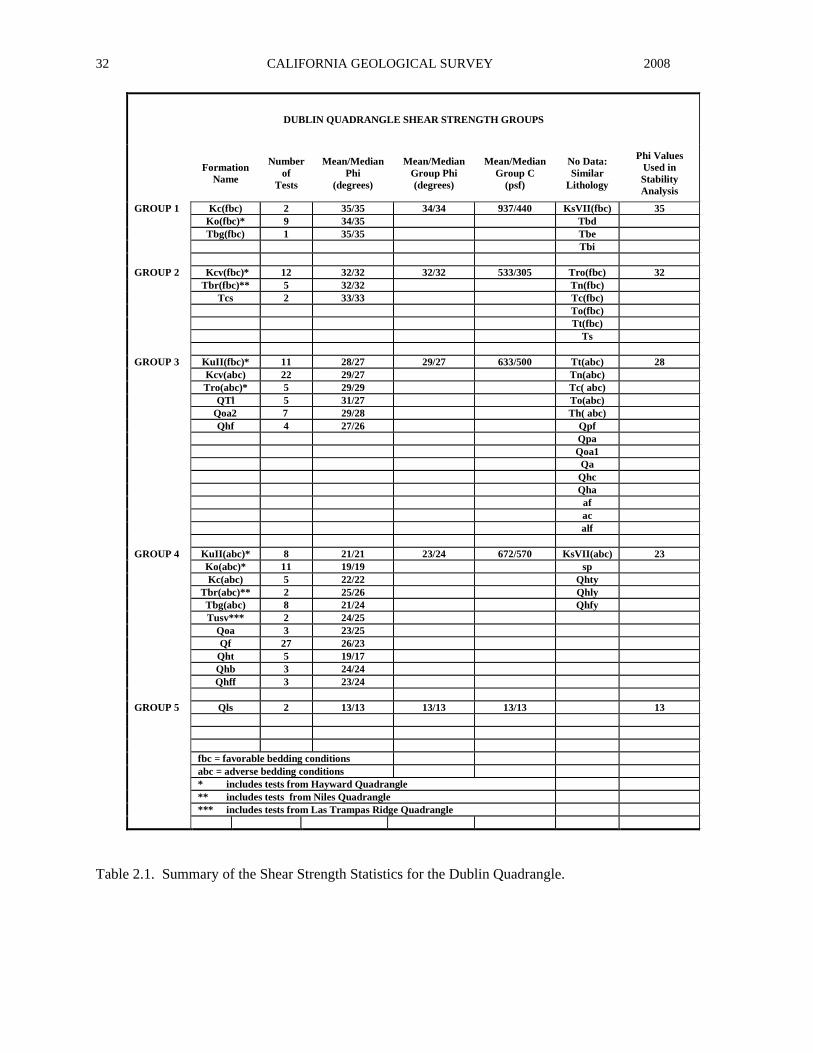
CALIFORNIA GEOLOGICAL SURVEY 2008 32
DUBLIN QUADRANGLE SHEAR STRENGTH GROUPS
Formation
Name
Number of
Tests
Mean/Median Phi
(degrees)
Mean/Median Group Phi (degrees)
Mean/Median Group C
(psf)
No Data: Similar
Lithology
Phi Values Used in Stability Analysis
GROUP 1 Kc(fbc) 2 35/35 34/34 937/440 KsVII(fbc) 35 Ko(fbc)* 9 34/35 Tbd Tbg(fbc) 1 35/35 Tbe Tbi GROUP 2 Kcv(fbc)* 12 32/32 32/32 533/305 Tro(fbc) 32 Tbr(fbc)** 5 32/32 Tn(fbc) Tcs 2 33/33 Tc(fbc) To(fbc) Tt(fbc) Ts GROUP 3 KuII(fbc)* 11 28/27 29/27 633/500 Tt(abc) 28 Kcv(abc) 22 29/27 Tn(abc) Tro(abc)* 5 29/29 Tc( abc) QTl 5 31/27 To(abc) Qoa2 7 29/28 Th( abc) Qhf 4 27/26 Qpf Qpa Qoa1 Qa Qhc Qha af ac alf GROUP 4 KuII(abc)* 8 21/21 23/24 672/570 KsVII(abc) 23 Ko(abc)* 11 19/19 sp Kc(abc) 5 22/22 Qhty Tbr(abc)** 2 25/26 Qhly Tbg(abc) 8 21/24 Qhfy Tusv*** 2 24/25 Qoa 3 23/25 Qf 27 26/23 Qht 5 19/17 Qhb 3 24/24 Qhff 3 23/24 GROUP 5 Qls 2 13/13 13/13 13/13 13 fbc = favorable bedding conditions abc = adverse bedding conditions * includes tests from Hayward Quadrangle ** includes tests from Niles Quadrangle *** includes tests from Las Trampas Ridge Quadrangle
Table 2.1. Summary of the Shear Strength Statistics for the Dublin Quadrangle.
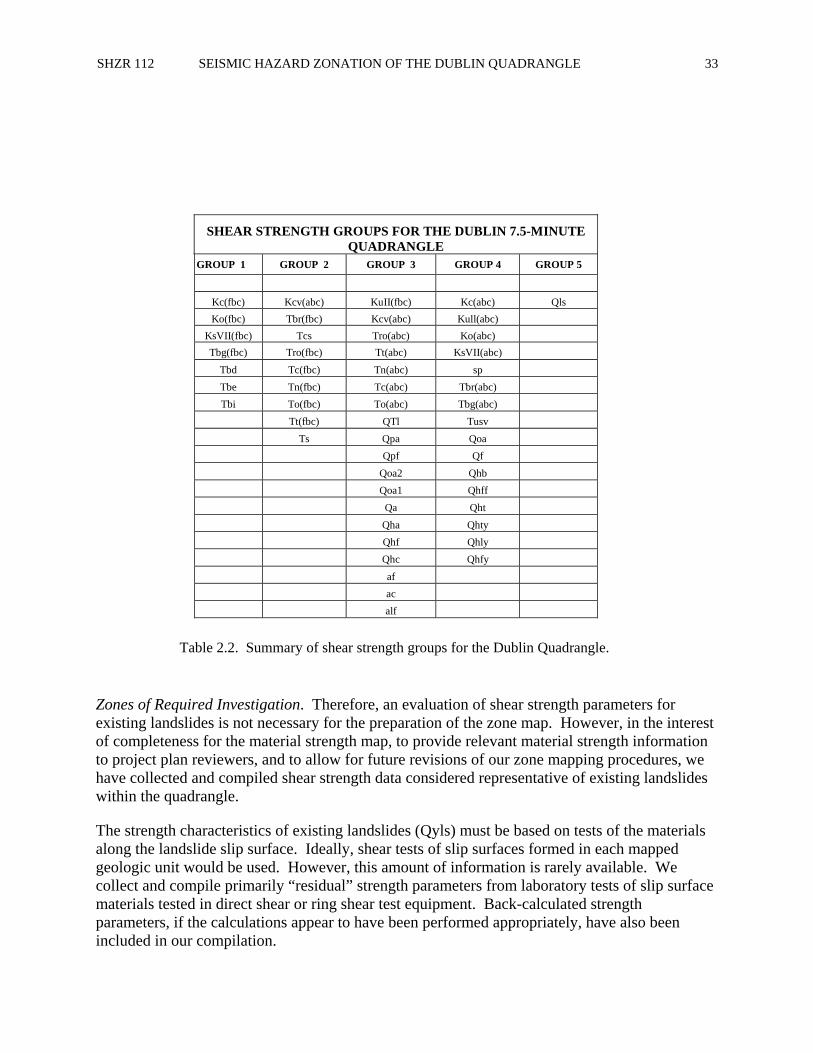
SHZR 112 SEISMIC HAZARD ZONATION OF THE DUBLIN QUADRANGLE 33
Table 2.2. Summary of shear strength groups for the Dublin Quadrangle.
Zones of Required Investigation. Therefore, an evaluation of shear strength parameters for existing landslides is not necessary for the preparation of the zone map. However, in the interest of completeness for the material strength map, to provide relevant material strength information to project plan reviewers, and to allow for future revisions of our zone mapping procedures, we have collected and compiled shear strength data considered representative of existing landslides within the quadrangle.
The strength characteristics of existing landslides (Qyls) must be based on tests of the materials along the landslide slip surface. Ideally, shear tests of slip surfaces formed in each mapped geologic unit would be used. However, this amount of information is rarely available. We collect and compile primarily “residual” strength parameters from laboratory tests of slip surface materials tested in direct shear or ring shear test equipment. Back-calculated strength parameters, if the calculations appear to have been performed appropriately, have also been included in our compilation.
SHEAR STRENGTH GROUPS FOR THE DUBLIN 7.5-MINUTE QUADRANGLE
GROUP 1 GROUP 2 GROUP 3 GROUP 4 GROUP 5
Kc(fbc) Kcv(abc) KuII(fbc) Kc(abc) Qls Ko(fbc) Tbr(fbc) Kcv(abc) Kull(abc)
KsVII(fbc) Tcs Tro(abc) Ko(abc) Tbg(fbc) Tro(fbc) Tt(abc) KsVII(abc)
Tbd Tc(fbc) Tn(abc) sp Tbe Tn(fbc) Tc(abc) Tbr(abc) Tbi To(fbc) To(abc) Tbg(abc)
Tt(fbc) QTl Tusv Ts Qpa Qoa Qpf Qf Qoa2 Qhb Qoa1 Qhff Qa Qht Qha Qhty Qhf Qhly Qhc Qhfy af ac alf
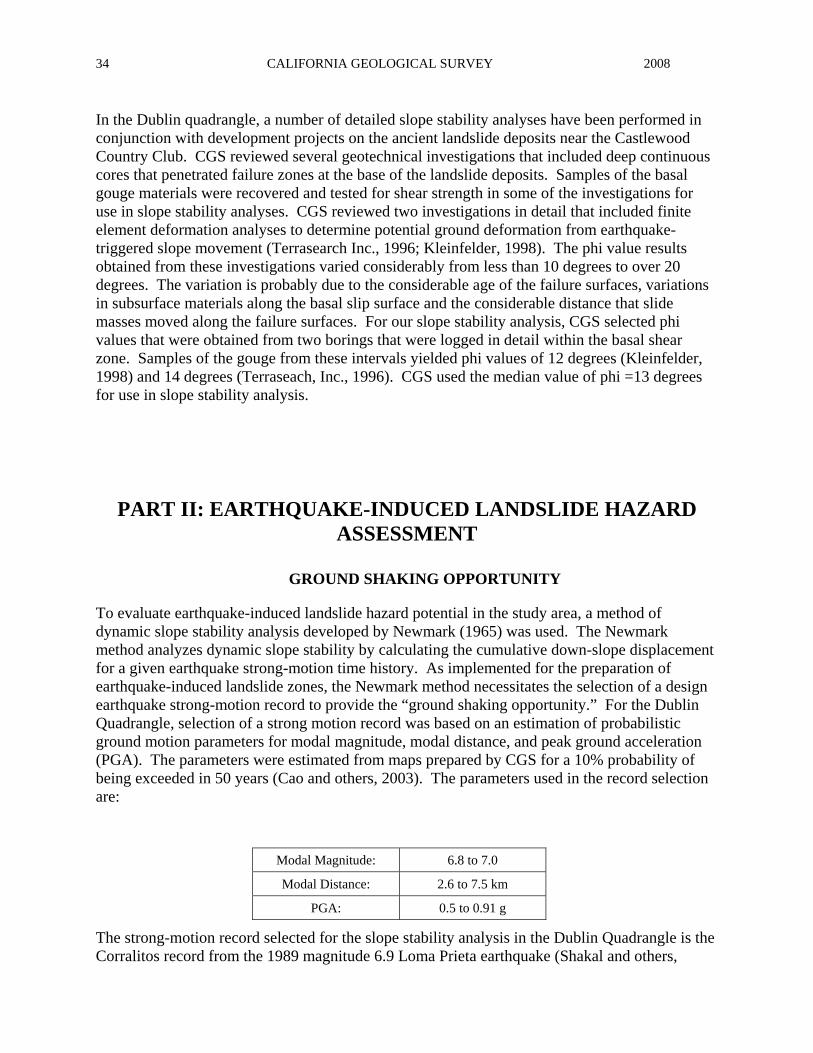
CALIFORNIA GEOLOGICAL SURVEY 2008 34
In the Dublin quadrangle, a number of detailed slope stability analyses have been performed in conjunction with development projects on the ancient landslide deposits near the Castlewood Country Club. CGS reviewed several geotechnical investigations that included deep continuous cores that penetrated failure zones at the base of the landslide deposits. Samples of the basal gouge materials were recovered and tested for shear strength in some of the investigations for use in slope stability analyses. CGS reviewed two investigations in detail that included finite element deformation analyses to determine potential ground deformation from earthquake-triggered slope movement (Terrasearch Inc., 1996; Kleinfelder, 1998). The phi value results obtained from these investigations varied considerably from less than 10 degrees to over 20 degrees. The variation is probably due to the considerable age of the failure surfaces, variations in subsurface materials along the basal slip surface and the considerable distance that slide masses moved along the failure surfaces. For our slope stability analysis, CGS selected phi values that were obtained from two borings that were logged in detail within the basal shear zone. Samples of the gouge from these intervals yielded phi values of 12 degrees (Kleinfelder, 1998) and 14 degrees (Terraseach, Inc., 1996). CGS used the median value of phi =13 degrees for use in slope stability analysis.
PART II: EARTHQUAKE-INDUCED LANDSLIDE HAZARD ASSESSMENT
GROUND SHAKING OPPORTUNITY
To evaluate earthquake-induced landslide hazard potential in the study area, a method of dynamic slope stability analysis developed by Newmark (1965) was used. The Newmark method analyzes dynamic slope stability by calculating the cumulative down-slope displacement for a given earthquake strong-motion time history. As implemented for the preparation of earthquake-induced landslide zones, the Newmark method necessitates the selection of a design earthquake strong-motion record to provide the “ground shaking opportunity.” For the Dublin Quadrangle, selection of a strong motion record was based on an estimation of probabilistic ground motion parameters for modal magnitude, modal distance, and peak ground acceleration (PGA). The parameters were estimated from maps prepared by CGS for a 10% probability of being exceeded in 50 years (Cao and others, 2003). The parameters used in the record selection are:
Modal Magnitude: 6.8 to 7.0
Modal Distance: 2.6 to 7.5 km
PGA: 0.5 to 0.91 g
The strong-motion record selected for the slope stability analysis in the Dublin Quadrangle is the Corralitos record from the 1989 magnitude 6.9 Loma Prieta earthquake (Shakal and others,
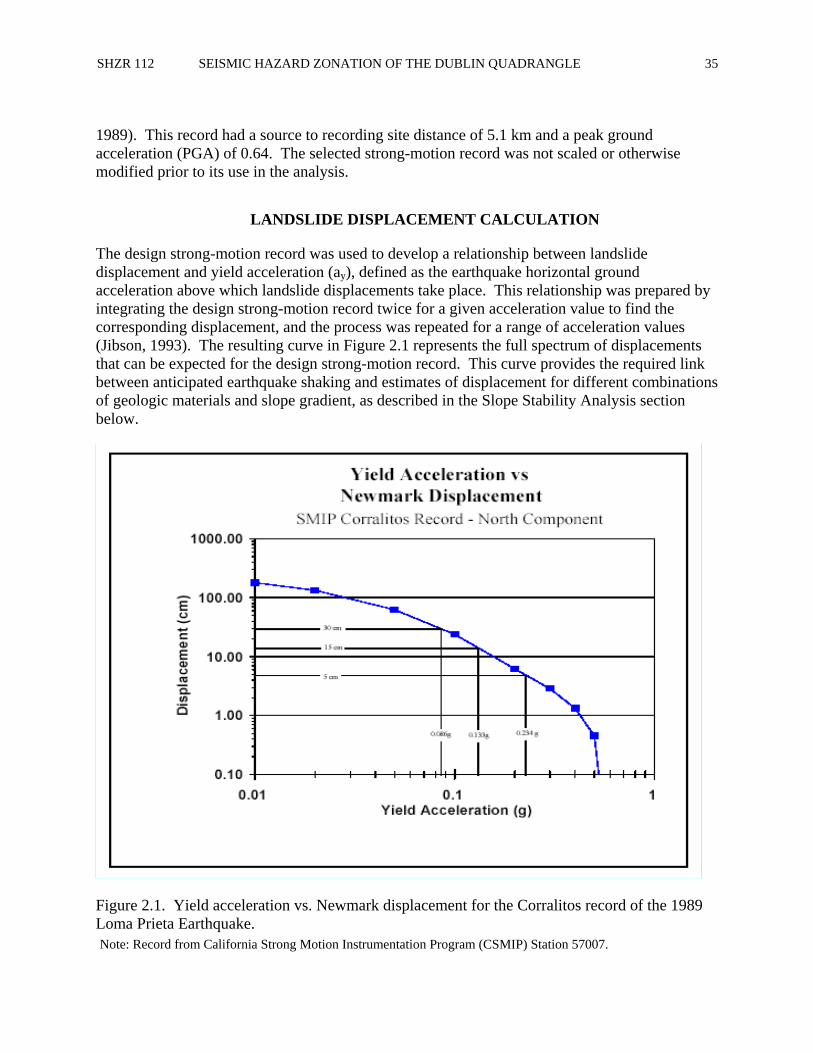
SHZR 112 SEISMIC HAZARD ZONATION OF THE DUBLIN QUADRANGLE 35
1989). This record had a source to recording site distance of 5.1 km and a peak ground acceleration (PGA) of 0.64. The selected strong-motion record was not scaled or otherwise modified prior to its use in the analysis.
LANDSLIDE DISPLACEMENT CALCULATION
The design strong-motion record was used to develop a relationship between landslide displacement and yield acceleration (ay), defined as the earthquake horizontal ground acceleration above which landslide displacements take place. This relationship was prepared by integrating the design strong-motion record twice for a given acceleration value to find the corresponding displacement, and the process was repeated for a range of acceleration values (Jibson, 1993). The resulting curve in Figure 2.1 represents the full spectrum of displacements that can be expected for the design strong-motion record. This curve provides the required link between anticipated earthquake shaking and estimates of displacement for different combinations of geologic materials and slope gradient, as described in the Slope Stability Analysis section below.
Figure 2.1. Yield acceleration vs. Newmark displacement for the Corralitos record of the 1989 Loma Prieta Earthquake. Note: Record from California Strong Motion Instrumentation Program (CSMIP) Station 57007.

CALIFORNIA GEOLOGICAL SURVEY 2008 36
The amount of displacement predicted by the Newmark analysis provides an indication of the relative amount of damage that could be caused by earthquake-induced landsliding. Displacements of 30, 15 and 5 cm were used as criteria for rating levels of earthquake-induced landslide hazard potential based on the work of Youd (1980), Wilson and Keefer (1983), and a CGS pilot study for earthquake-induced landslides (McCrink and Real, 1996; McCrink, 2001). Applied to the curve in Figure 2.1, these displacements correspond to threshold yield accelerations of 0.086, 0.133 and 0.234g. Because these yield acceleration values are derived from the design strong-motion record, they represent the ground shaking opportunity thresholds that are significant in the Dublin Quadrangle.
SLOPE STABILITY ANALYSIS
A slope stability analysis was performed for each geologic material strength group at slope increments of one degree. An infinite-slope failure model under unsaturated slope conditions was assumed. A factor of safety was calculated first, followed by the calculation of yield acceleration from Newmark’s equation: ay = ( FS - 1 )g sin α, where FS is the Factor of Safety, g is the acceleration due to gravity, and α is the direction of movement of the slide mass, in degrees measured from the horizontal, when displacement is initiated (Newmark, 1965). For an infinite slope failure α is the same as the slope angle.
The yield accelerations resulting from Newmark’s equations represent the susceptibility to earthquake-induced failure of each geologic material strength group for a range of slope gradients. Based on the relationship between yield acceleration and Newmark displacement shown in Figure 2.1, hazard potentials were assigned as follows:
1. If the calculated yield acceleration was less than 0.086g, Newmark displacement greater than 30 cm is indicated, and a HIGH hazard potential was assigned.
2. If the calculated yield acceleration fell between 0.086 and 0.133g, Newmark displacement between 15 cm and 30 cm is indicated, and a MODERATE hazard potential was assigned.
3. If the calculated yield acceleration fell between 0.133g and 0.234g, Newmark displacement between 5 cm and 15 cm is indicated, and a LOW hazard potential was assigned.
4. If the calculated yield acceleration was greater than 0.234g, Newmark displacement of less than 5 cm is indicated, and a VERY LOW potential was assigned.
Table 2.3 summarizes the results of the stability analyses. The earthquake-induced landslide hazard potential map was prepared by combining the geologic material-strength map and the slope map according to this table.

SHZR 112 SEISMIC HAZARD ZONATION OF THE DUBLIN QUADRANGLE 37
DUBLIN QUADRANGLE HAZARD POTENTIAL MATRIX
HAZARD POTENTIAL (Degrees)
Geologic Material Strength Group
(Average Phi) Very Low Low Moderate High
1 (35 ) 0 to 23 24 to 28 29 to 30 > 31
2 (32 ) 0 to 20 21 to 25 26 to 28 > 29
3 (28 ) 0 to 18 19 to 20 21 to 23 > 24
4 (23 ) 0 to 10 11 to 15 16 to 18 > 19
Table 2.3. Hazard potential matrix for earthquake-induced landslides in the Dublin Quadrangle. Note: Values in the table show the range of slope gradient (expressed in degrees) corresponding to calculated Newmark displacement ranges from the design earthquake for each material strength group.
ZONATION CRITERIA: EARTHQUAKE-INDUCED LANDSLIDES
Earthquake-induced landslide zones were delineated using criteria adopted by the California State Mining and Geology Board (DOC, 2000). Under these criteria, earthquake-induced landslide hazard zones are defined as areas that meet one or both of the following conditions:
1. Areas that have been identified as having experienced landslide movement in the past, including all mappable landslide deposits and source areas as well as any landslide that is known to have been triggered by historic earthquake activity.
2. Areas where the geologic and geotechnical data and analyses indicate that the earth materials may be susceptible to earthquake-induced slope failure.
These conditions are discussed in further detail below.
DELINEATION OF SEISMIC HAZARD ZONES: EARTHQUAKE-INDUCED LANDSLIDES
Upon completion of an earthquake-induced landslide hazard evaluation within a project quadrangle, CGS applies the above criteria to its findings in order to delineate Zones of Required Investigation. Following is a description of the criteria-based factors that governed the construction of the Seismic Hazard Zone map for the Dublin Quadrangle.
Existing Landslides Existing landslides typically consist of disrupted soils and rock materials that are generally weaker than adjacent undisturbed rock and soil materials. Previous studies indicate that existing

CALIFORNIA GEOLOGICAL SURVEY 2008 38
landslides can be reactivated by earthquake movements (Keefer, 1984). Earthquake-triggered movement of existing landslides is most pronounced in steep head scarp areas and at the toe of existing landslide deposits. Although reactivation of deep-seated landslide deposits is less common (Keefer, 1984), a significant number of deep-seated landslide movements have occurred during, or soon after, several recent earthquakes. Based on these observations, all existing landslides with a definite or probable confidence rating are included within the earthquake-induced landslide hazard zone.
Hazard Potential Analysis Based on the conclusions of a pilot study performed by CGS (McCrink and Real, 1996; McCrink, 2001), it has been concluded that earthquake-induced landslide hazard zones should encompass all areas that have a High, Moderate or Low level of hazard potential (see Table 2.3). This would include all areas where the analyses indicate earthquake displacements of five centimeters or greater. Areas with a Very Low hazard potential, indicating less than five centimeters displacement, are excluded from the zone.
As summarized in Table 2.3, all areas characterized by the following geologic strength group and slope gradient conditions are included in the earthquake-induced landslide hazard zone:
1. Geologic Strength Group 4 is included in the zone for all slopes greater than 11 degrees.
2. Geologic Strength Group 3 is included for all slopes greater than 19 degrees.
3. Geologic Strength Group 2 is included for all slopes greater than 21 degrees.
4. Geologic Strength Group 1 is included for all slopes greater than 24 degrees.
This results in about 33 percent of the land in the Dublin Quadrangle designated as Earthquake-Induced Landslide Hazard Zone.
ACKNOWLEDGMENTS
The authors thank the following individuals and organizations for their assistance in obtaining the data necessary to complete this project: Mr. George Thomas, Chief Building and Safety Inspector of the City of Pleasanton and Terry Alcantra of the City of Dublin, who arranged access and provided assistance in retrieving geotechnical data from files maintained by their respective cities; Gary Moore and Mary Anne Hubbard of the County of Alameda who arranged access and provided assistance in retrieving geotechnical data from files maintained by Alameda County; and at CGS, Mike Silva, who assisted in the grid overlaying, Terilee McGuire, Lee Wallinder and Bob Moscovitz, who provided GIS support; Barbara Wanish, who prepared the final landslide hazard zone maps and the graphic displays for this report; and Candace Hill, who provided editorial assistance.
SHZR 112 SEISMIC HAZARD ZONATION OF THE DUBLIN QUADRANGLE 39
REFERENCES
Brabb, E.E., 1983, Map showing direction and amount of bedding dip of sedimentary rocks in San Mateo County, California: U.S. Geological Survey Miscellaneous Investigations Series Map I-1257C, 1 sheet, scale 1:62,500.
California Department of Conservation, Division of Mines and Geology, 1997a, Guidelines for evaluating and mitigating seismic hazards in California: California Division of Mines and Geology, Special Publication 117, 74 p.
California Department of Conservation, Division of Mines and Geology, 1997b, Fault rupture hazard zones in California: California Division of Mines and Geology, Special Publication 42, 38 p.
California Department of Conservation, Division of Mines and Geology, 2000, Recommended criteria for delineating seismic hazard zones: California Division of Mines and Geology, Special Publication 118, 12 p.
Cao, T., Bryant, W.A., Rowshandel, B., Branum, D., and Wills, C.J., 2003, The Revised 2002 California Probabilistic Seismic Hazard Maps; California Geological Survey, Online Report, http://www.consrv.ca.gov/cgs/rghm/psha/fault_parameters/pdf/2002_CA_Hazard_Maps.pdf, 12 p.
Dibblee, T.W., Jr., 1980, Preliminary geologic map of the Niles Quadrangle, Alameda and Contra Costa counties, California: U.S. Geological Survey Open File Report 80-533C, scale 1:24,000.
Graymer, R.W., 2000, Geologic map and map database of the Oakland metropolitan area, Alameda, Contra Costa, and San Francisco counties, California, U.S. Geological Survey Miscellaneous Field Studies MF-2342, scale 1:24,000, Version 1.0.
Graymer, R.W., Jones, D.L., and Brabb, E.E., 1996, Preliminary geologic map emphasizing bedrock formations in Alameda County, California: U.S. Geological Survey Digital Database Open File 96-252.
Hart, E.W., 1981, Evidence of recent faulting, Calaveras and Pleasanton faults, Diablo and Dublin Quadrangles, California: California Division of Mines and Geology Open-File Report 81-09.
Intermap Technologies, Inc., 2003, Intermap product handbook and quick start guide: Intermap NEXT map document, 112 p.
Jibson, R.W., 1993, Predicting earthquake-induced landslide displacements using Newmark’s sliding block analysis: Transportation Research Board, National Research Council, Transportation Research Record 1411, 17 p.
CALIFORNIA GEOLOGICAL SURVEY 2008 40
Keefer, D.K., 1984, Landslides caused by earthquakes: Geological Society of America Bulletin, v. 95, no. 4, p. 406-421.
Kleinfelder, Inc., 1998, Stability Analysis of Ancient Landslide, Pitch and Putt Property, Castlewood Country Club, Alameda County, California: unpublished consultant report dated March 27, 1998; consultant project no. 10-3007-36/002.
McCrink, T.P., 2001, Mapping earthquake-induced landslide hazards in Santa Cruz County in Ferriz, H., and Anderson, R., editors, Engineering geology practice in northern California: California Geological Survey Bulletin 210 / Association of Engineering Geologists Special Publication 12, p.77-94.
McCrink, T.P., and Real, C.R., 1996, Evaluation of the Newmark method for mapping earthquake-induced landslide hazards in the Laurel 7-1/2 minute Quadrangle, Santa Cruz County, California: California Division of Mines and Geology Final Technical Report for U.S. Geological Survey Contract 143-93-G-2334, U.S. Geological Survey, Reston, Virginia, 31 p.
Newmark, N.M., 1965, Effects of earthquakes on dams and embankments: Geotechnique, v. 15, no. 2, p. 139-160.
Rogers, J.D., and Halliday, J.M., 1992, Tracking the elusive Calaveras Fault from Sunol to San Ramon: in Proceedings of the Second Conference on Earthquake Hazards in the Eastern San Francisco Bay Area, California Division of Mines and Geology Special Publication 113, p. 271-280.
Sawyer, T.L., 1999, Assessment of contractional deformation rates of the Mt. Diablo fold and thrust belt, eastern San Francisco Bay region, northern California: Final technical report submitted to the U.S. Geological Survey, National Earthquake Hazards Reduction Program, Award no. 98-HQ-GR-1006. 53 p.
Shakal, A., Huang, M., Reichle, M., Ventura, C., Cao, T., Sherburne, R., Savage, M., Darragh, R., and Peterson, C., 1989, CSMIP strong-motion records from the Santa Cruz Mountains (Loma Prieta), California earthquake of 17 October 1989: California Division of Mines and Geology, Office of Strong Motion Studies Report OSMS 89-06, 196 p.
Simpson, G.D., Lettis, W.R., and Kelson, K.I., 1992, Segmentation Model for the Northern Calaveras Fault, Calaveras Reservoir to Walnut Creek: in Proceedings of the Second Conference on Earthquake Hazards in the Eastern San Francisco Bay Area, California Division of Mines and Geology Special Publication 113, p. 253-259.
Smith, T.C., 1996, Preliminary maps of seismic hazard zones and draft guidelines for evaluating and mitigating seismic hazards: California Geology, v. 49, no. 6, p. 147-150.
Southern California Earthquake Center, 2002, Recommended procedures for implementation of DMG Special Publication 117 guidelines for analyzing and mitigating landslide hazards in California: T.F. Blake, R.A. Hollingsworth, and J.P. Stewart, editors, Southern California Earthquake Center, University of Southern California, 108 p.
SHZR 112 SEISMIC HAZARD ZONATION OF THE DUBLIN QUADRANGLE 41
Terrasearch, Inc., 1996, Geologic and Geotechnical Update for Analysis of Hillslope Lot Development, Oak Tree Farm, Foothill Road, Pleasanton, California: unpublished consultant report dated November, 19, 1996; consultant project no. 5541.
Terrasearch, Inc., 1990, Geotechnical Investigation on Oak Hill Farm Development, Foothill Road, Pleasanton, California for Currin Development Company: unpublished consultant report dated November 16, 1990; consultant project no. 5541.
Toppozada, T.R., 1981, Preparation of isoseismal maps and summaries of reported effects of pre-1900 earthquakes; California Division of Mines and Geolgogy Open-File Report 81-11, 182p.
Unruh, J.R., 2000, Characterization of blind seismic sources in the Mt. Diablo-Livermore region, San Francisco Bay area, California: Final technical report submitted to the U.S. Geological Survey, National Earthquake Hazards Reduction Program, Award no 99-HQ-GR-0069 30 p.
Wilson, R.C., and Keefer, D.K., 1983, Dynamic analysis of a slope failure from the 1979 Coyote Lake, California, Earthquake: Bulletin of the Seismological Society of America, vol. 73, p. 863-877.
Witter, R.C., Knudsen, K.L, Sowers, J.M., Wentworth, C.M., Koehler, R.D., Randolph, C.E., Brooks, S.K., and Gans, K.D., 2006, Maps of Quaternary deposits and liquefaction susceptibility in the central San Francisco Bay region, California: U.S. Geological Survey Open-File Report 2006-1037 [available on the World Wide Web at URL http://pubs.usgs.gov/of/2006/1037/ ].
Youd, T.L., 1980, Ground failure displacement and earthquake damage to buildings: American Society of Civil Engineers Conference on Civil Engineering and Nuclear Power, 2d, Knoxville, Tennessee, 1980, v. 2, p. 7-6-2 to 7-6-26.
AIR PHOTOS WAC Corporation, Inc, Serial number WAC-C-02CA, dated 5-8-02, Photo numbers 9-29 to 9-37; 9-80 to 9-87 and 9-134 to 9-138; dated 4-23-02, Photo numbers 5-252 to 5-258: scale 1:24,000±.

CALIFORNIA GEOLOGICAL SURVEY 2008 42
APPENDIX A: SOURCE OF ROCK STRENGTH DATA SOURCE NUMBER OF TESTS SELECTED
City of Pleasanton* 50
City of Dublin 38 County of Alameda 73
Total Number of Shear Tests 161
*Note: Forty-three additional shear tests obtained from the City of Pleasanton were not used because they were collected in massive landslide complexes that had been transported far from the source area. The shear test results were not considered to be representative of the parent material.

SHZR 112 SEISMIC HAZARD ZONATION OF THE DUBLIN QUADRANGLE 43
SECTION 3: GROUND SHAKING ASSESSMENT for the
DUBLIN 7.5-MINUTE QUADRANGLE, ALAMEDA COUNTY, CALIFORNIA
using the
2002 Probabilistic Seismic Hazard Assessment Model
By Charles R. Real and Marvin Woods
Department of Conservation California Geological Survey
INTRODUCTION
The Seismic Hazards Mapping Act (the Act) of 1990 (Public Resources Code, Chapter 7.8, Division 2) directs the California Department of Conservation, California Geological Survey (CGS) to delineate Seismic Hazard Zones. The purpose of the Act is to reduce the threat to public health and safety and to minimize the loss of life and property by identifying and mitigating seismic hazards. Cities, counties, and state agencies are directed to use the Seismic Hazard Zone Maps in their land-use planning and permitting processes. The Act requires that site-specific geotechnical investigations be performed prior to permitting most urban development projects located within the hazard zones. Evaluation and mitigation of seismic hazards are to be conducted under guidelines adopted by the California State Mining and Geology Board (CGS, 1997). The guidelines are available on the Internet at: http://gmw.consrv.ca.gov/shmp/webdocs/sp117.pdf
This section of the evaluation report summarizes the calculations of ground motions used to evaluate liquefaction and earthquake-induced landslide potential for zoning purposes. Included are ground motion maps, a brief overview on how these maps were prepared, precautionary notes concerning their use, and related references. The maps are presented at a scale of about 1:150,000 (scale bar provided on maps) and show the full boundary of the Dublin 7.5-Minute Quadrangle and portions of the eight adjacent ones. They can be used to assist in the specification of earthquake loading conditions for the analysis of ground failure according to the “Simple Prescribed Parameter Value” method (SPPV) described in the site investigation guidelines (CGS, 1997). Alternatively, they can be used as a basis for comparing levels of
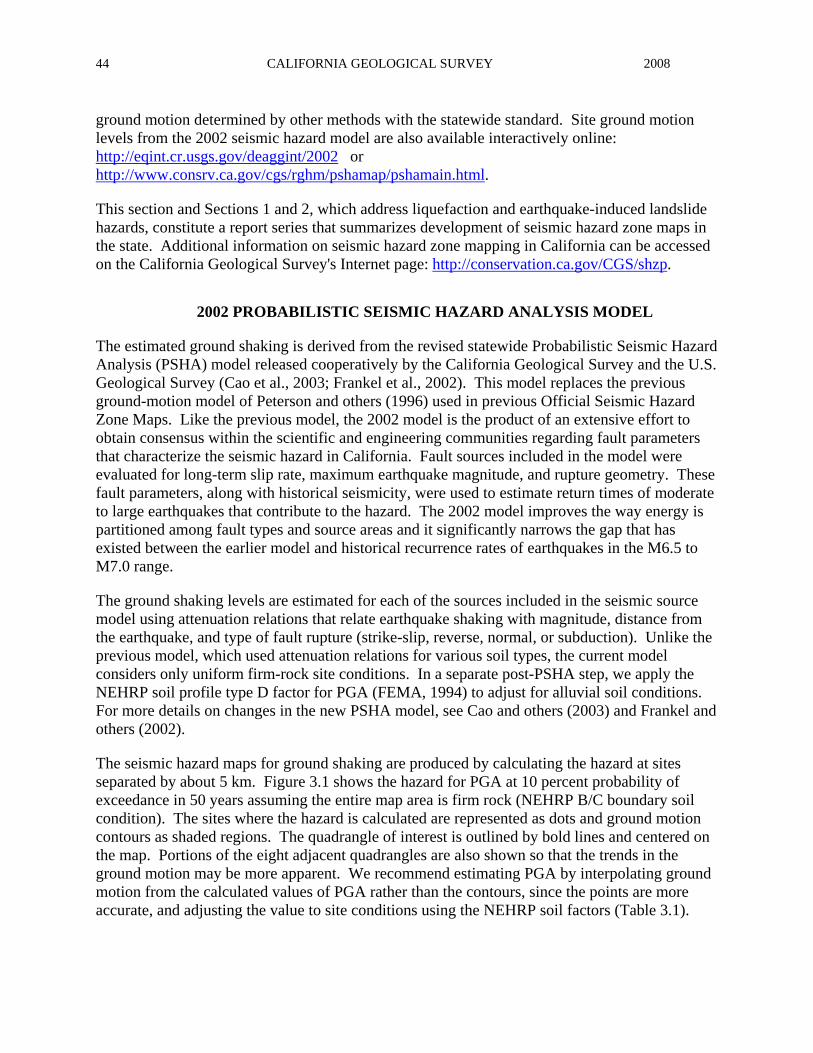
CALIFORNIA GEOLOGICAL SURVEY 2008 44
ground motion determined by other methods with the statewide standard. Site ground motion levels from the 2002 seismic hazard model are also available interactively online: http://eqint.cr.usgs.gov/deaggint/2002 or http://www.consrv.ca.gov/cgs/rghm/pshamap/pshamain.html.
This section and Sections 1 and 2, which address liquefaction and earthquake-induced landslide hazards, constitute a report series that summarizes development of seismic hazard zone maps in the state. Additional information on seismic hazard zone mapping in California can be accessed on the California Geological Survey's Internet page: http://conservation.ca.gov/CGS/shzp.
2002 PROBABILISTIC SEISMIC HAZARD ANALYSIS MODEL
The estimated ground shaking is derived from the revised statewide Probabilistic Seismic Hazard Analysis (PSHA) model released cooperatively by the California Geological Survey and the U.S. Geological Survey (Cao et al., 2003; Frankel et al., 2002). This model replaces the previous ground-motion model of Peterson and others (1996) used in previous Official Seismic Hazard Zone Maps. Like the previous model, the 2002 model is the product of an extensive effort to obtain consensus within the scientific and engineering communities regarding fault parameters that characterize the seismic hazard in California. Fault sources included in the model were evaluated for long-term slip rate, maximum earthquake magnitude, and rupture geometry. These fault parameters, along with historical seismicity, were used to estimate return times of moderate to large earthquakes that contribute to the hazard. The 2002 model improves the way energy is partitioned among fault types and source areas and it significantly narrows the gap that has existed between the earlier model and historical recurrence rates of earthquakes in the M6.5 to M7.0 range.
The ground shaking levels are estimated for each of the sources included in the seismic source model using attenuation relations that relate earthquake shaking with magnitude, distance from the earthquake, and type of fault rupture (strike-slip, reverse, normal, or subduction). Unlike the previous model, which used attenuation relations for various soil types, the current model considers only uniform firm-rock site conditions. In a separate post-PSHA step, we apply the NEHRP soil profile type D factor for PGA (FEMA, 1994) to adjust for alluvial soil conditions. For more details on changes in the new PSHA model, see Cao and others (2003) and Frankel and others (2002).
The seismic hazard maps for ground shaking are produced by calculating the hazard at sites separated by about 5 km. Figure 3.1 shows the hazard for PGA at 10 percent probability of exceedance in 50 years assuming the entire map area is firm rock (NEHRP B/C boundary soil condition). The sites where the hazard is calculated are represented as dots and ground motion contours as shaded regions. The quadrangle of interest is outlined by bold lines and centered on the map. Portions of the eight adjacent quadrangles are also shown so that the trends in the ground motion may be more apparent. We recommend estimating PGA by interpolating ground motion from the calculated values of PGA rather than the contours, since the points are more accurate, and adjusting the value to site conditions using the NEHRP soil factors (Table 3.1).
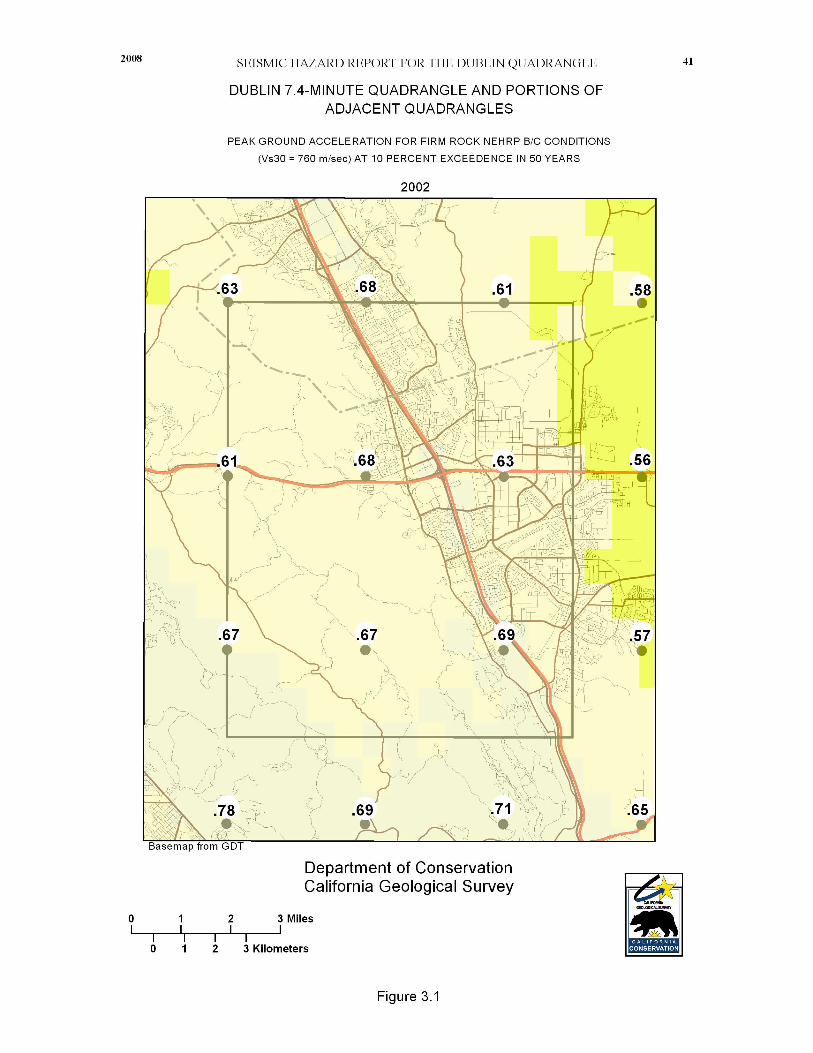
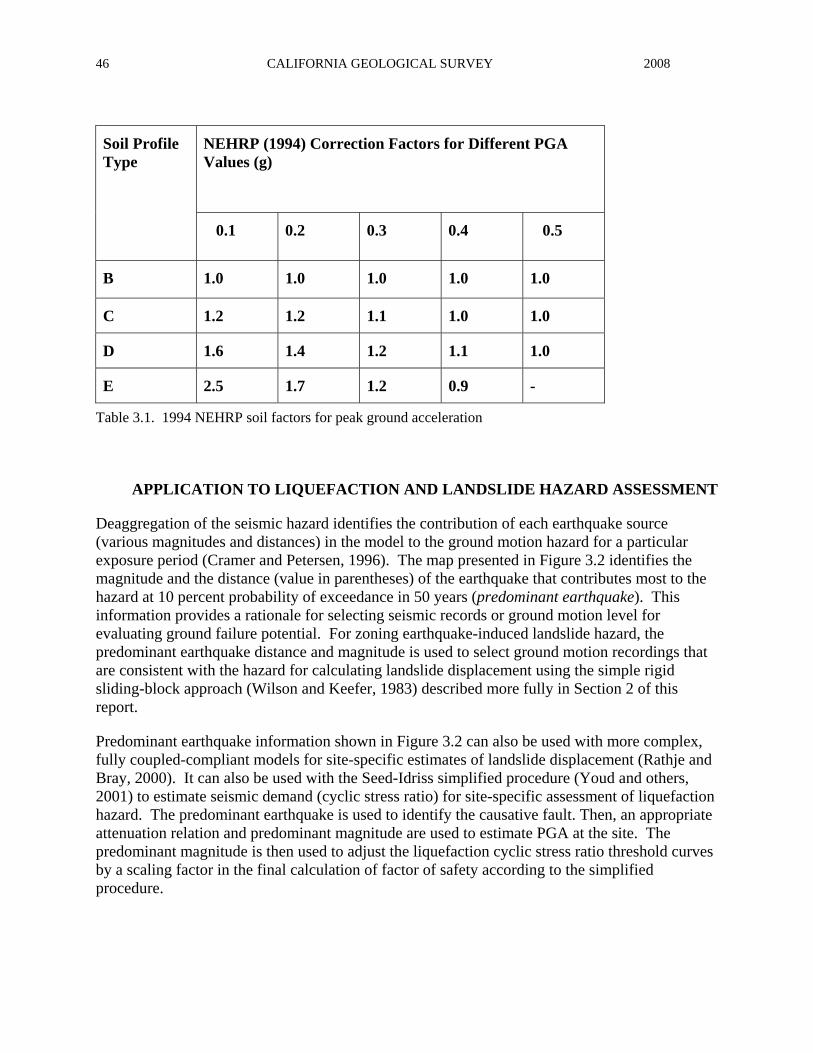
CALIFORNIA GEOLOGICAL SURVEY 2008 46
NEHRP (1994) Correction Factors for Different PGA Values (g)
Soil Profile Type
�0.1 0.2 0.3 0.4 �0.5
B 1.0 1.0 1.0 1.0 1.0
C 1.2 1.2 1.1 1.0 1.0
D 1.6 1.4 1.2 1.1 1.0
E 2.5 1.7 1.2 0.9 -
Table 3.1. 1994 NEHRP soil factors for peak ground acceleration
APPLICATION TO LIQUEFACTION AND LANDSLIDE HAZARD ASSESSMENT
Deaggregation of the seismic hazard identifies the contribution of each earthquake source (various magnitudes and distances) in the model to the ground motion hazard for a particular exposure period (Cramer and Petersen, 1996). The map presented in Figure 3.2 identifies the magnitude and the distance (value in parentheses) of the earthquake that contributes most to the hazard at 10 percent probability of exceedance in 50 years (predominant earthquake). This information provides a rationale for selecting seismic records or ground motion level for evaluating ground failure potential. For zoning earthquake-induced landslide hazard, the predominant earthquake distance and magnitude is used to select ground motion recordings that are consistent with the hazard for calculating landslide displacement using the simple rigid sliding-block approach (Wilson and Keefer, 1983) described more fully in Section 2 of this report.
Predominant earthquake information shown in Figure 3.2 can also be used with more complex, fully coupled-compliant models for site-specific estimates of landslide displacement (Rathje and Bray, 2000). It can also be used with the Seed-Idriss simplified procedure (Youd and others, 2001) to estimate seismic demand (cyclic stress ratio) for site-specific assessment of liquefaction hazard. The predominant earthquake is used to identify the causative fault. Then, an appropriate attenuation relation and predominant magnitude are used to estimate PGA at the site. The predominant magnitude is then used to adjust the liquefaction cyclic stress ratio threshold curves by a scaling factor in the final calculation of factor of safety according to the simplified procedure.
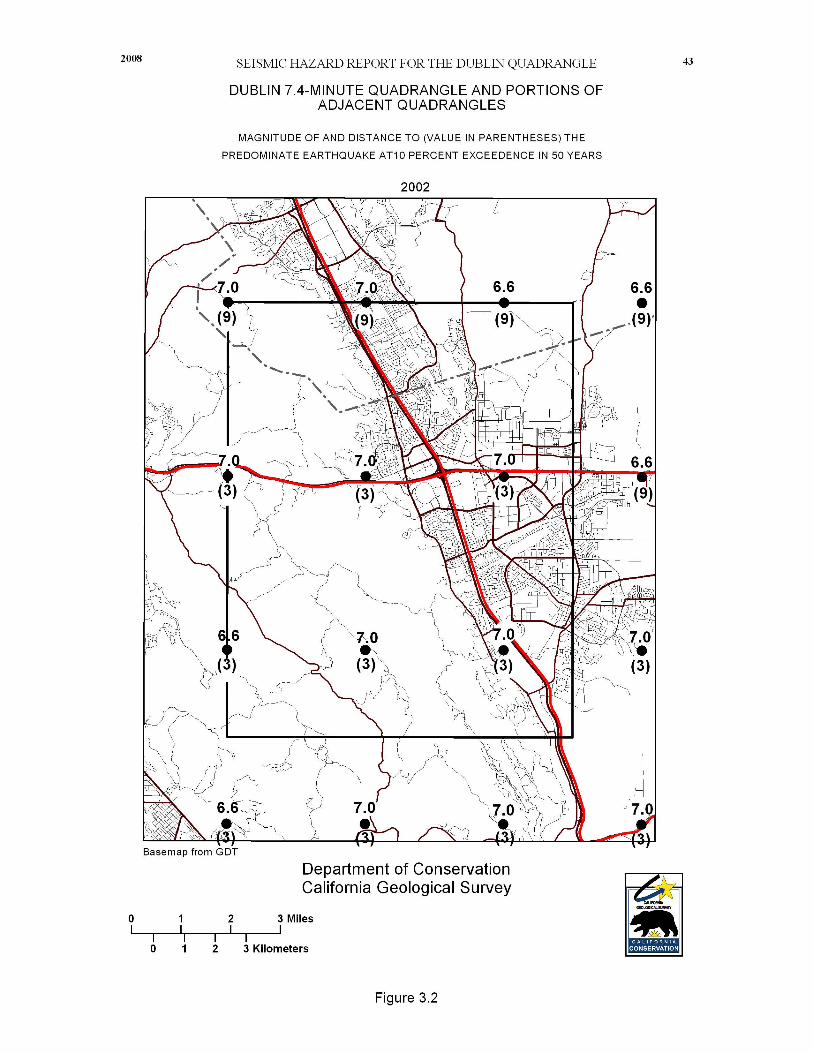
CALIFORNIA GEOLOGICAL SURVEY 2008 48
When selecting the predominant earthquake magnitude and distance it is important to keep in mind that more than one earthquake may contribute significantly to the hazard at a site, and those events can have markedly different magnitudes and distances. It is advisable to consider the range of values near the site and perform the ground failure analysis accordingly. This would yield a range in ground failure hazard from which recommendations appropriate to the specific project can be made. Grid values for predominant earthquake magnitude and distance should not be interpolated at the site location, because these parameters are not continuous functions.
When calculating probabilistic peak ground acceleration for purposes of zoning liquefaction hazard, we weight each earthquake’s contribution to the hazard estimate by a factor that is a function of its magnitude. The function is simply the inverse of the liquefaction threshold- scaling factor mentioned previously. The result is a “magnitude-weighted” ground motion that we then adjust for NEHRP alluvial conditions and use directly in the calculation of the induced cyclic stress ratio demand and thus the estimate of the factor of safety against liquefaction. Unlike the predominant–earthquake approach described previously, this approach provides an improved estimate of liquefaction hazard in a probabilistic sense. All magnitudes contributing to the hazard estimate are used to weight the probabilistic calculation of peak ground acceleration, effectively causing the cyclic stress ratio liquefaction threshold curves to be scaled probabilistically when computing factor of safety. This procedure ensures that large, distant earthquakes, which occur less frequently but contribute more, and smaller, more frequent events, which contribute less to the liquefaction hazard, are appropriately accounted for (Real et al., 2000).
Figure 3.3 shows the magnitude-weighted alluvial PGA based on the Idriss scaling function (Youd and others, 2001). It is important to note that the values obtained from this map are pseudo-accelerations and should be used only in the simplified formulas for computing liquefaction factor of safety without applying additional magnitude-scaling factors. We refer to this parameter as “liquefaction opportunity.”
USE AND LIMITATIONS
The statewide map of seismic hazard has been developed using regional information and is not appropriate for site-specific structural design applications. Use of the ground motion maps prepared at larger scale is limited to estimating earthquake-loading conditions for preliminary assessment of ground failure at a specific location. We recommend consideration of site-specific analyses before deciding on the sole use of these maps for the following reasons.
1. The seismogenic sources used to generate the peak ground accelerations were digitized from the 1:750,000-scale fault activity map of Jennings (1994). Uncertainties in fault location are estimated to be about 1 to 2 kilometers (Petersen and others, 1996). Therefore, differences in the location of calculated hazard values may also differ by a similar amount. At a specific location, however, the log-linear attenuation of ground motion with distance renders hazard estimates less sensitive to uncertainties in source location.
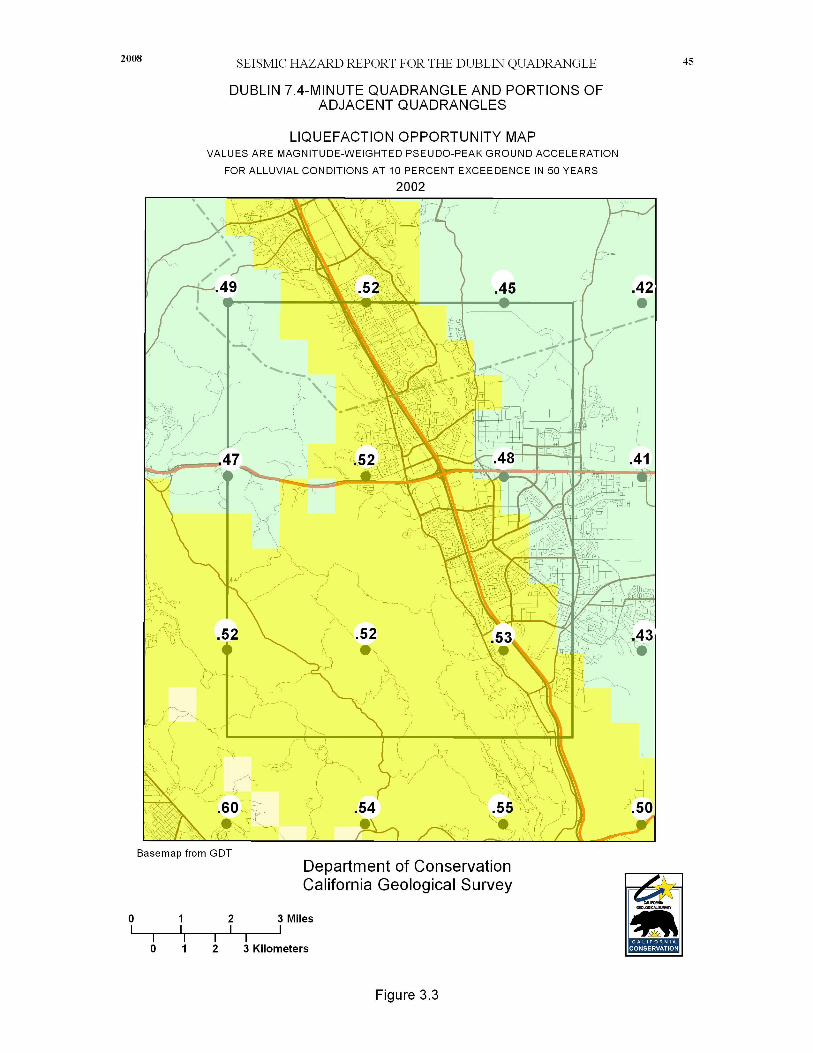

CALIFORNIA GEOLOGICAL SURVEY 2008 50
2. The hazard was calculated on a grid at sites separated by about 5 km (0.05 degrees). Therefore, the calculated hazard may be located a couple kilometers away from the site. We have provided shaded contours on the maps to indicate regional trends of the hazard model. However, the contours only show regional trends that may not be apparent from points on a single map. Differences of up to 2 km have been observed between contours and individual ground acceleration values. We recommend that the user interpolate PGA between the grid point values rather than simply using the shaded contours.
3. Uncertainties in the hazard values have been estimated to range from about +/- 10 to 30 percent of the ground motion value at two standard deviations for most of California (Cao and others, 2005). It may be as high as 50 percent in some locations where the earthquake source parameters have higher uncertainty.
4. Not all active faults in California are included in this model. For example, faults that do not have documented slip rates are not included in the source model. Scientific research may identify active faults that have not been previously recognized. Therefore, future versions of the hazard model may include other faults and omit faults that are currently considered.
5. A map of the predominant earthquake magnitude and distance is provided from the deaggregation of the probabilistic seismic hazard model. However, it is important to recognize that a site may have more than one earthquake that contributes significantly to the hazard. Therefore, in some cases earthquakes other than the predominant earthquake should also be considered.
6. Because of its simplicity, it is likely that the SPPV method (CGS, 1997) will be widely used to estimate earthquake shaking for the evaluation of ground failure hazards. Because ground motion models evolve with time it is best to refer to the aforementioned web sites in order to obtain the most current ground shaking information when using this method: http://eqint.cr.usgs.gov/deaggint/2002 or http://www.consrv.ca.gov/cgs/rghm/pshamap/pshamain.html.
As a final caution, it should be kept in mind that ground motions at a given distance from an earthquake will vary depending on site-specific characteristics such as geology, soil properties, and topography, which may not have been adequately accounted for in the regional hazard analysis. Although this variability is represented to some degree by the recorded ground motions that form the basis of the hazard model used to produce Figures 3.1 and 3.3, extreme deviations can occur. More sophisticated methods that take into account other factors that may be present at the site (site amplification, basin effects, near source effects, etc.) should be employed as warranted. The decision to use the SPPV method with ground motions derived from Figures 3.1 or 3.3 should be based on careful consideration of the above limitations, the geotechnical and seismological aspects of the project setting, and the “importance” or sensitivity of the proposed building with regard to occupant safety.
SHZR 112 SEISMIC HAZARD ZONATION OF THE DUBLIN QUADRANGLE 51
REFERENCES
California Department of Conservation, Division of Mines and Geology (CGS), 1997, Guidelines for evaluating and mitigating seismic hazards in California: Special Publication 117, 74 p.
Cao, T., Petersen, M.D., and Frankel, A.D., 2005, Model uncertainties of the 2002 update of California seismic hazard maps: Bulletin of the Seismological Society of America, vol. 95, p. 2040-2057.
Cao, T., Bryant, W.A., Rowshandel, B., Branum, D., and Wills, C.J., 2003, The Revised 2002 California Probabilistic Seismic Hazard Maps: California Geological Survey Online Report, http://www.consrv.ca.gov/cgs/rghm/psha/fault_parameters/pdf/2002_CA_Hazard_Maps.pdf, 12 p.
Cramer, C.H., and Petersen, M.D., 1996, Predominant seismic source distance and magnitude maps for Los Angeles, Orange and Ventura counties, California: Bulletin of the Seismological Society of America, vol. 85, no. 5, p. 1645-1649.
Cramer, C.H., Petersen, M.D., and Reichle, M.S., 1996, A Monte Carlo approach in estimating uncertainty for a seismic hazard assessment of Los Angeles, Ventura, and Orange counties, California: Bulletin of the Seismological Society of America, vol. 86, p. 1681-1691.
Frankel, A.D., Petersen, M.D., Muller, C.S., Haller, K.M., Wheeler, R.L., Layendecker, E.V., Wesson, R.L., Harmsen, S.C., Cramer, C.H., Perkins, D.M., and Rukstales, K.S., 2002, Documentation for the 2002 Update of the National Seismic Hazard Maps: U.S. Geological Survey, Open-File Report 02-420, 33 p.
Jennings, C.W., compiler, 1994, Fault activity map of California and adjacent areas: California Department of Conservation, Division of Mines and Geology, California Geologic Data Map Series, map no. 8.
FEMA, 1994, NEHRP Recommended Provisions for Seismic Regulations for New Buildings and Other Structures: Washington, D.C., FEMA 222A.
Petersen, M.D., Bryant, W.A., Cramer, C.H., Cao, T., Reichle, M.S., Frankel, A.D., Lienkaemper, J.J., McCrory, P.A., and Schwartz, D.P., 1996, Probabilistic seismic hazard assessment for the State of California: California Department of Conservation, Division of Mines and Geology Open-File Report 96-08; also U.S. Geological Survey Open-File Report 96-706, 33 p.
Rathje, E.M., and Bray, J.D., 2000, Nonlinear Coupled Seismic Sliding Analysis of Earth Structures: Journal of Geotechnical and Geoenvironmental Engineering, vol. 126, p. 1002-1014.
CALIFORNIA GEOLOGICAL SURVEY 2008 52
Real, C.R., Petersen, M.D., McCrink, T.P., and Cramer, C.H., 2000, Seismic Hazard Deaggregation in zoning earthquake-induced ground failures in southern California: Proceedings of the Sixth International Conference on Seismic Zonation, November 12-15, Palm Springs, California, EERI, Oakland, CA.
Wilson, R.C., and Keefer, D.K., 1983, Dynamic analysis of a slope failure from the 1979 Coyote Lake, California, Earthquake: Bulletin of the Seismological Society of America, vol. 73, p. 863-877.
Youd, T.L., Idriss, I.M., Andrus, R.D., Arango, I., Castro, G., Christian, J.T., Dobry, R., Finn, W.D., Harder Jr., L.F., Hynes, M.E., Ishihara, K., Koester, J.P., Liao, S.S., Marcuson III, W.F., Martin, G.R., Mitchell, J.K., Moriwaki, Y., Power, M.S., Robertson, P.K., Seed, R.B., and Stokoe II, K.H., 2001, Liquefaction Resistance of Soils: Summary Report From the 1996 NCEER and 1998 NCEER/NSF Workshops on Evaluation of Liquefaction Resistance of Soils: Journal of Geotechnical and Geoenvironmental Engineering, vol. 127, p. 817-827.