dual threshold adaptive dynamic migration strategy of
TRANSCRIPT

electronics
Article
Dual Threshold Adaptive Dynamic MigrationStrategy of Virtual Resources Based on BBU Pool
Cheng Wang 1,* , Yushi Cao 1 , Zhili Zhang 2 and Weidong Wang 1
1 School of Electronic Engineering, Beijing University of Posts and Telecommunications, Beijing 100876, China;[email protected] (Y.C.); [email protected] (W.W.)
2 The 54th Research Institute of China Electronics Technology Group Corporation, Hebei 500081, China;[email protected]
* Correspondence: [email protected]; Tel.: +86-1861-832-2537
Received: 15 January 2020; Accepted: 8 February 2020; Published: 11 February 2020�����������������
Abstract: The rapid development of mobile communications and the continuous growth of serviceneeds lead to an increase in the number of base stations (BSs). Through virtualization and cloudtechnology, virtual Baseband Units (BBUs) are deployed on a virtual machine (VM) to build a BBUpool to achieve hardware resource sharing, which not only saves BS construction costs but alsofacilitates management and control. However, too high or too low server resource utilization in thepool not only affects the performance of the virtual BBU but also increases the maintenance cost ofthe physical equipment. In this paper, BBUs are virtualized to construct a virtual BBU pool basedon the OpenStack cloud architecture and a dual threshold adaptive dynamic migration strategy isproposed in this scenario. Establish upper and lower threshold of resource utilization of the serversin the pool and the strategy determines whether the dynamic migration is triggered according to theresource utilization of each compute node. If the migration is triggered, the strategy selects the virtualresource to be moved out and the target node to realize the dynamic migration to achieve the purposeof balancing the server load and saving energy consumption. The migration strategy proposed in thispaper is simulated on Cloudsim and the experimental results show that the strategy can effectivelyreduce the number of migrations and migration time on the basis of reducing energy consumptionand SLA violations. This paper successfully deployed the strategy on the OpenStack platform, whichimplements dynamic migration autonomously to save the overall energy consumption of the BBUpool, instead of manual operations.
Keywords: BBU Pool; dynamic migration; OpenStack; Cloudsim
1. Introduction
With the development of mobile communication technology and the commercial use of 5G, mobileoperators ensure the normal use of user services in their coverage areas and meet the need for ahigher data rate, fast and efficient network services [1] by deploying a large number of base stations(BSs). The increasing number of BSs will lead to increasing problems. Firstly, in the traditional mobilecommunication system, each BS is relatively independent and cannot share resources [2]. Each BSonly undertakes the processing of access user services within its coverage area, so the deployment andmaintenance of a large number of BSs require significant construction costs. Secondly, the auxiliaryequipment such as air conditioners equipped during the operation of BSs will also cause energyconsumption problems. To solve the challenges mentioned above, the concept and architecture ofcentralized access network are proposed. Cloud-radio access networks (C-RAN) is a promising 5Gmobile network architecture [2], which implements the functional separation of traditional BS into twoparts—the baseband unit (BBU) and the remote radio head (RRH). It allows BBUs to be geographically
Electronics 2020, 9, 314; doi:10.3390/electronics9020314 www.mdpi.com/journal/electronics

Electronics 2020, 9, 314 2 of 19
separated from RRHs [3,4]. BBU performs baseband signal digital processing together with all upperlayer functions. RRH acts as the wireless signal transmission and reception with antennas. Each RRHdoes not belong to any specific physical BBU and a virtual BS can process the radio signals from /toa particular RRH. C-RAN can reduce capital expenditure (CAPEX) and operating expense (OPEX)of 5G by separating RRH from BBUs based on network functions virtualization (NFV) concepts [5].IBM, Huawei and other equipment manufacturers have also put forward a centralized architectureimplementation scheme, combined with software defined network (SDN) and NFV, to completethe unified management and allocation of BS computing resources on cloud computing platforms.Applying cloud computing as the computing paradigm of the centralized BBU pool can reduce thepower consumption and improve hardware utilization, through resource sharing and virtualization,that is, a server can be further virtualized into many virtual machines (VMs) [6] running multipleisolated virtual BBU instances.
The continuous arrival or end of communication services leads to great differences in the loaddistribution of different BBUs in the BBU pool. To ensure the normal operation of the user services inthe coverage area, the no-load or low-load BBUs must maintain the same running state as the high-loadBBUs. On the one hand, the physical servers with these virtualized BBUs may degrade the qualityof service because of the too high utilization of resources. On the other hand, the low utilizationof resources wastes the physical resources while maintaining the power cost. BBUs are deployedin the server cluster centrally through virtualization to form a BBU pool and realizes the dynamicscheduling of virtual resources according to the utilization of real-time resource, which cannot onlyshare physical resources but also improve the utilization of cluster server processing resources in theBBU pool, improve the overall operation reliability of the pool and reduce the power consumption.Since virtual BBUs are deployed on the VMs, the dynamic migration method of the VMs in the cloudenvironment can be adopted to improve the resource utilization rate and achieve load balancing.
Load balancing is a migration process of the load from over utilized nodes to underutilized nodesto reduce the wastage of the resources in a cloud environment [1]. It can be done by VM selectionand migration that appropriate VMs are selected either from the overloaded or under-loaded hostfor migration. Yazir et al. implemented a threshold to determine whether migration is required bymonitoring the resource utilization of the server and performs a migration operation once it detectsthat its resource utilization exceeds the high load threshold [7]. The authors of References [8,9]adopt the algorithm called Minimum Migration Time (MMT), which selects a VM based on thevalue of the migration time, the less, the better. Reference [10] selects the VM selection strategy withmaximum utilization for migration and VM placement algorithm using the Minimum Power HighAvailable Capacity strategy to find new places of VM has been developed. Reference [11] calculatestotal utilization (TU) combined with CPU and memory to choose the smallest TU as destinationhost. However, if the threshold is exceeded, the migration is triggered immediately and unnecessarymigration may be triggered because of an instantaneous peak value, resulting in unnecessary systemoverhead. Razali et al. in Reference [12] make the historical data as a training set, establish a predictionmodel and predict the CPU usage for the next moment. In Reference [13], a prediction based on fuzzylogic is used to predict future resource utilization. The authors in Reference [14] use threshold and timesequence prediction technique, which does not perform migration operations immediately when it isdetected that server resource utilization exceeds the threshold but continues to observe several cyclesto determine whether to initiate migration. This method determines the migration time and avoidsinvalid migrations, which can save the overall energy consumption of the data center. However, therunning communication service is sensitive to the quality of service in the BBU pool. If the virtual BBUdoes reach the continuous high load state at this time, long observation time of several consecutivecycles may lead to the sharp deterioration of the quality of service of the communication service inthe BS.
Based on the architecture of a centralized access network, this paper uses virtualization technologyon x86 architecture servers to virtualize the functions of traditional BBUs (such as physical layer

Electronics 2020, 9, 314 3 of 19
baseband processing and high-level protocol processing) on VMs, to build a centralized BBU pool anduse OpenStack cloud platform for unified control and deployment of virtual resources in the pool. Inthis scenario, this paper proposes a dual threshold adaptive dynamic migration strategy, which setsthe upper and lower threshold for the physical nodes’ resource utilization in the BBU pool and realizeadaptive dynamic migration. The main contributions of this paper are summarized as follows:
(1) We virtualize the BBU and build a virtual BBU pool combined with OpenStack cloud architecture.In the OpenStack-based BBU pool, all the processing resources provided by physical servers can bemanaged and allocated by a unified real-time virtual operating system.
(2) We propose a dual threshold adaptive (DTA) dynamic migration strategy divided into threeparts. The first part is the adaptive migration trigger strategy combined with the Kalman filteralgorithm, which can avoid a certain instantaneous peak of server resource utilization to triggerunnecessary migration because of too high or too low and effectively determine the time to triggermigration. The second part is selection strategy of VM, based on the number of migrations and themigration time. The last part is selection of target server node, combined with prediction and resourceutilization to make a comprehensive judgment.
(3) The simulation is carried out first by the CloudSim platform to evaluate the proposed migrationstrategy, which can improve energy consumption and SLA violation and significantly reduce the totalnumber of migrations and migration time. Then the strategy is implemented on the OpenStack and theresults are finally analyzed that this strategy can avoid invalid migration, instead of manual, realizeadaptive dynamic migration and achieve the load balancing purpose.
The rest of the paper is organized as follows. Section 2 presents a system scenario of BBU poolbased on OpenStack and introduces related works of migration and parameter definition. In Section 3,we describe the migration strategy in detail. Section 4 shows the simulation results on Cloudsim andOpenStack. Then conclusions are drawn in Section 5.
2. System Scenario and Related Works
2.1. Virtual BBU Pool based on OpenStack Architecture
This paper adopts the distributed architecture of BBU and RRH, as shown in Figure 1. BBUsare clustered as a BBU pool in a centralized location. RRHs support high capacity in hot spots,while the virtualized BBU pool provides large-scale collaborative processing and cooperative radioresource allocation [15]. The pool has at least one control management to control the performance ofall virtual resources.
Through virtualization technology, a virtual layer is built on a general server cluster of the X86architecture. Multiple VMs are run on the virtual layer and a virtualized BBU pool is constructedthrough the running VMs deployed on many common servers. Integrate the BBU pool with theOpenStack and remotely connect to the RRH. The resources used by each VM will be planned accordingto the resource allocation plan of the BBU pool and support different functions of baseband processingunits. The OpenStack cloud platform solves the problem of the automatic creation of virtual resources.Figure 2 shows the virtual BBU pool architecture based on OpenStack, which can manage and deploythe pool and implement dynamic migration. With the OpenStack cloud architecture, physical serverscan be deployed as compute nodes, these nodes and the virtual BBU pool deployed on these nodes canbe managed and controlled by a controller node (also deployed on a physical server).

Electronics 2020, 9, 314 4 of 19
Electronics 2020, 9, 314 3 of 17
which sets the upper and lower threshold for the physical nodes’ resource utilization in the BBU pool
and realize adaptive dynamic migration. The main contributions of this paper are summarized as
follows:
(1) We virtualize the BBU and build a virtual BBU pool combined with OpenStack cloud
architecture. In the OpenStack-based BBU pool, all the processing resources provided by physical
servers can be managed and allocated by a unified real-time virtual operating system.
(2) We propose a dual threshold adaptive (DTA) dynamic migration strategy divided into three
parts. The first part is the adaptive migration trigger strategy combined with the Kalman filter
algorithm, which can avoid a certain instantaneous peak of server resource utilization to trigger
unnecessary migration because of too high or too low and effectively determine the time to trigger
migration. The second part is selection strategy of VM, based on the number of migrations and the
migration time. The last part is selection of target server node, combined with prediction and resource
utilization to make a comprehensive judgment.
(3) The simulation is carried out first by the CloudSim platform to evaluate the proposed
migration strategy, which can improve energy consumption and SLA violation and significantly
reduce the total number of migrations and migration time. Then the strategy is implemented on the
OpenStack and the results are finally analyzed that this strategy can avoid invalid migration, instead
of manual, realize adaptive dynamic migration and achieve the load balancing purpose.
The rest of the paper is organized as follows. Section 2 presents a system scenario of BBU pool
based on OpenStack and introduces related works of migration and parameter definition. In Section
3, we describe the migration strategy in detail. Section 4 shows the simulation results on Cloudsim
and OpenStack. Then conclusions are drawn in Section 5.
2. System Scenario and Related Works
2.1. Virtual BBU Pool based on OpenStack Architecture
This paper adopts the distributed architecture of BBU and RRH, as shown in Figure 1. BBUs are
clustered as a BBU pool in a centralized location. RRHs support high capacity in hot spots, while the
virtualized BBU pool provides large-scale collaborative processing and cooperative radio resource
allocation [15]. The pool has at least one control management to control the performance of all virtual
resources.
BBU PoolControl
Management
Server1 Server2
Server3
ServerN
RRH
FrontHaul Link
RRH
RRH
RRHRRH
Figure 1. Baseband unit (BBU) and remote radio head (RRH) distributed architecture.
Through virtualization technology, a virtual layer is built on a general server cluster of the X86
architecture. Multiple VMs are run on the virtual layer and a virtualized BBU pool is constructed
through the running VMs deployed on many common servers. Integrate the BBU pool with the
Figure 1. Baseband unit (BBU) and remote radio head (RRH) distributed architecture.
Electronics 2020, 9, 314 4 of 17
OpenStack and remotely connect to the RRH. The resources used by each VM will be planned
according to the resource allocation plan of the BBU pool and support different functions of baseband
processing units. The OpenStack cloud platform solves the problem of the automatic creation of
virtual resources. Figure 2 shows the virtual BBU pool architecture based on OpenStack, which can
manage and deploy the pool and implement dynamic migration. With the OpenStack cloud
architecture, physical servers can be deployed as compute nodes, these nodes and the virtual BBU
pool deployed on these nodes can be managed and controlled by a controller node (also deployed on
a physical server).
Virtual BBU Pool
OpenStack Compute 1
OpenStack Compute 3
OpenStack Compute 2
OpenStack Compute M
OpenStack Controller
Virtual Layer
operating system
BBU function
Virtual BBU 1
operating system
BBU function
Virtual BBU 2
operating system
BBU function
Virtual BBU N-1
operating system
BBU function
Virtual BBU N
...
Physical hardwareVirtual Layer
operating system
BBU function
Virtual BBU 1
operating system
BBU function
Virtual BBU 2
operating system
BBU function
Virtual BBU N-1
operating system
BBU function
Virtual BBU N
...
Physical hardware
Figure 2. Virtual BBU pool architecture based on OpenStack.
2.2. Related Model Definition
2.2.1. Model of Power
The research in Reference [16] shows that power consumption by physical machines can be
described by a linear relationship between power consumption and CPU utilization. The study also
points out that a free physical machine uses approximately 70% of its power consumption on average
when it is fully utilized. Define the power consumption as a CPU utilization function from Equation
(1).
(1 )max maxP(u)= k P + - k P u , (1)
where maxP is the maximum power of a server in the running state, k is the percentage of
power consumed by an idle physical server and u is the CPU utilization. As the utilization of CPU
changes over time due to the workload variability and ( )u t is a function of the time. The total energy
consumption can be defined by Equation (2). According to this model, the energy consumption is
determined by the CPU utilization.
( ( ))t
E = P u t dt . (2)
2.2.2. Cost of VM Dynamic Migration
Figure 2. Virtual BBU pool architecture based on OpenStack.

Electronics 2020, 9, 314 5 of 19
2.2. Related Model Definition
2.2.1. Model of Power
The research in Reference [16] shows that power consumption by physical machines can bedescribed by a linear relationship between power consumption and CPU utilization. The study alsopoints out that a free physical machine uses approximately 70% of its power consumption on averagewhen it is fully utilized. Define the power consumption as a CPU utilization function from Equation(1).
P(u) = k× Pmax + (1− k) · Pmax × u, (1)
where Pmax is the maximum power of a server in the running state, k is the percentage of powerconsumed by an idle physical server and u is the CPU utilization. As the utilization of CPU changes overtime due to the workload variability and u(t) is a function of the time. The total energy consumptioncan be defined by Equation (2). According to this model, the energy consumption is determined by theCPU utilization.
E =
∫tP(u(t)) dt. (2)
2.2.2. Cost of VM Dynamic Migration
Dynamic migration of VMs allows transferring VMs between physical nodes with short downtime.However, dynamic migration has a negative influence on the performance of applications running in aVM during a migration. Studies in Reference [17] found that a reduction in performance and downtimedepends on the behavior of applications. The length of a dynamic migration depends on the totalamount of memory used by the VM and available network bandwidth. In order to avoid performancedegradation, a VM migration cost model is adopted in Reference [17] to help choose migratable VMs.As the authors say in Reference [18], a single VM Migration can cause performance degradation andcan be estimated by an extra 10% of CPU utilization and this implies that each migration may causeSLA violations. Therefore, it is crucial to minimize the number of VM migrations and select the VMusing the least memory. Thus in the migration strategy from this paper, the performance degradationof VM j is defined in Equations (3) and (4).
Ud j = 0.1∫ t0+Tmj
t0
u j(t)dt (3)
Tm j =M j
B j, (4)
where Ud j is VM j’s total performance degradation, t0 refers to the time when the migration starts, Tm j
is the time taken to complete the migration, u j(t) is the CPU utilization at time t. M j is the amountof memory used by VM j and B j is the network bandwidth. The smaller the memory of VM to bemigrated, the smaller the migration time and the smaller the impact on the system.
2.2.3. SLA Violation (SLAV) Metric
In a cloud environment, since many users are competing for resources, each cloud service providerneeds to ensure that the application requirements are met, which is usually defined in the form ofSLA [19]. It is defined as a violation of the SLA between the resource provider and the user when theperformance request of the resource exceeds the available capacity and the Equation (5) as follows:
SLAV =1J
J∑x=1
Tsx
Tax·
1N
N∑i=1
CdiCri
, (5)

Electronics 2020, 9, 314 6 of 19
where J is the number of hosts, Tsx is the total time that utilization of host x reach to 100% and Tax
is a lifetime (total time that the host is active) of the host x. When host utilization reaches 100%, theapplication performance is bounded by the host. N shows a number of VMs, Cdi estimated as 10%CPU utilization of VMi in all migrations. Cri is the total CPU requested by VMi.
Table 1 shows the parameter definitions that will be used in Section 3.
Table 1. Parameter Definition.
Parameter Description
H_i _[CPU/Mem]util CPU or memory utilization for a compute node in the migration trigger sectionH_i _Pre[CPU/Mem]util CPU or memory utilization for a compute node after the prediction in the migration trigger section
DCPU/DMem Difference between overload resource utilization and the upper thresholdOverloadHost Overload compute nodeVMtomigrate Selected VM to be migrated from Overload Host
VMk_[CPU/Mem] CPU or memory utilization of VMkVMk−[CPU/Mem] Difference between VMk_[CPU/Mem] and DCPU/DMem
Hostlistidle Compute nodes in the threshold range after predictionhj−[CPU/Mem] CPU or memory utilization for computing node from Hostlistidle
hostidx Selected target compute node
3. Migration Strategy Description
A dual threshold adaptive (DTA) dynamic migration strategy proposed in this paper is dividedinto three parts: (1) adaptive trigger migration strategy based on Kalman filter algorithm prediction;(2) the selection of VM to be migrated; and (3), the selection of target physical node. These parts will bediscussed in the following sections.
3.1. Adaptive Trigger Migration Strategy based on Kalman Filter Algorithm Prediction
It is necessary to monitor the running state of each physical compute node and set migrationconditions for the resource state to determine whether the dynamic migration should be triggeredor not. In this paper, the upper threshold is set to alleviate the problem that the physical serverincreases energy consumption and SLA violations because of the high load, so as to ensure that theresource utilization of the running node in the pool meets the demand on the basis of saving energyconsumption. Set a lower threshold and migrate the VM on the compute nodes elsewhere and shutdown or sleep the physical server to reduce the energy consumption of the physical cluster, when theserver utilization is below the threshold. Because the resource utilization of physical servers is notstable, the CPU or memory utilization at a certain time may cause unnecessary migration due to toohigh or too low condition, result in a waste of system energy consumption. In this paper, the Kalmanfilter algorithm is used to predict the resource utilization, which only a small amount of data is neededto get the predicted starting point (the more data will make the result better). It can adjust itself andautomatically set the parameters from continuous observation. Because the server resource utilizationis instantaneous, the use of prediction technology can effectively prevent the invalid migration ofvirtual resource. The predicted migration trigger strategy based on the Kalman filter algorithm is usedto determine whether the server resource utilization is higher or lower than the threshold.
Kalman filter takes the least mean square error as the best criterion to find a set of recursiveestimation models. The basic idea is to use the state space model of signal and noise, to update theestimation of state variables by the estimated value of the previous time and the observed value of thepresent time and to find the estimated value of the occurrence time. The estimator is considered as alinear system and γ(k) represents the resource utilization of the server in the migration strategy at thecurrent time.
Firstly, the predicted value γ̃(k) is set as the optimal estimation of the previous state with Equation(6), where γ̂(k−1) is the last estimated resource utilization.
γ̃(k) = γ̂(k−1). (6)

Electronics 2020, 9, 314 7 of 19
Then, the estimated value of the current time is calculated by Equation (7). Where γ(k) is theobservation of the current time. Kg(k) is the Kalman gain and calculated by the Equation (8) andEquation (9):
γ̂(k) = γ̃(k) + Kg(k)[γ(k) − γ̃(k)] (7)
Kg(k) =P̃(k)
P̃(k)+R(8)
P̃(k) =P(k− 1)+Q, (9)
where R and Q are the variances of system noise and observation noise, respectively. P(k) representsthe deviation of the filter and is updated by Equation (10) to continue iteratively filter.
P(k) = (1−Kg
(k))P̃(k). (10)
The migration strategy proposed in this paper is to judge the relationship between resourceutilization and threshold combined with prediction. A detailed process is shown in Figure 3 as atrigger flow. In the proposed trigger strategy, the load utilization of each compute node is polled firstto monitor and the CPU and memory utilization are used as the trigger migration criteria. Then judgethe relationship of utilization and the threshold. If one or more parameters are not within the thresholdrange, use the prediction model to determine the relationship between the load utilization and thethreshold at the next moment. If the predicted value exceeds the upper threshold, the compute node isconsidered overloaded and calculate DCPU/DMem, which is the difference between overload resourceutilization and the upper threshold. Otherwise, the strategy enters the underload judgment processwith prediction model. If the predicted value is below the lower threshold, the node is identified as theunderload node.
Electronics 2020, 9, 314 7 of 17
( )=(1- ( )) ( )P k Kg k P k . (10)
The migration strategy proposed in this paper is to judge the relationship between resource
utilization and threshold combined with prediction. A detailed process is shown in Figure 3 as a
trigger flow. In the proposed trigger strategy, the load utilization of each compute node is polled first
to monitor and the CPU and memory utilization are used as the trigger migration criteria. Then judge
the relationship of utilization and the threshold. If one or more parameters are not within the
threshold range, use the prediction model to determine the relationship between the load utilization
and the threshold at the next moment. If the predicted value exceeds the upper threshold, the
compute node is considered overloaded and calculate CPU Mem
D /D ,which is the difference between
overload resource utilization and the upper threshold. Otherwise, the strategy enters the underload
judgment process with prediction model. If the predicted value is below the lower threshold, the
node is identified as the underload node.
information statistics of computing node i
Comparison with upper thresholdH_i_CPUutil>Upper_CPU_Threshold
H_i_Memutil>Upper_Mem_Threshold
Y
N
Trigger overload migration
Comparison with lower thresholdH_i_CPUUtil<Lower_CPU_Threshold
H_i_MemUtil<Lower_Mem_Threshold
Y
Underloaded node
Overload judgement Underload judgment
N
Start
Trigger underload migration
Karman data prediction information statistics
H_i_PreCPUutilH_i_PreMemutil
Overload nodeCalculate the deviation from the threshold
CPU/MemD =H_i_[CPU/Mem]util - Upper_[CPU/Mem]_ Threshold
Comparison of the predicted value with upper threshold
H_i_PreCPUutil>Upper_CPU_Threshold
H_i_PreMemutil>Upper_Mem_Threshold
Y
Y
Karman data prediction information statistics
H_i_PreCPUutilH_i_PreMemutil
Comparison of the predictedvalue with lower threshold
H_i_PreCPUUtil<Lower_CPU_ThresholdH_i_PreMemUtil<Lower_Mem_Threshold
NN
Figure 3. Dual threshold migration trigger process based on Kalman filter algorithm.
To implement a migration strategy, the VM to be migrated is selected from the
overload/underload compute node according to the VM selection strategy from Section 3.2 and then
the target server node to be migrated is determined from Section 3.3 to realize dynamic migrations.
The strategy proposed defines the triggering of overload as three cases. (a) type 0: both CPU and
memory utilization exceed the upper threshold, (b) type 1: only CPU utilization exceeds the upper
threshold and (c) type 2: only memory utilization exceeds the upper threshold. If one or more
utilization parameters are below the lower threshold, the dynamic migration is triggered and the
underload node is shut down to reduce energy consumption. If all the parameters are within the
threshold range, it is considered normal and then enters the next round of judgment process.
3.2. The Selection of VM to be Migrated (DTA-VM Selection)
Once the overload compute node is detected, the next step is to select VMs to migrate from the
node to avoid performance degradation. In this paper, a VM selection strategy (DTA-VM selection)
is proposed. Firstly, the VM with the least number of migrations is selected and then, in the selected
VM subset, the strategy selects the VM with the minimum migration time. The migration time can be
Figure 3. Dual threshold migration trigger process based on Kalman filter algorithm.
Electronics 2020, 9, 314 8 of 19
To implement a migration strategy, the VM to be migrated is selected from the overload/underloadcompute node according to the VM selection strategy from Section 3.2 and then the target server nodeto be migrated is determined from Section 3.3 to realize dynamic migrations. The strategy proposeddefines the triggering of overload as three cases. (a) type 0: both CPU and memory utilization exceedthe upper threshold, (b) type 1: only CPU utilization exceeds the upper threshold and (c) type 2: onlymemory utilization exceeds the upper threshold. If one or more utilization parameters are below thelower threshold, the dynamic migration is triggered and the underload node is shut down to reduceenergy consumption. If all the parameters are within the threshold range, it is considered normal andthen enters the next round of judgment process.
3.2. The Selection of VM to be Migrated (DTA-VM Selection)
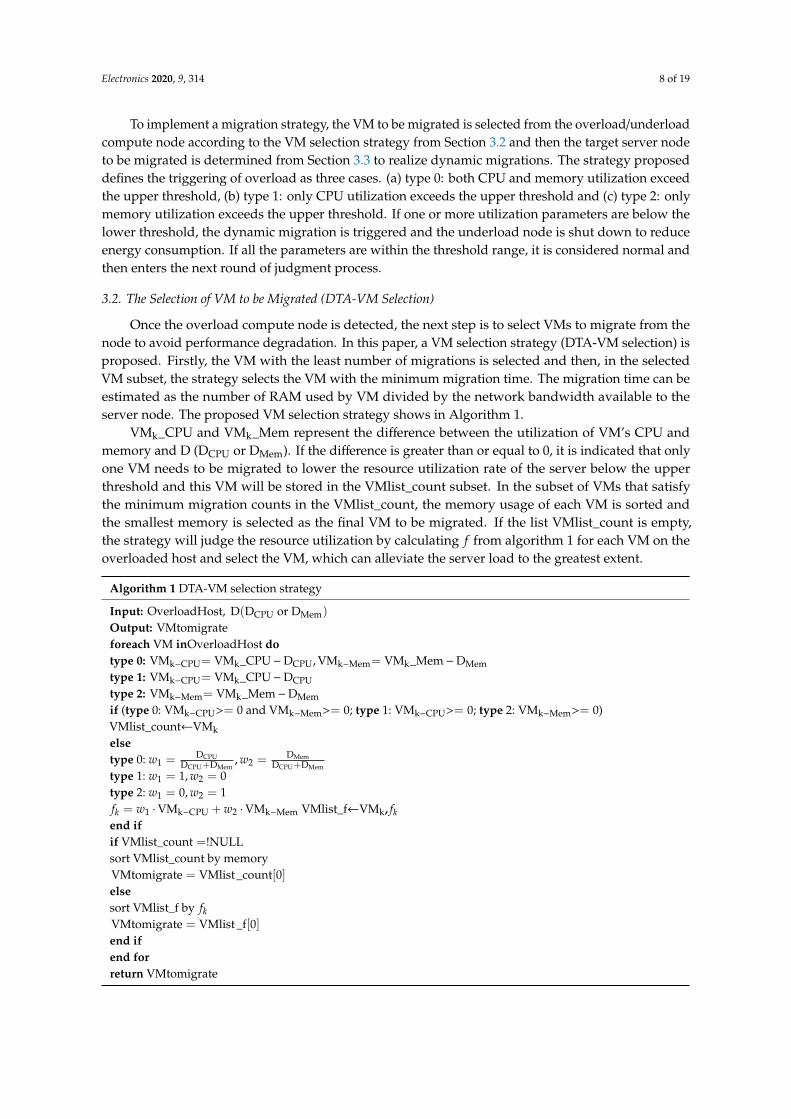
Once the overload compute node is detected, the next step is to select VMs to migrate from thenode to avoid performance degradation. In this paper, a VM selection strategy (DTA-VM selection) isproposed. Firstly, the VM with the least number of migrations is selected and then, in the selectedVM subset, the strategy selects the VM with the minimum migration time. The migration time can beestimated as the number of RAM used by VM divided by the network bandwidth available to theserver node. The proposed VM selection strategy shows in Algorithm 1.
VMk_CPU and VMk_Mem represent the difference between the utilization of VM’s CPU andmemory and D (DCPU or DMem). If the difference is greater than or equal to 0, it is indicated that onlyone VM needs to be migrated to lower the resource utilization rate of the server below the upperthreshold and this VM will be stored in the VMlist_count subset. In the subset of VMs that satisfythe minimum migration counts in the VMlist_count, the memory usage of each VM is sorted andthe smallest memory is selected as the final VM to be migrated. If the list VMlist_count is empty,the strategy will judge the resource utilization by calculating f from algorithm 1 for each VM on theoverloaded host and select the VM, which can alleviate the server load to the greatest extent.
Algorithm 1 DTA-VM selection strategy
Input: OverloadHost, D(DCPU or DMem)
Output: VMtomigrateforeach VM inOverloadHost dotype 0: VMk−CPU= VMk_CPU−DCPU, VMk−Mem= VMk_Mem−DMemtype 1: VMk−CPU= VMk_CPU−DCPUtype 2: VMk−Mem= VMk_Mem−DMemif (type 0: VMk−CPU>= 0 and VMk−Mem>= 0; type 1: VMk−CPU>= 0; type 2: VMk−Mem>= 0)VMlist_count←VMkelsetype 0: w1 = DCPU
DCPU+DMem, w2 = DMem
DCPU+DMem
type 1: w1 = 1, w2 = 0type 2: w1 = 0, w2 = 1fk = w1 ·VMk−CPU + w2 ·VMk−Mem VMlist_f←VMk, fkend ifif VMlist_count =!NULLsort VMlist_count by memoryVMtomigrate = VMlist _count[0]elsesort VMlist_f by fkVMtomigrate = VMlist _f[0]end ifend forreturn VMtomigrate

Electronics 2020, 9, 314 9 of 19
When the compute node triggers migration because of too low load, the VM selection is notneeded because all the VMs in the node are then directly migrated and this node will be closed in orderto save energy.
3.3. The Selection of Target Physical Node (DTA-Target Selection)
When the Nova_Scheduler module selects the target node in the OpenStack, it selects the nodewhich meets the requirements of VM resources and has the most memory surplus, regardless of otherfactors. Therefore, the strategy of selecting the target server node proposed in this paper takes intoaccount not only the current CPU and memory usage of the server node but also the resource usage ofthe target node after the migration of the VM. The target compute node selection strategy is proposedbased on Kalman filter prediction, which gives priority to select the nodes in the set within the normalthreshold range to reduce the computational workload.
The target node selection strategy shows in Algorithm 2, for each other server node in thecloud-based BBU pool, to avoid unnecessary migration, prediction technology is used to predictthe resource utilization of the running nodes that can accept migration in the pool. Only when thepredicted values are within the threshold range, the size of the decision value F from algorithm 2 ofCPU and memory utilization will be sorted and the sorted server list will be returned. The servernode listed first is the most suitable target node. The calculation of the F value is similar to f in theprevious section and there are also three cases. The selection of the target node in the case of underloadis performed according to type 0.
Algorithm 2 DTA-Target selection strategy
Input: VMtomigrate, Hostlistidle, D(DCPU or DMem)
Output: hostidxforeach host in Hostlistidle = {h 1, h2, , , hj
}do
if hj_ CPU + VM_CPU < Upper_CPU _Threshold andhj_ CPU + VM_CPU < Upper_CPU _Threshold
for Hostlistidle = {h 1, h2, , , hj}
do
type 0: w1 = DCPUDCPU+DMem
, w2 = DMemDCPU+DMem
,type 1: w1 = 1, w2 = 0type 2: w1 = 0, w2 = 1F j = w1 · hj−CPU + w2 · hj −Memmin = max.valueif F j < min thenmin =F jhostidx = hjend ifend forend ifend forreturn hostidx
4. Simulation and Results
4.1. Experimental Environment
The DTA dynamic migration strategy proposed in this paper is firstly simulated and comparedon Cloudsim and then applied to the OpenStack cloud platform for concrete implementation.CloudSim [20] is a cloud environment simulation software that can simulate virtualized and cloud-basedentities, such as data centers, VMs and physical hosts, to model and simulate a cloud computingsystem. Based on Cloudsim, we can implement different resource allocation strategies and evaluatestrategy performance. OpenStack [21] is an open source project developed jointly by NASA and

Electronics 2020, 9, 314 10 of 19
Rackspace to provide software for building and managing public and private clouds through whichany company or individual can build a cloud computing environment. OpenStack is the software ofthe cloud computing IaaS layer, which provides an infrastructure solution for the needs of scalableprivate and public clouds of all sizes.
(1) The hardware used in the Cloudsim simulation experiment is a laptop with a pre-installedWindows 10 (64-bit) operating system (CPU type: Intel Core i5-7300HQ, memory 8G). BecauseCloudSim is based on Java, Eclipse is selected as its operating platform. In this paper, JDK1.8 andEclipse 4.1.1 are downloaded and simulated with the version of CloudSim5.0. A virtual BBU pool,including 300 physical servers and 1000 VMs, is created based on the constructed simulation platform.The processing power per server node is based on 2000 MIPS and 4000 MIPS and the processing powerallocation per VM is based on 1000 MIPS, 2000MIPS and 3000 MIPS. VMs are assigned to odd ordinalhosts in order and then to even ordinal hosts. The number of tasks submitted by user is 1500 and isassigned to the VM in sequence. The detailed experimental parameters are shown in Table 2.
Table 2. Detailed experimental parameters.
Parameter Value Unit
Number of hosts 300 /Hosts’ CPU capacity 2000, 4000 MIPSHosts’ memory size 4096, 6144 MB
Number of VMs 1000 /VMs’ CPU capacity 1000, 2000, 3000 MIPSVMs’ memory size 256, 512, 1024 MBNumber of tasks 1500 /Length of tasks 108,000,000 /
The simulation set running time is 12 hours and the scheduling interval is 300 seconds andsystem resource usage update, operation information collection and VM scheduling are performed. Inorder to verify the effectiveness of the proposed strategy, it is necessary to compare and analyze theexisting VM selection and the target node selection strategy. In this experiment, firstly, the followingthree VM selection strategies are compared with DTA-VM selection strategy: Maximum Correlation(MC) strategy, Minimum Utilization (MU) strategy and Random Selection (RS) [9] strategy. Then, theproposed DTA-Target node strategy is compared with the IQR, LR and the most memory remainingstrategy for OpenStack.
(2) In this experiment, the BBU pool based on the OpenStack cloud environment was builtcomposed of four physical servers. One of them acts as a cloud controller and the other three serversact as compute nodes in this cloud environment. The experimental architecture is shown in Figure 4.
The controller node acts as the whole controller, responsible for controlling resources and thecompute nodes act as a resource computing and storage resource node in the cloud environment.Through multi-node deployment, the server hardware failure can be dealt with without much difficultyor the dynamic migration of VM can be performed without interfering with the client. Keystone, Nova,Glance, Neutron, Horizon and Cinder components of OpenStack are deployed on the control node,where Nova can implement management of virtual BBU pools such as creating VMs and implementingdynamic migration operations. OpenStack uses the web graphical interface or command line tocontrol the entire cloud-based BBU pool. In this experimental deployment architecture, each serveris configured with two network interfaces. The private network segment is made up of interface1,allowing each component of OpenStack to communicate with each other and the service provided bythe cloud environment is provided by interface2, realizing the connection with the Internet.
In the cloud system, node clusters implement SSH mutual access without password and dynamicmigration is achieved through shared storage. In this scenario, VM instances are stored in sharedstorage and migration is mainly the migration of instance memory status, which greatly improves themigration speed. In this experiment, the dynamic migration mode is set to the pre-copy mode and

Electronics 2020, 9, 314 11 of 19
there is no real implementation of BBU related protocols on the VMs. BBU performs operations suchas baseband processing or RRH return signal processing, which has a load effect on the VMs. Thiseffect can be simulated by the script running on the VMs. The script implements CPU and memorypressure operation, simulates the dynamic load changes brought by BBU performing signal processingprotocol and other functions. In the implementation, controller and compute nodes are installed in theubntu16.04 64-bit operating system. In the OpenStack experimental environment, the controller nodeis deployed on an intel i5-6500, 12G memory, x86-architecture server with dual network cards. TwelveVMs (ubntu16.04 64-bit OS) are set up and Table 3 shows the deployment of VMs and compute nodesbefore implementing the migration strategy proposed in the paper.
Electronics 2020, 9, 314 10 of 17
platform. The processing power per server node is based on 2000 MIPS and 4000 MIPS and the
processing power allocation per VM is based on 1000 MIPS, 2000MIPS and 3000 MIPS. VMs are
assigned to odd ordinal hosts in order and then to even ordinal hosts. The number of tasks submitted
by user is 1500 and is assigned to the VM in sequence. The detailed experimental parameters are
shown in Table 2.
Table 2. Detailed experimental parameters.
Parameter Value Unit
Number of hosts 300 /
Hosts’ CPU capacity 2000,4000 MIPS
Hosts’ memory size 4096,6144 MB
Number of VMs 1000 /
VMs’ CPU capacity 1000,2000,3000 MIPS
VMs’ memory size 256,512,1024 MB
Number of tasks 1500 /
Length of tasks 108,000,000 /
The simulation set running time is 12 hours and the scheduling interval is 300 seconds and
system resource usage update, operation information collection and VM scheduling are performed.
In order to verify the effectiveness of the proposed strategy, it is necessary to compare and analyze
the existing VM selection and the target node selection strategy. In this experiment, firstly, the
following three VM selection strategies are compared with DTA-VM selection strategy: Maximum
Correlation (MC) strategy, Minimum Utilization (MU) strategy and Random Selection (RS) [9]
strategy. Then, the proposed DTA-Target node strategy is compared with the IQR, LR and the most
memory remaining strategy for OpenStack.
(2) In this experiment, the BBU pool based on the OpenStack cloud environment was built
composed of four physical servers. One of them acts as a cloud controller and the other three servers
act as compute nodes in this cloud environment. The experimental architecture is shown in Figure 4.
Controller Node
Keystone
Nova
Glance Neutron
Horizon
Cinder
NAT
Internet
Interface 1
Interface 2
Compute Node 1
NovaNeutron
KVM
VM 1 VM N...
Interface 1
Interface 2
Compute Node 2
NovaNeutron
KVM
VM 1 VM N...
Interface 1
Interface 2
Compute Node 3
NovaNeutron
KVM
VM 1 VM N...
Interface 1
Interface 2
Figure 4. Experimental architecture
The controller node acts as the whole controller, responsible for controlling resources and the
compute nodes act as a resource computing and storage resource node in the cloud environment.
Figure 4. Experimental architecture.
Table 3. The deployment information of VMs and compute nodes.
Compute Node VM ID VCPU Ram(M) Disk(G)
Compute1CPU: Intel Core
i7-8700RAM:16G
x86 architecture
1 2 1024 102 2 1024 104 1 2048 207 1 1024 5
Compute2CPU: Intel Core
i7-4770RAM:8G
x86 architecture
3 2 1024 106 1 512 510 1 1024 1012 2 512 5
Compute3CPU: Intel Xeon
E5-2643RAM:128G
x86 architecture
5 1 1024 20
8 2 2048 10
9 1 1024 10

Electronics 2020, 9, 314 12 of 19
4.2. Experimental Results and Analysis
4.2.1. Simulation of Migration Strategy on Cloudsim
In order to compare the performance of the proposed migration strategy with that of the existingalgorithms, we consider four indicators: the total energy consumption of the BBU pool when performingthe work, SLA violation, the total migration number when the dynamic migration occurs and thedynamic migration time.
The first group: First Fit is the default target host placing method. Under the host detectionstrategy (Mad, Iqr, Lr, Thr), DTA-VM selection is compared with the following three VM selectionstrategies—MC, MU and RS. The simulation results are shown in Figures 5–8, compared with theexisting strategy, DTA-VM selection effectively reduces energy consumption, SLA violations, thenumber of migration and migration time. In terms of SLA violations and the number of migrations,DTA-VM selection is reduced by more than 50% compared to MU and the effect is reduced by abouthalf in terms of migration time compared to the other three selection algorithms. Because DTA-VMselection achieves load balancing with as few number of migration and migration times as possible,the consumption caused by migration and SLA violations can be reduced.
Electronics 2020, 9, 314 12 of 17
DTA-VM selection is reduced by more than 50% compared to MU and the effect is reduced by about
half in terms of migration time compared to the other three selection algorithms. Because DTA-VM
selection achieves load balancing with as few number of migration and migration times as possible,
the consumption caused by migration and SLA violations can be reduced.
Figure 5. Energy consumption of DTA-VM selection.
Figure 6. SLA violation of DTA-VM selection.
Figure 7. Number of migrations of DTA-VM selection.
Mad Iqr Lr Thr220
240
260
280
300
320
340
360
380
400
420
Energy Consumption (kWh)
mc mu rs DTA-VM selection
Mad Iqr Lr Thr0.000
0.002
0.004
0.006
0.008
0.010
0.012
0.014
0.016
0.018
0.020
0.022
SLA violation (%)
mc mu rs DTA-VM selection
Mad Iqr Lr Thr0
2000
4000
6000
8000
10000
12000
14000
16000
18000
20000
22000
24000
26000
28000
30000
32000
Number of VM migrations
mc mu rs DTA-VM selection
Figure 5. Energy consumption of DTA-VM selection.
Electronics 2020, 9, 314 12 of 17
DTA-VM selection is reduced by more than 50% compared to MU and the effect is reduced by about
half in terms of migration time compared to the other three selection algorithms. Because DTA-VM
selection achieves load balancing with as few number of migration and migration times as possible,
the consumption caused by migration and SLA violations can be reduced.
Figure 5. Energy consumption of DTA-VM selection.
Figure 6. SLA violation of DTA-VM selection.
Figure 7. Number of migrations of DTA-VM selection.
Mad Iqr Lr Thr220
240
260
280
300
320
340
360
380
400
420
Energy Consumption (kWh)
mc mu rs DTA-VM selection
Mad Iqr Lr Thr0.000
0.002
0.004
0.006
0.008
0.010
0.012
0.014
0.016
0.018
0.020
0.022
SLA violation (%)
mc mu rs DTA-VM selection
Mad Iqr Lr Thr0
2000
4000
6000
8000
10000
12000
14000
16000
18000
20000
22000
24000
26000
28000
30000
32000
Number of VM migrations
mc mu rs DTA-VM selection
Figure 6. SLA violation of DTA-VM selection.

Electronics 2020, 9, 314 13 of 19
Electronics 2020, 9, 314 12 of 17
DTA-VM selection is reduced by more than 50% compared to MU and the effect is reduced by about
half in terms of migration time compared to the other three selection algorithms. Because DTA-VM
selection achieves load balancing with as few number of migration and migration times as possible,
the consumption caused by migration and SLA violations can be reduced.
Figure 5. Energy consumption of DTA-VM selection.
Figure 6. SLA violation of DTA-VM selection.
Figure 7. Number of migrations of DTA-VM selection.
Mad Iqr Lr Thr220
240
260
280
300
320
340
360
380
400
420
Energy Consumption (kWh)
mc mu rs DTA-VM selection
Mad Iqr Lr Thr0.000
0.002
0.004
0.006
0.008
0.010
0.012
0.014
0.016
0.018
0.020
0.022
SLA violation (%)
mc mu rs DTA-VM selection
Mad Iqr Lr Thr0
2000
4000
6000
8000
10000
12000
14000
16000
18000
20000
22000
24000
26000
28000
30000
32000
Number of VM migrations
mc mu rs DTA-VM selection
Figure 7. Number of migrations of DTA-VM selection.Electronics 2020, 9, 314 13 of 17
Figure 8. Migration time of DTA-VM selection.
The second group: based on the proposed strategy (DTA-VM selection), MC, MU and RS VM
selection strategy, the proposed DTA-Target selection and First Fit and OpenStack "maximum
memory remaining" strategy are compared and analyzed for performance. As shown in Figures 9–
12, the DTA-Target selection proposed is not much different in terms of energy consumption.
However, the performance of the target node is reduced by more than 50% in terms of SLA violation;
and compared with the performance of the number of migration and migration time, DTA-Target
selection is far lower than the existing two strategies. This is because DTA-Target selection can
comprehensively consider the resource state and predict the status of the VM migration to the target
node to reduce consumption and SLAV caused by repeated migration.
In summary, when the DTA-VM selection and DTA-Target selection proposed in this paper
work together, the above four performances can obtain more desirable effects. The simulation on
Cloudsim can prove that the DTA dynamic migration strategy has a significant improvement in
performance.
Figure 9. Energy consumption of DTA-Target selection.
Figure 10. SLA violation of DTA-Target selection.
Mad Iqr Lr Thr0
2
4
6
8
10
Mean migration time (s)
mc mu rs DTA-VM selection
First-fit OpenStack DTA-Target selection300
325
350
375
400
425
450
Energy Consumption (kWh)
mc mu rs DTA-VM selection
First-fit OpenStack DTA-Target selection0.0000
0.0005
0.0010
0.0015
0.0020
0.0025
0.0030
SLA violation (%)
mc mu rs DTA-VM selection
Figure 8. Migration time of DTA-VM selection.
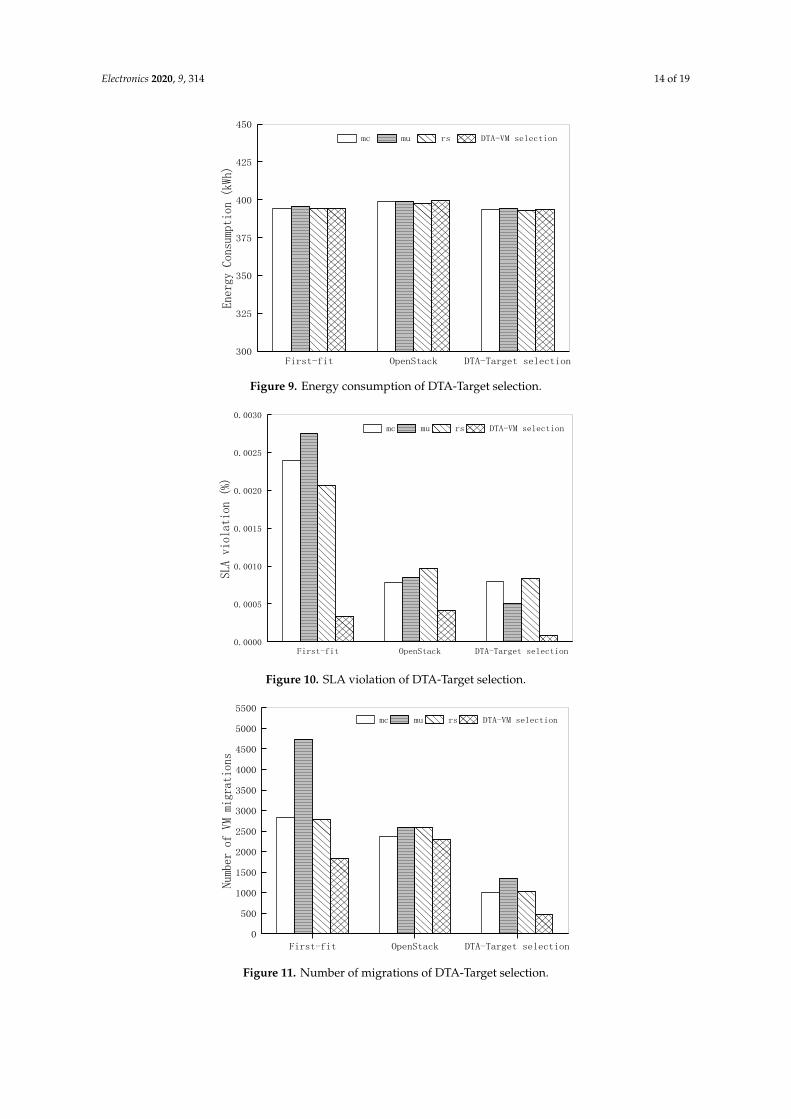
The second group: based on the proposed strategy (DTA-VM selection), MC, MU and RS VMselection strategy, the proposed DTA-Target selection and First Fit and OpenStack "maximum memoryremaining" strategy are compared and analyzed for performance. As shown in Figures 9–12, theDTA-Target selection proposed is not much different in terms of energy consumption. However, theperformance of the target node is reduced by more than 50% in terms of SLA violation; and comparedwith the performance of the number of migration and migration time, DTA-Target selection is far lowerthan the existing two strategies. This is because DTA-Target selection can comprehensively considerthe resource state and predict the status of the VM migration to the target node to reduce consumptionand SLAV caused by repeated migration.
Electronics 2020, 9, 314 14 of 19
Electronics 2020, 9, 314 13 of 17
Figure 8. Migration time of DTA-VM selection.
The second group: based on the proposed strategy (DTA-VM selection), MC, MU and RS VM
selection strategy, the proposed DTA-Target selection and First Fit and OpenStack "maximum
memory remaining" strategy are compared and analyzed for performance. As shown in Figures 9–
12, the DTA-Target selection proposed is not much different in terms of energy consumption.
However, the performance of the target node is reduced by more than 50% in terms of SLA violation;
and compared with the performance of the number of migration and migration time, DTA-Target
selection is far lower than the existing two strategies. This is because DTA-Target selection can
comprehensively consider the resource state and predict the status of the VM migration to the target
node to reduce consumption and SLAV caused by repeated migration.
In summary, when the DTA-VM selection and DTA-Target selection proposed in this paper
work together, the above four performances can obtain more desirable effects. The simulation on
Cloudsim can prove that the DTA dynamic migration strategy has a significant improvement in
performance.
Figure 9. Energy consumption of DTA-Target selection.
Figure 10. SLA violation of DTA-Target selection.
Mad Iqr Lr Thr0
2
4
6
8
10
Mean migration time (s)
mc mu rs DTA-VM selection
First-fit OpenStack DTA-Target selection300
325
350
375
400
425
450
Energy Consumption (kWh)
mc mu rs DTA-VM selection
First-fit OpenStack DTA-Target selection0.0000
0.0005
0.0010
0.0015
0.0020
0.0025
0.0030
SLA violation (%)
mc mu rs DTA-VM selection
Figure 9. Energy consumption of DTA-Target selection.
Electronics 2020, 9, 314 13 of 17
Figure 8. Migration time of DTA-VM selection.
The second group: based on the proposed strategy (DTA-VM selection), MC, MU and RS VM
selection strategy, the proposed DTA-Target selection and First Fit and OpenStack "maximum
memory remaining" strategy are compared and analyzed for performance. As shown in Figures 9–
12, the DTA-Target selection proposed is not much different in terms of energy consumption.
However, the performance of the target node is reduced by more than 50% in terms of SLA violation;
and compared with the performance of the number of migration and migration time, DTA-Target
selection is far lower than the existing two strategies. This is because DTA-Target selection can
comprehensively consider the resource state and predict the status of the VM migration to the target
node to reduce consumption and SLAV caused by repeated migration.
In summary, when the DTA-VM selection and DTA-Target selection proposed in this paper
work together, the above four performances can obtain more desirable effects. The simulation on
Cloudsim can prove that the DTA dynamic migration strategy has a significant improvement in
performance.
Figure 9. Energy consumption of DTA-Target selection.
Figure 10. SLA violation of DTA-Target selection.
Mad Iqr Lr Thr0
2
4
6
8
10
Mean migration time (s)
mc mu rs DTA-VM selection
First-fit OpenStack DTA-Target selection300
325
350
375
400
425
450
Energy Consumption (kWh)
mc mu rs DTA-VM selection
First-fit OpenStack DTA-Target selection0.0000
0.0005
0.0010
0.0015
0.0020
0.0025
0.0030
SLA violation (%)
mc mu rs DTA-VM selection
Figure 10. SLA violation of DTA-Target selection.Electronics 2020, 9, 314 14 of 17
Figure 11. Number of migrations of DTA-Target selection.
Figure 12. Migration time of DTA-Target selection.
4.2.2. The experiment of Migration Strategy on OpenStack
In order to simulate the effect of dynamic change of load, this experiment based on the
OpenStack cloud platform, the VMs with the ID number of 1–6,8 and 12 are tested for irregular CPU
or memory stress tests, respectively. The experimental observation time is 270 minutes and the
migration strategy deployed on the controller node polls and monitors the resource utilization of
compute nodes every 60 seconds. According to the prediction of the Kalman filter algorithm and the
manually set upper and lower limit threshold, it is determined whether dynamic migration is needed
or not. In this paper, two groups of experiments are carried out, namely, the upper threshold overload
migration and the lower threshold underload migration. The upper and lower threshold values are
80% and 10%, respectively. The dynamic variation of CPU and memory utilization over time is shown
in Figures 13–15, which show the experimental results of the dynamic migration of upper and lower
threshold in the migration strategy, respectively. This experiment is mainly to verify the feasibility of
the dynamic migration strategy. There will be a short and unavoidable interruption in the migration
process of the VMs, which will be studied in detail in the future work.
In the initial stage of the experiment, continuous CPU and memory stress test scripts are
executed for all the VMs on the nodes. As can be seen from the Figure 13, the resource (CPU and
memory) utilization of the three compute nodes is in a steady state in the first 30 minutes. After 30
minutes, keep compute1 and compute2 unchanged, perform a more intense load pressure script on
compute2 and the CPU and memory utilization of compute2 are on the rise. Both CPU and memory
utilization of compute2 exceeds the upper threshold in about 20 minutes and it does not migrate
immediately. Similarly, in about 125 minutes, the CPU utilization of compute1 exceeds the upper
limit threshold but does not migrate immediately according to the prediction. This is because the
resource utilization exceeds the upper threshold is temporary at these two times and the unnecessary
migration operation is avoided based on the Kalman prediction algorithm. Starting from about 70
minutes, the CPU utilization of compute2 exceeded the upper threshold again. Combined with
Kalman’s prediction, the dynamic migration of VM is carried out in accordance with the
First-fit OpenStack DTA-Target selection0
500
1000
1500
2000
2500
3000
3500
4000
4500
5000
5500
Number of VM migrations
mc mu rs DTA-VM selection
First-fit OpenStack DTA-Target selection0
2
4
6
8
10
12
Mean migration time (s)
mc mu rs DTA-VM selection
Figure 11. Number of migrations of DTA-Target selection.
Electronics 2020, 9, 314 15 of 19
Electronics 2020, 9, 314 14 of 17
Figure 11. Number of migrations of DTA-Target selection.
Figure 12. Migration time of DTA-Target selection.
4.2.2. The experiment of Migration Strategy on OpenStack
In order to simulate the effect of dynamic change of load, this experiment based on the
OpenStack cloud platform, the VMs with the ID number of 1–6,8 and 12 are tested for irregular CPU
or memory stress tests, respectively. The experimental observation time is 270 minutes and the
migration strategy deployed on the controller node polls and monitors the resource utilization of
compute nodes every 60 seconds. According to the prediction of the Kalman filter algorithm and the
manually set upper and lower limit threshold, it is determined whether dynamic migration is needed
or not. In this paper, two groups of experiments are carried out, namely, the upper threshold overload
migration and the lower threshold underload migration. The upper and lower threshold values are
80% and 10%, respectively. The dynamic variation of CPU and memory utilization over time is shown
in Figures 13–15, which show the experimental results of the dynamic migration of upper and lower
threshold in the migration strategy, respectively. This experiment is mainly to verify the feasibility of
the dynamic migration strategy. There will be a short and unavoidable interruption in the migration
process of the VMs, which will be studied in detail in the future work.
In the initial stage of the experiment, continuous CPU and memory stress test scripts are
executed for all the VMs on the nodes. As can be seen from the Figure 13, the resource (CPU and
memory) utilization of the three compute nodes is in a steady state in the first 30 minutes. After 30
minutes, keep compute1 and compute2 unchanged, perform a more intense load pressure script on
compute2 and the CPU and memory utilization of compute2 are on the rise. Both CPU and memory
utilization of compute2 exceeds the upper threshold in about 20 minutes and it does not migrate
immediately. Similarly, in about 125 minutes, the CPU utilization of compute1 exceeds the upper
limit threshold but does not migrate immediately according to the prediction. This is because the
resource utilization exceeds the upper threshold is temporary at these two times and the unnecessary
migration operation is avoided based on the Kalman prediction algorithm. Starting from about 70
minutes, the CPU utilization of compute2 exceeded the upper threshold again. Combined with
Kalman’s prediction, the dynamic migration of VM is carried out in accordance with the
First-fit OpenStack DTA-Target selection0
500
1000
1500
2000
2500
3000
3500
4000
4500
5000
5500
Number of VM migrations
mc mu rs DTA-VM selection
First-fit OpenStack DTA-Target selection0
2
4
6
8
10
12
Mean migration time (s)
mc mu rs DTA-VM selection
Figure 12. Migration time of DTA-Target selection.
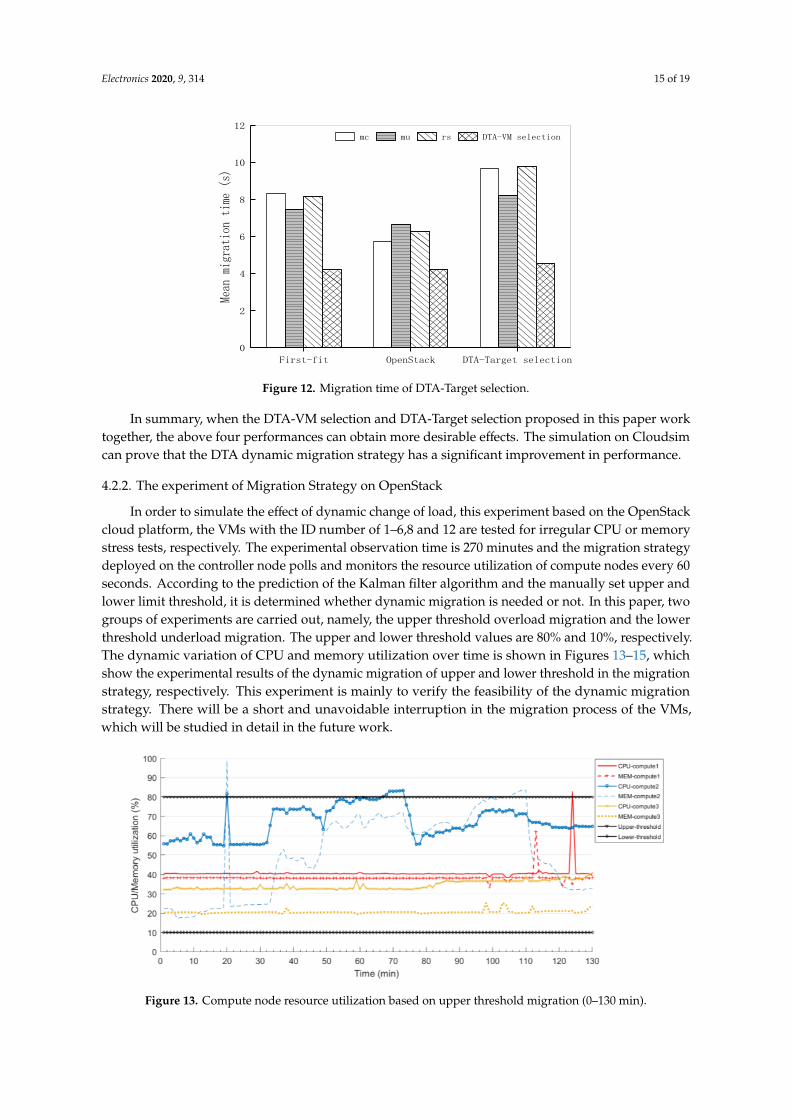
In summary, when the DTA-VM selection and DTA-Target selection proposed in this paper worktogether, the above four performances can obtain more desirable effects. The simulation on Cloudsimcan prove that the DTA dynamic migration strategy has a significant improvement in performance.
4.2.2. The experiment of Migration Strategy on OpenStack
In order to simulate the effect of dynamic change of load, this experiment based on the OpenStackcloud platform, the VMs with the ID number of 1–6,8 and 12 are tested for irregular CPU or memorystress tests, respectively. The experimental observation time is 270 minutes and the migration strategydeployed on the controller node polls and monitors the resource utilization of compute nodes every 60seconds. According to the prediction of the Kalman filter algorithm and the manually set upper andlower limit threshold, it is determined whether dynamic migration is needed or not. In this paper, twogroups of experiments are carried out, namely, the upper threshold overload migration and the lowerthreshold underload migration. The upper and lower threshold values are 80% and 10%, respectively.The dynamic variation of CPU and memory utilization over time is shown in Figures 13–15, whichshow the experimental results of the dynamic migration of upper and lower threshold in the migrationstrategy, respectively. This experiment is mainly to verify the feasibility of the dynamic migrationstrategy. There will be a short and unavoidable interruption in the migration process of the VMs,which will be studied in detail in the future work.
Electronics 2020, 9, 314 15 of 17
requirements of the migration strategy. The load utilization of compute2 has gradually increased and
the CPU utilization of compute2 exceeded the upper threshold again at around 70 minutes.
Combined with the prediction model to determine that compute2 is an overload node, the dynamic
migration of VM is carried out in accordance with the requirements of the migration strategy. At
about 105 minutes, the memory utilization of compute2 exceeded the upper threshold and a dynamic
migration was performed by Kalman's prediction. After the migration, the memory utilization rate
of compute2 drops significantly and the load utilization of compute2 returns to within the normal
threshold range.
Figure 13. Compute node resource utilization based on upper threshold migration (0–130 min).
Reducing the load pressure on compute2 in about 130 minutes, as can be seen in Figure 14, the
load situation of the computing node gradually becomes stable. From about 160 minutes, the load
pressure of compute2 is gradually increased again and both compute2's CPU and memory utilization
are above the upper threshold at about 175 minutes. Through the prediction, a dynamic migration
operation of the VM was performed. After the dynamic migration, the VM of compute2 migrates to
other idle compute nodes. After the dynamic migration strategy selection, the VM of compute2
migrates to compute3 node. It can be seen that the resource utilization of compute2 drops below the
upper threshold after the dynamic migration. Since the physical resources of the compute3 node are
very abundant, the load utilization of this node after the migration of the virtual machine has
increased slightly but it is not obvious.
Figure 14. Compute node resource utilization based on upper threshold migration (130–210 min).
Figure 15 shows resource utilization of compute nodes based on lower threshold migration of
OpenStack. In the experiment, the intensity of the load pressure script executed by the VMs on
compute2 and compute3 is not changed and compute1 gradually reduces the load pressure intensity.
From about 240 minutes, the CPU utilization of compute1 is below the lower threshold and the under-
load migration is determined. All VMs on the node are migrated to other nodes within the threshold
range. During the dynamic migration process, the VMs are migrated to compute2 and compute3.
After the migration process, the load utilization of the other two nodes has increased and the CPU
utilization of compute1 is close to 0 and the node is shut down to reduce the energy consumption of
the cloud-based BBU pool. The CPU utilization of compute3 is below the lower threshold in
Figure 13. Compute node resource utilization based on upper threshold migration (0–130 min).

Electronics 2020, 9, 314 16 of 19
Electronics 2020, 9, 314 15 of 17
requirements of the migration strategy. The load utilization of compute2 has gradually increased and
the CPU utilization of compute2 exceeded the upper threshold again at around 70 minutes.
Combined with the prediction model to determine that compute2 is an overload node, the dynamic
migration of VM is carried out in accordance with the requirements of the migration strategy. At
about 105 minutes, the memory utilization of compute2 exceeded the upper threshold and a dynamic
migration was performed by Kalman's prediction. After the migration, the memory utilization rate
of compute2 drops significantly and the load utilization of compute2 returns to within the normal
threshold range.
Figure 13. Compute node resource utilization based on upper threshold migration (0–130 min).
Reducing the load pressure on compute2 in about 130 minutes, as can be seen in Figure 14, the
load situation of the computing node gradually becomes stable. From about 160 minutes, the load
pressure of compute2 is gradually increased again and both compute2's CPU and memory utilization
are above the upper threshold at about 175 minutes. Through the prediction, a dynamic migration
operation of the VM was performed. After the dynamic migration, the VM of compute2 migrates to
other idle compute nodes. After the dynamic migration strategy selection, the VM of compute2
migrates to compute3 node. It can be seen that the resource utilization of compute2 drops below the
upper threshold after the dynamic migration. Since the physical resources of the compute3 node are
very abundant, the load utilization of this node after the migration of the virtual machine has
increased slightly but it is not obvious.
Figure 14. Compute node resource utilization based on upper threshold migration (130–210 min).
Figure 15 shows resource utilization of compute nodes based on lower threshold migration of
OpenStack. In the experiment, the intensity of the load pressure script executed by the VMs on
compute2 and compute3 is not changed and compute1 gradually reduces the load pressure intensity.
From about 240 minutes, the CPU utilization of compute1 is below the lower threshold and the under-
load migration is determined. All VMs on the node are migrated to other nodes within the threshold
range. During the dynamic migration process, the VMs are migrated to compute2 and compute3.
After the migration process, the load utilization of the other two nodes has increased and the CPU
utilization of compute1 is close to 0 and the node is shut down to reduce the energy consumption of
the cloud-based BBU pool. The CPU utilization of compute3 is below the lower threshold in
Figure 14. Compute node resource utilization based on upper threshold migration (130–210 min).
Electronics 2020, 9, 314 16 of 17
approximately 242 minutes and the dynamic migration is not required by the Kalman prediction. The
VMs on compute1 are migrated to compute2 and compute3 and the resource utilization of these two
compute nodes increases.
Figure 15. Compute node resource utilization based on lower threshold migration.
Due to the limited experimental conditions, there are only three compute nodes in the OpenStack
environment but through the above experiments, it can be seen that the system and strategy designed
in this paper are feasible. Combined with the simulation of the migration strategy used in the system
in the third section, the effectiveness of the migration strategy proposed in this paper can be proved.
5. Conclusions
In the virtual BBU pool, it is necessary to reduce energy consumption without affecting the
destruction of SLA. This paper proposes a dual threshold adaptive (DTA) dynamic migration
strategy, including a triggered migration mechanism based on Kalman filter prediction, DTA-VM
selection strategy and DTA-Target selection strategy, which can more accurately determine the
resource utilization of the servers in the BBU pool and trigger the migration. In the strategy, the
dynamic migration VM, from the overloaded host is selected based on the minimum number of
migration and minimum migration time to avoid the increase of energy consumption caused by the
multiple migrations of VM in the BBU pool. The DTA-Target selection strategy predicts whether the
resource performance of the VM after the migration meets the threshold requirements,
comprehensively considers the CPU and memory utilization and selects the target node to reduce the
migration failure caused by the lack of physical resources of the node after the VM migration.
Through the DTA migration strategy, adaptive dynamic migration can be realized to reduce energy
consumption and SLA violations in the BBU pool. The experimental results show that the DTA
migration strategy proposed in this paper has better performance in the cloud center. The migration
strategy is further realized in the BBU pool based on the OpenStack platform. Without manual
intervention, the change of the workload can be automatically responded and the energy
consumption is saved. In the future, the authors will do more in-depth research on the actual
deployment of the integration of BBU functions with OpenStack.
Author Contributions: W.C. proposed the basic framework of the research scenario. In addition, W.C. was in
charge of modeling the problem and proposed the migration strategy. C.Y. performed the simulations and wrote
the paper. Z.Z. provided suggestions for platform building. W.W gave some suggestions on the mathematical
model and formula derivation. All authors have read and agreed to the published version of the manuscript.
Funding: This work was supported by the Fundamental Research Funds for the Central Universities (2019RC05).
Conflicts of Interest: The authors declare no conflict of interest.
References
1. Mahapatra, B.; Kumar, R.; Kumar, S.; Turuk, A.K. A Heterogeneous Load Balancing Approach in
Centralized BBU-Pool of C-RAN Architecture. In Proceedings of the 2018 3rd International Conference for
Convergence in Technology (I2CT), Pune, India, 6–8 April 2018; pp. 1–5.
Figure 15. Compute node resource utilization based on lower threshold migration.
In the initial stage of the experiment, continuous CPU and memory stress test scripts are executedfor all the VMs on the nodes. As can be seen from the Figure 13, the resource (CPU and memory)utilization of the three compute nodes is in a steady state in the first 30 minutes. After 30 minutes,keep compute1 and compute2 unchanged, perform a more intense load pressure script on compute2and the CPU and memory utilization of compute2 are on the rise. Both CPU and memory utilizationof compute2 exceeds the upper threshold in about 20 minutes and it does not migrate immediately.Similarly, in about 125 minutes, the CPU utilization of compute1 exceeds the upper limit thresholdbut does not migrate immediately according to the prediction. This is because the resource utilizationexceeds the upper threshold is temporary at these two times and the unnecessary migration operationis avoided based on the Kalman prediction algorithm. Starting from about 70 minutes, the CPUutilization of compute2 exceeded the upper threshold again. Combined with Kalman’s prediction, thedynamic migration of VM is carried out in accordance with the requirements of the migration strategy.The load utilization of compute2 has gradually increased and the CPU utilization of compute2 exceededthe upper threshold again at around 70 minutes. Combined with the prediction model to determinethat compute2 is an overload node, the dynamic migration of VM is carried out in accordance with therequirements of the migration strategy. At about 105 minutes, the memory utilization of compute2exceeded the upper threshold and a dynamic migration was performed by Kalman’s prediction. Afterthe migration, the memory utilization rate of compute2 drops significantly and the load utilization ofcompute2 returns to within the normal threshold range.
Reducing the load pressure on compute2 in about 130 minutes, as can be seen in Figure 14, theload situation of the computing node gradually becomes stable. From about 160 minutes, the loadpressure of compute2 is gradually increased again and both compute2’s CPU and memory utilization

Electronics 2020, 9, 314 17 of 19
are above the upper threshold at about 175 minutes. Through the prediction, a dynamic migrationoperation of the VM was performed. After the dynamic migration, the VM of compute2 migratesto other idle compute nodes. After the dynamic migration strategy selection, the VM of compute2migrates to compute3 node. It can be seen that the resource utilization of compute2 drops below theupper threshold after the dynamic migration. Since the physical resources of the compute3 node arevery abundant, the load utilization of this node after the migration of the virtual machine has increasedslightly but it is not obvious.
Figure 15 shows resource utilization of compute nodes based on lower threshold migration ofOpenStack. In the experiment, the intensity of the load pressure script executed by the VMs oncompute2 and compute3 is not changed and compute1 gradually reduces the load pressure intensity.From about 240 minutes, the CPU utilization of compute1 is below the lower threshold and theunder-load migration is determined. All VMs on the node are migrated to other nodes within thethreshold range. During the dynamic migration process, the VMs are migrated to compute2 andcompute3. After the migration process, the load utilization of the other two nodes has increasedand the CPU utilization of compute1 is close to 0 and the node is shut down to reduce the energyconsumption of the cloud-based BBU pool. The CPU utilization of compute3 is below the lowerthreshold in approximately 242 minutes and the dynamic migration is not required by the Kalmanprediction. The VMs on compute1 are migrated to compute2 and compute3 and the resource utilizationof these two compute nodes increases.
Due to the limited experimental conditions, there are only three compute nodes in the OpenStackenvironment but through the above experiments, it can be seen that the system and strategy designedin this paper are feasible. Combined with the simulation of the migration strategy used in the systemin the third section, the effectiveness of the migration strategy proposed in this paper can be proved.
5. Conclusions
In the virtual BBU pool, it is necessary to reduce energy consumption without affecting thedestruction of SLA. This paper proposes a dual threshold adaptive (DTA) dynamic migration strategy,including a triggered migration mechanism based on Kalman filter prediction, DTA-VM selectionstrategy and DTA-Target selection strategy, which can more accurately determine the resource utilizationof the servers in the BBU pool and trigger the migration. In the strategy, the dynamic migration VM,from the overloaded host is selected based on the minimum number of migration and minimummigration time to avoid the increase of energy consumption caused by the multiple migrations of VMin the BBU pool. The DTA-Target selection strategy predicts whether the resource performance ofthe VM after the migration meets the threshold requirements, comprehensively considers the CPUand memory utilization and selects the target node to reduce the migration failure caused by thelack of physical resources of the node after the VM migration. Through the DTA migration strategy,adaptive dynamic migration can be realized to reduce energy consumption and SLA violations in theBBU pool. The experimental results show that the DTA migration strategy proposed in this paper hasbetter performance in the cloud center. The migration strategy is further realized in the BBU poolbased on the OpenStack platform. Without manual intervention, the change of the workload can beautomatically responded and the energy consumption is saved. In the future, the authors will do morein-depth research on the actual deployment of the integration of BBU functions with OpenStack.
Author Contributions: C.W. proposed the basic framework of the research scenario. In addition, C.W. was incharge of modeling the problem and proposed the migration strategy. Y.C. performed the simulations and wrotethe paper. Z.Z. provided suggestions for platform building. W.W. gave some suggestions on the mathematicalmodel and formula derivation. All authors have read and agreed to the published version of the manuscript.
Funding: This work was supported by the Fundamental Research Funds for the Central Universities (2019RC05).
Conflicts of Interest: The authors declare no conflict of interest.
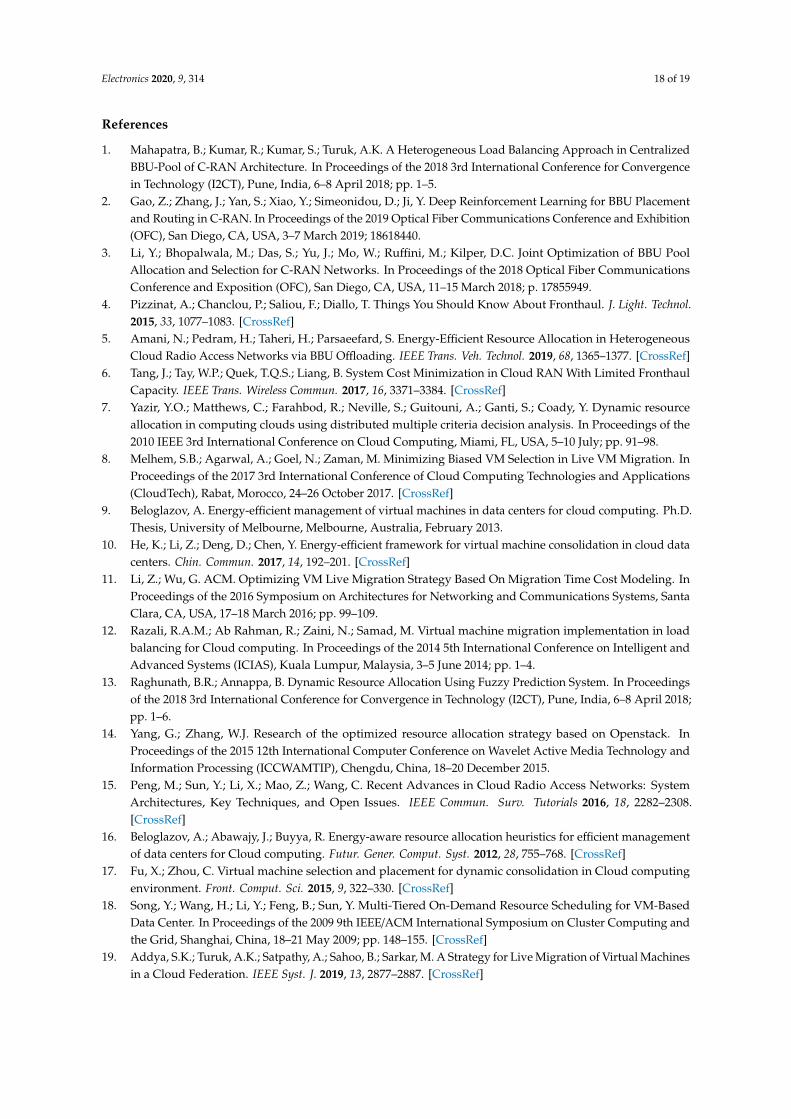
Electronics 2020, 9, 314 18 of 19
References
1. Mahapatra, B.; Kumar, R.; Kumar, S.; Turuk, A.K. A Heterogeneous Load Balancing Approach in CentralizedBBU-Pool of C-RAN Architecture. In Proceedings of the 2018 3rd International Conference for Convergencein Technology (I2CT), Pune, India, 6–8 April 2018; pp. 1–5.
2. Gao, Z.; Zhang, J.; Yan, S.; Xiao, Y.; Simeonidou, D.; Ji, Y. Deep Reinforcement Learning for BBU Placementand Routing in C-RAN. In Proceedings of the 2019 Optical Fiber Communications Conference and Exhibition(OFC), San Diego, CA, USA, 3–7 March 2019; 18618440.
3. Li, Y.; Bhopalwala, M.; Das, S.; Yu, J.; Mo, W.; Ruffini, M.; Kilper, D.C. Joint Optimization of BBU PoolAllocation and Selection for C-RAN Networks. In Proceedings of the 2018 Optical Fiber CommunicationsConference and Exposition (OFC), San Diego, CA, USA, 11–15 March 2018; p. 17855949.
4. Pizzinat, A.; Chanclou, P.; Saliou, F.; Diallo, T. Things You Should Know About Fronthaul. J. Light. Technol.2015, 33, 1077–1083. [CrossRef]
5. Amani, N.; Pedram, H.; Taheri, H.; Parsaeefard, S. Energy-Efficient Resource Allocation in HeterogeneousCloud Radio Access Networks via BBU Offloading. IEEE Trans. Veh. Technol. 2019, 68, 1365–1377. [CrossRef]
6. Tang, J.; Tay, W.P.; Quek, T.Q.S.; Liang, B. System Cost Minimization in Cloud RAN With Limited FronthaulCapacity. IEEE Trans. Wireless Commun. 2017, 16, 3371–3384. [CrossRef]
7. Yazir, Y.O.; Matthews, C.; Farahbod, R.; Neville, S.; Guitouni, A.; Ganti, S.; Coady, Y. Dynamic resourceallocation in computing clouds using distributed multiple criteria decision analysis. In Proceedings of the2010 IEEE 3rd International Conference on Cloud Computing, Miami, FL, USA, 5–10 July; pp. 91–98.
8. Melhem, S.B.; Agarwal, A.; Goel, N.; Zaman, M. Minimizing Biased VM Selection in Live VM Migration. InProceedings of the 2017 3rd International Conference of Cloud Computing Technologies and Applications(CloudTech), Rabat, Morocco, 24–26 October 2017. [CrossRef]
9. Beloglazov, A. Energy-efficient management of virtual machines in data centers for cloud computing. Ph.D.Thesis, University of Melbourne, Melbourne, Australia, February 2013.
10. He, K.; Li, Z.; Deng, D.; Chen, Y. Energy-efficient framework for virtual machine consolidation in cloud datacenters. Chin. Commun. 2017, 14, 192–201. [CrossRef]
11. Li, Z.; Wu, G. ACM. Optimizing VM Live Migration Strategy Based On Migration Time Cost Modeling. InProceedings of the 2016 Symposium on Architectures for Networking and Communications Systems, SantaClara, CA, USA, 17–18 March 2016; pp. 99–109.
12. Razali, R.A.M.; Ab Rahman, R.; Zaini, N.; Samad, M. Virtual machine migration implementation in loadbalancing for Cloud computing. In Proceedings of the 2014 5th International Conference on Intelligent andAdvanced Systems (ICIAS), Kuala Lumpur, Malaysia, 3–5 June 2014; pp. 1–4.
13. Raghunath, B.R.; Annappa, B. Dynamic Resource Allocation Using Fuzzy Prediction System. In Proceedingsof the 2018 3rd International Conference for Convergence in Technology (I2CT), Pune, India, 6–8 April 2018;pp. 1–6.
14. Yang, G.; Zhang, W.J. Research of the optimized resource allocation strategy based on Openstack. InProceedings of the 2015 12th International Computer Conference on Wavelet Active Media Technology andInformation Processing (ICCWAMTIP), Chengdu, China, 18–20 December 2015.
15. Peng, M.; Sun, Y.; Li, X.; Mao, Z.; Wang, C. Recent Advances in Cloud Radio Access Networks: SystemArchitectures, Key Techniques, and Open Issues. IEEE Commun. Surv. Tutorials 2016, 18, 2282–2308.[CrossRef]
16. Beloglazov, A.; Abawajy, J.; Buyya, R. Energy-aware resource allocation heuristics for efficient managementof data centers for Cloud computing. Futur. Gener. Comput. Syst. 2012, 28, 755–768. [CrossRef]
17. Fu, X.; Zhou, C. Virtual machine selection and placement for dynamic consolidation in Cloud computingenvironment. Front. Comput. Sci. 2015, 9, 322–330. [CrossRef]
18. Song, Y.; Wang, H.; Li, Y.; Feng, B.; Sun, Y. Multi-Tiered On-Demand Resource Scheduling for VM-BasedData Center. In Proceedings of the 2009 9th IEEE/ACM International Symposium on Cluster Computing andthe Grid, Shanghai, China, 18–21 May 2009; pp. 148–155. [CrossRef]
19. Addya, S.K.; Turuk, A.K.; Satpathy, A.; Sahoo, B.; Sarkar, M. A Strategy for Live Migration of Virtual Machinesin a Cloud Federation. IEEE Syst. J. 2019, 13, 2877–2887. [CrossRef]

Electronics 2020, 9, 314 19 of 19
20. Calheiros, R.N.; Ranjan, R.; Beloglazov, A.; De Rose, C.A.F.; Buyya, R. CloudSim: A toolkit for modeling andsimulation of cloud computing environments and evaluation of resource provisioning algorithms. Int. J.Softw. Pract. Exp. 2011, 41, 23–50. [CrossRef]
21. Open Source Software for Creating Private and Public Clouds. Available online: //www.openstack.org/
(accessed on 10 May 2019).
© 2020 by the authors. Licensee MDPI, Basel, Switzerland. This article is an open accessarticle distributed under the terms and conditions of the Creative Commons Attribution(CC BY) license (http://creativecommons.org/licenses/by/4.0/).