dual effect of muscarinic receptor agonists on ca2+ mobilization in sh-sy5y neuroblastoma cells
TRANSCRIPT

ejp European Journal of Pharmacology m o I e c u I a r p h a r m a c o I o g y
Molecular Pharmacology Section 291 (1995) 43-50 ELSEVIER
Dual effect of muscarinic receptor agonists on Ca 2 ÷ mobilization in SH-SY5Y neuroblastoma cells
Jaak J~irv a,*, Rasmus Hautala b Karl E.O. ,~kerman b a Institute of Chemical Physics, Tartu University, 2 Jakobi Str, EE 2400 Tartu, Estonia
b Department of Biochemistry and Pharmacy, .'tboAkademi University, Biocity, Turku, Finland
Received 4 January 1995; revised 29 March 1995; accepted 12 May 1995
Abstract
The muscarinic receptor-stimulated mobilisation of calcium ions in SH-SY5Y neuroblastoma cells was measured as function of the concentration of seven muscarinic receptor agonists and partial agonists: carbamoylcholine, acetylcholine, propionylcholine, butyryl- choline, acetylthiocholine, methylfurmethide and tetrametylammonium. The dose-response curves reached a clear maximum followed by a downturn of the curve. The concentration interval where the activatory and inhibitory effects occured depended on the structure of the ligand. The bell-shaped dose-response curves were analysed assuming that the drugs interact with two sites, which are responsible for agonistic and antagonistic effects, on the muscarinic receptors. The results indicate that full vs. partial agonism is at least in part determined by relative affinities of these two sites.
Keywords: Muscarinic receptor; Ca z+ mobilization; Agonists dual effect; Receptor theory, modified
1. Introduction
Some drugs antagonise their own agonistic activity on neurotransmitter or hormone receptors and therefore the biological effects of these compounds are smaller than the effects of full agonists. This phenomenon of partial ago- nism has been explained within the framework of the classical receptor concept by introducing the parameters of intrinsic activity (AriSns, 1954) or efficacy (Stephenson, 1956). However, in some cases the dose-response curves also exhibit a downturn of the response at high drug concentration (see examples in: Stephenson, 1956; Ari~ns et al., 1964; Corsini et al., 1987; J[irv et al., 1993). The first attempt to analyse such bell-shaped dose-response curves was made by Szabadi (1977), based on a model of two functionally antagonistic receptors activated by the same agonist. Recently the same model was revisited by Rovati and Nicosia (1994). The downturn phase of the receptor response has also been explained by a model assuming multiple state cell-signalling pathways (Pliska,
* Corresponding author. Fax: (372) 7 432 884 and (372) 7 441 453.
0922-4106/95/$09.50 © 1995 Elsevier Science B.V. All rights reserved SSDI 0 9 2 2 - 4 1 0 6 ( 9 5 ) 0 0 0 8 5 - 2
1994). Unspecified stoichiometry of the receptor-ligand interactions, however, hampers the kinetic analysis of this system. The bell-shaped dose-response curves have finally been described by assuming that one receptor molecule has two different binding sites, which are responsible for evok- ing and inhibiting the receptor response (J~irv and Rinken, 1993; J]irv et al., 1993). This means that binding of a ligand molecule to one of these sites exerts the agonistic response, while binding of a ligand molecule to the other site inhibits this effect. At the same time binding of a ligand molecule to one of these receptor sites does not exclude the binding of another ligand molecule to the other receptor site, as shown by kinetic analysis of muscarinic receptor-agonist-antagonist interaction mechanisms (J~irv et al., 1980).
From the mathematical point of view all these models treat the observed effect as a sum of two effect compo- nents, one positive and one negative, and the key point is the molecular mechanism of origin of the two responses.
The two-site receptor model predicts that the dose-re- sponse curves obey bell-shaped form for both partial ago- nists as well as for full agonists, while the pharmacological behaviour of any particular compound should be deter- mined by the difference between its affinities for the
44 J. Jiirv et aL / European Journal of Pharmacology - Molecular Pharmacology Section 291 (1995) 43-50
stimulatory (agonistic) and inhibitory (antagonistic) sites (Jiirv and Rinken, 1993; J~irv et al., 1993; J~irv, 1994). In the present study the validity of this prediction is investi- gated by measuring calcium mobilisation in intact neurob- lastoma SH-SY5Y cells, regulated by muscarinic drugs via the m 3 (or m 3 / m 1) subtypes of muscarinic receptors (~kerman and Heikkil~i, 1990; Lambert and Nahorski, 1990; Kukkonen et al., 1992). The results obtained for typical full agonists as well as partial agonists show that there is no principal difference in the mechanism of action of these compounds on m l / m 3 subtypes of muscarinic receptor: both classes of drugs exert bell-shaped dose response curves and they differ only by the ratio of their affinities for the agonistic and antagonistic receptor sites. The latter phenomenon can be explained simply by differ- ent specificity patterns of these sites.
2. Materials and methods
2.1. Chemicals
Carbamoylcholine chloride, acetylcholine bromide, acetylthiocholine iodide, butyrylcholine chloride, tetram- ethylammonium chloride and atropine sulphate were ob- tained from Sigma (USA), Fura-2/AM from Molecular Probes (Junction City, USA). Methylfurmethid was syn- thesised as described in (Weilmuenster and Jordan, 1945) and recrystallized twice from ethanol. Quinuclidinyl benzi- late was prepared from the methyl esters of benzilic acids and 3-quinuclidinol by re-esterification, as described in (Rzeszotarski et al., 1984). Other chemicals and salts of analytical grade were used without additional purification.
2.2. Media
The experimental medium was a Na+-based balanced salt solution (BSS) composed of 137 mM NaCI, 5mM KCI, 0.44 mM K H 2 P O 4 , 4.2 mM NaHCO 3, 20 mM 2-([2-hydroxy- 1,1-bis(hydroxymethyl)ethyl]amino)ethane sulfonic acid (TES), 1.2 mM MgC12 adjusted to pH 7.4. For experiments 1 mM CaC12 and 10 mM glucose was added to the medium.
2.3. Cells
SH-SY5Y neuroblastoma cells (Biedler et al., 1973) were obtained through Dr. S. P~lhlman (Department of Pathology, University of Uppsala, Sweden). The cells were cultured in Dulbecco's modified Eagle medium supple- mented with 10% foetal calf serum 100 I U / m l of peni- cillin and 50 /xg/ml streptomycin at 37°C in 5% CO 2 in an air ventilated humidified incubator. The cells were passaged when confluent by using EDTA (0.02% in phos- phate-buffered saline), and the media was changed twice a
week. For experiments the cells were washed once with phosphate buffered saline and then harvested with EDTA.
2.4. Ca 2 + measurements
The intracellular free Ca 2+ w a s determined using fura- 2d'AM (Grynkiewicz et al., 1985) as described previously (Akerman and Heikkil~i, 1990). In short the harvested cells were spun down (800 × g, 5 min), washed once with BSS and thereafter resuspended in the same media supple- mented with 10 mM glucose and 1 mM CaC12. The cells were loaded with fura-2 by addition of 4 /xM of fura2/AM and incubated with constant agitation for 20 min at 37°C. The cells were then spun down and resuspended in BSS with 10 mM glucose. The suspension was divided into different tubes and spun down in an Eppendorf Centrifuge at 13 000 × g for 30 s. The medium was carefully sucked off and the cell pellets were subsequently stored on ice. No difference in the response of the cells could be detected when comparing freshly pelleted cells to cells stored on ice for 4 h.
Measurements of intracellular Ca 2+ was carried out in the following way. A pellet, containing approximately 5 105 cells, was resuspended in 350/xl of BSS at 37°C, with 10 mM glucose and 1 mM CaC12 added. The cell suspen- sion was placed into a thermostated silica microcuvette and continuously stirred with a magnetic stirrer.
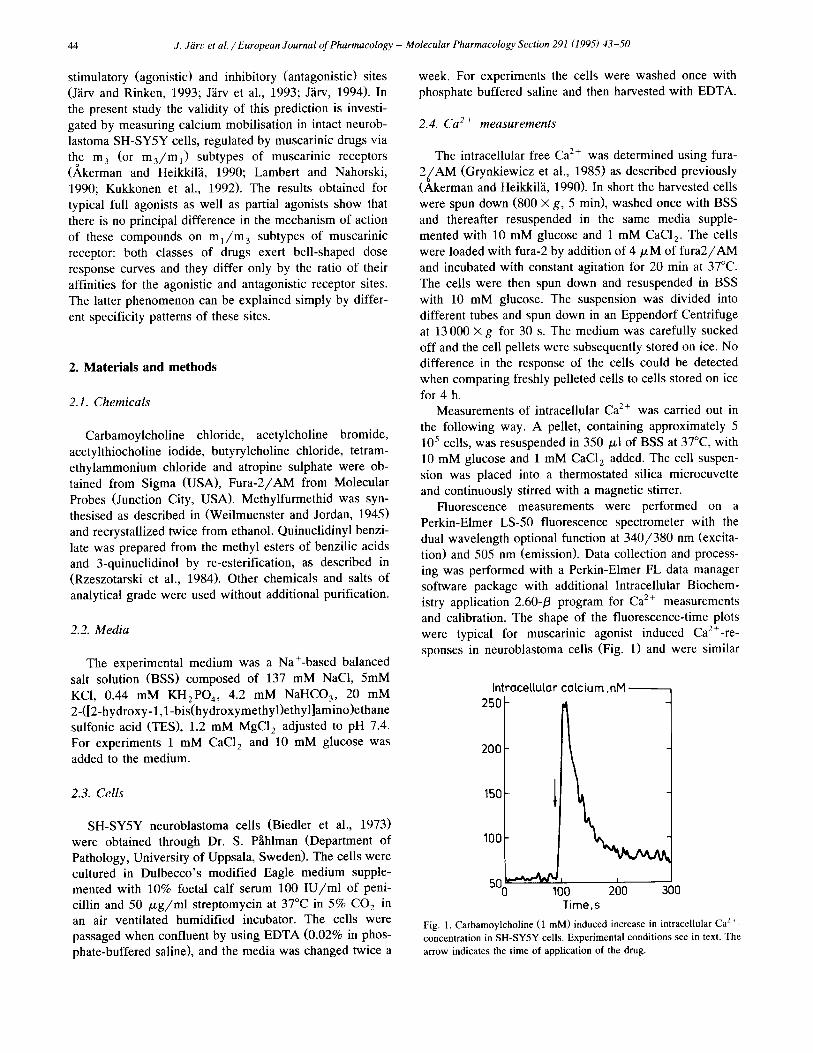
Fluorescence measurements were performed on a Perkin-Elmer LS-50 fluorescence spectrometer with the dual wavelength optional function at 340/380 nm (excita- tion) and 505 nm (emission). Data collection and process- ing was performed with a Perkin-Elmer FL data manager software package with additional Intracellular Biochem- istry application 2.60-/3 program for Ca 2+ measurements and calibration. The shape of the fluorescence-time plots were typical for muscarinic agonist induced Ca2+-re - sponses in neuroblastoma cells (Fig. 1) and were similar
Intracet[ular catcium ,nM, 250 - ]
200 -
150 -
IO0 -
50(~ 100 200 300 T ime ,s
Fig. 1. Carbamoylcholine (1 mM) induced increase in intracellular Ca 2+- concentration in SH-SY5Y cells. Experimental conditions see in text. The arrow indicates the time of application of the drug.
J. Jiirt, et al. /European Journal of Pharmacology - Molecular Pharmacology Section 291 (1995) 43-50 45
1.2
1.0
0.8
0.6
0.a
0.2
Effect , , , , , , ,
1.& 1
-8.0 -6.0 -&0 -2.0 0.0 tog [A]
Ef fect , , , , , , ,
I./+ - 3
1.2-
1.0
0.8
0.6
0./,
0.2
I I
-8.( -6.o -t .o -2o o.a tog [A]
Ef fec t
14
1.2
1.0
0 8
0.6
0.4
0 2
-8.1
I I I I I I i
2
-6.0 -&0 - 2 0 0.0 log [A]
Ef fect , , , , ,
1.& 4
1.2
1.0
0.8
0.6
0.4
0.2 I
-8.0 -6.0 -/+.0 -2.0 0.0 tog [A]
Effect , , ~ , I , i
1.& 5
1.2
1.0
0.8
[).6
0.4
0.2 I
-8.0 -6.0 -&.0 -2.0 0.0 tog [A]
Ef fec t , , , , , , ,
0.6
O.&
0.2
-8.0 -6.0 -&0 -2.0 0.0 tog [A]
Ef fec t , , , , , , ,
1.& I 7 1.2
i
1 . 0 -
0 . 8 -
0 . 6 -
0.Z~-
0 . 2 - , I I I
-8.0 -6.0 -&.0 -2.0 0.0 tog [A]

46 J. Jiirt, et al. /European Journal of Pharmacology - Molecular Pharmacology Section 291 (1995) 43-50
for all agonists studied (~&erman and Heikkil~i, 1990, Heikkil~i et al., 1991).
To obtain dose-response curves varying concentrations of the different drugs were applied to the cuvette. From the changes in fluorescence the intracellular Ca 2+ concentra- tion was estimated. Separate experiments were made to calibrate the system. For this purpose digitonin ( 6 0 / x g / m l ) was added to the cells to monitor the maximum fluores- cence (Rmax) at 1 mM Ca2+-concentration. The minimum fluorescence (Rmi n) was monitored after addition of 10 mM EGTA. The intracellular Ca 2÷ concentration was calculated according to the principles of Grynkiewicz et al. (1985) using the Perkin-Elmer Intracellular Biochemistry application calibration and data processing program. Other calculations and statistical data processing were carried out using the Enzfitter program package (Elsevier). All calcu- lated parameters were reported with standard errors (S.E.), the number of experiments used in calculations corre- sponded to the number of points shown in the figures.
In the case of carbamoylcholine single-cell fluorescence measurements were performed with SH-SY5Y neuroblas- toma cells grown on coverslips and loaded with fura- 2 / A M . Detailed description of the experimental methods and equipment used was presented by Jalava et al. (1993). In these experiments carbamoylcholine was applied at final concentrations from 3 /xM to 100 /xM and the light emitted from single cell bodies at 510 nm was measured to calculate the change in the intracellular Ca 2÷ concentra- tion.
3 . R e s u l t s
3.1. D o s e - r e s p o n s e curves
The mean value of the basal concentration of cytosolic free Ca e÷ in SH-SY5Y cells, as measured with fura-2, was 70 + 25 nM for the whole set of experiments (n > 100). The peak values for cae+-mobilisation induced by 1 mM carbamoylcholine (Fig. 1), varied from one particular batch of cells to the other, but remained between 190 to 250 nM. Thus to achieve a meaningful comparison of the experi- mental data from different series of measurements, the results were normalized against the standard carbamoyl- choline effect. For this purpose the Ca 2+ mobilisation was measured at 1 mM carbamoylcholine concentration for each batch of ceils and this effect was taken as 100% for calculation of the relative effect values for different con- centrations of other drugs within the same series of mea- surements.
Table 1 Effect of salts, extra added to the balanced salt solution, on the peak values of calcium mobilisation in SH-SY5Y neuroblastoma cells, initiated by 1 mM carbamylchloride. The mean values of three measurements are shown.
Salt Concentration (M) Effect (%)
- 0 100 NaCI 0.05 100 NaC1 0.20 92 NaC1 0.40 85 NaJ 0.05 95 NaJ 0.30 85 KCI 0.05 100 KCI 0.10 100
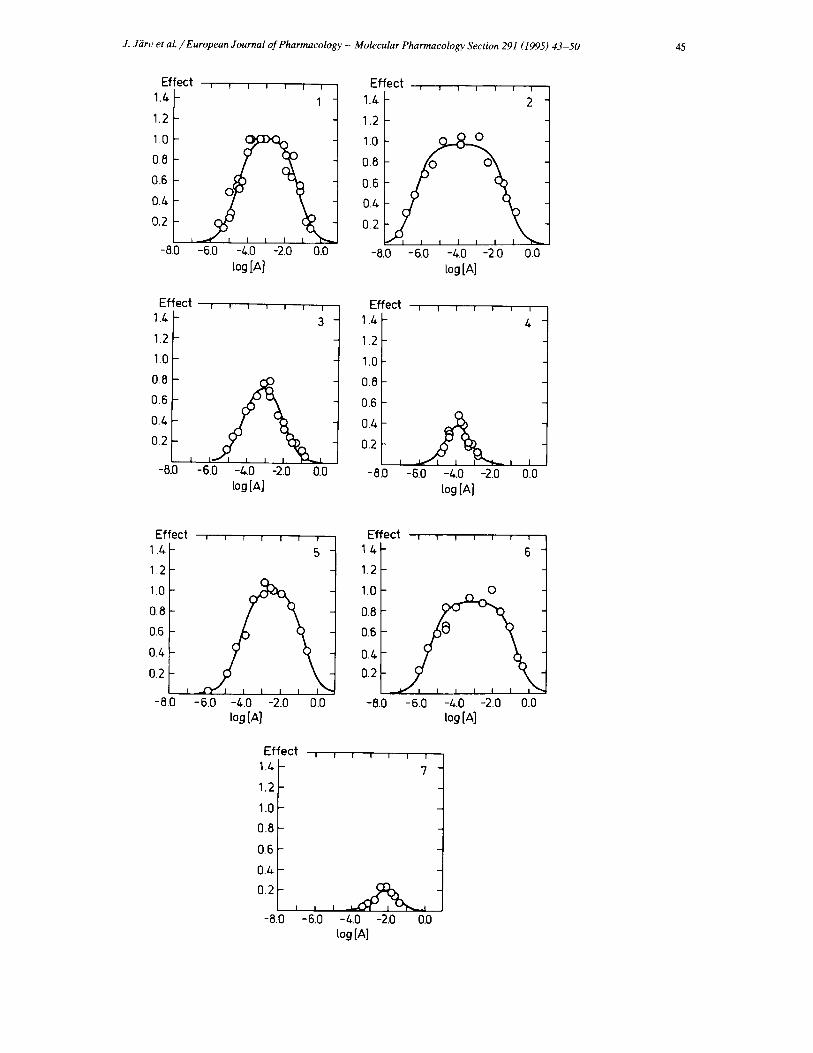
In this study seven different drugs (carbamoylcholine, acetylcholine, propionylcholine, butyrylcholine, acetylthio- choline, methylfurmethide, and tetramethylammonium) were used to evoke the increase in the intracellular Ca 2+ concentration and these experiments were made at maxi- mally wide drug concentration interval ( 1 0 - 7 - 1 0 - 1 M). The dose-response curves obtained are shown in Fig. 2. In the presence of atropine (1 /~M), or after short pretreat- ment of the cells with quinuclidinyl benzilate (1.5 nM), there was no measurable response of the cells upon expo- sure to the drugs investigated. This fact agrees with the muscarinic nature of the measured response.
The single-cell experiments revealed that the increase in carbachol concentration from 3 to 100 /zM lead to clear dose-dependent increase in the intracellular Ca2+-con- centration in agreement with the assumption that the re- suits above were representative for the events as they occur in each individual cell.
3.2. Da ta p r o c e s s i n g
It can be seen in Fig. 2 that in all cases the dose-re- sponse curves obeyed bell-shaped form. The down-going phase of the bell-shaped curves was usually seen at con- centrations higher than 1 mM and was clearly apparent at a concentration of 10 mM. High concentrations of agonists were added to obtain the full dose-response relationships. Therefore, in order to exclude inhibition of the response due to osmotic effects, different salts were added together with 1 mM carbamylcholine. The increase in osmolarity did not significantly affect the response (Table 1).
The bell-shaped dose-response curves were analysed using the two-site receptor model, as described by J~irv et al. (1993). The model assumes simultaneous binding of drugs to two sites following the law of mass action. The
Fig. 2. Dose-response relationships for the drug-mediated change of intracellular Ca 2+ concentration in SH-SY5Y cells. The results were normalised against the standard carbamoylcholine effect, determined at 1 mM drug concentration. The following drugs were investigated: carbamoylcholine (1), acetylcholine (2), propionylcholine (3), butyrylcholine (4), acetylthiocholine (5), methylfurmethide (6) and tetramethylammonium (7). The numbers of compounds refer to Table 2.

J. JiJrv et aL / European Journal of Pharmacology - Molecular Pharmacology Section 291 (1995) 43-50 47
observed dose-response relation is expressed by the differ- ence of two dose-response curves one which is stimulatory and another which antagonises the stimulatory effect. This statement has been formalised by means of the following equation:
E [RA] - [AR]
Emax [ R ] 0
1 1 - (1)
Kago,/[ A ] + 1 Kantag//[ A ] + 1'
where E is the effect measured experimentally at the drug concentration [A], Ema x is the maximal value of the receptor response, calculated from the dose-response curve, RA and AR stand for complexes of the drug A with the agonistic and antagonistic sites on the receptor R, Ka_on
a n d gantag are the appropriate dissociation constants ~or other concentration-related parameters characterizing po- tency of the drug to evoke the response). For each experi- mental curve the parameters E . . . . pKagon and pKantag were calculated. The results obtained are listed in Table 2. Due to the above mentioned procedure of normal±sat±on of the initial data to make them comparable between separate series of experiments, the values of the maximal effect in Table 2 are also given relatively to the maximal effect, evoked in SH-SY5Y cells by standard dose of carbamoyl- choline (1 mM).
3.3. Constants Kagon and Kantag
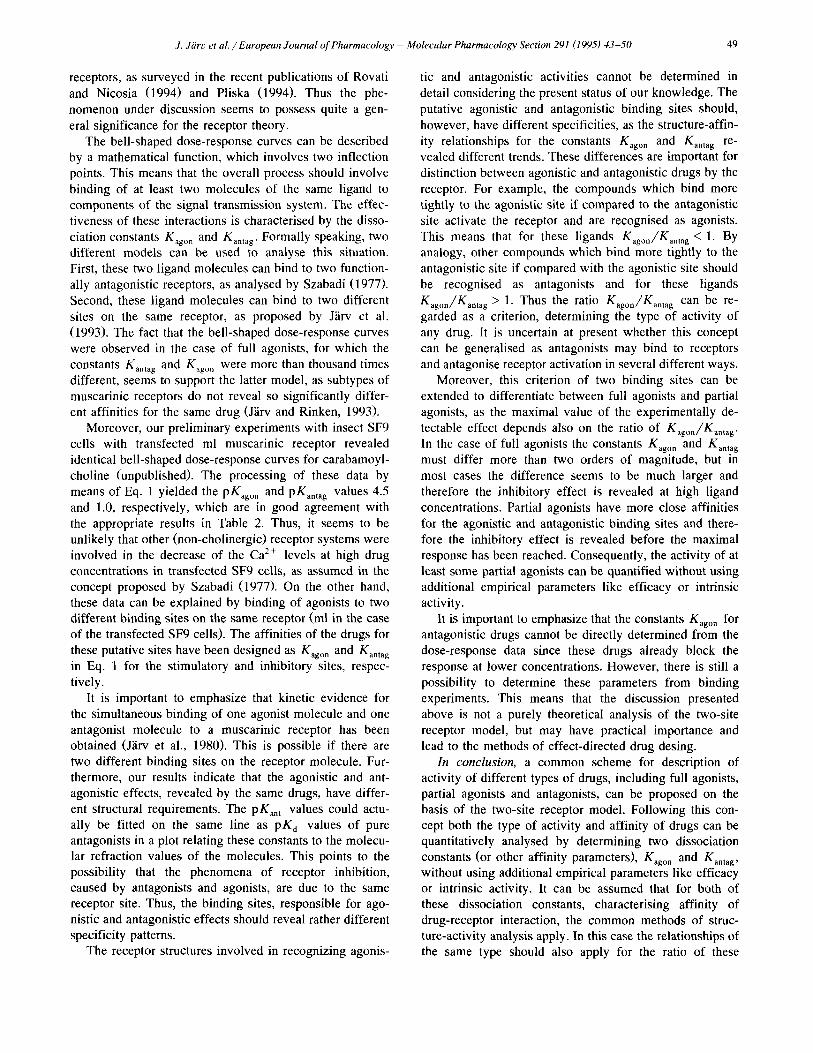
The c o n s t a n t gagon (Table 2) characterises the ability (potency) of drugs to evoke Ca 2 +-mobil±sat±on in the intact SH-SY5Y cells. In order to validate these data on Ca 2÷- mobil±sat±on they were compared to the activity of the same compounds in a standard assay system. A plot of pKagon vs log (ECs0) was constructed by using the ECs0 values for contraction of guinea pig ileum. The latter constants were collected from the review by Zeimal and Schelkovnikov (1989). It can be seen in Fig. 3 that there was a reasonably good linear correlation between the values o f pKagon and log(ECs0). This correlation showed that recognition of these drugs in both assay systems is governed by similar specificity determining factors, in agreement with the idea that in both cases the effects are related to the activity of muscarinic receptors.
4Iog(ECso) . . . . /
_-2 3 / ~ 3
I I I I I I
2 3 & 5 6 7 P Kctgon
Fig. 3. Correlation between pKagon and physiological activity of drugs, charactertised by the ECs0 values for guinea pig ileum. The physiological data were compiled from tables in Zeimal and Schelkovnikov (1989). The numbers of compounds refer to Table 2.
The downturn phase of the dose-response relationships (Fig. 2) characterises inhibition of the receptor response due to binding of an additional molecule of the same drug to another receptor site. Effectiveness of this interaction is characterised by the constants Kantag (Table 2).
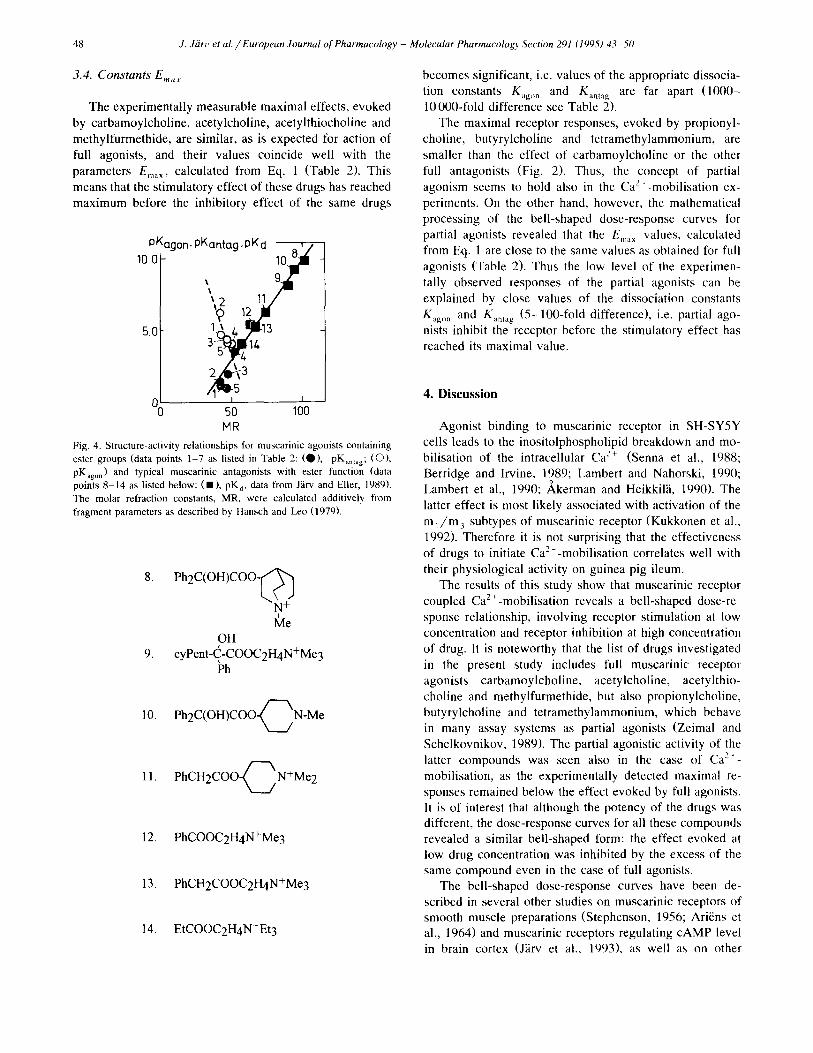
A linear relationship between binding affinity and molecular refraction (MR), character±sing the 'bulkiness' of muscarinic receptor antagonists (J~irv and Eller, 1989) has previously been shown. This represents a simplified structure-activity relationship which is valid for a large number of molecules as illustrated in Fig. 4. The values of pKantag for the muscarinic agonists studied fit fairly well on the same line as the pure antagonists. On the other hand, the same linear relationship shows that the parame- ters used to characterize affinity (potency) of these drugs are well comparable in spite of the different experimental methods used for their determination.
The relation o f pKagon values to the bulkiness of lig- ands, quantified by the molecular refractivity constants MR, differed considerably from the relation to the PKamag constants (Fig. 4). This is remarkable as the binding affinity of the same drug is considered. In fact the correla- tion between pKago, and MR showed a negative trend. Thus the situation is inverse when the agonistic activity to the antagonistic activity of the same drug is compared.
Table 2 Effect of muscarinic agonists and partial agonists on mobil±sat±on of intracellular Ca 2+ in SH-SY5Y cells; constants were calculated by means of Eq. 1 in text, the Ema x values were normalised against the effect evoked by 1 mM carbamoylcholine (100%); the standard errors (S.E.) of the parameters are given
No. Drug pKagon pKantag Ema x , %
1 Carbamylcholine 4.61 ± 0.07 1.19 ± 0.08 105 ± 4 2 Acetylcholine 6.27 + 0.10 1.40 ± 0.09 100 ± 4 3 Propionylcholine 4.36 ± 0.07 1.92 ± 0.05 80 ± 30 4 Butyrylcholine 4.21 + 0.07 3.59 ± 0.06 109 ± 14 5 Acetylthiocholine 4.17 ± 0.075 0.74 ± 0.08 105 + 3 6 Methylfurmethide 5.14 ± 0.15 0.81 ± 0.16 98 ± 7 7 Tetramethylammonium 2.21 ± 0.23 1.14 ± 0.24 98 ± 36
48 J. Jiirt~ et al. / European Journal of Pharmacology - Molecular Pharmacology Section 291 (1995) 43-50
3.4. Constants Ema x
The experimentally measurable maximal effects, evoked by carbamoylcholine, acetylcholine, acetylthiocholine and methylfurmethide, are similar, as is expected for action of full agonists, and their values coincide well with the parameters E . . . . calculated from Eq. 1 (Table 2). This means that the stimulatory effect of these drugs has reached maximum before the inhibitory effect of the same drugs
loP# ag°n pKant°gpKd
2 11 9 1
5.0 35~/1~ l&
I 1 0[~ 50 100
MR Fig. 4. Structure-activity relationships for muscarinic agonists containing ester groups (data points 1-7 as listed in Table 2: (Q), pK,nt,g; (O), pKago,) and typical muscarinic antagonists with ester function (data points 8-14 as listed below: ( I ) , pKd, data from J~rv and Eller, ]989). The molar refraction constants, MR, were ca|cu]ated additively from fragment parameters as described by Hansch and Leo (1979).
8. Ph2C(OH)COO-~/~ N +
OH 9. cyPent-C,-COOC2H4N+Me3
Ph
10. P h 2 C ( O H ) C O O ~ N - M e
11. P h C H 2 C O O ~ N + M e 2
12. PhCOOC2H4N+Me3
13. PhCH2COOC2H4N+Me3
14. EtCOOC2H4N+Et3
becomes significant, i.e. values of the appropriate dissocia- tion constants K~gon and Kantag are far apart (1000- 10 000-fold difference see Table 2).
The maximal receptor responses, evoked by propionyl- choline, butyrylcholine and tetramethylammonium, are smaller than the effect of carbamoylcholine or the other full antagonists (Fig. 2). Thus, the concept of partial agonism seems to hold also in the Ca 2 +-mobilisation ex- periments. On the other hand, however, the mathematical processing of the bell-shaped dose-response curves for partial agonists revealed that the E ..... values, calculated from Eq. 1 are close to the same values as obtained for full agonists (Table 2). Thus the low level of the experimen- tally observed responses of the partial agonists can be explained by close values of the dissociation constants Kagon and K~n,,g (5-100-fold difference), i.e. partial ago- nists inhibit the receptor before the stimulatory effect has reached its maximal value.
4. Discussion
Agonist binding to muscarinic receptor in SH-SY5Y cells leads to the inositolphospholipid breakdown and mo- bilisation of the intracellular Ca 2+ (Senna et al., 1988; Berridge and Irvine, 1989; Lambert and Nahorski, 199(I; Lambert et al., 1990; ,~kerman and Heikkil~i, 1990). The latter effect is most likely associated with activation of the m l / m 3 subtypes of muscarinic receptor (Kukkonen et al., 1992). Therefore it is not surprising that the effectiveness of drugs to initiate Ca2+-mobilisation correlates well with their physiological activity on guinea pig ileum.
The results of this study show that muscarinic receptor coupled Ca:+-mobilisation reveals a bell-shaped dose-re- sponse relationship, involving receptor stimulation at low concentration and receptor inhibition at high concentration of drug. It is noteworthy that the list of drugs investigated in the present study includes full muscarinic receptor agonists carbamoyicholine, acetylcholine, acetylthio- choline and methylfurmethide, but also propionylcholine, butyrylcholine and tetramethylammonium, which behave in many assay systems as partial agonists (Zeimal and Schelkovnikov, 1989). The partial agonistic activity of the latter compounds was seen also in the case of Ca 2~- mobilisation, as the experimentally detected maximal re- sponses remained below the effect evoked by full agonists. It is of interest that although the potency of the drugs was different, the dose-response curves for all these compounds revealed a similar bell-shaped form: the effect evoked at low drug concentration was inhibited by the excess of the same compound even in the case of full agonists.
The bell-shaped dose-response curves have been de- scribed in several other studies on muscarinic receptors of smooth muscle preparations (Stephenson, 1956; AriEns et al., 1964) and muscarinic receptors regulating cAMP level in brain cortex (J~irv et al., 1993), as well as on other
J. Jiirv et al. / European Journal of Pharmacology - Molecular Pharmacology Section 291 (1995) 43-50 49
receptors, as surveyed in the recent publications of Rovati and Nicosia (1994) and Pliska (1994). Thus the phe- nomenon under discussion seems to possess quite a gen- eral significance for the receptor theory.
The bell-shaped dose-response curves can be described by a mathematical function, which involves two inflection points. This means that the overall process should involve binding of at least two molecules of the same ligand to components of the signal transmission system. The effec- tiveness of these interactions is characterised by the disso- ciation constants K,goo and Kantag. Formally speaking, two different models can be used to analyse this situation. First, these two ligand molecules can bind to two function- ally antagonistic receptors, as analysed by Szabadi (1977). Second, these ligand molecules can bind to two different sites on the same receptor, as proposed by J~irv et al. (1993). The fact that the bell-shaped dose-response curves were observed in the case of full agonists, for which the constants Kantag and K~gon were more than thousand times different, seems to support the latter model, as subtypes of muscarinic receptors do not reveal so significantly differ- ent affinities for the same drug (Jiirv and Rinken, 1993).
Moreover, our preliminary experiments with insect SF9 cells with transfected ml muscarinic receptor revealed identical bell-shaped dose-response curves for carabamoyl- choline (unpublished). The processing of these data by means of Eq. 1 yielded the pKagon and pKantag values 4.5 and 1.0, respectively, which are in good agreement with the appropriate results in Table 2. Thus, it seems to be unlikely that other (non-cholinergic) receptor systems were involved in the decrease of the Ca 2+ levels at high drug concentrations in transfected SF9 cells, as assumed in the concept proposed by Szabadi (1977). On the other hand, these data can be explained by binding of agonists to two different binding sites on the same receptor (ml in the case of the transfected SF9 cells). The affinities of the drugs for these putative sites have been designed as Kagon and gantag in Eq. 1 for the stimulatory and inhibitory sites, respec- tively.
It is important to emphasize that kinetic evidence for the simultaneous binding of one agonist molecule and one antagonist molecule to a muscarinic receptor has been obtained (J~irv et al., 1980). This is possible if there are two different binding sites on the receptor molecule. Fur- thermore, our results indicate that the agonistic and ant- agonistic effects, revealed by the same drugs, have differ- ent structural requirements. The pgan t values could actu- ally be fitted on the same line as pK a values of pure antagonists in a plot relating these constants to the molecu- lar refraction values of the molecules. This points to the possibility that the phenomena of receptor inhibition, caused by antagonists and agonists, are due to the same receptor site. Thus, the binding sites, responsible for ago- nistic and antagonistic effects should reveal rather different specificity patterns.
The receptor structures involved in recognizing agonis-
tic and antagonistic activities cannot be determined in detail considering the present status of our knowledge. The putative agonistic and antagonistic binding sites should, however, have different specificities, as the structure-affin- ity relationships for the constants gagon and Kantag re- vealed different trends. These differences are important for distinction between agonistic and antagonistic drugs by the receptor. For example, the compounds which bind more tightly to the agonistic site if compared to the antagonistic site activate the receptor and are recognised as agonists. This means that for these ligands Kagon/gantag < 1. By analogy, other compounds which bind more tightly to the antagonistic site if compared with the agonistic site should be recognised as antagonists and for these ligands Kagon/gantag > 1. Thus the ratio Kagon/Kantag can be re- garded as a criterion, determining the type of activity of any drug. It is uncertain at present whether this concept can be generalised as antagonists may bind to receptors and antagonise receptor activation in several different ways.
Moreover, this criterion of two binding sites can be extended to differentiate between full agonists and partial agonists, as the maximal value of the experimentally de- tectable effect depends also on the ratio of Kagon/Kam~g. In the case of full agonists the constants Kagon and Kantag must differ more than two orders of magnitude, but in most cases the difference seems to be much larger and therefore the inhibitory effect is revealed at high ligand concentrations. Partial agonists have more close affinities for the agonistic and antagonistic binding sites and there- fore the inhibitory effect is revealed before the maximal response has been reached. Consequently, the activity of at least some partial agonists can be quantified without using additional empirical parameters like efficacy or intrinsic activity.
It is important to emphasize that the constants Kagon for antagonistic drugs cannot be directly determined from the dose-response data since these drugs already block the response at lower concentrations. However, there is still a possibility to determine these parameters from binding experiments. This means that the discussion presented above is not a purely theoretical analysis of the two-site receptor model, but may have practical importance and lead to the methods of effect-directed drug desing.
In conclusion, a common scheme for description of activity of different types of drugs, including full agonists, partial agonists and antagonists, can be proposed on the basis of the two-site receptor model. Following this con- cept both the type of activity and affinity of drugs can be quantitatively analysed by determining two dissociation constants (or other affinity parameters), gagon and Kantag , without using additional empirical parameters like efficacy or intrinsic activity. It can be assumed that for both of these dissociation constants, characterising affinity of drug-receptor interaction, the common methods of struc- ture-activity analysis apply. In this case the relationships of the same type should also apply for the ratio of these
50 J. Jiirv et al. / European Journal of Pharmacology - Molecular Pharmacology Section 291 (1995) 43-50
constants, opening a new perspective for prediction of type of drug activity as well as for the effect-directed drug design.
Acknowledgements
This work was supported by EMBO Grant EE 111-1992 to J.J., by The Estonian Science Council, by the Jus61ius Foundation (Finland), by The Borg Foundation (Finland) and by The Academy of Finland.
References
/~erman, K.E.O. and LE. Heikkil~i, 1990, 12-O-tetradecanoylphorbol 13-acetate and forskolin modify muscarinic receptor-linked Ca 2+ mobilisation in SH-SY5Y neuroblastoma cells through different mechanisms, J. Neurochem. 54, 497.
Ari~ns, E.J., 1954, Affinity and intrinsic activity in the theory of competi- tive inhibition. Part 1. Problems and theory, Arch. Int. Pharmacodyn. 99, 32.
Ari~ns, E.J., A.M. Simonis and J.M. Van Rossum, 1964, Different receptor systems. In: Molecular Pharmacology. The Mode of Action of Biologically Active Compounds, ed. E.J. Ariens (Academic Press, New York, London) p. 287.
Biedler, J.L., L. Helson and B.A. Sprengler, 1973, Morphology and growth, tumorigenicity and cytogenicity of human neuroblastoma cells in continuous culture, Canc. Res. 33, 2643.
Berridge, M.J. and R.F. Irvine, 1989, Inositol phosphates and cell sig- nalling, Nature 341, 197.
Corsini, A., G.C. Foloco, R. Fumagalli, S. Nicosia, M.A. Noe and D. Oliva, 1987, (5Z)-carbacyclin discriminates between prostacyclin-re- ceptors coupled to adenylate cyclase in vascular smooth muscle and platelets, Br. J. Pharmacol. 90, 255.
Grynldewicz, G., M. Poenie and R.Y. Tsien, 1985, A new generation of Ca 2+ indicators with greatly improved fluorescence properties, J. Biol. Chem. 260, 3440.
Hansch, C. and A. Leo, 1979, Substituent Constants for Correlation Analysis in Chemistry and Biology (Wiley and Sons, New York, Chichester, Brisbane, Toronto).
Heilddlli, J.E., C. Jansson and K.E.O. ~kerman, 1991, Differential cou- pling of muscarinic receptors to Ca 2÷ mobilisation and cyclic AMP in SH-SYSY and IMR-32 neuroblastoma cells, Eur. J. Pharmacol. 208, 9.
Jalava, A., K. ,~tkerman and J. Heikkilii, 1993, Protein kinase inhibitor, staurosporine, induces a mature neuronal phenotype in SH-SY5Y human neuroblastoma cells through an a-, fl-, and K-protein kinase C-independent pathway, J. Cell. Physiol. 155, 301.
J~irv, J. 1994, An alternative model for bell-shaped concentration-re- sponse curves, Trends. Pharm. Sci. 15,321.
Jiirv, J. and A. Rinken, 1993, Muscarinic acetylcboline receptors. In: Neurotransmitter Receptors, ed. F. Hucho (Elsevier Science Publish- ers B.V., Amsterdam, London, New York, Tokyo) p. 199.
Jiirv, J. and M. Eller, 1989, Effect of ligand volume on affinity of muscarinic antagonists, Org. Reactivity 26, 188.
Jarv, J., T. Toomela and E. Karelson, 1993, Dual effect of carbamoyl- choline on the muscarinic receptor, Biochem. Mol. Biol. Int. 30, 649.
Jhrv, J., B. Hedlund and T. Bartfai, 1980, Kinetic studies on muscarinic antagonist-agonist competition, J. Biol. Chem. 255, 2649.
Kukkonen, J., P. Ojala, J. Niisman, H. H~imaliiinen, J.E. Heikkil~i and K.E.O. /~erman, 1992, Muscarinic receptor subtypes in human neu- roblastoma cell lines SH-SYSY and IMR-32 as determined by recep- tor binding, Ca 2+ mobilisation and northern blotting, J. Pharmacol. Exp. Ther. 263/3 1487.
Lambert, D.L., E.M. Whitham, J.G. Braid and S.R. Nahorski, 1990, Different mechanisms of Ca ̀ '+ entry induced by depolarization and muscarinic receptor stimulation in SH-SY5Y human neuroblastoma cells, Molec. Brain Res. 8, 263.
Lambert, D.G. and S.R. Nahorski, 1990, Muscarinic-receptor mediated changes in intracellular Ca 2+ and inositol 1,4,5-triphosphate mass in a human neuroblastoma cell line, SH-SY5Y, Biochem. J. 265, 555.
Pliska, V., 1994, Models to explain dose-response relationships that exhibit a downturn phase, Trends Pharmacol. Sci. 15, 178.
Rovati, E.G. and S. Nicosia, 1994, Lower efficacy: interaction with an inhibitory receptor or partial agonism? Trends in Pharmacol. Sci. 15,
140. Rzeszotarski, W.J., W.C. Eckelman, B.E. Francis, D.A. Simms, R.E.
Gibson, E.M. Jagoda, M.P. Grissom, R.R. Eng, J.J. Conkin and R.C. Reba, 1984, Synthesis and evaluation of radioiodinated derivatives of 1-azabicyclo[2,2,2]oct-3-yl a-hydroxy-a-(4-iodophenyl)-a-phenyl- acetate as potential radiopharmaceuticals, J. Med. Chem. 27, 156.
Stephenson, R.P., 1956, A modification of receptor theory, Brit. J. Pharmacol. 11,379.
Szabadi, E., 1977, A model of two functionally antagonistic receptor populations activated by the same agonist, J. Theor. Biol. 69, 101.
Weilmuenster, E.A. and C.N. Jordan, 1945, Preparation of some furfuryl quaternary ammonium compounds, J. Amer. Chem. Soc., 67, 415.
Zeimal, E.V. and S.A. Schelkovnikov, 1989, Muscarinic Cholinorecep- tots (Russ) (Nauka Publishers, Leningrad) p. 287.