du pont 4q14 slides final
TRANSCRIPT

Conference Call
January 27, 2015
DuPont Fourth Quarter and Full Year 2014 Earnings

1
Regulation G The attached charts include company information that does not conform to generally accepted accounting principles (GAAP). Management believes that an analysis of
this data is meaningful to investors because it provides insight with respect to ongoing operating results of the company. These measures should not be viewed as an
alternative to GAAP measures of performance. Furthermore, these measures may not be consistent with similar measures provided by other companies. This data should
be read in conjunction with previously published company reports on Forms 10-K, 10-Q, and 8-K. These reports, along with reconciliations of non-GAAP measures to
GAAP are available on the Investor Center of www.dupont.com under Filings and Reports – Reconciliations and Other Data. Reconciliations of non-GAAP measures to
GAAP are also included with this presentation.
Forward-Looking Statements
This document contains forward-looking statements which may be identified by their use of words like “plans,” “expects,” “will,” “believes,” “intends,” “estimates,”
“anticipates” or other words of similar meaning. All statements that address expectations or projections about the future, including statements about the company's strategy
for growth, product development, regulatory approval, market position, anticipated benefits of recent acquisitions, timing of anticipated benefits from restructuring actions,
outcome of contingencies, such as litigation and environmental matters, expenditures and financial results, are forward looking statements. Forward-looking statements are
not guarantees of future performance and are based on certain assumptions and expectations of future events which may not be realized. Forward-looking statements also
involve risks and uncertainties, many of which are beyond the company’s control. Some of the important factors that could cause the company’s actual results to differ
materially from those projected in any such forward-looking statements are: fluctuations in energy and raw material prices; failure to develop and market new products and
optimally manage product life cycles; significant litigation and environmental matters; failure to appropriately manage process safety and product stewardship issues;
changes in laws and regulations or political conditions; global economic and capital markets conditions, such as inflation, interest and currency exchange rates; business or
supply disruptions; security threats, such as acts of sabotage, terrorism or war, weather events and natural disasters; abili ty to protect and enforce the company's
intellectual property rights; successful integration of acquired businesses and separation of underperforming or non-strategic assets or businesses and successful
completion of the proposed spinoff of the Performance Chemicals segment including ability to fully realize the expected benefits of the proposed spinoff. The company
undertakes no duty to update any forward-looking statements as a result of future developments or new information.
Developing Markets Total developing markets is comprised of Developing Asia, Developing Europe, Middle East & Africa, and Latin America. A detailed list of all developing countries is
available on the Earnings News Release link on the Investor Center website at www.dupont.com.
Additional Information And Where To Find It DuPont intends to file a proxy statement with the U.S. Securities and Exchange Commission (the "SEC") with respect to the 2015 Annual Meeting. DUPONT
STOCKHOLDERS ARE STRONGLY ENCOURAGED TO READ ANY SUCH PROXY STATEMENT, THE ACCOMPANYING WHITE PROXY CARD AND OTHER
DOCUMENTS FILED WITH THE SEC CAREFULLY IN THEIR ENTIRETY WHEN THEY BECOME AVAILABLE BECAUSE THEY WILL CONTAIN IMPORTANT
INFORMATION.
DuPont, its directors, executive officers and other employees may be deemed to be participants in the solicitation of proxies from DuPont stockholders in connection with the matters to be considered at DuPont’s 2015 Annual Meeting. Information about DuPont’s directors and executive officers is available in DuPont’s proxy statement, dated March 14, 2014, for its 2014 Annual Meeting. To the extent holdings of DuPont’s securities by such directors or executive officers have changed since the amounts printed in the 2014 proxy statement, such changes have been or will be reflected on Statements of Change in Ownership on Form 4 filed with the SEC. More detailed information regarding the identity of potential participants, and their direct or indirect interests, by security holdings or otherwise, will be set forth in the proxy statement and other materials to be filed with the SEC in connection with DuPont’s 2015 Annual Meeting. Stockholders will be able to obtain any proxy statement, any amendments or supplements to the proxy statement and other documents filed by DuPont with the SEC free of charge at the SEC's website at www.sec.gov. Copies will also be available free of charge at DuPont’s website at www.dupont.com or by contacting DuPont Investor Relations at (302) 774-4994.

Introductory Remarks
2
• Strong progress in 2014 leaves DuPont poised to deliver higher growth
and higher value in 2015 and beyond
• Continued portfolio transformation as a dynamic science company driven by innovation,
execution, and global reach
• Continued focus on innovation and development of new products and solutions
• Initiated operational redesign and related cost cutting program
• Hired world-class management consultant to undertake thorough assessment
• Increased target cost reductions to $1.3 billion by end of 2017
• Progress on Chemours
• Reached strategic milestones with initial Form 10 filing in December
• Separation on track to be completed mid-year
• Demonstrated commitment to capital return
• $2 billion of common shares repurchased in 2014
• Common stock dividend increased 4 percent in July
• Proceeds from Chemours separation expected to be returned to shareholders via share
repurchases

4Q 2014 Financial Highlights* $ in millions, except EPS
3
4Q14 vs. 4Q13 FY14 vs. FY13
EPS*
Operating earnings** $0.71 20% $4.01 3%
GAAP earnings $0.73 284% $3.90 28%
Segment Operating Earnings** $1,014 8% $5,955 1%
4Q14 vs. 4Q13 FY14 vs. FY13
Consolidated Net Sales* $7,378 (5%) $34,723 (3%)
Volume 3% 1%
Local Prices (1%) (1%)
Currency Impact (3%) (1%)
Portfolio (4%) (2%)
* Amounts reflect continuing operations
** See appendix for reconciliations of Non-GAAP Measures

4Q 2014 Segment Operating Earnings* Variance
($ in millions)
4 * See appendix for details of significant items and reconciliation of Non-GAAP Measures
Growth in Agriculture driven by the timing of seed shipments, higher crop protection volumes, lower costs and gains from the sale of
businesses, partially offset by lower corn seed sales in Brazil and negative currency impact
Performance Materials results driven by demand for ethylene and performance polymers, continued productivity and lower costs
Safety & Protection results were flat as increased demand in industrial markets and lower costs were offset by lower local price,
currency and the impact of portfolio changes
Other reflects higher expenses associated with pre-commercial programs
Segment results include a benefit of approx. $175 million due to lower performance-based compensation year over year. Impact by
segment is as follows: Agriculture - $90 million, Electronics & Communications - $10 million, Industrial Biosciences - $5 million, Nutrition
& Health - $10 million, Performance Chemicals - $30 million, Performance Materials - $15 million, and Safety & Protection - $15 million
Key Factors
$41
$9 $1
($16) $38 $4 ($2)
4Q13 Ag Perf Mtls IB E&C N&H Perf Chem S&P Other 4Q14
$939
Segment
Operating
Earnings*
$1,014
Segment
Operating
Earnings*
($0)

Collaboration Speeds Innovation
2013 Highlights
Global Sales – Regional Highlights
5
U.S. & Canada 35%
Developing EMEA 8%
Developed EMEA 15%
Developing Asia 16%
Developed Asia 10%
Latin America 16%
Region %
Worldwide -5%
U.S. & Canada -3%
Developed EMEA -8%
Developed Asia -13%
Developing Markets -3%
Developing Asia +3%
Developing EMEA +4%
Latin America -10%
4Q 2014 Sales by Region
4Q 2014 Sales YOY% Change

4Q 2014 Operating EPS* Variance
6
* See appendix for details of significant items and reconciliation of Non-GAAP Measures
• Segment earnings, excluding portfolio changes, were up $0.09, as lower costs and additional gains from portfolio
actions of $90 million were partially offset by a weaker Ag economy and a stronger U.S. dollar
• Lower corporate and interest expense and lower shares outstanding together contributed $0.09 to the quarter
• Portfolio actions include the impact of previous divestitures as well as the sales of copper fungicides (Kocide® and
ManKocide®), Land Management business, Asana® insecticides, Dymel® pharmaceutical grade propellants, and the
alfalfa seed business in the quarter
Key Factors
$0.59 Operating*
EPS
$0.09 $0.07 $0.02 ($0.03)
($0.03)
$0.71 Operating*
EPS
4Q13 Segment results Portfolio changes Corp & Interest Exp EGL Lower shares 4Q14

Balance Sheet and Cash December 31, 2014
7
Free Cash Flow
• ~$0.4B improvement YOY
• Absence of prior-year tax payments related to the
sale of Performance Coatings
Balance Sheet
• $3.7B net debt**
• $2.0B in share repurchases – about 30 million shares
retired
• ~$3.7B increase in unfunded pension & OPEB liability
due to change in discount rates and mortality tables
Uses of Cash in 2015
• ~$1.4B debt maturity in 1Q 2015
• ~$1.7B for normal dividends
• Continued growth investments in line with strategy
0.0
0.5
1.0
1.5
2.0YTD 13 YTD 14
$ B
illi
on
s
0
4
8
12
16
Jun-13 Sep-13 Dec-13 Mar-14 Jun-14 Sep-14 Dec-14
$ B
illio
ns
Gross Debt Cash Net Debt**
Free Cash Flow*
Cash and Debt
* Free Cash Flow is cash provided by operating activities of $3,712MM and $3,179MM less purchases of plant, property and equipment of $2,020MM and $1,882MM for the
year ended December 31, 2014 and 2013, respectively.
** See appendix for reconciliation of Non-GAAP measures.

2013 Highlights
Other Financial Highlights
8
• Increased total expected cost savings from operational redesign to at least $1.3 billion
• Redesign initiative on track and contributed $0.05 per share to operating earnings in
the quarter; $0.07 per share for full year 2014
• On track to complete Performance Chemicals separation mid 2015:
• Initial Form 10 filed in December 2014
• Targeting a high yield credit rating of BB
• Expect to return all or substantially all of anticipated Chemours one-time dividend proceeds to
shareholders via share repurchases within 12-18 months of separation

2015 Assumptions
9
Key Market Summary Macroeconomic Outlook
• Ag sector remains challenged
⁻ Farmer net income has declined
⁻ Expect lower corn planted area
• Global light vehicle builds expected
to rise nearly 3%
• Strong growth in photovoltaics
driven by higher global module
installations
• U.S. housing starts up ~15%
• Dollar stronger against most
currencies
• Global GDP 3%
• Industrial Production 3%
⁻ Acceleration in US
manufacturing
⁻ Continued uncertainty in Europe
and Japan
⁻ China growth slowing

2015 Expectations and Outlook
10
• Net sales even with prior year, ~5 percent growth from volume and
local price offset by portfolio changes and impact of currency
• Operating EPS* earnings range of $4.00 - $4.20 per share
• Includes Performance Chemicals
• Includes currency headwind of ~$0.60 per share
• Base tax rate ~22%
• Increase due to expected geographical mix of earnings and absence of US
R&D credit
• ~$0.15 per share headwind in 2015
• Capital Expenditures ~$1.8B
• Items excluded from Operating Earnings*:
• Non-operating pension expense ~$0.21per share; increase from 2014 due
to discount rates
• Transaction costs for Performance Chemical separation ~$0.30 per share
* See appendix for reconciliation of Non-GAAP measures

* Segment sales include transfers.
**See appendix for reconciliation of non-GAAP measures.
Agriculture Pioneer, Crop Protection
11
0.0
0.5
1.0
1.5
2.0
4Q12 4Q13 4Q14
$ in
Billio
ns
4Q12 4Q13 4Q14 -8.0%
-4.0%
0.0%
4.0%
8.0%
-100
-50
0
50
100
150
Ma
rgin
$ in
Millio
ns
1Q and FY Outlook • 1Q: Sales - About 10 percent lower primarily driven by currency,
lower corn planted area, timing of seed shipments, and lower
herbicide volumes; Operating Earnings - About 25 percent lower
• Economic environment in the agriculture sector challenged and corn
volumes will be under pressure from lower planted area
• Currency impact will be greatest in the first quarter when the majority
of sales in Europe occur
• Expect local price gains from new product mix
• Full-Year: Sales - Low-single digits percent lower; Operating
Earnings - High-single digits percent lower; primarily due to currency;
ex-currency, up mid- to high-single digit percent
• Confident in long-term sustainable demand growth and Ag pipeline
4Q Comments • Sales - 4 percent lower as a 5 percent increase in volumes was
offset by 8 percent lower USD pricing from both currency and local
price and a 1 percent decline from portfolio
• Volume growth from crop protection and the timing of seed
shipments in North America and Europe for the 2015 planting season
• Lower corn seed volume and price in Brazil reflecting lower planted
area and the impact of insect resistance
• Operating Earnings - $129 million increased $41 million as lower
costs, productivity improvements and gains from portfolio actions of
$36 million more than offset the sales decline
4Q Operating Earnings**
4Q Sales*

Performance Materials*** Performance Polymers (DPP), Packaging & Industrial Polymers (P&IP)
12
0.0
0.4
0.8
1.2
1.6
2.0
4Q12 4Q13 4Q14
$ in
Billio
ns
4Q12 4Q13 4Q14 0%
5%
10%
15%
20%
25%
0
75
150
225
300
375
Ma
rgin
$ in
Millio
ns
4Q Comments
• Sales - Positive volume and local pricing were more than offset
by currency and portfolio impact, resulting in a decline of 4
percent
• Segment volume increased 4 percent on solid demand in auto,
packaging, industrial and consumer markets
• China and North American demand strong in the auto sector
• Operating Earnings - Up 13 percent as higher volume, prices,
and lower costs more than offset negative impacts from currency
and portfolio changes
• Operating margins increased 340 bps on favorable ethylene
dynamics and higher volumes
1Q and FY Outlook
• 1Q: Sales - Down mid-single digits due to currency and portfolio
changes, ex portfolio and currency up mid single digits
• Operating Earnings - Increase in the mid-teens on higher volume
• Expect lower margins for ethylene and ethylene-based products
• Full Year: Sales - Strong volumes are more than offset by the
combined negative impact of portfolio, price and currency,
resulting in sales down mid-single digits
• Operating Earnings - Up mid-single digits as higher volumes
more than offset the negative impact of currency
* Segment sales include transfers.
**See appendix for reconciliation of non-GAAP measures.
***Prior periods reflect reclassification of Viton® fluoroelastomers from Performance Materials to Performance Chemicals.
4Q Operating Earnings**
4Q Sales*

Industrial Biosciences
13
0.0
0.1
0.2
0.3
0.4
4Q12 4Q13 4Q14
$ in
Billio
ns
4Q12 4Q13 4Q14 0.0%
5.0%
10.0%
15.0%
20.0%
0
10
20
30
40
50
60
Ma
rgin
$ in
Millio
ns
4Q Comments
• Sales - Down 1 percent as 2 percent higher volumes were
more than offset by the impact of currency
• Growth in enzymes driven by new product offerings and
increased sales into emerging markets
• Biomaterial sales were lower on weaker demand in key US
markets
• Operating earnings - Up 23 percent on higher volumes,
stronger product mix, and lower costs
1Q and FY Outlook
• 1Q: Sales & Operating Earnings – Mid-single digit volume
growth will be offset by the negative impacts of currency and
lower prices, resulting in sales and operating earnings even
with the prior year
• Enzyme demand continues to be steady in ethanol, animal
nutrition, and food enzyme markets
• Full Year: Sales - Mid-single digit volume growth will be offset
by the impacts of currency, lower price resulting in flat sales
• Full Year Operating Earnings - Up in the high teens; both on
higher volumes and stronger mix
* Segment sales include transfers.
**See appendix for reconciliation of non-GAAP measures.
4Q Operating Earnings**
4Q Sales*

* Segment sales include transfers.
**See appendix for reconciliation of non-GAAP measures.
Electronics & Communications
14
0.0
0.2
0.4
0.6
0.8
1.0
4Q12 4Q13 4Q14
$ in
Billio
ns
4Q12 4Q13 4Q14 0%
5%
10%
15%
20%
0
25
50
75
100
125
Ma
rgin
$ in
Millio
ns
4Q Comments
• Sales - Down 11 percent on lower volumes and lower metals
prices
• Volume growth in several product lines was more than offset
by competitive pressures impacting Solamet® paste
• Operating Earnings - Up 4 percent as lower costs and
productivity improvements offset lower sales volumes
1Q and FY Outlook
• 1Q: Sales - Down about 10 percent from short-term challenges in
PV paste and lower metals prices; Operating Earnings - About flat
benefiting from productivity
• Global photovoltaic (PV) module installations expected to grow
about 20 percent
• Continued volume growth in Tedlar® film, consumer electronics
and packaging graphics; short-term challenges in PV paste
• Full year: Sales - Up low-single digits percent on higher volume
offset by lower metals prices and currency; Operating earnings -
Up high-teens percent on higher volumes and productivity
• Expect to benefit from our new photovoltaic paste products in the
second half of the year
4Q Operating Earnings**
4Q Sales*
Nutrition & Health
15 * Segment sales include transfers.
**See appendix for reconciliation of non-GAAP measures.
0.0
0.2
0.4
0.6
0.8
1.0
4Q12 4Q13 4Q14
$ in
Billio
ns
4Q12 4Q13 4Q14 0%
3%
6%
9%
12%
0
20
40
60
80
100
120
Ma
rgin
$ in
Millio
ns
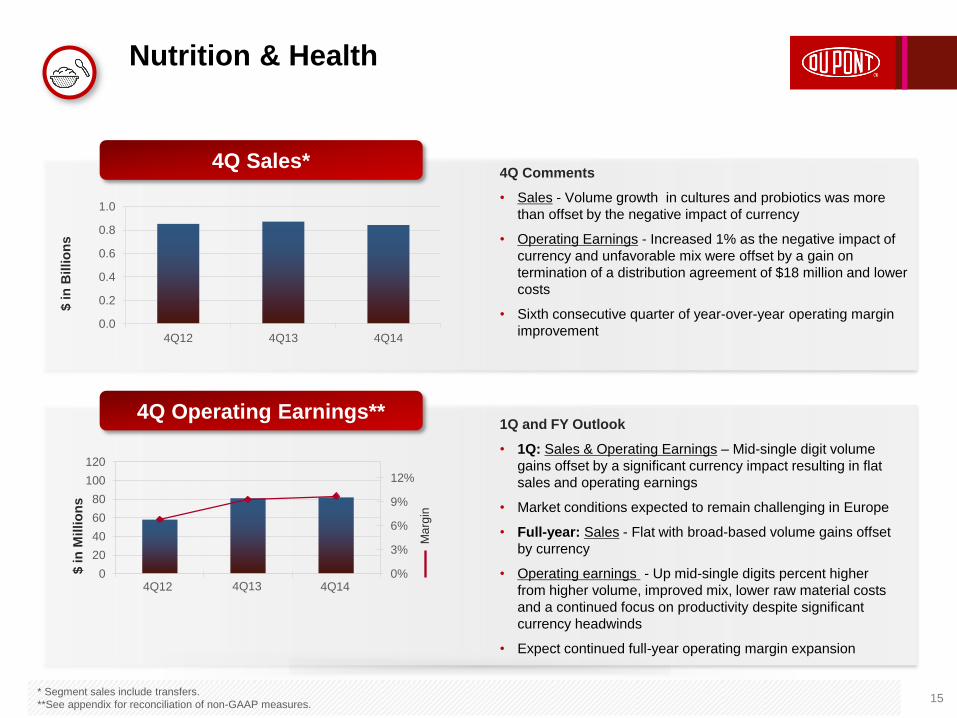
4Q Comments
• Sales - Volume growth in cultures and probiotics was more
than offset by the negative impact of currency
• Operating Earnings - Increased 1% as the negative impact of
currency and unfavorable mix were offset by a gain on
termination of a distribution agreement of $18 million and lower
costs
• Sixth consecutive quarter of year-over-year operating margin
improvement
1Q and FY Outlook
• 1Q: Sales & Operating Earnings – Mid-single digit volume
gains offset by a significant currency impact resulting in flat
sales and operating earnings
• Market conditions expected to remain challenging in Europe
• Full-year: Sales - Flat with broad-based volume gains offset
by currency
• Operating earnings - Up mid-single digits percent higher
from higher volume, improved mix, lower raw material costs
and a continued focus on productivity despite significant
currency headwinds
• Expect continued full-year operating margin expansion
4Q Operating Earnings**
4Q Sales*

Safety & Protection Protection Technologies (DPT), Building Innovations (BI), Sustainable
Solutions (DSS)
16
0.0
0.2
0.4
0.6
0.8
1.0
1.2
4Q12 4Q13 4Q14
$ in
Billio
ns
4Q12 4Q13 4Q14 0%
5%
10%
15%
20%
25%
0
50
100
150
200
250
Ma
rgin
$ in
Millio
ns
4Q Comments
• Sales - 3 percent volume growth was more than offset by
currency and portfolio impact
• Increased demand in industrial markets for Nomex® thermal
resistant fiber, Kevlar® high strength materials, and Tyvek®
protective material
• Operating Earnings - Flat as higher volumes and lower costs
were offset by portfolio changes and currency
• Full-year operating earnings were up 15 percent with operating
margins up 260 basis points
1Q and FY Outlook
• 1Q: Sales – Volume growth of mid to high single digits percent
is more than offset by currency and portfolio, resulting in sales
down low-single digits on a percent basis
• Operating Earnings - Increase in the mid-single digits due to
mix enrichment and continued productivity
• Full-year: Sales –Mid single digit volume growth is offset by
the impact of portfolio changes resulting in sales even with the
prior year
• Operating Earnings - Up low teens on a percentage basis as
volume growth, continued margin improvement and
productivity partially offset by currency and the impact of
portfolio changes
* Segment sales include transfers.
**See appendix for reconciliation of non-GAAP measures.
4Q Operating Earnings**
4Q Sales*

Performance Chemicals*** Titanium Technologies (DTT), Chemical & Fluoroproducts (DC&F)
17
0.0
0.5
1.0
1.5
2.0
4Q12 4Q13 4Q14
$ in
Billio
ns
4Q12 4Q13
4Q14 0%
5%
10%
15%
20%
25%
0
50
100
150
200
250
300
Ma
rgin
$ in
Millio
ns
4Q Comments
• Sales - Down 6 percent due primarily to a 5 percent negative
portfolio impact
• Segment volumes were up 3 percent on solid demand for chemicals
and fluoroproducts,
• Ti02 volumes were flat and prices were down 7% from the prior year,
6% on a sequential basis
• Operating Earnings - Down 1 percent as gains from the sales of
non-strategic assets, higher volumes and lower costs were more
than offset by lower segment prices, currency and portfolio impacts
• Current period includes a $23 million gain from the sale of a
business
1Q and FY Outlook
• 1Q: Sales - Down mid-single digits; Operating earnings - Down
about 35 percent; Both due primarily to lower USD pricing and the
negative impact of currency
• Current Ti02 industry environment relatively stable with inventory
levels near normal
• Full-year: Sales – Up low single digits; volumes expected to grow at
1-2x GDP
• Operating Earnings - Flat as higher volumes are offset by the
negative impact of currency and portfolio changes
* Segment sales include transfers.
**See appendix for reconciliation of non-GAAP measures.
***Prior periods reflect reclassification of Viton® fluoroelastomers from Performance Materials to Performance Chemicals
4Q Operating Earnings**
4Q Sales*

APPENDIX 1:
FOURTH QUARTER 2014 SEGMENT COMMENTARY
This data should be read in conjunction with the Company’s fourth quarter earnings news
release dated January 27, 2015, DuPont’s 4Q 2014 Earnings Conference Call presentation
materials and reconciliations of non-GAAP to GAAP measures included in the presentation
materials and posted on the DuPont Investor Center website at www.dupont.com.
1/27/2015 18

Segment Commentary Fourth Quarter Earnings 2014
19
Agriculture
In our Agriculture segment, fourth quarter sales are largely driven by the summer and Safrinha seasons in Latin America and
shipments to customers in advance of the 2015 planting season in the northern hemisphere. Sales for the quarter were 4
percent below the prior year as volume growth in crop protection and the timing of seed shipments for the 2015 planting
season were more than offset by lower corn seed sales in Brazil and the negative impact of currency. Fourth quarter
operating earnings of $129 million increased $41 million as lower costs, productivity improvements and gains from portfolio
actions of $36 million more than offset the decline in sales.
For the full year, operating earnings decreased 5 percent as higher crop protection volumes, higher local seed prices and
lower costs, including seed inputs, were more than offset by lower corn seed volumes, the negative impact of currency and
portfolio impacts. During the year we took disciplined actions to streamline our cost structure, further focus our investments
on the highest growth opportunities and better position ourselves for the current economic environment.
Crop protection sales for the quarter were 1 percent lower as volume growth from most regions was more than offset by the
negative impact of currency and from portfolio changes. For the full year, crop protection sales grew 4 percent in a
challenging market environment led by insecticides and fungicides while herbicide sales declined. We saw further growth in
2014 from Rynaxypyr® and from successful launches of Cyazypyr® and our new seed treatments in several markets.
Moving to the seed business, fourth quarter sales declined 7 percent due in part to strong currency headwinds. In Brazil,
corn seed market share and price were lower reflecting the impact of fall armyworm resistance. Brazil corn volumes were
also negatively impacted as farmers planted fewer hectares of corn. Fourth quarter shipments in North America and
Europe were higher than the prior year in advance of 2015 planting. For the full year, seed sales declined 7 percent as
higher local seed price from new products was more than offset by reductions in corn planted area and market share
declines in Brazil and North America.

Segment Commentary Fourth Quarter Earnings 2014
20
Agriculture (continued)
As we look to the near future, we expect the economic environment in the agriculture sector to remain challenged.
Farmer net income has declined and growers in Brazil’s Safrinha season and in North America are likely to reduce corn
plantings again in 2015 putting pressure on volumes in the first half of the year. Our seed order book reflects this shift in
acres. In addition, lower insect pressure in Brazil and continued elevated distributor inventories in the Americas will
present headwinds in 2015 in crop protection markets.
Farmers are increasing demand for our newest corn seed genetics, our AcreMax® integrated refuge corn products and
our new T series soybean varieties. However, with profits coming down, farmers are sharpening their pencils when it
comes to input purchases. Coupled with strong industry seed supplies, 2015 continues to be a very dynamic and
competitive season.
We anticipate currencies will remain volatile and headwinds to be substantial in markets like Europe, Brazil and Canada
where we have seen strong growth in our market position in recent years. For the first half of 2015, which reflects the
majority of the northern hemisphere season, we expect Agriculture segment sales to be mid-single digits percent lower
with operating earnings about 10 percent below 2014 as price gains from new product mix are more than offset by
currency and lower volumes. The currency impact will be greatest in the first quarter when the majority of 2015 season
sales in Europe occur. Volumes will be more challenged in the first quarter due to an expected decline in North America
and Brazil Safrinha corn area, the earlier timing of northern hemisphere seed shipments which benefited the fourth quarter
of 2014, and a reduction in herbicide volumes. We expect first quarter sales to be about 10 percent lower and operating
earnings about 25 percent below 2014.
For the full year we expect sales to be down low-single digits percent and operating earnings down high-single digits
percent as price gains from new seed and crop protection products are more than offset by currency headwinds.
Excluding the impact of currency, we would expect operating earnings to be up mid- to high-single digits.

Segment Commentary Fourth Quarter Earnings 2014
21
Agriculture (continued)
While agriculture markets may continue to face challenges in the short-term, we remain confident in the long-term
fundamentals for sustainable demand growth for grain and oilseeds and in our growth strategy. We are excited about our
near-term pipeline of new genetics and traits like event DP4114 and Leptra™ insect protection in seeds. Leptra™ will
bring an additional mode of control to help Brazilian farmers manage the intense pressure they face from insects,
including fall armyworm. In crop protection our robust pipeline of new actives will continue to complement our recent
launches of insecticides and fungicides and our expanding seed treatment portfolio.

Segment Commentary Fourth Quarter Earnings 2014
22
Performance Materials
Positive volume and local pricing were more than offset by currency and portfolio impact, resulting in a sales decline of 4
percent. Segment volumes increased 4 percent on solid demand in auto, packaging, industrial, and consumer markets.
Demand for Performance Polymers, especially in China and North America, remained strong in the auto sector. China
volumes were up approximately 15 percent year over year which more than offset lower demand in Europe, Japan, and
Korea. In packaging, industrial, and consumer markets, specialty and commodity ethylene copolymer demand remained
solid and ethylene sales were up versus the prior year.
In the quarter, operating earnings increased 13 percent as higher volumes, prices and lower costs more than offset the
negative impacts of currency and portfolio changes. Operating margins increased 340 basis points on favorable
ethylene market dynamics and higher volumes.
In 2014, full year operating earnings were up 1 percent, overcoming the negative impacts of portfolio changes and the
60 day planned ethylene outage. Operating margins increased 70 basis points to close the year at 21 percent.
For the first quarter, we anticipate sales will be down in the mid-single digits percent range due primarily to currency and
portfolio impacts, ex portfolio sales up mid-single digits.
Operating earnings are expected to be up in the mid-teens however on a percentage basis on improved volumes as
prior year sales were constrained in advance of the scheduled ethylene outage.
In 2015, we anticipate strong volumes will be more than offset by the combined negative impact of portfolio, price, and
currency, resulting in sales down mid-single digits. Full year operating earnings are expected to increase in the mid-
single digit range however as higher volumes more than offset the negative impact of currency.

Segment Commentary Fourth Quarter Earnings 2014
23
Industrial Biosciences
Industrial Biosciences sales of $322 million were 1 percent lower as 2 percent higher volumes were more than offset by
the impact of currency. Growth in enzymes was driven by new product offerings and increased sales into emerging
markets while biomaterials volumes were lower on weaker demand in key US markets.
Sales from recently launched enzyme offerings in ethanol, animal nutrition and food enzyme markets contributed to
positive volume growth in the quarter. Ethanol industry fundamentals are adjusting to a lower energy cost environment
but demand for DuPont’s novel enzymes and other functional bio products designed to increase production rates, yield
and efficiency remained steady. In 2015, enzyme demand for ethanol production is expected to remain stable although
ethanol producer margins are expected to transition from their peak levels in 2014.
Fourth quarter operating earnings were up 23 percent on higher volumes with a stronger product mix and lower costs.
For the full year 2014, higher volumes and improved mix from the continued ramp of new products helped deliver a 25
percent increase in operating earnings and a 300 basis point increase in operating margins.
For the 1st quarter 2015, we anticipate higher segment volumes will be offset by the negative impacts of currency and
lower prices, resulting in sales even with the prior year. First quarter operating earnings are also expected to be even
with the prior year.
For the full year, we expect sales will be flat but higher volumes and stronger mix will result in earnings up in the high-
teens on a percentage basis.

Segment Commentary Fourth Quarter Earnings 2014
24
Electronics & Communications
Sales in Electronics & Communications were 11 percent lower in the fourth quarter. Volume growth in several product
lines was more than offset by competitive pressures impacting Solamet® paste and the pass-through of lower metals
prices. Operating earnings of $97 million increased $4 million, or 4 percent, as lower volumes were offset by lower
costs and productivity improvements.
Full year sales were 6 percent lower as volume growth in several product lines was more than offset by lower metals
prices and by competitive pressures in photovoltaic paste. Full year 2014 operating earnings of $355 million increased
$21 million, or 6 percent, on volume growth and productivity gains, partially offset by the absence of $20 million in
OLED licensing income realized during 2013.
Looking ahead to 2015, global photovoltaic module installations are expected to grow about 20 percent fueled by
installations in China, Japan, the U.S. and in developing markets. We expect continued strength in Tedlar® film,
consumer electronics and packaging graphics. In the short-term, we expect segment results will continue to be
negatively impacted by declines in Solamet® paste, as intense competition has impacted price and share in this
business. We are the market and technology leader in photovoltaics and are driving a robust innovation pipeline aimed
at furthering solar cell efficiency and module lifetime. We have begun testing a new metallized paste product for the PV
market with customers, and expect to ramp up production in 2015.
For the first quarter we expect sales to be down about 10 percent from short-term challenges in PV paste and lower
metals prices with operating earnings about flat, benefitting from productivity. We expect to see the impact of our new
photovoltaic paste products in the second half of the year. Full year sales are expected to be up low-single digits
percent from volume gains offset by the pass-through of lower metals prices. For the year we expect operating
earnings to be up in the high-teens percent range.

Segment Commentary Fourth Quarter Earnings 2014
25
Nutrition & Health
In Nutrition & Health, sales were 3 percent lower as continued volume growth in cultures and probiotics was more than
offset by the negative impact of currency. Operating earnings increased $1 million as the negative impact of currency
and unfavorable mix were offset by a gain on termination of a distribution agreement of $18 million and lower costs.
This was the sixth consecutive quarter of year-over-year operating margin improvement.
Our disciplined focus on productivity and mix enrichment is paying off as operating margins improved over 200 basis
points for the full year. 2014 was a strong year for the segment as full year operating earnings grew 27 percent from
improved product mix, volume growth, productivity and a gain on termination of a distribution agreement, partially offset
by the negative impact of currency.
Market conditions are expected to remain challenging in Europe where the Russia food import ban continues to have
an effect and currency will be a strong headwind. In the first quarter, we expect sales and operating earnings to be
about flat with broad-based volume gains negated by the impact of currency.
Full year sales are expected to be about flat with broad-based volume gains offset by currency. Full year operating
earnings are expected to be mid-single digits percent higher benefitting from lower raw material costs, improved mix
and a continued focus on productivity, further expanding operating margins.

Segment Commentary Fourth Quarter Earnings 2014
26
Safety & Protection
Sales of $943 million were down 3 percent as volume growth was more than offset by the impact of the Sontara® divestiture.
Higher volumes in industrial markets, including demand for Nomex® thermal resistant fiber, Kevlar® high strength materials
and Tyvek® protective material, were offset by currency.
Nomex® demand growth was fueled by thermal industrial and energy solutions applications. Kevlar® demand growth was
driven by increased sales into the public and transportation sectors. Tyvek® demand was driven by industrial demand and
the global Ebola response. Regionally, sales volume growth in Europe, the United States, and Canada, was offset by lower
volumes in Latin America.
Fourth quarter segment operating earnings of $209 million were flat year over year. Operating earnings benefitted from
improved margins, increased demand from industrial markets, lower costs, and continued benefits from productivity were
offset by portfolio changes and currency.
Full year 2014 operating earnings of $794 million increased $104 million, or 15 percent, from higher volumes driven by
increased demand for Nomex® thermal resistant fiber and Kevlar® high strength materials, productivity improvements and
lower product costs, partially offset by lower sales from clean technologies offerings and portfolio changes. Operating
margins were up 260 basis points versus prior year.
In the first quarter 2015, volume growth in the mid-to-high single digits percent will be more than offset by the impact of
currency and portfolio changes. Operating earnings growth in the mid-single digit percent range on mix enrichment and
sustained operational productivity.
For the full year 2015, segment sales are expected to be flat and earnings up in the low-teens on a percentage basis as
strong volume growth, continued margin improvement and productivity, will be offset by portfolio changes and currency.

Segment Commentary Fourth Quarter Earnings 2014
27
Performance Chemicals
Sales were down 6 percent due primarily to a 5 percent negative portfolio impact. Volumes were up 3 percent on solid
demand for chemicals and fluoroproducts. In Ti02, volumes were flat and prices were down 7 percent from the prior year,
6 percent on a sequential basis. Competitive pressures in Ti02 remain high as soft industry fundamentals, especially in
Europe, contributed to lower prices in the quarter. We believe industry utilization rates remain essentially unchanged with
inventory levels near normal.
Operating earnings were down 1 percent as gains from the sales of non-strategic assets, higher volumes and lower costs
were more than offset by lower segment prices, currency and portfolio impacts. The fourth quarter included a gain of $23
million from the sale of a business.
For the full year 2014, sales declined 6 percent and operating earnings declined 8 percent due primarily to lower segment
prices paired with the negative impact of portfolio changes.
In the first quarter 2015, we anticipate sales will be down in the mid-single digits on a percent basis and operating
earnings will be down about 35 percent due primarily to lower USD pricing.
Full year 2015, segment volumes are expected to grow at 1-2 times the rate of GDP with full year sales up low-single
digits on a percent basis. Full year operating earnings are expected to be about flat as higher volumes are offset by the
negative impact of currency and portfolio changes.

INDEX PAGE
SELECTED OPERATING RESULTS 28
SELECTED INCOME STATEMENT DATA 29
SEGMENT SALES 30
SEGMENT PRETAX OPERATING INCOME 31
SEGMENT OPERATING EARNINGS 32
SIGNIFICANT ITEMS BY SEGMENT - PRETAX OPERATING INCOME 33
RECONCILIATION OF NON-GAAP MEASURES 34-36
RECONCILIATION OF BASE INCOME TAX RATE TO EFFECTIVE INCOME TAX RATE 37
Note: Management believes that an analysis of operating earnings (as defined on page 28), a "non-GAAP" measure, is meaningful to investors because it provides insight with respect to ongoing operating results of the company. Such measurements are not recognized in accordance with generally accepted accounting principles (GAAP) and should not be viewed as an alternative to GAAP measures of performance.
E. I. DU PONT DE NEMOURS AND COMPANY AND CONSOLIDATED SUBSIDIARIESQUARTERLY SUPPLEMENTAL FINANCIAL DATA AND NON-GAAP RECONCILIATIONS
(UNAUDITED)DECEMBER 31, 2014

4Q14 Supplemental Financial Data and Non-GAAP Reconciliations 28 1/27/2015
E. I. DU PONT DE NEMOURS AND COMPANY AND CONSOLIDATED SUBSIDIARIES
Year Year Year Year2014 4Q14 3Q14 2Q14 1Q14 2013 4Q13 3Q13 2Q13 1Q13 2012 4Q12 3Q12 2Q12 1Q12 2011
INCOME STATEMENT DATAConsolidated Net Sales 34,723 7,378 7,511 9,706 10,128 35,734 7,747 7,735 9,844 10,408 34,812 7,325 7,390 9,917 10,180 33,681
Operating Earnings After Income Taxes, 3,703 649 497 1,085 1,472 3,632 558 426 1,189 1,459 3,566 193 405 1,421 1,547 3,790 Attributable to DuPont (1)
Significant Items - After-tax (9) 39 (44) 8 (12) (423) (294) (71) (78) 20 (680) (91) (342) (215) (32) (237)
Non-Operating Pension & OPEB Costs - After-tax (84) (20) (20) (23) (21) (360) (81) (95) (85) (99) (439) (99) (106) (116) (118) (361)
Income from Continuing Operations After Income TaxesAttributable to DuPont 3,610 668 433 1,070 1,439 2,849 183 260 1,026 1,380 2,447 3 (43) 1,090 1,397 3,192
Depreciation 1,254 310 309 323 312 1,280 319 317 317 327 1,319 328 331 332 328 1,199
STATEMENT OF CASH FLOW DATA (2)Cash Provided by (Used for) Operating Activities 3,712 5,514 269 350 (2,421) 3,179 5,512 298 36 (2,667) 4,849 5,275 691 760 (1,877) 5,152
Capital Expenditures (3) 2,062 714 544 462 342 1,940 674 478 449 339 1,890 720 460 407 303 1,910
(1) Operating earnings are defined as earnings from continuing operations (GAAP) excluding “significant items” and “non-operating pension and other post-employment benefit (OPEB) costs”.(2) Data is on a total company basis.(3) Includes purchases of property, plant and equipment and investment in affiliates.
Note: The data above provides a historical display of Selected Income Statement Data included in our Quarterly EarningsRelease financials. See Quarterly Earnings Release financials for full details, including details on "Significant Items".
SELECTED OPERATING RESULTS (UNAUDITED)(dollars in millions)

4Q14 Supplemental Financial Data and Non-GAAP Reconciliations 29 1/27/2015
E. I. DU PONT DE NEMOURS AND COMPANY AND CONSOLIDATED SUBSIDIARIES
Year Year Year Year2014 4Q14 3Q14 2Q14 1Q14 2013 4Q13 3Q13 2Q13 1Q13 2012 4Q12 3Q12 2Q12 1Q12 2011
Consolidated Net Sales 34,723 7,378 7,511 9,706 10,128 35,734 7,747 7,735 9,844 10,408 34,812 7,325 7,390 9,917 10,180 33,681
Segment Sales 35,011 7,439 7,580 9,783 10,209 36,046 7,814 7,813 9,925 10,494 35,194 7,397 7,480 10,022 10,295 34,087
Segment Operating Earnings (1) 5,955 1,014 923 1,770 2,248 5,925 939 853 1,857 2,276 6,251 616 921 2,241 2,473 6,292
Adjusted EBIT (Operating Earnings) (1) (2) 5,435 992 969 1,529 1,945 5,021 675 587 1,693 2,066 5,147 346 614 2,058 2,129 5,293
Adjusted EBITDA (Operating Earnings) (1) (2) 7,052 1,371 1,327 1,972 2,382 6,624 1,062 966 2,097 2,499 6,778 740 1,007 2,475 2,556 6,744
Operating Earnings Before Income Taxes (1) 5,069 905 877 1,439 1,848 4,587 567 482 1,582 1,956 4,708 230 501 1,950 2,027 4,886
Operating Earnings Per Share (1) (3) 4.01 0.71 0.54 1.17 1.58 3.88 0.59 0.45 1.28 1.56 3.77 0.20 0.43 1.50 1.64 4.02
(1) See Reconciliation of Non-GAAP Measures.
(2) Adjusted EBIT from operating earnings is operating earnings (as defined on page 28) before income taxes, net income attributable to noncontrolling interests and interest expense. Adjusted EBITDA from operating earnings is adjusted EBIT from operating earnings before depreciation and amortization of intangible assets.
(3) Earnings per share for the year may not equal the sum of quarterly earnings per share due to changes in average share calculations.
Note:
SELECTED INCOME STATEMENT DATAOPERATING EARNINGS (UNAUDITED)(dollars in millions, except per share)
The data above provides a historical display of Selected Income Statement Data included in our Quarterly Earnings Release financials. See Quarterly Earnings Release financials for full details, including details on "Significant Items".

4Q14 Supplemental Financial Data and Non-GAAP Reconciliations 30 1/27/2015
E. I. DU PONT DE NEMOURS AND COMPANY AND CONSOLIDATED SUBSIDIARIES
Year Year Year Year2014 4Q14 3Q14 2Q14 1Q14 2013 4Q13 3Q13 2Q13 1Q13 2012 4Q12 3Q12 2Q12 1Q12 2011
Agriculture 11,304 1,732 1,563 3,615 4,394 11,739 1,806 1,633 3,631 4,669 10,426 1,535 1,423 3,388 4,080 9,166 Electronics & Communications 2,393 573 623 617 580 2,549 642 638 653 616 2,701 622 607 795 677 3,173 Industrial Biosciences 1,258 322 318 317 301 1,224 326 305 304 289 1,180 300 292 300 288 705 Nutrition & Health 3,529 843 899 926 861 3,473 872 868 865 868 3,422 853 876 885 808 2,460 Performance Chemicals(1) 6,497 1,564 1,646 1,696 1,591 6,932 1,671 1,781 1,837 1,643 7,450 1,644 1,794 2,043 1,969 8,055 Performance Materials(1) 6,129 1,461 1,552 1,582 1,534 6,239 1,521 1,602 1,615 1,501 6,185 1,478 1,552 1,624 1,531 6,554 Safety & Protection 3,896 943 977 1,029 947 3,884 975 985 1,017 907 3,825 964 934 986 941 3,934 Other 5 1 2 1 1 6 1 1 3 1 5 1 2 1 1 40
Total Segment Sales 35,011 7,439 7,580 9,783 10,209 36,046 7,814 7,813 9,925 10,494 35,194 7,397 7,480 10,022 10,295 34,087
Elimination of Transfers (288) (61) (69) (77) (81) (312) (67) (78) (81) (86) (382) (72) (90) (105) (115) (406)
CONSOLIDATED NET SALES 34,723 7,378 7,511 9,706 10,128 35,734 7,747 7,735 9,844 10,408 34,812 7,325 7,390 9,917 10,180 33,681
(1) Prior periods reflect the reclassifications of Viton® fluoroelastomers from Performance Materials to Performance Chemicals.
Note: The data above provides a historical display of selected data included in our Quarterly Earnings Release financials.
SEGMENT SALES
SEGMENT SALES (UNAUDITED)(dollars in millions)

4Q14 Supplemental Financial Data and Non-GAAP Reconciliations 31 1/27/2015
E. I. DU PONT DE NEMOURS AND COMPANY AND CONSOLIDATED SUBSIDIARIES
Year Year Year Year2014 4Q14 3Q14 2Q14 1Q14 2013 4Q13 3Q13 2Q13 1Q13 2012 4Q12 3Q12 2Q12 1Q12 2011
Agriculture 2,668 492 (55) 789 1,442 2,132 (108) (102) 861 1,481 1,669 (103) (198) 682 1,288 1,566 Electronics & Communications 271 81 94 21 75 203 (38) 97 95 49 222 41 (99) 221 59 438 Industrial Biosciences 198 38 47 57 56 170 41 45 43 41 159 41 37 42 39 2 Nutrition & Health 365 75 100 97 93 305 87 81 61 76 270 22 64 105 79 76 Performance Chemicals(1) 913 226 249 232 206 941 228 189 268 256 1,826 210 417 613 586 2,162 Performance Materials(1) 1,590 262 370 665 293 1,264 278 367 332 287 1,073 263 223 325 262 1,031 Safety & Protection 742 188 201 178 175 694 213 171 172 138 562 130 92 181 159 661 Other (391) (132) (83) (84) (92) (340) (91) (107) (55) (87) (412) (80) (75) (208) (49) (55)
TOTAL SEGMENT PRETAX OPERATING INCOME 6,356 1,230 923 1,955 2,248 5,369 610 741 1,777 2,241 5,369 524 461 1,961 2,423 5,881
Net Exchange Gains (Losses) 135 122 218 (109) (96) (128) (73) (101) 35 11 (215) (54) (130) 50 (81) (146) Non-Operating Pension & OPEBs Costs (124) (30) (30) (34) (30) (539) (124) (142) (126) (147) (654) (147) (157) (174) (176) (540)
Corporate Expenses (999) (272) (232) (278) (217) (765) (183) (162) (206) (214) (948) (240) (233) (224) (251) (869) Interest Expense (377) (87) (93) (94) (103) (448) (108) (108) (115) (117) (464) (117) (116) (117) (114) (447)
INCOME (LOSS) FROM CONTINUING OPERATIONSBEFORE INCOME TAXES 4,991 963 786 1,440 1,802 3,489 122 228 1,365 1,774 3,088 (34) (175) 1,496 1,801 3,879
(1,370) (295) (352) (366) (357) (626) 61 35 (335) (387) (616) 38 135 (397) (392) (647)
INCOME (LOSS) FROM CONTINUING OPERATIONSAFTER INCOME TAXES 3,621 668 434 1,074 1,445 2,863 183 263 1,030 1,387 2,472 4 (40) 1,099 1,409 3,232
(1) Prior periods reflect the reclassifications of Viton® fluoroelastomers from Performance Materials to Performance Chemicals.
Note: The data above provides a historical display of selected data included in our Quarterly Earnings Release financials.
SEGMENT PRETAX OPERATING INCOME (LOSS)
INCOME FROM CONTINUING OPERATIONS (UNAUDITED)(dollars in millions)
(Provision For) Benefit From Income Taxes on Continuing Operations

4Q14 Supplemental Financial Data and Non-GAAP Reconciliations 32 1/27/2015
E. I. DU PONT DE NEMOURS AND COMPANY AND CONSOLIDATED SUBSIDIARIES
Year Year Year Year2014 4Q14 3Q14 2Q14 1Q14 2013 4Q13 3Q13 2Q13 1Q13 2012 4Q12 3Q12 2Q12 1Q12 2011
Agriculture 2,352 129 (55) 836 1,442 2,483 88 (62) 941 1,516 2,138 (77) (70) 947 1,338 1,791 Electronics & Communications 355 97 94 89 75 334 93 97 95 49 259 43 58 99 59 438 Industrial Biosciences 211 49 47 59 56 169 40 45 43 41 162 41 40 42 39 81 Nutrition & Health 380 82 100 105 93 299 81 81 61 76 319 58 77 105 79 202 Performance Chemicals(1) 934 228 249 251 206 1,015 230 261 268 256 1,862 243 420 613 586 2,162 Performance Materials(1) 1,298 332 370 303 293 1,280 294 367 332 287 1,177 266 324 325 262 984 Safety & Protection 794 209 201 209 175 690 209 171 172 138 620 133 147 181 159 661 Other (369) (112) (83) (82) (92) (345) (96) (107) (55) (87) (286) (91) (75) (71) (49) (27)
TOTAL SEGMENT OPERATING EARNINGS 5,955 1,014 923 1,770 2,248 5,925 939 853 1,857 2,276 6,251 616 921 2,241 2,473 6,292
Corporate Expenses (702) (144) (171) (186) (201) (762) (191) (162) (195) (214) (864) (215) (174) (224) (251) (813) Interest Expense (377) (87) (93) (94) (103) (448) (108) (108) (115) (117) (464) (117) (116) (117) (114) (447)
4,876 783 659 1,490 1,944 4,715 640 583 1,547 1,945 4,923 284 631 1,900 2,108 5,032
(938) (71) (122) (347) (398) (983) (43) (111) (373) (456) (1,190) (61) (164) (460) (505) (1,137) Net After-tax Exhange (Losses) Gains (224) (63) (39) (54) (68) (86) (39) (43) 19 (23) (142) (29) (59) (10) (44) (65) Less: Net Income Attr. to Noncontrolling Interests 11 - 1 4 6 14 - 3 4 7 25 1 3 9 12 40
OPERATING EARNINGS 3,703 649 497 1,085 1,472 3,632 558 426 1,189 1,459 3,566 193 405 1,421 1,547 3,790
Net Income Attributable to Noncontrolling Interests 11 - 1 4 6 14 - 3 4 7 25 1 3 9 12 40 Non-Operating Pension & OPEB Costs - After-tax (84) (20) (20) (23) (21) (360) (81) (95) (85) (99) (439) (99) (106) (116) (118) (361) Significant Items - After-tax (9) 39 (44) 8 (12) (423) (294) (71) (78) 20 (680) (91) (342) (215) (32) (237)
INCOME (LOSS) FROM CONTINUING OPERATIONSAFTER INCOME TAXES 3,621 668 434 1,074 1,445 2,863 183 263 1,030 1,387 2,472 4 (40) 1,099 1,409 3,232
(1) Prior periods reflect the reclassifications of Viton® fluoroelastomers from Performance Materials to Performance Chemicals.
Note: The data above provides a historical display of selected data included in our Quarterly Earnings Release financials.
OPERATING EARNINGS BEFORE INCOME TAXES AND EXCHANGE (LOSSES) GAINS
Provision For Income Taxes on Operating Earnings, Excluding Taxes on Exchange (Losses) Gains
SEGMENT OPERATING EARNINGS
OPERATING EARNINGS (UNAUDITED) (dollars in millions)

4Q14 Supplemental Financial Data and Non-GAAP Reconciliations 33 1/27/2015
E. I. DU PONT DE NEMOURS AND COMPANY AND CONSOLIDATED SUBSIDIARIES
SEGMENT PRETAX IMPACT OF Year Year Year YearSIGNIFICANT ITEMS 2014 4Q14 3Q14 2Q14 1Q14 2013 4Q13 3Q13 2Q13 1Q13 2012 4Q12 3Q12 2Q12 1Q12 2011
Agriculture 316 363 - (47) - (351) (196) (40) (80) (35) (469) (26) (128) (265) (50) (225) Electronics & Communications (84) (16) - (68) - (131) (131) - - - (37) (2) (157) 122 - - Industrial Biosciences (13) (11) - (2) - 1 1 - - - (3) - (3) - - (79) Nutrition & Health (15) (7) - (8) - 6 6 - - - (49) (36) (13) - - (126) Performance Chemicals (21) (2) - (19) - (74) (2) (72) - - (36) (33) (3) - - - Performance Materials 292 (70) - 362 - (16) (16) - - - (104) (3) (101) - - 47 Safety & Protection (52) (21) - (31) - 4 4 - - - (58) (3) (55) - - - Other (22) (20) - (2) - 5 5 - - - (126) 11 - (137) - (28)
TOTAL SIGNIFICANT ITEMS
BY SEGMENT - PRETAX 401 216 - 185 - (556) (329) (112) (80) (35) (882) (92) (460) (280) (50) (411)
Note: The data above provides a historical display of significant items included in our Quarterly Earnings Release financials.
SIGNIFICANT ITEMS BY SEGMENT - PRETAX OPERATING INCOME (UNAUDITED)(dollars in millions)

4Q14 Supplemental Financial Data and Non-GAAP Reconciliations 34 1/27/2015
E. I. DU PONT DE NEMOURS AND COMPANY AND CONSOLIDATED SUBSIDIARIES
Year Year Year Year2014 4Q14 3Q14 2Q14 1Q14 2013 4Q13 3Q13 2Q13 1Q13 2012 4Q12 3Q12 2Q12 1Q12 2011
RECONCILIATION OF DILUTED EPS (1)
Operating EPS 4.01 0.71 0.54 1.17 1.58 3.88 0.59 0.45 1.28 1.56 3.77 0.20 0.43 1.50 1.64 4.02 Non-Operating Pension & OPEB Costs (0.10) (0.02) (0.02) (0.03) (0.03) (0.39) (0.09) (0.09) (0.10) (0.11) (0.46) (0.11) (0.11) (0.12) (0.12) (0.39) Significant Items (0.01) 0.04 (0.05) 0.01 (0.01) (0.45) (0.31) (0.08) (0.08) 0.02 (0.72) (0.09) (0.37) (0.23) (0.04) (0.25) GAAP EPS from continuing operations 3.90 0.73 0.47 1.15 1.54 3.04 0.19 0.28 1.10 1.47 2.59 - (0.05) 1.15 1.48 3.38
RECONCILIATION OF SEGMENT PTOI
Segment Operating Earnings 5,955 1,014 923 1,770 2,248 5,925 939 853 1,857 2,276 6,251 616 921 2,241 2,473 6,292 Significant Items included in Segment PTOI 401 216 - 185 - (556) (329) (112) (80) (35) (882) (92) (460) (280) (50) (411) Segment PTOI 6,356 1,230 923 1,955 2,248 5,369 610 741 1,777 2,241 5,369 524 461 1,961 2,423 5,881
RECONCILIATION OF ADJUSTED EBIT / ADJUSTED EBITDA TO CONSOLIDATED INCOME STATEMENTS
Income From Continuing Operations Before Income Taxes 4,991 963 786 1,440 1,802 3,489 122 228 1,365 1,774 3,088 (34) (175) 1,496 1,801 3,879 Add: Significant Items - Pretax - (Benefit) / Charge (46) (88) 61 (35) 16 559 321 112 91 35 966 117 519 280 50 467 Add: Non-Operating Pension & OPEB Costs - Pretax 124 30 30 34 30 539 124 142 126 147 654 147 157 174 176 540 Operating Earnings Before Income Taxes 5,069 905 877 1,439 1,848 4,587 567 482 1,582 1,956 4,708 230 501 1,950 2,027 4,886 Less: Net Income Attributable to Noncontrolling Interests 11 - 1 4 6 14 - 3 4 7 25 1 3 9 12 40 Add: Interest Expense 377 87 93 94 103 448 108 108 115 117 464 117 116 117 114 447
Adjusted EBIT (Operating Earnings) 5,435 992 969 1,529 1,945 5,021 675 587 1,693 2,066 5,147 346 614 2,058 2,129 5,293
Add: Depreciation and Amortization 1,617 379 358 443 437 1,603 387 379 404 433 1,631 394 393 417 427 1,451
Adjusted EBITDA (Operating Earnings) 7,052 1,371 1,327 1,972 2,382 6,624 1,062 966 2,097 2,499 6,778 740 1,007 2,475 2,556 6,744
(1) Earnings per share for the year may not equal the sum of quarterly earnings per share due to changes in average share calculations.
RECONCILIATION OF NON-GAAP MEASURES (UNAUDITED)(dollars in millions, except per share)
4Q14 Supplemental Financial Data and Non-GAAP Reconciliations 35 1/27/2015
E. I. DU PONT DE NEMOURS AND COMPANY AND CONSOLIDATED SUBSIDIARIES
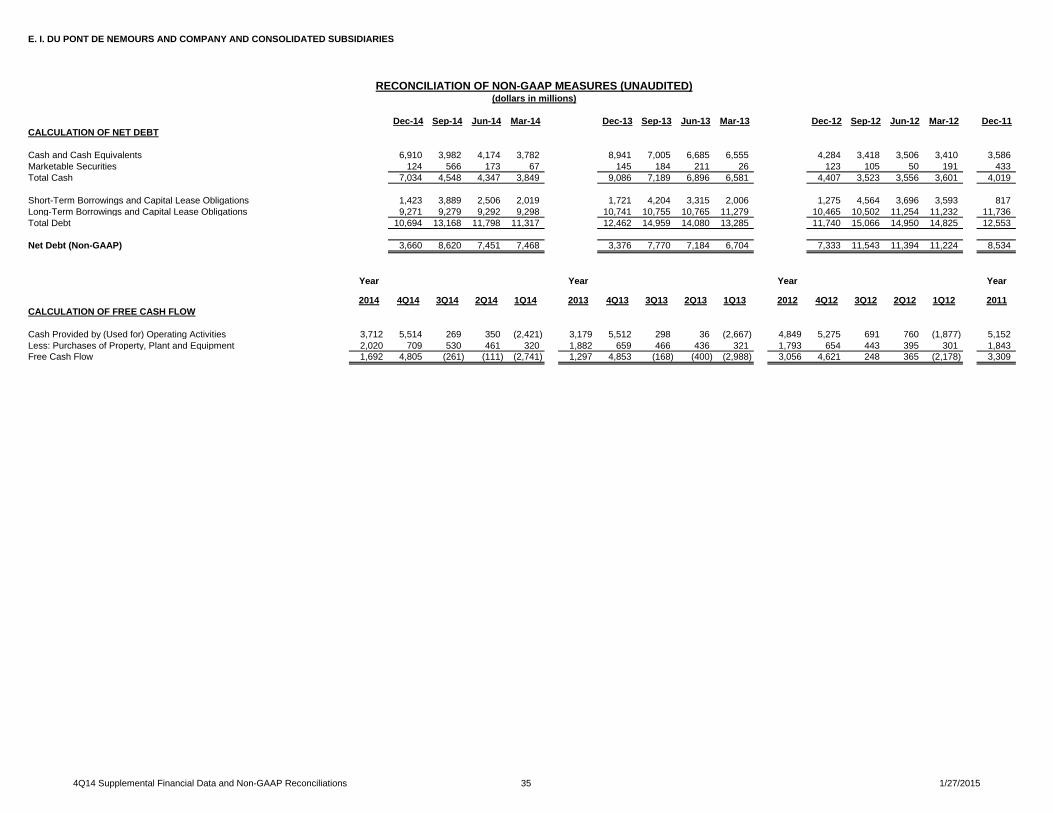
Dec-14 Sep-14 Jun-14 Mar-14 Dec-13 Sep-13 Jun-13 Mar-13 Dec-12 Sep-12 Jun-12 Mar-12 Dec-11CALCULATION OF NET DEBT
Cash and Cash Equivalents 6,910 3,982 4,174 3,782 8,941 7,005 6,685 6,555 4,284 3,418 3,506 3,410 3,586 Marketable Securities 124 566 173 67 145 184 211 26 123 105 50 191 433 Total Cash 7,034 4,548 4,347 3,849 9,086 7,189 6,896 6,581 4,407 3,523 3,556 3,601 4,019
Short-Term Borrowings and Capital Lease Obligations 1,423 3,889 2,506 2,019 1,721 4,204 3,315 2,006 1,275 4,564 3,696 3,593 817 Long-Term Borrowings and Capital Lease Obligations 9,271 9,279 9,292 9,298 10,741 10,755 10,765 11,279 10,465 10,502 11,254 11,232 11,736 Total Debt 10,694 13,168 11,798 11,317 12,462 14,959 14,080 13,285 11,740 15,066 14,950 14,825 12,553
Net Debt (Non-GAAP) 3,660 8,620 7,451 7,468 3,376 7,770 7,184 6,704 7,333 11,543 11,394 11,224 8,534
Year Year Year Year
2014 4Q14 3Q14 2Q14 1Q14 2013 4Q13 3Q13 2Q13 1Q13 2012 4Q12 3Q12 2Q12 1Q12 2011CALCULATION OF FREE CASH FLOW
Cash Provided by (Used for) Operating Activities 3,712 5,514 269 350 (2,421) 3,179 5,512 298 36 (2,667) 4,849 5,275 691 760 (1,877) 5,152 Less: Purchases of Property, Plant and Equipment 2,020 709 530 461 320 1,882 659 466 436 321 1,793 654 443 395 301 1,843 Free Cash Flow 1,692 4,805 (261) (111) (2,741) 1,297 4,853 (168) (400) (2,988) 3,056 4,621 248 365 (2,178) 3,309
RECONCILIATION OF NON-GAAP MEASURES (UNAUDITED)(dollars in millions)

4Q14 Supplemental Financial Data and Non-GAAP Reconciliations 36 1/27/2015
E. I. DU PONT DE NEMOURS AND COMPANY AND CONSOLIDATED SUBSIDIARIES
Year Year Year Year2014 4Q14 3Q14 2Q14 1Q14 2013 4Q13 3Q13 2Q13 1Q13 2012 4Q12 3Q12 2Q12 1Q12 2011
SEGMENT PTOI MARGIN % (PTOI / Segment Sales) (1)
Agriculture 23.6% 28.4% -3.5% 21.8% 32.8% 18.2% -6.0% -6.2% 23.7% 31.7% 16.0% -6.7% -13.9% 20.1% 31.6% 17.1%Electronics & Communications 11.3% 14.1% 15.1% 3.4% 12.9% 8.0% -5.9% 15.2% 14.5% 8.0% 8.2% 6.6% -16.3% 27.8% 8.7% 13.8%Industrial Biosciences 15.7% 11.8% 14.8% 18.0% 18.6% 13.9% 12.6% 14.8% 14.1% 14.2% 13.5% 13.7% 12.7% 14.0% 13.5% 0.3%Nutrition & Health 10.3% 8.9% 11.1% 10.5% 10.8% 8.8% 10.0% 9.3% 7.1% 8.8% 7.9% 2.6% 7.3% 11.9% 9.8% 3.1%Performance Chemicals(2) 14.1% 14.5% 15.1% 13.7% 12.9% 13.6% 13.6% 10.6% 14.6% 15.6% 24.5% 12.8% 23.2% 30.0% 29.8% 26.8%Performance Materials(2) 25.9% 17.9% 23.8% 42.0% 19.1% 20.3% 18.3% 22.9% 20.6% 19.1% 17.3% 17.8% 14.4% 20.0% 17.1% 15.7%Safety & Protection 19.0% 19.9% 20.6% 17.3% 18.5% 17.9% 21.8% 17.4% 16.9% 15.2% 14.7% 13.5% 9.9% 18.4% 16.9% 16.8%
TOTAL SEGMENT PTOI MARGIN % 18.2% 16.5% 12.2% 20.0% 22.0% 14.9% 7.8% 9.5% 17.9% 21.4% 15.3% 7.1% 6.2% 19.6% 23.5% 17.3%
SEGMENT OPERATING EARNINGS MARGIN % (Operating Earnings / Segment Sales) (1)
Agriculture 20.8% 7.4% -3.5% 23.1% 32.8% 21.2% 4.9% -3.8% 25.9% 32.5% 20.5% -5.0% -4.9% 28.0% 32.8% 19.5%Electronics & Communications 14.8% 16.9% 15.1% 14.4% 12.9% 13.1% 14.5% 15.2% 14.5% 8.0% 9.6% 6.9% 9.6% 12.5% 8.7% 13.8%Industrial Biosciences 16.8% 15.2% 14.8% 18.6% 18.6% 13.8% 12.3% 14.8% 14.1% 14.2% 13.7% 13.7% 13.7% 14.0% 13.5% 11.5%Nutrition & Health 10.8% 9.7% 11.1% 11.3% 10.8% 8.6% 9.3% 9.3% 7.1% 8.8% 9.3% 6.8% 8.8% 11.9% 9.8% 8.2%Performance Chemicals(2) 14.4% 14.6% 15.1% 14.8% 12.9% 14.6% 13.8% 14.7% 14.6% 15.6% 25.0% 14.8% 23.4% 30.0% 29.8% 26.8%Performance Materials(2) 21.2% 22.7% 23.8% 19.2% 19.1% 20.5% 19.3% 22.9% 20.6% 19.1% 19.0% 18.0% 20.9% 20.0% 17.1% 15.0%Safety & Protection 20.4% 22.2% 20.6% 20.3% 18.5% 17.8% 21.4% 17.4% 16.9% 15.2% 16.2% 13.8% 15.7% 18.4% 16.9% 16.8%
17.0% 13.6% 12.2% 18.1% 22.0% 16.4% 12.0% 10.9% 18.7% 21.7% 17.8% 8.3% 12.3% 22.4% 24.0% 18.5%
(2) Prior periods reflect the reclassifications of Viton® fluoroelastomers from Performance Materials to Performance Chemicals.
TOTAL SEGMENT OPERATING EARNINGS MARGIN %
RECONCILIATION OF NON-GAAP MEASURES (UNAUDITED)
(1) Segment PTOI / Operating Earnings margin %'s for Other (which includes the previous Pharmaceuticals segment) are not presented separately above as they are not meaningful; however, the results are included in the Total margin %'s above.

4Q14 Supplemental Financial Data and Non-GAAP Reconciliations 37 1/27/2015
E. I. DU PONT DE NEMOURS AND COMPANY AND CONSOLIDATED SUBSIDIARIES
2015 Outlook1 2014 Actual
Effective income tax rate 21.0% 27.4%Significant items effect and non-operating pension/OPEB costs effect 1.0% (0.7%)
22.0% 26.7%
Exchange gains (losses) effect2 0% (7.5%)Base income tax rate from continuing operations 22.0% 19.2%
1 - Represents the company's anticipated full year tax rates.2 - The company does not forecast the impact of exchange gains (losses) on the projected tax rate.
Tax rate, from continuing operations, before significant items and non-operating pension/OPEB costs
RECONCILIATION OF BASE INCOME TAX RATE TO EFFECTIVE INCOME TAX RATE (UNAUDITED)
Base income tax rate is defined as the effective income tax rate less the effect of exchange gains (losses), significant items and non-operating pension/OPEB costs.
Year ended December 31,

Copyright © 2014 DuPont or its affiliates. All rights reserved. The DuPont Oval Logo, DuPont™, The miracles of science™ and all products denoted with ™ or ® are registered trademarks or trademarks of E. I. du Pont de Nemours and Company or its affiliates.
Images reproduced by E. I. du Pont de Nemours and Company under license from the National Geographic Society.
Copyright © 2015 DuPont or its affiliates. All rights reserved. The DuPont Oval Logo, DuPont™, The miracles of science™ and all products, unless otherwise indicated, denoted with ™ or ® are registered trademarks or trademarks of E. I. du Pont de Nemours and Company or its affiliates.
Images reproduced by E. I. du Pont de Nemours and Company under license from the National Geographic Society.
© National Geographic Image