dtic - defense technical information center · · 2011-05-14the gunsight was modified for this...
TRANSCRIPT
AD-A279 442
NASA TECHNICAL NASA TM X-72811
MEMORANDUM
co
DTICft ELECTE
MAY 16 1994F
DESCRIPTION OF A LANDING SITE INDICATOR (LASI)FOR LIGHT AIRCRAFT OPERATION
Harry V. Fuller and Bruce K.E. Outlaw
January 1976
This doc•mani bchs been approvedfo0 Public el@ease and sals is1distzibuti=c is unlimiied.
This informal documentation medium is used to provide accelerated orspecial release of technical information to selected users. The contentsmay not meet NASA formal editing and publication standards, may be re-vised, or may be incorporated in another publication.
- - I
4h NATIONAL AERONAUTICS AND SPACE ADMINISTRATION
LANGLEY RESEARCH CENTER, HAMPTON, VIRGINIA 23665
91

1. Ron No. 2. Government Acnon No. 3. Recpient's Catalog No.__NASA TM X-728111
4. Title and Subtitle 6. R2ort DateDESCRIPTION OF A LANDING SITE INDICATOR (IA•SI) FOR nay17
LIGHT AIRCRAFT OPERATION 6. "ftorming Orn0zta Code
7. Author(s) 8. Performing Orgenization Report No.
Harry V. Fuller and Bruce K.E. Outlaw10. Work Unit No.
9. Performing Organization Name and Addren
NASA Langley Research Center 1 Contac or Grant No.Hampton, VA 23665
13. Type of Report and Psiod Covered12. Sponsoring Agency Name and Addrvs Technical Memorandum
National Aeronautics & Space Administration 14. spo.w•.g Agency CodeWashington, DC 20546
15. Supplementary Notes
Special Technical Information Release, Not Planned For Formal NASA Publication.
16. Abstract
An experimental cockpit mounted head-up type display system has been developedand evaluated by LaRC pilots during the landing phase of light aircraft opera-tions.
The Landing Site Indicator (LASI) system display consists of angle of attack,angle of sideslip, and indicated airspeed images superimposed on the pilot'sview through the windshield. The information is made visible to the pilotby means of a partially reflective viewing screen which is suspended directlyin front of the pilot's eyes.
Synchro transmitters are operated by vanes, located at the left wing tip, whichsense angle of attack and sideslip angle. Information is presented near thecenter of the display in the form of a moving index on a fixed grid. The air-speed is sensed by a pitot-static pressure transducer and is presented innumerical form at the top center of the display.
17. Key Words (Sugge•sted by Author(s)) (STAR category underlined) 18. Distribution Statement
Display Systems, Landing Site IndicatorLanding Aid, Head-Up Display, Angle of Unclassified - UnlimitedAttack
19. Security Ciaaf. (of this report) 20. Security Claif. (of this pog)e 21. No. of Pages 22. Price*
Unclassified Unclassified 22 $3.25
{The National Technical Information Service, Springfield. Virginia 22151*Available from I
ISTiF/NASA Scientific end Technical Information Facility. P.O. Box 33, Collage Park, MD 20740
SUMMARY
An experimental cockpit mounted head-up type display system has
been developed and evaluated by LaRC pilots during the landing phase
of light aircraft operations.
The Landing Site Indicator (LASI) system display consists of angle
of attack, angle of sideslip, and indicated airspeed images super-
imposed on the pilot's view through the windshield. The information
is made visible to the pilot by means of a partially reflective viewing
screen which is suspended directly in front of the pilot's eyes.
Synchro transmitters are operated by vanes, located at the left
wing tip, which sense angle of attack and sideslip angle. Information
is presented near the center of the display in the form of a moving
index on a fixed grid. The airspeed is sensed by a pitot-static
pressure transducer and is presented in numerical form at the top
center of the display.
INTRODUCTION
The approach and landing phase is the most critical part of light
aircraft operation. Statistics show (Ref. 1) that more accidents occur
during this phase of flight operations than in any other.
In recent years, there has been considerable effort devoted to
the development of head-up type displays to assist pilots during air- L
craft landings (Ref. 2-9). Activity has been centered in military. ......
Availability Codes
Avail and/IorDist Special
and commercial aviation, using cathode ray tube systems or precision
servos and other equipment too expensive for the general aviation air-
craft owner.
The Landing Site Indicator (LASI) is an experimental device for
use in determining the feasibility of head-up displays for general
aviation. Prior to construction of an experimental device, the LASI
concept was investigated in an exploratory simulation study (Ref. 10)
to establish concept feasibility. The experimental unit described
uses a surplus Navy MK-18 reflex gunsight and a pair of servos, of the
type used in the operation of radio controlled hobby aircraft models,
along with the required sensors and electronics.
SYMBOLS
V Indicated airspeed, miles per hour*
a Angle of attack, degrees
P Angle of sideslip, degrees
g Gravitational constant, ft/sec2
p Dynamic pressure, lb/ft 2
p Density of air at sea level, lb/ft 3
*The English system of units is used in this paper because the pilots'display is designed to present airspeed in these units as has beenpast practice in light aircraft.
SYSTEM DESCRIPTION
The LASI system consists of five basic components as shown in
Figure 1. They include the control unit, the electronics unit, the
display unit, the pressure transducer, and the alpha and beta vanes.
Figure 2 shows the display unit and the control unit installed in a
Cherokee 180 aircraft.
Operation - Figure 3 is the system block diagram. The pressure trans-
ducer signal is electronically digitized and then converted to a
numerical display which passes through a lens for reduction. Along
with the image of the fixed grid, the pressure transducer optical
signal passes through a system of mirrors, through a collimating lens
to the beam splitter, and finally to the pilot's eyes.
The alpha and beta signals control the rotation of the servo
mirror which is mounted in a ball and socket pivot allowing for move-
ment in two axes. The index image falls on the servo mirror and ro-
tation by the alpha servo causes the image to move vertically, while
rotation by the beta servo causes horizontal movement of the image.
The image is reflected through collimating lens No. 2 by the
display mirror and then to the beam splitter, where the pilot observes
it superimposed on the outside background.
Sensors - The airflow sensors are a pair of balsa vanes mounted on a
boom attached to the left wing tip of the aircraft. In the horizontal
plane, the vane measures angle of attack, while angle of sideslip is
measured in the vertical plane. Each vane is coupled to a 400 cycle
-1-

synchro transmitter which drives a synchro receiver. The output of
each receiver goes to a synchro converter whose output is a D.C. volt-
age proportional to vane rotation angle. The signal is then converted
in the electronics unit to a pulse width modulated signal for operation
of the display servos. The sensor ranges are -5 to +20 degrees for
alpha, and -10 to +10 degrees for beta.
Airspeed is obtained from the output of a commercial differential
pressure transducer. The transducer range is ±0.5 PSID with a ±5 volt
output linear within ±0.5% of full scale. The displayed airspeed range
is 0 to 199 miles per hour.
Display Unit - Figure 4 shows a simplif-ed schematic of the display
unit. The pilot observes the display through two separate lenses, one
for each eye. Information to his left eye includes indicated airspeed
and a background scale. The pilot's right eye sees only the moving
index, but the two images mentally appear to be superimposed.
The display unit uses a Navy MK-18 reflex gunsight obtained as a
surplus item. The gunsight was modified for this project by removing
all of the original internal parts except the mirrors, lenses, and
light sources. Two hobby-type miniature servos were installed with a
pulley and cord system to pivot the movable mirror in two axes about
its center. This mirror provides alpha and beta information to the
pilot by reflecting the image of the index. Another mirror, fixed,
provides airspeed and a reference scale for the index to the pilot.
As shown in Figure 4, airspeed is provided by three 7-segment
incandescent readout units. When the airspeed readout image is pro-
-2-

jected through the reducing lens, it falls on a wedge-shaped mirror
mounted on the front surface of the grid mask. The collimating lens
focuses the images at infinity so that the pilot can see both the dis-
play and the outside world without having to refocus his eyes.
The index follows a similar optical path to the movable mirror.
The mirror, mounted on the ball joint, has control cords attached to
its sides and top and bottom. Figure 5 is a schematic side view of
the display unit in which the optical path of the index can be seen.
The display, as seen by a pilot during a typical landing approach,
is shown in Figure 6. The index position is a measure of direction of
the aircraft velocity vector relative to the air, and the airspeed
readout indicates the vector magnitude. During a landing approach,
the pilot's objective is to adjust the aircrafts' airspeed and attitude
such that the display index points to an imaginary contact point near
the end of the runway. The aircraft does not actually touch the
ground at this contact point, but instead initiates a flare at some
altitude shortly before arriving at the point. This contact point,
denoted as "landing point grid" in Figure 6, has two positions de-
pending on whether or not the aircrafts' flaps are extended.
The display unit is aligned and calibrated in the cockpit so that
the position of the display grid remains fixed relative to the aircraft
axes. By observing the display during landing, the pilot is thus able
to adjust the airspeed and flightpath of the aircraft to land at the
proper approach speed and angle.
Electronics Unit - The electronics unit has three primary functions.
-3-

First, A.C. signals from the alpha and beta vanes are converted to
pulse-width modulated signals which drive the display servos. Second,
"a D.C. analog signal proportional to dynamic pressure is converted to
"a digital coded signal proportional to indicated airspeed. Signal
filtering is done in the electronics unit to minimize index and air-
speed indicator fluctuations due to air turbulence.
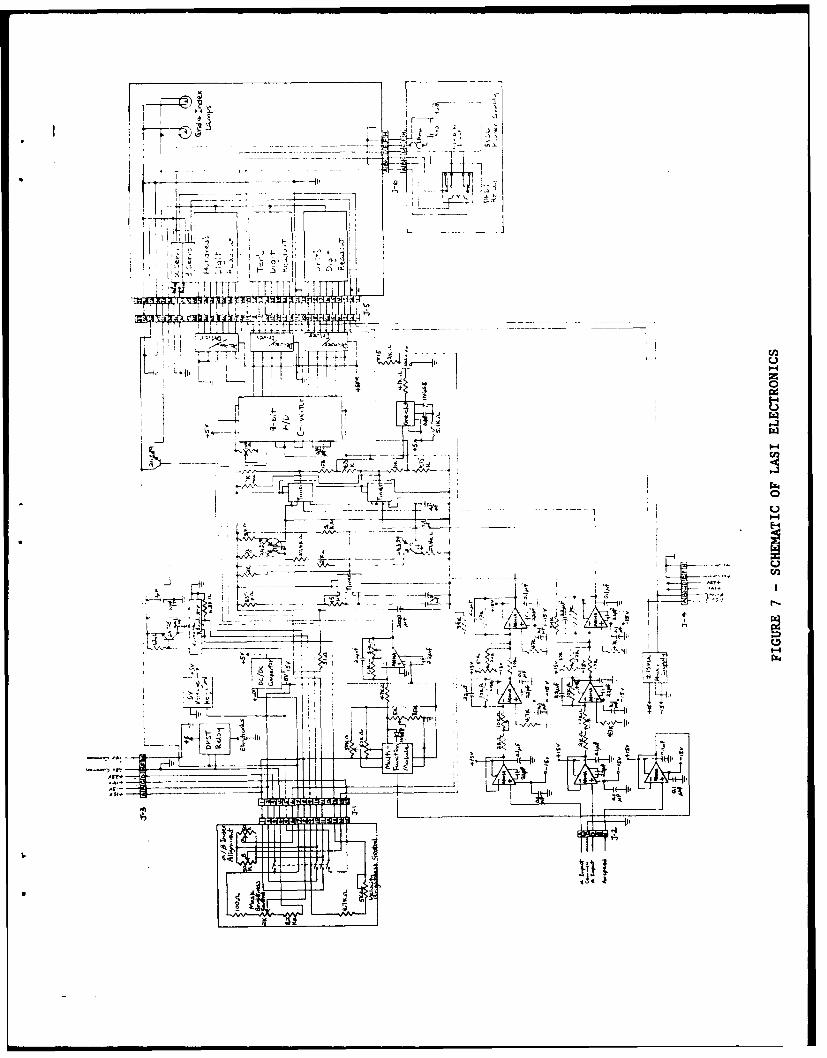
A schematic diagram of the electronics unit is shown in Figure 7.
The alpha and beta signals are buffered, amplified, and then fed to
linear voltage-controlled pulse width modulators. The modulators
maintain a constant output frequency of 50 Hertz with pulse width
variations from one to two milliseconds. The pulse width modulated
signals drive the alpha and beta servos in the display unit. Figure
8 shows the type of servo used.
The electronics unit also contains a square root circuit which
converts the pressure transducer output to a signal proportional to
airspeed. This signal is then digitized and displayed to the pilot.
The relationship between pressure and indicated airspeed is obtained
Bernoulli's equation as:J.
The constant, 0.93 contains conversion factors required to give
airspeed in miles per hour.
The analog-to-digital converter used to digitize the airspeed
system has a nine-bit binary coded decimal (BCD) output with 100% over-
range. The output goes to three 7-segment incandescent readouts via a
-4-

BCD to seven-segment decoder/driver.
Control Unit - The control unit, mounted on the instrument panel of the
aircraft, contains the system power switch, potentiometers for con-
trolling the light intensity of the airspeed and alpha-beta displays,
and potentiometers for zero adjustment of the index. The alpha and
beta index potentiometers provide zero adjustment of the index during
calibration of the system.
"-5-

ENVIRONMENTAL TESTS AND CALIBRATION
Vibration and temperature tests were performed on the LASI system
to insure reliable performance in the aircraft environment. Vibration
tests were conducted on all parts of the system except the sensors,
which were already mounted on the aircraft from previous experiments.
Temperature tests were performed on the electronics unit only, since
the display unit and the control unit were mounted in the temperature
controlled passenger compartment of the aircraft.
The electronics unit was temperature cycled from W0C to 50%C and
back to 0°C. No failures were encountered and temperature compensation
was not necessary.
The LASI system was subjected to 5 to 500 Hertz vibration in three
axes with a sweep rate of 2 octaves per minute at a maximum acceler-
ation of 1.5G's. No failures were experienced.
Calibration was accomplished using D.C. voltage levels to simulate
inputs from the airspeed, alpha and beta sensors. A wall mounted chart,
marked off in degrees horizontally and vertically, was used to cali-
brate the index servos. Gains were adjusted with amplifiers in the
alpha and beta electronics and the zeroes were set with the adjustment
potentiometers in the control unit.
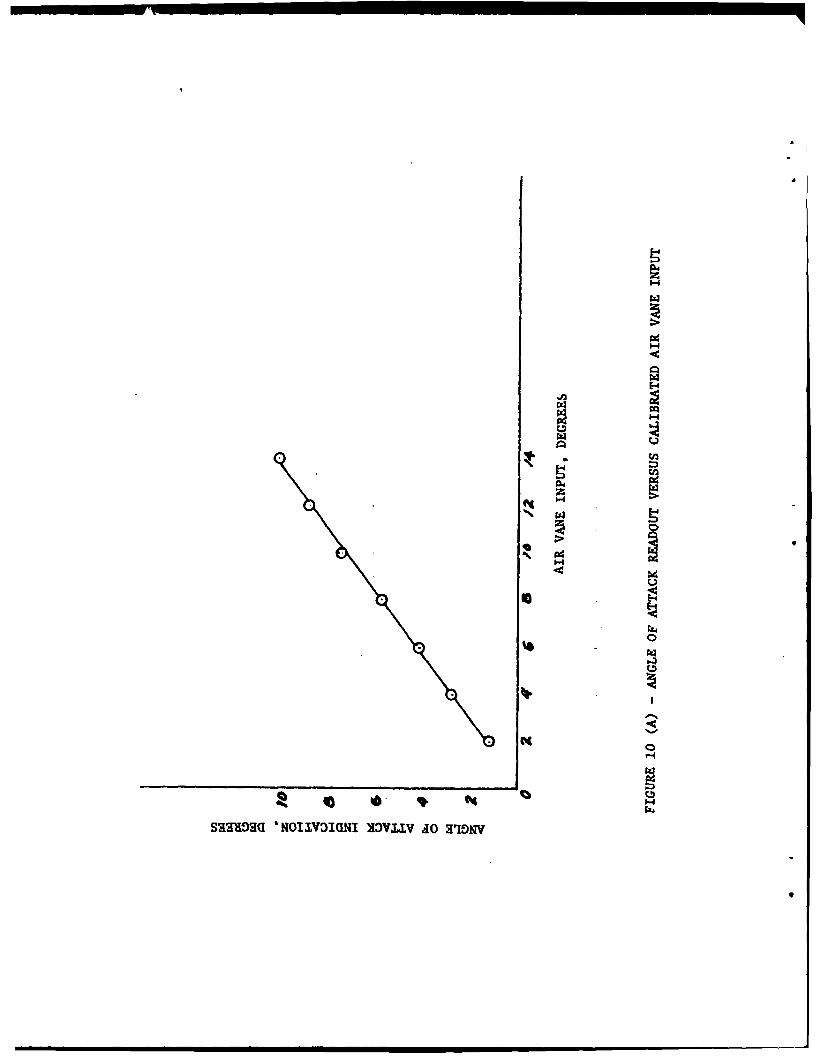
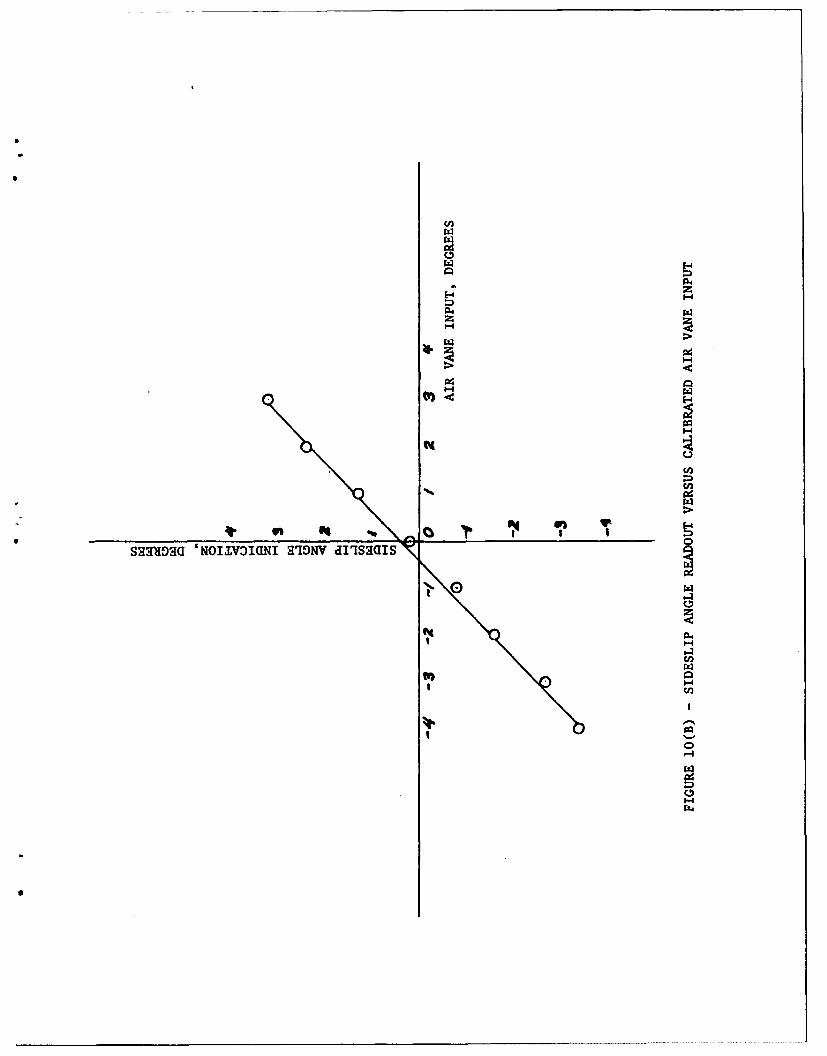
Figure 9 is a logarithmic plot showing the results of calibration
of the indicated airspeed. The plot is linear, has the correct slope
of 2 corresponding to the second-order airspeed equation, and has a
random scatter of ±0.5% of full scale. Figures IO(A) and 10(B) show
"-6-

thL results of the alpha and beta calibration. Both graphs indicate
a linear output with random vibrations within ±3% of full scale.
TEST RESULTS
Thirty flight hours were accumulated with the system. One hun-
dred landings by four individual pilots were accomplished during this
period, including one night landing.
After some initial erratic behavior, due to system grounding pro-
blems, the unit performed satisfactorily, with the exception of some
index jitter due to air turbulence. In addition, the display did not
seem bright enough due to high illumination levels in the cockpit.
The LASI Flight Test Program was designed to establish feasi-
bility and determine pilot acceptance of a head-up type display.
Pilot performance data is being reduced to determine feasibility.
Pilot acceptance was varied among the test pilots. Some veteran
pilots preferred their normal visual cues in performance landings.
Others felt that the head-up display concept would be very helpful for
night flying or as a pilot training aid, although the angle of side-
slip display was considered to be of limited value.
"-7-

CONCLUDING REMARKS
A system (LASI) to provide the pilot with a head-up display of
airspeed, angle of attack and sideslip angle has been designed, fab-
ricated, and flight tested.
At the conclusion of the present phase of the LASI Project, some
areas for improvement are suggested. A better compromise between
noise filtering and response time would be desirable to reduce the in-
fluence of turbulence on angle-of-attack. Angle-of-sideslip could be
eliminated from the display since most of the pilots felt that the
normal visual cues were adequate. Due to the high illumination levels
normally encountered in the cockpit on bright days, more display
brightness would also be a desirable improvement.
-8-

REFERENCES
1. Anonymous; Aircraft Accident Reports, Brief Format, U.S. CivilAviation, Issue #2, 1970 Accidents. Report #NTSB-BA-71-3, NAT.Transp. Sfty. Bd.: October 1, 1971.
2. La Russa, J.A.; Agard Conference Proceedings No. 96 on Guidanceand Controls Displays, Pub. Feb. 1972, pp. 18-1 through 18-10.
3. Elson, B. M.; "Visual Approach Monitor Being Certified", AviationWeek April 3, 1972.
4. Fry D. E., Burden K., Green M. R.; "The Design and Flight Testingof a Take Off and Overshoot Director", Royal Aircraft Establish-ment Tech. Rpt. #66083, March 1966.
5. Naish, J. M.; Application of the Head-up Display (HUD) to aCommercial Jet Transport, Journal of Aircraft, August 1972, Vol.9, No. 8, pp. 530-536.
6. Hussey, C. L.: Evaluation of a Wide-angle Head-up Display OpticalSystem - Final Report, Naval Air Development Center Report #NADC-AM-7042, Dec. 11, 1970.
7. Sones, J. H.; Head-up Display Systems in Modern Aircraft, Proceed-ings Conference on Displays, The University of Technology, Lough-borough, September 7-10, 1971, pp. 263-270.
8. Stein, K. J.; Cat. 2 Jet Tests Head-up Display, Aviation Week andSpace Technology, March 6, 1972, pp. 53-55.
9. Kleinman, D. L. and Baron S.; Analytical Evaluation of Display Re-quirements for Approach to Landing, NASA CR-1952.
10. Harris, Randall L. and Hewes, D. E.; An Exploratory Simulator Studyof a Head-up Display for General Aviation Lightplanes, NASA TND-7456.

E-4-
C>-
F--
P--J
CD0
CD1


E-44
00
__j~
1-4I
IE-4
1-44

-i LJJ
Ie-
Z-E
00
OLLII-->- E-4
L&J
0 zotz;=!d ,
Lai
00nLL rz-
C33

1-40
001-4-
_ _ _ _ _ _ _ _ _ _ _ _ _ I-4
O.P.'
W- IL
I .0
E-4-
I=
c CH Lii
'I
E-4-
0 E--

a--� .-- -I
I-a La..
I-
C-)
0
a-
a-
0-J
C,z'-4
0
-Ja-'I,
2C-,-J
0
I'Ji'm�rn0 -�
Cj2
op., H
p1C., C.,z'-a I
C.,H
ju2
T1r
- TL-111zr L_
=T111

0
E-4
IiIF-4
1-,4

LzJ
L~J
LA-
C144
00 u0
-4
I-
LL.
aisa'inai nnszo
f3J
'-4
'-4
1,.
Nt
S1-4
- 0
U..
N 0
* .4 '-4
'tIoIlv:IIUNI T�IDVUV AO �If�NV
9
Sz
j- -4
rz1-44
1-4e
'-4
VU)
P-4
00
.. .. .. ... .... . .