drx draft re galalar final 110520 vers 3...2020/05/12 · figure 2: isometric view of block model...
TRANSCRIPT

ANNOUNCEMENT
12 May 2020
Galalar Silica resource expands 25% to 47.5Mt
Total Mineral Resource for Diatreme’s Galalar Silica Sand Project, North Qld, increases by 25% to 47.5
million tonnes (Mt), with potential for further expansion
Includes Maiden Measured Mineral Resource estimated comprising 30.9 Mt @ 99.28% SiO2
Increased potential for long‐term silica sand mine developed in partnership with traditional owners, Hopevale Congress, generating new jobs and investment and supporting region’s post‐pandemic recovery.
Emerging silica sands developer and explorer, Diatreme Resources Limited (ASX:DRX) announced today an increase in
the Total Mineral Resource and a maiden Measured Mineral Resource for its Galalar Silica Sand Project in North
Queensland, highlighting the project’s potential to generate valuable long‐term jobs and investment for the benefit of
local stakeholders.
Based on an assessment (refer Table 1 below) by independent consultants Ausrocks Pty Ltd, the maiden Measured
Mineral Resource comprises 30.9 Mt @ 99.28% SiO2, while the total Mineral Resource has expanded to 47.5 Mt, up
25% on the previous estimate of 38 Mt (refer ASX announcement 20 February 2020).
Diatreme’s CEO, Neil McIntyre commented: “This is a pleasing outcome for Galalar and highlights the potential for
the project to become a long‐term source of premium quality silica sand, generating valuable new jobs and other
economic benefits for the local community, including the traditional owners and project partners, Hopevale Congress.
North Queensland needs new investment and employment opportunities to ensure its post‐pandemic recovery and the
Galalar project has the potential to deliver exactly that. The Galalar project is rapidly gaining momentum thanks to
the support of local stakeholders and we look forward to progressing it through next step permitting and approvals as
quickly as possible to mining activity, amid continued strong demand for high‐quality silica sand products from Asian
markets.”
ASX
For
per
sona
l use
onl
y

2
Table 1: Galalar Silica Sand Project: JORC Resource Estimate*
JORC
Category
Al2O3
Grade
Fe2O3
Grade
TiO2
Grade
Cut‐off
SiO2%
SiO2%
Grade
Silica
Sand
(Mm3)
Density
(t/m3)
Silica
Sand
(Mt)
Inferred N/A N/A N/A 99.0% >99.0% 6.54 1.62 10.59
Indicated 0.08 0.06 0.10 98.50 99.10 3.71 1.62 6.02
Measured 0.11 0.09 0.10 98.50 99.28 19.07 1.62 30.89
Inferred +
Indicated +
Measured
29.32 1.62 47.50
* Resource estimate current as of 6 May 2020.
The resource expansion follows the release of an economic study showing the project’s potential to generate more
than 110 full‐time jobs, delivering a significant boost to household incomes. It could inject around $23m‐24m in the
construction phase and up to $42m in the operational phase for the benefit of Hope Vale, Cooktown and the
surrounding region, with estimated total revenue of $80m per annum (refer ASX announcement 8 April 2020).
Diatreme aims to advance the regulatory approval process to ensure the project plays a role in the region’s recovery
from the impact of COVID‐19. In February, the Company lodged an application to undertake a voluntary
Environmental Impact Statement (EIS), which followed last December’s lodgement of a Mining Lease Application.
This announcement was authorised for release by
Neil McIntyre Greg Starr
Chief Executive Officer Chairman
Contact – Mr Neil McIntyre ‐ Ph – 07 33972222
Website ‐ diatreme.com.au
E‐mail ‐ [email protected]
The following is an extract from Ausrocks’ independent report concerning the resource upgrade.
For
per
sona
l use
onl
y
3
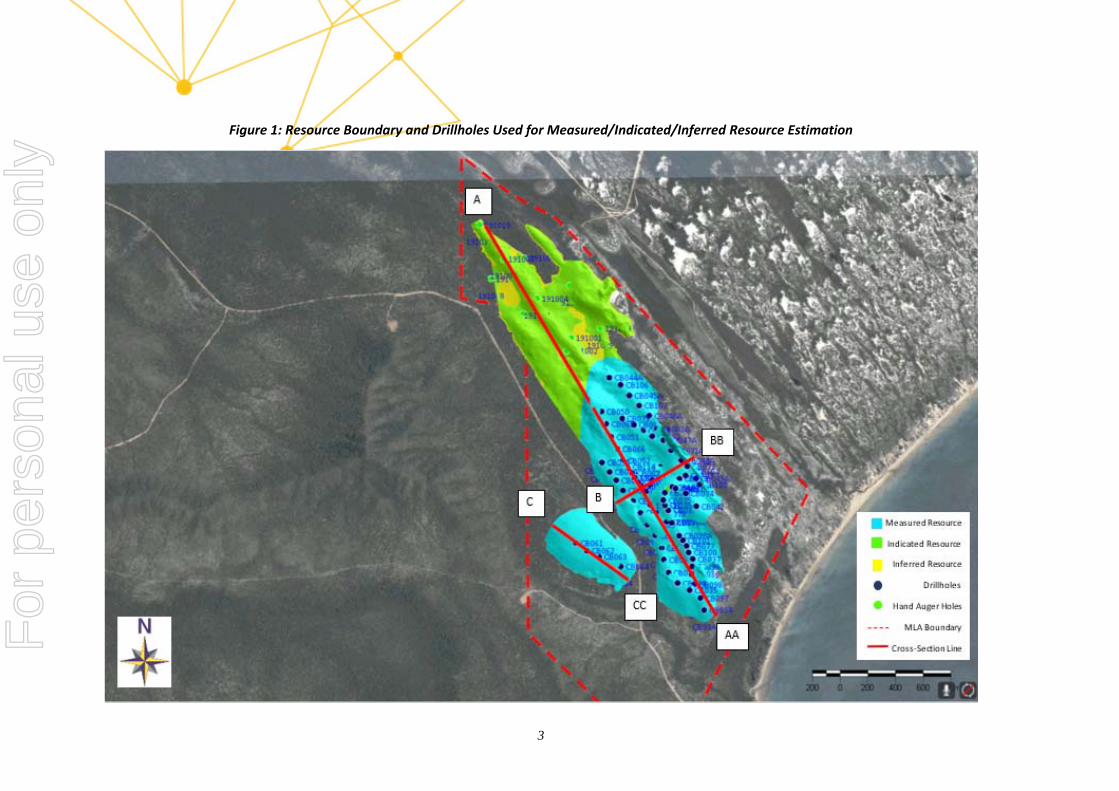
Figure 1: Resource Boundary and Drillholes Used for Measured/Indicated/Inferred Resource Estimation
For
per
sona
l use
onl
y

4
Figure 2: Isometric view of Block Model
For
per
sona
l use
onl
y
5
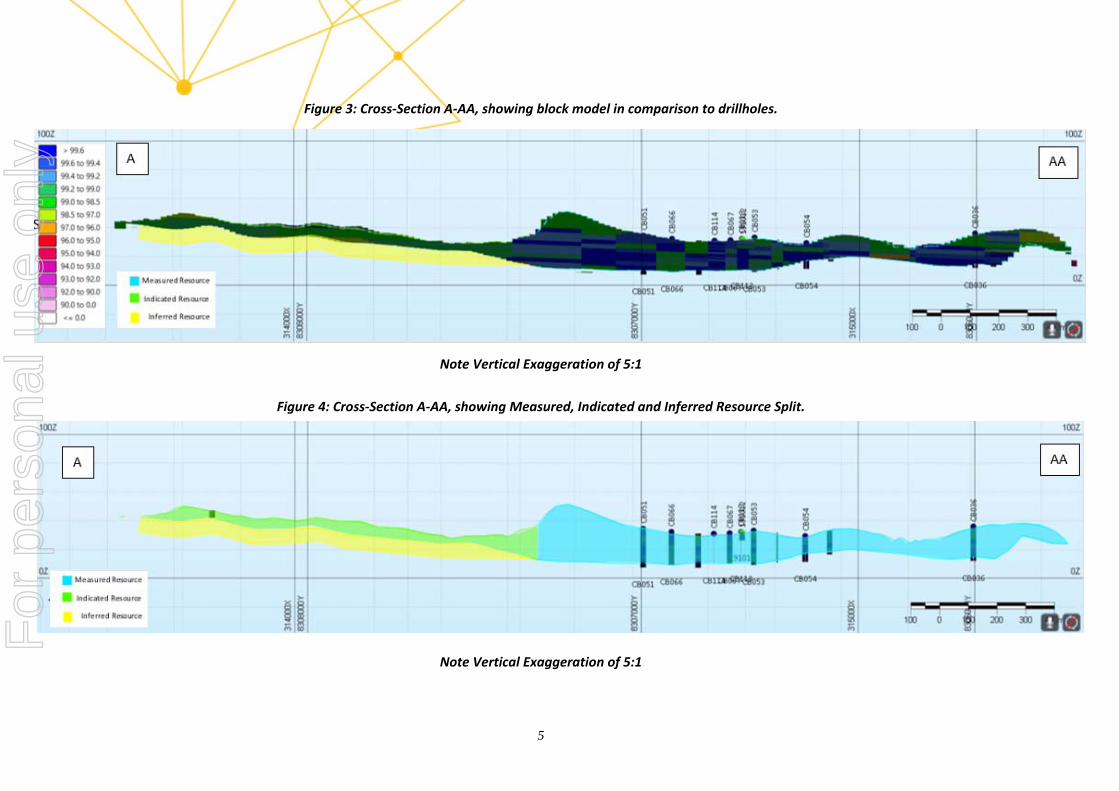
Figure 3: Cross‐Section A‐AA, showing block model in comparison to drillholes.
Note Vertical Exaggeration of 5:1
Figure 4: Cross‐Section A‐AA, showing Measured, Indicated and Inferred Resource Split.
Note Vertical Exaggeration of 5:1
For
per
sona
l use
onl
y

6
Geology
The Nob Point Deposit is a large surface deposit of overlying sand dunes that is part of the Quaternary age Cape
Flattery‐Cape Bedford dunefield complex. The deposit is dominated by clean high grade >98.5% silica (quartz) which
is principally white, cream and light grey in colour, but also with variably dispersed yellow, orange and brown
overtones.
The Nob Point Deposit consists of two major paralleling dunes, nominally named Nob Point East and Nob Point West.
The deposit extends approx. 3km long by 1.2km wide and ranges in vertical thickness from 6m to 32m. The dunes are
elongate southeast to northwest, and are densely but shallowly vegetated with topsoil to approx. 0.3m depth. The
dunes are clearly defined on their long sides and by lower topography. The base of exploitable sand is defined by the
water table and/or intersection with a clay basement of older weathered bedrock.
The silica sand is consistently high grade throughout, >98.5% SiO2, with variable but minor proportions of Al2O3,
Fe2O3, TiO2 and Cr2O3, due to the presence of minor clay, iron oxides and heavy minerals.
Cut‐Off Grade
Based on the final marketable product being a high SiO2 grade sand the SiO2 content by percentage would be used to
quantify in‐situ material as a resource. Cut‐off grades were adopted based on analysis of raw assay data and grade
tonnage plots completed on the block model to optimise the average SiO2 grade and quantity of the resource at
varied reporting levels.
From the 75 drillholes that were used in the resource estimate the %SiO2 (excluding the bottom of the hole which
was contaminated with clays/indurated material) ranged from 88.72%‐99.99%. Slightly lower assayed values were
found in the 12 auger holes with data ranging from 98.60%‐99.51%. Based on the three resource reporting levels the
following cut‐off grades were used for:
Measured Resource in accordance with the JORC Code 2012 – SiO2 cut‐off grade of 98.5%.
Indicated Resource in accordance with the JORC Code 2012 – SiO2 cut‐off grade of 98.5%.
Inferred Resource in accordance with the JORC Code 2012 – No‐cut‐off grade has been defined but based on
the surrounding data (both hand auger and drillhole) it is expected when the product is bulk mined at >99.0%
SiO2 grade.
For
per
sona
l use
onl
y

7
Resource Estimate
Micromine 2020 was used to create a drillhole database which was subject to basic statistical and geostatistical
analysis, this was then used to create and interpolate a deposit block model.
Variography was undertaken for the deposit with variograms and fitted models generated to be used to complete
Ordinary Kriging (OK) and propagate the block model. The block model was checked with Inverse Distance Squared
(IDS) to validate the interpolation technique with swath plots and histograms showing the methods are comparable.
The block model was limited to the top of the resource (‐0.3m below the surface topography) and the base of the
resource (base of the drillholes) and boundary limited by the geological boundaries and the intersection of top and
the bottom resource. Subblock sizing was chosen at 10m E x 20m N x 0.25m (RL) which were used as part of a parent
block sized at 50m E x 100 N x 4 RL. Parent blocks were modelled using OK with the sub‐blocks modelled using OK
nearest neighbour. These results were compared, and the overall grade difference was negligible thus the sub‐blocks
were used as the primary block model. Due to the small size of the 10m E x 20m N x 0.25 (RL) further sub‐blocking
was not required.
In addition to modelling SiO2 data in the block model, Al2O3, Fe2O3 and TiO2 were also block modelled with other
assayed elements not modelled due to low values near the detectable limits.
The Nob Point resource area has three varying levels of resource which have been estimated in accordance with the
JORC Code 2012 and are defined as follows:
Inferred Resource: Area defined as 10m below the base of the hand auger holes.
Indicated Resource: Area where the hand auger holes have been completed, geostatistics and block
modelling completed. No defined basement/water table intersected and relatively vast spacing 300m‐400m
between data points.
Measured Resource: Area with air‐core drillholes have been completed at confirmatory spacing <150m x
150m, geostatistics and block modelling with holes either ending in basement/water table.
Based on the above definitions the block model was split into Indicated and Measured Resources and the Inferred
Resource Estimated on a volume basis with the total Galalar Silica Sand Project – JORC Estimate shown in the Table 1
(above).
Density testing was completed on 55 samples with 1.62 t/m3 used as part of the original Indicated Resource estimate.
Based on the continuity of the samples it is deemed that the current density work that has been completed was
sufficient to report Measured Resources.
For
per
sona
l use
onl
y

8
Conclusions
According to Ausrocks, based on the progress of the resource estimation the following can be stated:
Maiden Measured Resource Estimate of 30.89 Mt @ 99.28% SiO2, which represents 65% of the total JORC
mineral (47.5 Mt) resource that has been identified.
Total JORC mineral resource estimate of 47.5 Mt, which represents a 25% increase on the previous stated
JORC mineral resource of 38Mt (10 February 2020).
[END OF AUSROCKS REPORT EXTRACT]
SILICA ‐ COMPETENT PERSON STATEMENTS
The information in this report that relates to Mineral Resources at the Cape Bedford Project is based on information, geostatistical analysis and modelling carried out by Dale Brown, Mining Engineer, Ausrocks Pty Ltd and a Member of the Australasian Institute of Mining & Metallurgy under the supervision of Brice Mutton, Geologist who is an Associate of Ausrocks Pty Ltd and is a Fellow of the Australasian Institute Of Mining & Metallurgy and a Fellow of The Australian Institute Of Geoscientists. Brice Mutton has sufficient experience which is relevant to the style of mineralisation and type of deposit under consideration and to the activity for which he is undertaking to qualify as a Competent Person as defined in the 2012 edition of the Australasian Code for Reporting of Exploration Results, Mineral Resources and Ore Reserves (The JORC Code). Brice Mutton consents to the inclusion in the report on the matters based on their information in the form and context in which it appears. The information in this report that relates to Exploration Results and Exploration targets from the Cape Bedford Project is based on information reviewed and compiled by Mr. Neil Mackenzie‐Forbes, a Competent Person who is a Member of the Australian Institute of Geoscientists. Mr. Mackenzie‐Forbes is a director of Sebrof Projects Pty Ltd (a consultant geologist to Diatreme Resources Limited). Mr. Mackenzie‐Forbes has sufficient experience which is relevant to the style of mineralisation and type of deposit under consideration and to the activity being undertaken to qualify as a Competent Person as defined in the 2012 Edition of the ‘Australasian Code for Reporting of Exploration Results, Mineral Resources and Ore Reserves’. Mr. Mackenzie‐Forbes consents to the inclusion in the report of the matters based on his information in the form and context in which it appears. Forward looking statements: This document may contain forward looking statements. Forward looking statements are often, but not always, identified by the use of words such as “seek”, “indicate”, “target”, “anticipate”, “forecast”, “believe”, “plan”, “estimate”, “expect” and “intend” and statements that an event or result “may”, “will”, “should”, “could” or “might” occur or be achieved and other similar expressions. Indications of, and interpretations on, future expected exploration results or technical outcomes, production, earnings, financial position and performance are also forward‐looking statements. The forward‐looking statements in this presentation are based on current
For
per
sona
l use
onl
y

9
interpretations, expectations, estimates, assumptions, forecasts and projections about Diatreme, Diatreme’s projects and assets and the industry in which it operates as well as other factors that management believes to be relevant and reasonable in the circumstances at the date that such statements are made. The forward‐looking statements are subject to technical, business, economic, competitive, political and social uncertainties and contingencies and may involve known and unknown risks and uncertainties. The forward‐looking statements may prove to be incorrect. Many known and unknown factors could cause actual events or results to differ materially from the estimated or anticipated events or results expressed or implied by any forward‐looking statements. All forward‐looking statements made in this presentation are qualified by the foregoing cautionary statements. Disclaimer: Diatreme and its related bodies corporate, any of their directors, officers, employees, agents or contractors do not make any representation or warranty (either express or implied) as to the accuracy, correctness, completeness, adequacy, reliability or likelihood of fulfilment of any forward‐looking statement, or any events or results expressed or implied in any forward looking statement, except to the extent required by law. Diatreme and its related bodies corporate and each of their respective directors, officers, employees, agents and contractors disclaims, to the maximum extent permitted by law, all liability and responsibility for any direct or indirect loss or damage which may be suffered by any person (including because of fault or negligence or otherwise) through use or reliance on anything contained in or omitted from this presentation. Other than as required by law and the ASX Listing Rules, Diatreme disclaims any duty to update forward looking statements to reflect new developments.
For
per
sona
l use
onl
y
1
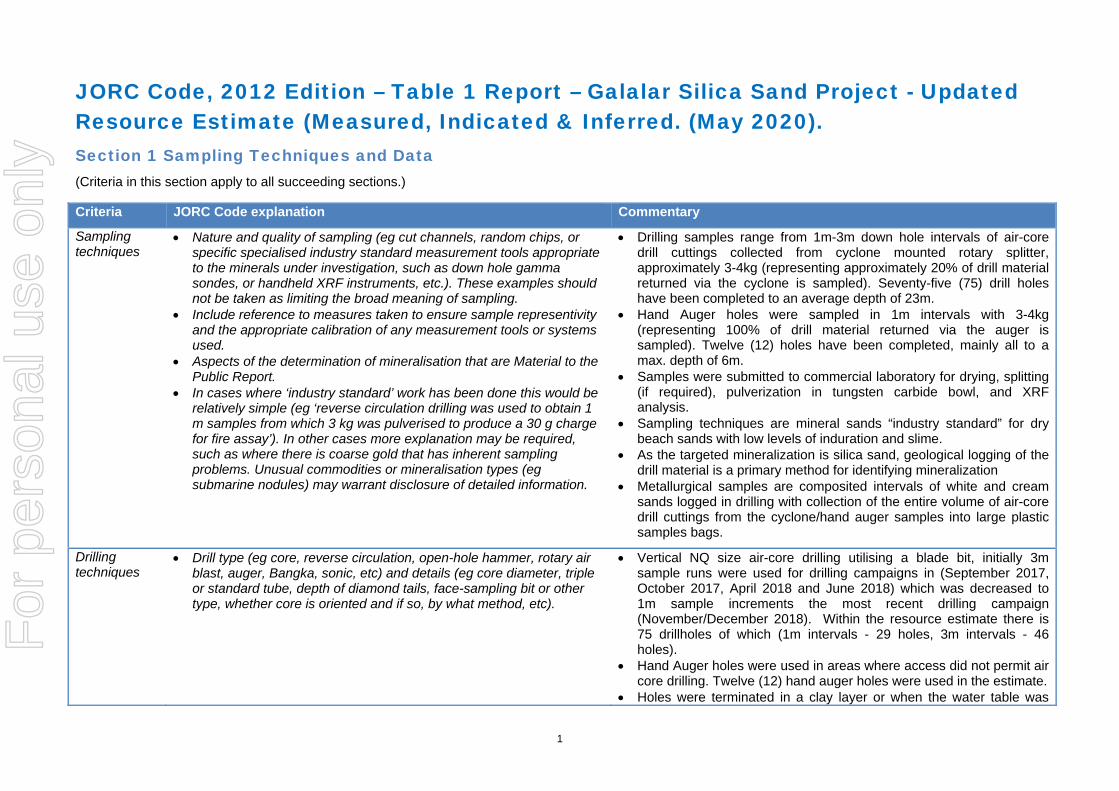
JORC Code, 2012 Edition – Table 1 Report – Galalar Silica Sand Project - Updated Resource Estimate (Measured, Indicated & Inferred. (May 2020). Section 1 Sampling Techniques and Data (Criteria in this section apply to all succeeding sections.)
Criteria JORC Code explanation Commentary
Sampling techniques
Nature and quality of sampling (eg cut channels, random chips, or specific specialised industry standard measurement tools appropriate to the minerals under investigation, such as down hole gamma sondes, or handheld XRF instruments, etc.). These examples should not be taken as limiting the broad meaning of sampling.
Include reference to measures taken to ensure sample representivity and the appropriate calibration of any measurement tools or systems used.
Aspects of the determination of mineralisation that are Material to the Public Report.
In cases where ‘industry standard’ work has been done this would be relatively simple (eg ‘reverse circulation drilling was used to obtain 1 m samples from which 3 kg was pulverised to produce a 30 g charge for fire assay’). In other cases more explanation may be required, such as where there is coarse gold that has inherent sampling problems. Unusual commodities or mineralisation types (eg submarine nodules) may warrant disclosure of detailed information.
Drilling samples range from 1m-3m down hole intervals of air-core drill cuttings collected from cyclone mounted rotary splitter, approximately 3-4kg (representing approximately 20% of drill material returned via the cyclone is sampled). Seventy-five (75) drill holes have been completed to an average depth of 23m.
Hand Auger holes were sampled in 1m intervals with 3-4kg (representing 100% of drill material returned via the auger is sampled). Twelve (12) holes have been completed, mainly all to a max. depth of 6m.
Samples were submitted to commercial laboratory for drying, splitting (if required), pulverization in tungsten carbide bowl, and XRF analysis.
Sampling techniques are mineral sands “industry standard” for dry beach sands with low levels of induration and slime.
As the targeted mineralization is silica sand, geological logging of the drill material is a primary method for identifying mineralization
Metallurgical samples are composited intervals of white and cream sands logged in drilling with collection of the entire volume of air-core drill cuttings from the cyclone/hand auger samples into large plastic samples bags.
Drilling techniques
Drill type (eg core, reverse circulation, open-hole hammer, rotary air blast, auger, Bangka, sonic, etc) and details (eg core diameter, triple or standard tube, depth of diamond tails, face-sampling bit or other type, whether core is oriented and if so, by what method, etc).
Vertical NQ size air-core drilling utilising a blade bit, initially 3m sample runs were used for drilling campaigns in (September 2017, October 2017, April 2018 and June 2018) which was decreased to 1m sample increments the most recent drilling campaign (November/December 2018). Within the resource estimate there is 75 drillholes of which (1m intervals - 29 holes, 3m intervals - 46 holes).
Hand Auger holes were used in areas where access did not permit air core drilling. Twelve (12) hand auger holes were used in the estimate.
Holes were terminated in a clay layer or when the water table was
For
per
sona
l use
onl
y

2
Criteria JORC Code explanation Commentary intersected.
Drill sample recovery
Method of recording and assessing core and chip sample recoveries and results assessed.
Measures taken to maximise sample recovery and ensure representative nature of the samples.
Whether a relationship exists between sample recovery and grade and whether sample bias may have occurred due to preferential loss/gain of fine/coarse material.
Visual assessment and logging of sample recovery and sample quality.
Reaming of hole and clearance of drill string after every 3m rod. Sample chute cleaned between samples and regular cleaning of
cyclone to prevent sample contamination. No sample bias occurred between sample recovery and grade. The perimeter of the hand auger was excluded from the sub-samples
to prevent cross-contamination.
Logging Whether core and chip samples have been geologically and geotechnically logged to a level of detail to support appropriate Mineral Resource estimation, mining studies and metallurgical studies.
Whether logging is qualitative or quantitative in nature. Core (or costean, channel, etc) photography.
The total length and percentage of the relevant intersections logged.
Geological logging of the total hole by field geologist, with retention of sample in chip trays to allow subsequent re-interpretation of data if required. Geological logs have been prepared to sufficient detail to support a Mineral Resource Estimation.
The total hole is logged on sampling intervals which was initially at 3m intervals which was decreased to 1m intervals; logging includes qualitative descriptions of colour, grain size, sorting, induration and estimates of HM, slimes and oversize utilising panning.
Logging has been captured through field drill log sheets and transferred through to an excel spreadsheet with daily update of field database and regular update of master database.
Sub-sampling techniques and sample preparation
If core, whether cut or sawn and whether quarter, half or all core taken.
If non-core, whether riffled, tube sampled, rotary split, etc and whether sampled wet or dry.
For all sample types, the nature, quality and appropriateness of the sample preparation technique.
Quality control procedures adopted for all sub-sampling stages to maximise representivity of samples.
Measures taken to ensure that the sampling is representative of the in-situ material collected, including for instance results for field duplicate/second-half sampling.
Whether sample sizes are appropriate to the grain size of the material being sampled.
Drilling samples rotary split on site (Approximately 20% subsample drilling, 100% hand auger), resulting in approximately 3 – 4kg of dry sample.
The entire sample collected was submitted to the laboratory, with surplus retained as a reference sample.
Sample and sample control are considered representative of the in-situ material collected.
Sample size (3kg - 4kg) is considered appropriate for the grain size of material, average grain size (87% material by weight between 0.125mm and 0.5mm).
Quality of assay data and laboratory
The nature, quality and appropriateness of the assaying and laboratory procedures used and whether the technique is considered partial or total.
For geophysical tools, spectrometers, handheld XRF instruments, etc,
Drilling samples were submitted to ALS Townsville, where they were dried, weighed and split.
Analysis was undertaken by ALS Brisbane utilising a Tungsten Carbide pulverization, ME-XRF26 (whole rock by Fusion/XRF) and
For
per
sona
l use
onl
y
3
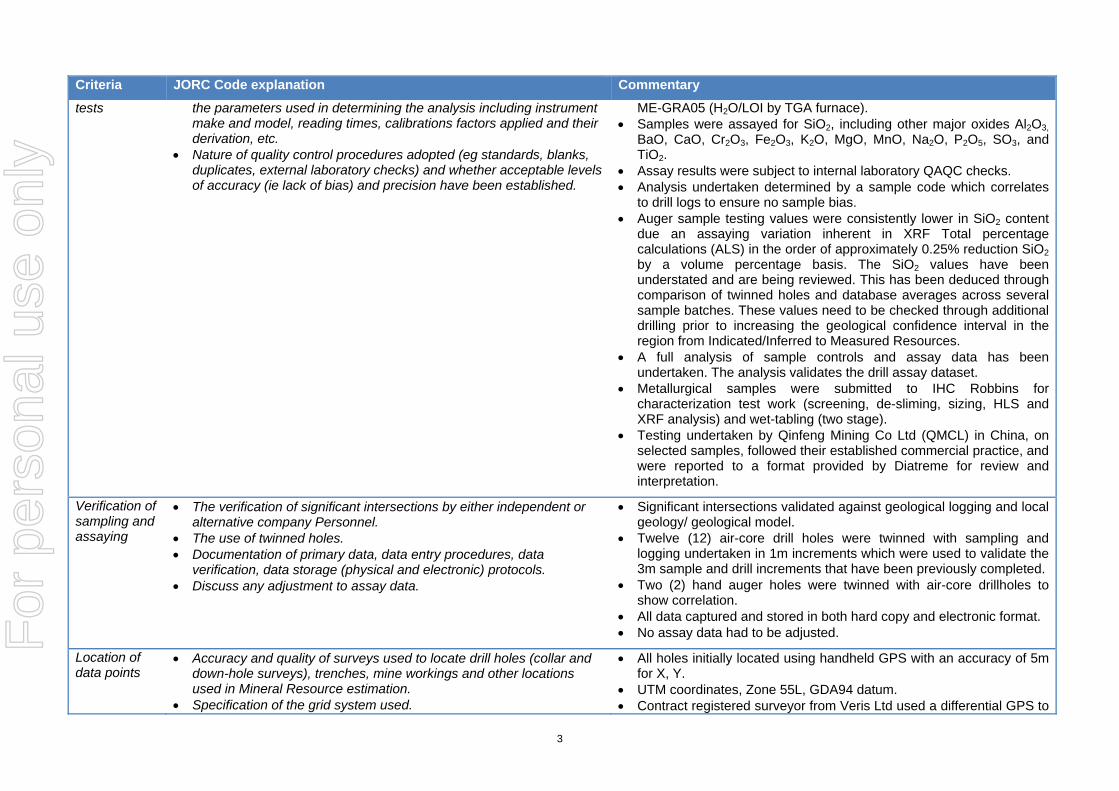
Criteria JORC Code explanation Commentary tests the parameters used in determining the analysis including instrument
make and model, reading times, calibrations factors applied and their derivation, etc.
Nature of quality control procedures adopted (eg standards, blanks, duplicates, external laboratory checks) and whether acceptable levels of accuracy (ie lack of bias) and precision have been established.
ME-GRA05 (H2O/LOI by TGA furnace). Samples were assayed for SiO2, including other major oxides Al2O3,
BaO, CaO, Cr2O3, Fe2O3, K2O, MgO, MnO, Na2O, P2O5, SO3, and TiO2.
Assay results were subject to internal laboratory QAQC checks. Analysis undertaken determined by a sample code which correlates
to drill logs to ensure no sample bias. Auger sample testing values were consistently lower in SiO2 content
due an assaying variation inherent in XRF Total percentage calculations (ALS) in the order of approximately 0.25% reduction SiO2 by a volume percentage basis. The SiO2 values have been understated and are being reviewed. This has been deduced through comparison of twinned holes and database averages across several sample batches. These values need to be checked through additional drilling prior to increasing the geological confidence interval in the region from Indicated/Inferred to Measured Resources.
A full analysis of sample controls and assay data has been undertaken. The analysis validates the drill assay dataset.
Metallurgical samples were submitted to IHC Robbins for characterization test work (screening, de-sliming, sizing, HLS and XRF analysis) and wet-tabling (two stage).
Testing undertaken by Qinfeng Mining Co Ltd (QMCL) in China, on selected samples, followed their established commercial practice, and were reported to a format provided by Diatreme for review and interpretation.
Verification of sampling and assaying
The verification of significant intersections by either independent or alternative company Personnel.
The use of twinned holes. Documentation of primary data, data entry procedures, data
verification, data storage (physical and electronic) protocols. Discuss any adjustment to assay data.
Significant intersections validated against geological logging and local geology/ geological model.
Twelve (12) air-core drill holes were twinned with sampling and logging undertaken in 1m increments which were used to validate the 3m sample and drill increments that have been previously completed.
Two (2) hand auger holes were twinned with air-core drillholes to show correlation.
All data captured and stored in both hard copy and electronic format. No assay data had to be adjusted.
Location of data points
Accuracy and quality of surveys used to locate drill holes (collar and down-hole surveys), trenches, mine workings and other locations used in Mineral Resource estimation.
Specification of the grid system used.
All holes initially located using handheld GPS with an accuracy of 5m for X, Y.
UTM coordinates, Zone 55L, GDA94 datum. Contract registered surveyor from Veris Ltd used a differential GPS to
For
per
sona
l use
onl
y

4
Criteria JORC Code explanation Commentary
Quality and adequacy of topographic control. pick up drillhole Easting, Northing and Elevation values for holes within the resource area.
Topographic surface generated from processing GeoImage imagery and DGPS control points, collar RL’s leveled against this surface to ensure consistency in the database.
Data spacing and distribution
Data spacing for reporting of Exploration Results. Whether the data spacing and distribution is sufficient to establish the
degree of geological and grade continuity appropriate for the Mineral Resource and Ore Reserve estimation procedure(s) and classifications applied.
Whether sample compositing has been applied.
Drilling has been completed at varying intervals for each section of the resource, three original drill lines at peaks along the dune system at Nob Point East were 125m and 250m apart from west to east with a 50-100m spacing perpendicular to the drill lines. Nob Point West had one drill line with 50-100m spacing between holes. Hand Auger holes in the north section of Nob Point East are spaced at 200 – 400 m apart.
Drill spacing, and distribution is sufficient to allow valid interpretation of geological and grade continuity for an Inferred Mineral Resource, Indicated Mineral Resource and Measured Mineral Resource where determined.
No sample compositing has been applied.
Orientation of data in relation to geological structure
Whether the orientation of sampling achieves unbiased sampling of possible structures and the extent to which this is known, considering the deposit type.
If the relationship between the drilling orientation and the orientation of key mineralised structures is considered to have introduced a sampling bias, this should be assessed and reported if material.
The dune field has ridges dominantly trending 320º - 330°. The drill access tracks typically run along or sub-parallel to dune
ridges which suggest unbiased sampling, some cross-dune tracks linking the ridges were also drilled.
Silica deposition occurs as windblown with angle of rest approximately 35º. Drilling orientation is appropriate for the nature of deposition.
Sample security
The measures taken to ensure sample security. Sample collection and transport from the field was undertaken by company personnel following company procedures.
Samples were put into plastic bags, which were labelled and put into canvas sample bags and sealed prior to being sent off to ALS Townsville.
Samples were delivered direct to ALS in Townsville. Received samples were checked against the sample dispatch
documents and a reconciliation report provided by the laboratory.
Audits or reviews
The results of any audits or reviews of sampling techniques and data. The updated Resource Estimate is based on updated geological and geochemical data which were used to validate and audit previous Resource Estimates.
Reviews were conducted internally by Diatreme Ltd and third-party
For
per
sona
l use
onl
y

5
Criteria JORC Code explanation Commentary consultants Ausrocks Pty Ltd, and, found to be consistent.
Section 2 Reporting of Exploration Results (Criteria listed in the preceding section also apply to this section.)
Criteria JORC Code explanation Commentary
Mineral tenement and land tenure status
Type, reference name/number, location and ownership including agreements or material issues with third parties such as joint ventures, partnerships, overriding royalties, native title interests, historical sites, wilderness or national park and environmental settings.
The security of the tenure held at the time of reporting along with any known impediments to obtaining a licence to operate in the area.
The Galalar Silica Sand Project’s Nob Point Deposit occurs within the southern part of EPM 17795 in Far North Queensland and is held by Diatreme Resources Ltd. It should be noted that previously this project has been referred to as Cape Bedford Silica Project. The name of the project was changed to reflect the landowner agreement with the Hopevale Congress Aboriginal Corporation in 2018.
The tenement was granted 22 June 2016 for five (5) years and is in good standing.
A compensation and conduct agreement along with a cultural heritage agreement is in place with the landholder and native title party (Hope Vale Congress).
A Mining Lease Application (MLA 100235) has been lodged for the Galalar Silica Sand Project (ASX announcement 23/12/19), encompassing 523 hectares and covering the vast majority of this Updated Resources Estimate. Note a small proportion (approx 1%) of the Resource is located outside the Mining Lease Application due approval timeframes for the adjacent EPM 27265.
Additionally, two further neighbouring EPM’s related to the project have been taken up by Diatreme, EPM 27265 (granted 30th January 2020), and, application EPMA 27430.
EPM 17795 tenement is large, elongate north-south and covers the bulk of the Cape Flattery/Cape Bedford dune field complex. Additionally, Diatreme has also identified Exploration Targets totaling 210 million to 2.1 billion tonnes of silica (ASX announcement DRX 25/3/19, 11/4/19, 20/6/19) within the wider EPM 17795.
Exploration done by other parties
Acknowledgment and appraisal of exploration by other parties. Previous exploration has been carried out in the area during the 1970’s by Ocean Mining and 1980’s by Breen Organisation, primarily at reconnaissance level.
The historical exploration data is of limited use for resource estimation since it comprises shallow hand auger drilling and is
For
per
sona
l use
onl
y

6
Criteria JORC Code explanation Commentary typically not accurately located.
Geology Deposit type, geological setting and style of mineralisation. The geology comprises variably re-worked aeolian sand (silica) dune deposits associated with Quaternary age sand-dune complex. The mineralisation is quartz (silica) and it, occurs as sand deposits within an aeolian dune complex.
The Galalar Silica Sand Project’s Nob Point Deposit is located at the southern end of the Cape Flattery/Cape Bedford dune field complex, located approx. 20km north of Cooktown. The dune field fringes the coastline as a part of a large Quaternary (Pleistocene to Holocene) silica sand mass, extending along the coastline for approx. 50km and up to 10km inland, and, averaging 25-30m in thickness, with some dunes extending over 90m high. Cape Flattery Silica Mines, which lies at the northern end of the dune field, has been in operation since 1967 and is Queensland’s largest producer of world class silica and the highest production of silica sand of any mine in the world.
The linear sand dunes developed predominantly during the dry Pleistocene glacial and interglacial periods when the sea-level receded and fluctuated approx. 100m below present. Prior to sea level rises in the Holocene (10,000 years before present) sand was blown inland by the prevailing south-easterly winds to form linear dunes. The land sand masses form mainly as high transgressive or parabolic dunes. Multiple episodes of dune building are evident. Most dunes are stabilised by vegetation, but some active dune fronts occur. The high dunes occupy a low interdune sandplain that is 5-10m above sea level and interspersed with numerous lakes and swamps. Periods of water level table fluctuations, erosion and depositional phases have occurred. Mesozoic Dalrymple Sandstone forms numerous headlands along the coast and acts as a bounding escarpment along the western margin of the dune field.
The Galalar Silica Sand Project’s Nob Point Deposit is located 12km south-west of Cape Bedford and immediately west of Nob Point. The Nob Point Deposit is divided into two adjoining dune sand areas known as Nob Point East and Nob Point West. Both consist of pure white, sharp featured, transgressive, elongate- parabolic active dunes, stabilised by vegetation. The pure white sands are high grade, consistently averaging over 99% silica. Whilst some coloured cream, yellow and brown sands have been returned in drill samples, no obvious zonation or domaining has been recognised across the project area. Petrographics identifies the sand as free single or as
For
per
sona
l use
onl
y

7
Criteria JORC Code explanation Commentary
composite crystalline aggregates of quartz, that is clean and rounded. There is some potential for occurrence of heavy minerals within the
greater dune system.
Drill hole Information
A summary of all information material to the understanding of the exploration results including a tabulation of the following information for all Material drill holes: o easting and northing of the drill hole collar o elevation or RL (Reduced Level – elevation above sea level in
metres) of the drill hole collar o dip and azimuth of the hole o down hole length and interception depth o hole length.
If the exclusion of this information is justified on the basis that the information is not Material and this exclusion does not detract from the understanding of the report, the Competent Person should clearly explain why this is the case.
A tabulation of the material drill holes used in this Mineral Resource Estimation is attached to this JORC Table 1, as required by the Table 3.1.
Data aggregation methods
In reporting Exploration Results, weighting averaging techniques, maximum and/or minimum grade truncations (eg cutting of high grades) and cut-off grades are usually Material and should be stated.
Where aggregate intercepts incorporate short lengths of high grade results and longer lengths of low grade results, the procedure used for such aggregation should be stated and some typical examples of such aggregations should be shown in detail.
The assumptions used for any reporting of metal equivalent values should be clearly stated.
A cut-off grade of 98.5% silica has been used on Measured and Indicated Resources with an assumption that a blended product of >99.0% silica would be expected for the Inferred Resource Estimate.
No minimum or maximum grade truncations have been used. Drillhole samples were normalized to 1m intervals to determine
continuity between 3m samples and 1m samples.
Relationship between mineralisation widths and intercept lengths
These relationships are particularly important in the reporting of Exploration Results.
If the geometry of the mineralisation with respect to the drill hole angle is known, its nature should be reported.
If it is not known and only the down hole lengths are reported, there should be a clear statement to this effect (eg ‘down hole length, true width not known’).
All drilling was vertical and as the mineralisation is associated with aeolian dune sands the majority sub-horizontal, some variability may occur on dune slopes, edges and faces.
Diagrams Appropriate maps and sections (with scales) and tabulations of intercepts should be included for any significant discovery being reported These should include, but not be limited to a plan view of drill hole collar locations and appropriate sectional views.
A map of the drill collar locations is incorporated with the main body of the report. Representative cross-sections have been attached within the main body of this report.
Maps of the deposit area, drill hole locations and drill and other data have been previous tabled and are available in Diatreme Resources Ltd ASX public releases and company website.
For
per
sona
l use
onl
y

8
Criteria JORC Code explanation Commentary Balanced reporting
Where comprehensive reporting of all Exploration Results is not practicable, representative reporting of both low and high grades and/or widths should be practiced to avoid misleading reporting of Exploration Results.
All relevant exploration assay results have been reported.
Other substantive exploration data
Other exploration data, if meaningful and material, should be reported including (but not limited to): geological observations; geophysical survey results; geochemical survey results; bulk samples – size and method of treatment; metallurgical test results; bulk density, groundwater, geotechnical and rock characteristics; potential deleterious or contaminating substances.
Geological observations are consistent with aeolian dune mineralisation.
The mineralisation is unconsolidated sand (silica). A total of 1197 SiO2 assays were completed (from downhole
composites over various drilling programs). Groundwater was intersected during drilling at the base of holes, as
expected given the dune complex is an aquifer and drilling was undertaken to considerable depth.
Drilling in Nob Point East was ceased at the water table or just below to prevent potential sample contamination from wet sand.
Drilling in Nob Point West also ceased at the water table or just below to prevent potential sample contamination from wet sand. However not all the samples at depth were sampled for SiO2, only samples that were assayed were included in the model.
There are no known deleterious substances. Iron (Fe2O3) in various forms potentially may act as a contaminant for
very high-quality “processed” end products. The raw assay data has been investigated to provide guidance.
Heavy mineral elements (Titanium & Chrome) have also been investigated but are sub-marginal to the silica sand.
IHC Robins completed a bulk (1.8t) laboratory sample to determine viability of product through a one stage of Mineral Technologies MG12 spiral, which yielded 99.9% SiO2 at 88% recovery.
(CNBM) Bengbu Design & Research Institute for Glass Industry Co., Ltd December 2018 completed bulk (0.35t) laboratory sample to determine the viability of the product as high value glass product which resulted in 78% recovery of a >99% SiO2 raw sample to 99.9% SiO2.
Qinfeng Mining Co Ltd (QMCL) have conducted initial small-scale evaluations that demonstrated the suitability of some of the raw sand to be processed by additional chemical treatment to produce an upgrade, low iron high value product.
Further work The nature and scale of planned further work (eg tests for lateral extensions or depth extensions or large-scale step-out drilling).
The areas of possible extensions are to the north and east of the existing resource boundary which is constrained based on drilling
For
per
sona
l use
onl
y

9
Criteria JORC Code explanation Commentary
Diagrams clearly highlighting the areas of possible extensions, including the main geological interpretations and future drilling areas, provided this information is not commercially sensitive.
data. Area’s to the west (west of Alligator Creek) have shown potential.
Additional drillholes that have been detailed in the conclusion of the report should be completed as part of the next campaign of drilling, especially the area of Nob Hill East hand auger holes. This will allow for increasing geological confidence in both the Inferred and Indicated Regions of Nob Point East and has potential to increase the Measured Resource Estimate.
Further assaying checks and protocols need to be examined (use of standards, blanks, duplicates and external laboratory checks).
Alternate testing methods to be completed on hand auger holes due to decreased SiO2 values to be investigated.
Further representative metallurgical testing utilising information and data from this resource block modelling is planned. These results along with new drilling data will contribute to upgrading the resource and status, potentially to “Probable Reserves” status.
Section 3 Estimation and Reporting of Mineral Resources (Criteria listed in section 1, and where relevant in section 2, also apply to this section.)
Criteria JORC Code explanation Commentary
Database integrity
Measures taken to ensure that data has not been corrupted by, for example, transcription or keying errors, between its initial collection and its use for Mineral Resource estimation purposes.
Data validation procedures used.
The database was originally constructed by Diatreme Resources Ltd and provided to Ausrocks Pty Ltd in various file formats. Ausrocks reformatted these databases into appropriate file formats checking that assay results matched the documents provided from the respective laboratories and the logs aligned with the chip tray samples.
Scoping of areas of resource that may be suitable for production of higher value products.
Site visits Comment on any site visits undertaken by the Competent Person and the outcome of those visits.
If no site visits have been undertaken indicate why this is the case.
Ausrocks Pty Ltd representative (Mining Engineer/SURPAC/Micromine Modeler) has visited the site as a quality assurance/quality control exercise.
Each drillhole was logged, sampled, photographed and kept in chip trays. The photographs and chip trays were investigated by the Competent Person to verify the previous logs.
No site visits have been undertaken by the Competent Person.
For
per
sona
l use
onl
y

10
Criteria JORC Code explanation Commentary
Geological interpretation
Confidence in (or conversely, the uncertainty of ) the geological interpretation of the mineral deposit.
Nature of the data used and of any assumptions made. The effect, if any, of alternative interpretations on Mineral Resource
estimation. The use of geology in guiding and controlling Mineral Resource
estimation. The factors affecting continuity both of grade and geology.
The nature of the dune geology, the consistently very high silica grades throughout the deposit, and deposit modelling place a very high degree of confidence in the geological interpretation. Continuity of geology and grade can be identified and traced between drillholes by visual and geochemical results and characteristics.
The deposit extends from surface (less 0.3m vegetation rich layer) to the base of 71 sampled vertical drill holes. The northern portion of Nob Hill East zone is limited to the depth of 6m of spaced hand auger holes and this portion of the deposit has been identified as Inferred Resource. The resource has also been cut 20m past the last auger hole with the mineralisation open. It’s expected the resource extends considerably deeper and further north in this part of the deposit, which will be subject to future drilling.
Alternative interpretation of the deposit based on currently available data are considered highly unlikely to have a significant influence on the total Mineral Resource estimate.
The geology, geological testing, assaying, observations, modelling and interpretation are consistent with aeolian dune mineralisation. Continuity in the grade and geological continuity is reflected in the this stated Mineral Resource Classification.
Dimensions The extent and variability of the Mineral Resource expressed as length (along strike or otherwise), plan width, and depth below surface to the upper and lower limits of the Mineral Resource.
The resource boundary that has been formed is approximately 3,300m in length and 700m at its widest point at East Nob Point and 650m in length and 400m at its widest point at West Nob Point.
Nob Point East the top of the resource predominantly following the topography, the top of the resource at its highest point is 65.8 mRL to the lowest at 13.8mRL. Depths to the resource (overburden thickness) depth range from 0.3m to 12m with an average depth of 1.0m.
Nob Point West also had the top of the resource follow the topography the resource at its highest point is 48m with a low of 19.3m.
The base of the resource at East Nob Point ranges from 35.4mRL to 7.2mRL. The surface is relatively flat with a variation of 28.2m over 3,300m of strike. West Nob Point the base ranges from 38mRL to 17.5mRL, which has a 20.5m change in elevation over the 650m strike.
Average thickness of the resource within the boundary is 11.8m at East Nob Point (Hand Auger holes limited to 5m in depth, potential for
For
per
sona
l use
onl
y

11
Criteria JORC Code explanation Commentary resource to be thicker in these areas when air core drill is used) and 12.7m at West Nob Point.
Estimation and modelling techniques
The nature and appropriateness of the estimation technique(s) applied and key assumptions, including treatment of extreme grade values, domaining, interpolation parameters and maximum distance of extrapolation from data points. If a computer assisted estimation method was chosen include a description of computer software and parameters used.
The availability of check estimates, previous estimates and/or mine production records and whether the Mineral Resource estimate takes appropriate account of such data.
The assumptions made regarding recovery of by-products. Estimation of deleterious elements or other non-grade variables of
economic significance (eg Sulphur for acid mine drainage characterisation).
In the case of block model interpolation, the block size in relation to the average sample spacing and the search employed.
Any assumptions behind modelling of selective mining units. Any assumptions about correlation between variables. Description of how the geological interpretation was used to control
the resource estimates. Discussion of basis for using or not using grade cutting or capping. The process of validation, the checking process used, the comparison
of model data to drill hole data, and use of reconciliation data if available.
Ordinary Kriging (OK), nearest neighbour was used as the primary interpolation method for all drill data with cross checks of blocks, volumes and grades completed using Inverse Distance Squared (IDS).
Grade estimation is bound by interpolation cut-off grades (>98.5% SiO2 for Measured & Indicated Resource, >99.0% SiO2 for Inferred Resources) and the intersection between the top (base of topsoil layer) and base (base of drillholes) of the resource layers.
All sample intervals have been normalized to 1m sample intervals which underwent statistical analysis for basic statistics (min, max, range), variance/co-variance, Q-Q Plots and histograms for all assayed variables. All variables showed that there were no requirements for top or bottom cutting.
Although SiO2 grade is the main reporting variable Al2O3, Fe2O3, LOI and TiO2 have been estimated in the model. Other assayed values were examined, however, due to their very low grades (near detection range) they were not modelled.
Block model was constrained to the base of the topsoil which also forms the top of the resource which is 0.3m below topography, the base of the drillholes and the area intersecting these two layers. This boundary was also limited to the regional geology boundary where encountered.
Drilling has been completed at varying intervals for each section of the resource, three original drill lines at peaks along the dune system at Nob Point East were 125m and 250m apart from west to east with a 50-100m spacing perpendicular to the drill lines. Nob Point West had one drill line with 50-100m spacing between holes. Hand Auger holes in the north section of Nob Point East are spaced at 200 – 400 m apart.
Geostatistics were undertaken on Al2O3, Fe2O3, SiO2 and TiO2 based on the normalized 1m drill composite samples. This was completed in Micromine 2020 using a Variogram Direction Map and then fitting models to said Variograms. From the multiple iterations of the geostatistical analysis the primary axis had an azimuth of 44.927°, plunge of 1.303° with a secondary axis azimuth of 134.596°, plunge -14.219° with a rotation of 14.223°.
Subblock sizing was chosen at 10m E x 20m N x 0.25m (RL) which
For
per
sona
l use
onl
y

12
Criteria JORC Code explanation Commentary
were used as part of a parent block sized at 50m E x 100 N x 4 RL. Parent blocks were modelled using OK with the sub-blocks modelled using OK nearest neighbour. These results were compared, and the overall grade difference was negligible thus the sub-blocks were used as the primary block model. Due to the small size of the 10m E x 20m N x 0.25 (RL) further sub-blocking was not required.
A search ellipse was used in Micromine 2020 based on the geometry of the sand dunes.
The block model was validated by comparing basic statistics and histograms of the modelled data (block model) against the input data (drilling data) which showed similar means, range of data and data distribution. Additionally, cross-sections throughout the block model were compared with the same sections through the drillhole data to showing that the modelling completed was indicative of the input data and the mineralisation.
Inverse Distance Squared (IDS) check estimates were undertaken which showed similar grades to the OK completed. Histograms and probability plots were then compared for the two interpolation techniques showing similar distributions.
Swath plots comparing the drillhole and block model with SiO2 grades were compared at 10m thickness intervals along the dune orientation of 330°. The trend plots showed sufficient spatial correlation between both modelled estimates and input drillhole grades.
No deleterious elements were detected during the testing which was compiled.
Grade cutting or capping was not applicable as no SiO2 values exceeded 100%.
There was an assumption that an increase in Al2O3 levels and moisture content indicated that the base material was clay, which indicated that this is the bottom of the hole and this was excluded from the resource estimate.
The Inferred Resource estimate has not been block modelled with the floor calculated 10m below the existing Indicated Resource Floor in the area where hand auger holes have been drilled. The extension of the Inferred Resource base to 10m below the Indicated is based on the depth of nearby located (400m) holes (CB044A, CB106, CB050) being at least 10m deeper than the hand auger holes and the floor staying at a consistent RL further north into the dune. Hand Auger holes were used to ensure that there was minimal environmental
For
per
sona
l use
onl
y

13
Criteria JORC Code explanation Commentary
disturbance however were limited to 6m in depth. Each of these holes finished in high SiO2 material so is reasonable to assume resource continues to the lower depth nominated.
Moisture Whether the tonnages are estimated on a dry basis or with natural moisture, and the method of determination of the moisture content.
Moisture content testing has been conducted on eight (8) holes which were logged in 1m intervals with samples sealed within plastic bags and then placed in canvas sample bags and were sent to ALS Townsville.
Cut-off parameters
The basis of the adopted cut-off grade(s) or quality parameters applied.
A cut-off grade of 98.5% silica was used to classify the Measured and Indicated Resource Estimate. The Inferred Resource Area has been estimated to be when blended a >99.0% SiO2 product.
Mining factors or assumptions
Assumptions made regarding possible mining methods, minimum mining dimensions and internal (or, if applicable, external) mining dilution. It is always necessary as part of the process of determining reasonable prospects for eventual economic extraction to consider potential mining methods, but the assumptions made regarding mining methods and parameters when estimating Mineral Resources may not always be rigorous. Where this is the case, this should be reported with an explanation of the basis of the mining assumptions made.
It is expected that a truck/shovel or dozer push to conveyor mining method would be selected subject to additional reviews which the deposit size does not constrain either of these methods. The resource was also limited to above the water table to make both of these mining methods plausible.
Dilution was not considered in the resource estimate. In some holes there was additional resource below the >99.0% silica floor which is slightly lower grade material and would only marginally dilute the product.
Based on the sample assays and geological logs, the top 0.3m of the deposit has been excluded from the resource estimate as it is assumed that this would be a soil and vegetation layer and would be scalped when mining the deposit.
Metallurgical factors or assumptions
The basis for assumptions or predictions regarding metallurgical amenability. It is always necessary as part of the process of determining reasonable prospects for eventual economic extraction to consider potential metallurgical methods, but the assumptions regarding metallurgical treatment processes and parameters made when reporting Mineral Resources may not always be rigorous. Where this is the case, this should be reported with an explanation of the basis of the metallurgical assumptions made.
Down hole sample compositing was undertaken to generate a single bulk sample for holes CB037, CB038, CBO047, CB048, CB053 and CB054 was completed as part of the exploration target with infill drilling and samples on downhole composites completed for the Inferred Resource.
It is assumed that the feed material for the proposed processing plant be in excess to 99.0% SiO2. IHC Robins completed a bulk (1.8t) laboratory sample to determine viability of product through a one stage of Mineral Technologies MG12 spiral, which yielded 99.9% SiO2 at 88% recovery.
(CNBM) Bengbu Design & Research Institute for Glass Industry Co., Ltd December 2018 completed another bulk (0.35t) laboratory sample to determine the viability of the product as high value glass product which resulted in 78% recovery of a >99.0% SiO2 raw sample to
For
per
sona
l use
onl
y

14
Criteria JORC Code explanation Commentary
99.9% SiO2. Qinfeng Mining Co Ltd (QMCL) demonstrated in small-scale the
potential to increase the value of final product through additional chemical processing.
As this is a Mineral Resource estimate no metallurgical factors were considered in the resource calculation, with the bulk testing showing that >99.0% SiO2 raw feed material is a suitable cut-off grade to produce a 99.9% SiO2 processed material.
Environmental factors or assumptions
Assumptions made regarding possible waste and process residue disposal options. It is always necessary as part of the process of determining reasonable prospects for eventual economic extraction to consider the potential environmental impacts of the mining and processing operation. While at this stage the determination of potential environmental impacts, particularly for a greenfields project, may not always be well advanced, the status of early consideration of these potential environmental impacts should be reported. Where these aspects have not been considered this should be reported with an explanation of the environmental assumptions made.
Due to the high-grade nature of the deposit it is expected that there will be minimal tailings produced through processing and thus minimal disposal.
There is a 50m offset either side of Alligator Creek which bisects Nob Point East and Nob Point West.
Some potential environmentally sensitive areas have been identified within the resource area however these have yet to be excluded from any resource figures until these areas have been accurately categorized.
Bulk density Whether assumed or determined. If assumed, the basis for the assumptions. If determined, the method used, whether wet or dry, the frequency of the measurements, the nature, size and representativeness of the samples.
The bulk density for bulk material must have been measured by methods that adequately account for void spaces (vugs, porosity, etc), moisture and differences between rock and alteration zones within the deposit.
Discuss assumptions for bulk density estimates used in the evaluation process of the different materials.
Fifty-five (55) density samples have been undertaken on site using a Dormer Push Tube. The in-situ density of 1.62 t/m3 was an average of the samples across the deposit and was used to calculated the Indicated and Inferred Resource estimate. Both are reported as in-situ densities with the natural moisture profile not yet determined, with further testing required to determine the dry density if/when the resource is taken to a JORC compliant reserve. Bulk Density sampling procedure and data can be found in Appendix E of this report.
Classification The basis for the classification of the Mineral Resources into varying confidence categories.
Whether appropriate account has been taken of all relevant factors (ie relative confidence in tonnage/grade estimations, reliability of input data, confidence in continuity of geology and metal values, quality, quantity and distribution of the data).
Whether the result appropriately reflects the Competent Person’s view of the deposit.
The deposit has a total Measured Resource Estimate of 30.91Mt @ 99.28% SiO2, Indicated Estimate of 6.02Mt @ 99.10% SiO2 and Inferred Resource Estimate of 10.59Mt @ >99% SiO2 in accordance with the JORC Code 2012. This equates to a Total Resource (Measured, Indicated, Inferred) of 47.50 Mt.
The most recent drilling campaign using 1m increments for logging and sampling through the continuity of the twinned holes to those previously drilled in 3m increments shows an appropriate correlation. Over 1,100 geochemistry samples have been taken to accurately show correlation between drillholes.
For
per
sona
l use
onl
y

15
Criteria JORC Code explanation Commentary
The result accurately reflects the Competent Person’s assessment of the deposit.
Audits or reviews
The results of any audits or reviews of Mineral Resource estimates. Previous resource estimations have been completed by separate Competent Persons and reviewed internally by Ausrocks Pty Ltd.
Discussion of relative accuracy/ confidence
Where appropriate a statement of the relative accuracy and confidence level in the Mineral Resource estimate using an approach or procedure deemed appropriate by the Competent Person. For example, the application of statistical or geostatistical procedures to quantify the relative accuracy of the resource within stated confidence limits, or, if such an approach is not deemed appropriate, a qualitative discussion of the factors that could affect the relative accuracy and confidence of the estimate.
The statement should specify whether it relates to global or local estimates, and, if local, state the relevant tonnages, which should be relevant to technical and economic evaluation. Documentation should include assumptions made and the procedures used.
These statements of relative accuracy and confidence of the estimate should be compared with production data, where available.
It is the opinion of the Competent Person that the relative accuracy and confidence level across the reported geological intervals is adequate, given the drill density and continuity of geochemical samples.
The Resource boundary and the reported geological confidence intervals is tightly constrained based on the drill density.
No production data is available at present as this is a Greenfields project. However, Cape Flattery Silica Mines lies in the same adjoining coastal dunes immediately to the North, suggesting potential viability.
For
per
sona
l use
onl
y