drug supply modelling software - r: the r … supply modelling software user! 2010 21 july 2010 2...
TRANSCRIPT

Drug Supply Modelling Software
Vladimir V. Anisimov, Valerii V. Fedorov,
Richard M. Heiberger, and Sourish C. Saha
Research Statistics Unit, GlaxoSmithKline
Department of Statistics, Temple University
The R User Conference, useR! 2010
July 21–23, 2010
Gaithersburg, Maryland, USA

Drug Supply Modelling Software useR! 2010 21 July 2010 2
Abstract
The Supply Modelling tool predicts the drug supply needed to cover
patient demand during a clinical study. The GSK Research Statistics
Unit, in collaboration with the GSK Global Supplies Operations group,
developed a statistical approach controlling the risk of running out of
stock for a patient. The tool's wide use by clinical teams has enabled
significant cost benefits in GSK R&D.
Our software tool designed as an R package allows for
central and centre-stratified randomization,
equal or different treatment proportions within
the randomization block,
and other factors.
Our user interface for the Study Manager was built by embedding
the R package into the Excel environment with RExcel.

Drug Supply Modelling Software useR! 2010 21 July 2010 3
Background: Drug Development Process
Several strongly interconnected stages
Statistical study design
models, sample size, randomization scheme
Patient recruitment modelling
countries, centres, recruitment duration
Drug supply planning
randomization scheme, study design, doses, costs,…
Manufacturing models
recruitment → supply prediction → manufacturing process

Drug Supply Modelling Software useR! 2010 21 July 2010 4
Background: Supply Chain Process
• Multicentre study:• Patients are recruited at different centres
• After screening process — randomized to different arms
• Scenario (typical for a large study)• One (or two) central and several regional depots
• Each depot — several local centres
• Delivery time to regional depots — a few weeks/months
• Delivery time to local site — a few days
• Supply strategy• Initial shipment to regional depots • Later on — with some frequency or on demand
• Clinical trial supply stage is very costly
• Goals:• Minimize risk of stock out for a patient
• Reduce Overage (amount of unused drug)
Drug Supply Modelling Software useR! 2010 21 July 2010 5
Background: Current Situation
Recent (~3–4 years ago) practice in GSK: statistical methods were not used. A centrally randomized study might have been planned with high supply overage.
Correct planning techniques should account for:• various uncertainties in input information
• recruitment and randomization can be viewed as stochastic processes
• variation in recruitment and randomized patients across centres/depots
Monte Carlo simulation is very computer intensive and may lead to: large computational time,
multivariate optimality problems,
Low precision or large computation times to compute small critical
probabilities.
With the new technology described here, supply overage has been
reduced (often to less than 100%) with a cost savings to GSK of over
£50 million per year.

Drug Supply Modelling Software useR! 2010 21 July 2010 6
Risk Approach in Supply Modelling
The approach uses the notion of risk (probability in a single study)
that the assigned drug may not be available to a small number of
patients. The approach is based on the developed technique for
modelling
– patient recruitment
– randomization process
Risk 5% means that in a study:
with probability 95% all randomized patients will get the correct
treatment assignments,
with probability 5% the treatment may not be available for one or more
patient s.
Drug Supply Modelling Software useR! 2010 21 July 2010
The Drug Supply stage is very costly (comprising over 2/3 of drug
development costs) and substantially affected by the recruitment process.
It is imperative to develop statistical modelling approaches that can
• account for uncertainties,
• can provide accurate prediction of the number of recruited patients in
depots/sites for different time periods and on different arms
• predict critical supply levels needed to satisfy patient demand
• and avoid extra supply overages
.
Recruitment Planning
7

Drug Supply Modelling Software useR! 2010 21 July 2010 8
Modelling Patient Recruitment
RSU developed statistical methodology (Anisimov, Fedorov, 2005–2007)
and an innovative predictive patient recruitment modelling tool:
Accounts for randomness in recruitment over time,
variability in different sites, site initiation delays
Computes mean and predictive intervals for the predicted number of
recruited patients over time, and for total recruitment time
Data-driven, uses estimation, Bayesian adjustment, prediction
All computations are based on closed-form analytic expressions, so no
Monte Carlo simulation is necessary.
Additional features:
Evaluating minimal number of sites, adaptive adjustment, predicting
performance of sites/countries
Drug Supply Modelling Software useR! 2010 21 July 2010
In our R package, we use a Poisson–gamma recruitment model, where the
patients arrive at centres according to a Poisson process with rates λi which
are assumed to be independent gamma-distributed random variables.
Motivation for Poisson-Gamma (negative binomial) model
Centers are sampled from a “Gamma” population,
i.e. rates are Gamma distributed.
There exists a prior information described by mean α/β
and variance α/β2
The use of the Gamma mixing is one of the simplest and elegant ways to
model over-dispersion
R Package for Recruitment Planning (1)
9

Drug Supply Modelling Software useR! 2010 21 July 2010
We use a Block permuted randomization scheme where patients are
allocated to treatments according to randomly permuted blocks of a fixed
size:
For two treatments (A and B),
with blocks of size 4,
and equal proportions within block (2:2),
there are 6 possibilities for different permuted blocks:
(A,A,B,B) (A,B,A,B) (A,B,B,A) (B,A,A,B) (B,A,B,A) (B,B,A,A)
R Package for Recruitment Planning (2)
10

Drug Supply Modelling Software useR! 2010 21 July 2010 11
Impact on Drug Supply Planning
Patient recruitment modelling is the basis for:
Predictive intervals for the number of patients recruited in
sites/depots in any time interval
Calculating the probability of a given number of critical events:
several pts registered within a short time (shorter than delivery time
to site), empty sites, …
Further development stage (for supply modelling):
Evaluate impact of randomization
Predicting the number of patients randomized to different
treatment arms in centres/depots for different randomization
schemes
Anisimov (2007, 2009, 2010)
Evaluating probabilities of stock out

Drug Supply Modelling Software useR! 2010 21 July 2010 12
Randomization Impact Randomization strategy essentially influences drug supply overage.
• Unstratified randomization
• Patients are allocated to treatments according to randomly permuted
blocks without regard to clinical centre
• Centre-stratified randomization
• Separate randomization lists by randomly permuted blocks in each
centre
• Unstratified randomization is more expensive than Centre-stratified
randomization as it leads to extra supply overages (20-50% extra
depending on scenario).
• With unstratified randomization, it is possible for one centre to have all
patients on the same treatment. Since it could be any treatment, we
would need enough supplies to cover worst case scenarios.
Drug Supply Modelling Software useR! 2010 21 July 2010 13
Effect on GSK’s R&D
• Use of the team’s innovative risk-based prediction tool have
saved the company over £50 million per year.
• Members of GSK’s R&D Supply Chain Team have won the
European Supply Chain Excellence Award for Innovation
(Nov. 2009). http://www.supplychainexcellenceawards.com/Innovation.aspx

Drug Supply Modelling Software useR! 2010 21 July 2010 14
RExcel (1)
Excel is the most prevalent software used for data storage and
interpretation.
RExcel (Baier and Neuwirth, 2007) integrates the powerful
statistical and graphical functions in R into the Excel user
interface.
Data can be exchanged between Excel and R. The user can use
R functions in Excel cell formulas, effectively controlling R
calculations from Excel's automatic recalculation mechanism.

Drug Supply Modelling Software useR! 2010 21 July 2010 15
RExcel (2)
It is easy to construct a stand-alone RExcel workbook which
hides R almost completely from the user and uses Excel as the
main interface to R.
Our end users are familiar with supply issues, but not with recruitment
modelling. Therefore we designed a user-friendly Excel interface to be
used by the study manager.

Drug Supply Modelling Software useR! 2010 21 July 2010 16
RExcel Interface to the Modelling Package
Input (main variables):
# of patients (range)
Sizes of regions (# of centres or range)
# of treatments
# of regional depots
# of dispenses
Risk level
Expected study duration
Randomization type
No-preloading or preloading
(typical scenarios are built jointly with CTS & GSO Teams)
Output:
Supply Overages
Total number of treatment packs needed at different stages

Drug Supply Modelling Software useR! 2010 21 July 2010 17
Overage Worksheet (1)

Drug Supply Modelling Software useR! 2010 21 July 2010 18
Overage Worksheet (2)
The basic Overage worksheet uses the main input variables for a
single scenario
The Overage worksheet displays information about anticipated
overages and total number of packs for each treatment
The Overage worksheet can calculate overages with or without
preloading (shipments of drugs prior to enrolment of any patients)
of sites
The other worksheets in this workbook assume no preloading

Drug Supply Modelling Software useR! 2010 21 July 2010 19
Multiple Scenario Worksheet (1)
Drug Supply Modelling Software useR! 2010 21 July 2010 20
Multiple Scenario Worksheet (2)
Initial Entry into the workbook. Several scenarios may be
specified.
Initially, each scenario is assigned default values of the
secondary parameters associated with the individual treatments
and depots.
The worksheet calculates overages under two randomization
schemes and plots the overages for each scenario and for each
randomization scheme.

Drug Supply Modelling Software useR! 2010 21 July 2010 21
Plot of Overages
Drug Supply Modelling Software useR! 2010 21 July 2010 22
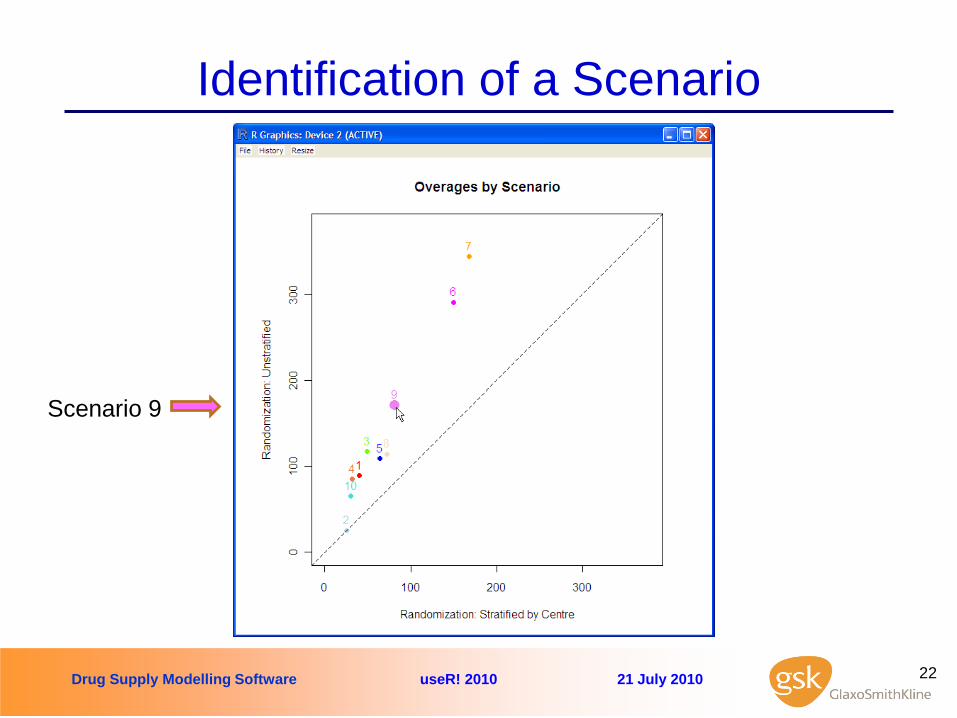
Identification of a Scenario
Scenario 9

Drug Supply Modelling Software useR! 2010 21 July 2010 23
Scenario 9 is Highlighted
Drug Supply Modelling Software useR! 2010 21 July 2010 24
Advanced Scenario Worksheet (1)

Drug Supply Modelling Software useR! 2010 21 July 2010 25
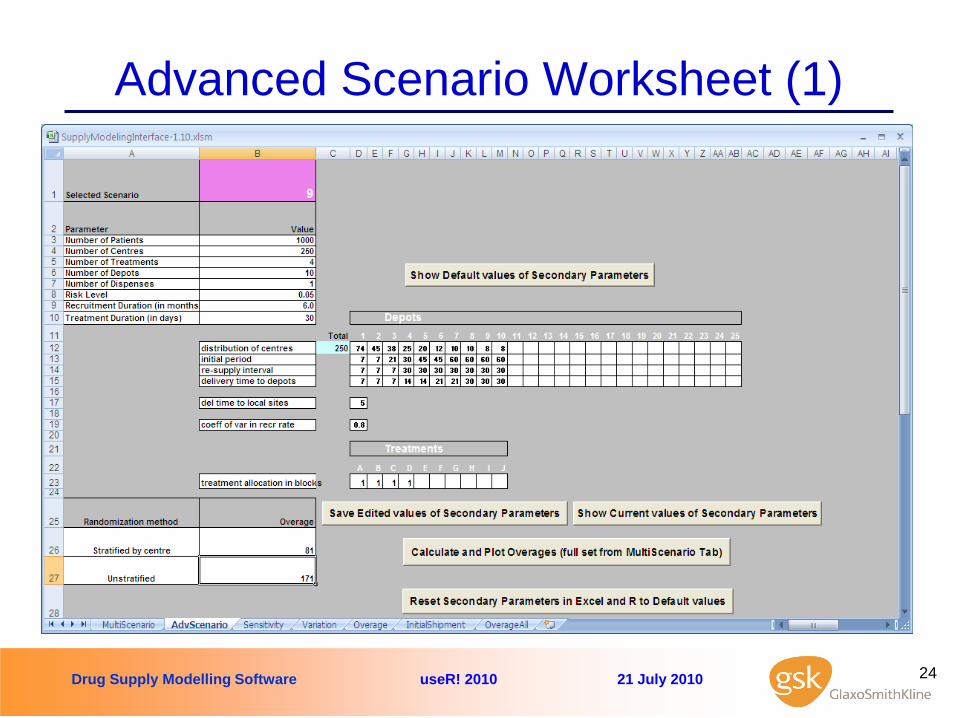
Advanced Scenario Worksheet (2)
• This worksheet displays, and gives the option to change, the
depot and treatment level secondary parameters for the
selected scenario as displayed in cell B1.
• The Show Default button displays the default parameter
values for the selected scenario.
• The user can change the secondary parameter values and
then click on the button Save Edited values of Secondary
Parameters.
• The changed secondary parameters will be used after the
user clicks on Calculate and Plot Overages (full set from
MultiScenario Tab).
Drug Supply Modelling Software useR! 2010 21 July 2010 26
Conclusions
• An innovative statistical methodology and a risk-based
supply modelling tool were developed in R to predict the
drug supply needed to cover patient demand during a
clinical study.
• A user-friendly RExcel Interface was created to be used by
the study manager.
• The implementation in CTS R&D led to substantial drug and
cost savings.

Drug Supply Modelling Software useR! 2010 21 July 2010 27
Acknowledgements
Drug Development Sciences
Darryl Downing, VP, SQS
Global Supplies Operations, PCD
Steve Day, VP, GSO
Ann Dufton, Mark Kothapalli, Mark Leow,
Diana Hunter, Simon West-Bulford,
study teams
Recruitment & Supplies Modelling Project Team
Clinical Trials Supply

Drug Supply Modelling Software useR! 2010 21 July 2010 28
References
1. V. Anisimov, V. Fedorov, Modeling, prediction and adaptive adjustment of
recruitment in multicentre trials, Statistics in Medicine, 26, 2007, 4958–4975.
2. V. Anisimov, Predictive modelling of recruitment and drug supply in
multicenter clinical trials, Proc. of Joint Statistical Meeting, Washington,
August, 2009, 1248-1259.
3. V. Anisimov, Effects of unstratified and centre-stratified randomization in
multicentre clinical trials, Pharmaceutical Statistics, 2010 (early view).
4. V. Anisimov, Drug Supply Modeling in Clinical Trials (Statistical
Methodology), Pharmaceutical Outsourcing, May-June, 2010.
5. V. Anisimov, V. Fedorov, R. Heiberger, S. Saha, M. Kothapalli, Drug supply
modeling software: User manual, GSK DDS TR 2010-1, 2010.
6. Baier, T. and Neuwirth, E. (2007) Excel :: Com :: R. Computational Statistics,
22 (1): 91–108.
7. Neuwirth, E., with contributions by Heiberger, R., Ritter, C., Pieterse, J., and
Volkering, J. (2009). RExcelInstaller: Integration of R and Excel, (use R in
Excel, read/write XLS files). R package version 3.0-12.
8. R Development Core Team (2009) R: A Language and Environment for
Statistical Computing. R Foundation for Statistical Computing, Vienna,
Austria. ISBN 3-900051-07-0.