drug class review - oregon health & science … class review on ... second drug in such...
TRANSCRIPT
Drug Class Review on
Fixed Dose Combination Drug Products for the Treatment of Type 2 Diabetes and
Hyperlipidemia
Final Report
October 2007
The Agency for Healthcare Research and Quality has not yet seen or approved this report
The purpose of Drug Effectiveness Review Project reports is to make available information regarding the comparative clinical effectiveness and harms of different
drugs. Reports are not usage guidelines, nor should they be read as an endorsement of or recommendation for any particular drug, use, or approach. Oregon Health & Science
University does not recommend or endorse any guideline or recommendation developed by users of these reports
Marian McDonagh, PharmD Kim Peterson, MS Sujata G Thakurta, MPA:HA Tracy Dana, MLS Oregon Evidence-based Practice Center Oregon Health & Science University Mark Helfand, MD, MPH, Director
Copyright ©2007 by Oregon Health & Science University Portland, Oregon 97239. All rights reserved.
THIS REPORT HAS BEEN SUPERSEDED

Note: The medical literature related to this topic is scanned periodically. (See http://www.ohsu.edu/ohsuedu/research/policycenter/DERP/about/methods.cfm for description of scanning process). The Drug Effectiveness Review Project governance group elected to archive this report. It has been superseded by Newer Diabetes Medications, TZDs and Combinations report. Please see timeline for details on the date of its release.
THIS REPORT HAS BEEN SUPERSEDED

TABLE OF CONTENTS PART I. ...........................................................................................................................6
INTRODUCTION .....................................................................................................................................6 Analytic Frameworks and Key Questions...............................................................................................9
METHODS .............................................................................................................................................13 Literature Search ..................................................................................................................................13 Study Selection.....................................................................................................................................13 Inclusion Criteria ...................................................................................................................................13 Data Abstraction ...................................................................................................................................16 Validity Assessment .............................................................................................................................16 Synthesis ..............................................................................................................................................17 Peer Review and Public Comment.......................................................................................................17
PART II. FIXED DOSE COMBINATION DRUG PRODUCTS FOR THE TREATMENT OF TYPE 2 DIABETES................................................................................................. 18
RESULTS ..............................................................................................................................................18 Overview...............................................................................................................................................18 Summary Points ...................................................................................................................................19 Detailed Assessment............................................................................................................................20
Section I. Glycemic control, adverse event, and adherence outcomes for combination tablet products..............................................................................................................................................21
A. Glucovance® ..............................................................................................................................21 B. Metaglip®....................................................................................................................................27 C. Avandamet®...............................................................................................................................29 D. Avandaryl® .................................................................................................................................31
Section II. Detailed assessment for evidence on correlations between outcomes in patients with type 2 diabetes and medication adherence in general (Key Questions 7 and 8) ......................................33
A. Associations between medication adherence and health outcomes/hospitalizations..............33 B. Associations between medication adherence and HbA1c control..............................................34
SUMMARY ...........................................................................................................................................36 PART III. FIXED DOSE COMBINATION DRUG PRODUCTS FOR THE TREATMENT OF HYPERLIPIDEMIA.................................................................................................. 38
RESULTS ..............................................................................................................................................38 Overview...............................................................................................................................................38 Summary Points ...................................................................................................................................39 Advicor® ................................................................................................................................................40 Vytorin®.................................................................................................................................................44 Evidence of the link between improved adherence and outcomes (KQ 7 and 8) ................................49
SUMMARY ............................................................................................................................................50 REFERENCES.............................................................................................................. 53 FIGURES
Figure 1. FDCP as a treatment option in patients with type-2 diabetes who have had insufficient response to monotherapy.....................................................................................................10Figure 2. FDCP as a treatment option in patients with hyperlipidemia who have had insufficient response to monotherapy.....................................................................................................10 Figure 3. Results of literature search for Type 2 Diabetes drugs........................................................18 Figure 4. Results of literature search for hyperlipidemia drugs...........................................................39
THIS REPORT HAS BEEN SUPERSEDED
Final Report Drug Effectiveness Review Project
FDCP for diabetes and hyperlipidemia Page 3 of 73
TABLES Table 1. Included fixed-dose combination products for type 2 diabetes..............................................8 Table 2. Included fixed-dose combination products for hyperlipidemia ...............................................9 Table 3. Included drugs for type 2 diabetes .......................................................................................14 Table 4. Included drugs for hyperlipidemia ........................................................................................15 Table 5. Included study designs.........................................................................................................16 Table 6. HbA1c reductions in trials of Glucovance® versus glyburide or metformin monotherapy .....23 Table 7. Pooled hypoglycemia rates for Glucovance® compared to glyburide monotherapy ............24 Table 8. Mean reductions in HbA1c values for comparison of Metaglip® to glipizide and metformin
monotherapies......................................................................................................................28 Table 9. Summary of the evidence by Key Question for FDCPs used for type 2 diabetes ...............36 Table 10. Trials of Advicor® compared to a statin or niacin alone .......................................................41 Table 11. Mean LDLc reductions in Advicor® trials ..............................................................................42 Table 12. Mean HDLc elevations in Advicor® trials..............................................................................42 Table 13. Uncontrolled, open-label studies of Advicor® .......................................................................43 Table 14. Trials of Vytorin® compared to ezetimibe or a statin alone ..................................................45 Table 15. Results of Vytorin® trials.......................................................................................................47 Table 16. Results after switch from statin monotherapy to Vytorin® ....................................................48 Table 17. Summary of the evidence by Key Question for FDCPs used for hyperlipidemia.................50
APPENDICES
Appendix A. Systematic review of Fixed-dose Combination Drug Products (FDCP) for the treatment of diabetes and hyperlipidemia ......................................................................................58
Appendix B. Search strategies...........................................................................................................61 Appendix C. Quality assessment methods of the Drug Effectiveness Review Project ......................66 Appendix D. Excluded studies for type 2 diabetes.............................................................................70 Appendix E. Studies pending review..................................................................................................73
EVIDENCE TABLES PROVIDED IN A SEPARATE DOCUMENT
THIS REPORT HAS BEEN SUPERSEDED
Final Report Drug Effectiveness Review Project
FDCP for diabetes and hyperlipidemia Page 4 of 73
Suggested citation for this report: McDonagh M, Peterson K, Thakurta SG, Dana, T. Drug Class Review on Fixed Dose Combination Drug Products for the Treatment of Type 2 Diabetes and Hyperlipidemia. 2007. http://www.ohsu.edu/drugeffectiveness/reports/final.cfm Acknowledgements: The authors would like to thank David Smith, PhD and Eric Johnson PhD for their expert advice and contributions during the key question and analytic framework development phases and again during the peer review and public comment periods. We also thank our peer reviewers for taking the time to provide meaningful clinical and methodologic insight prior to finalization of this report. Funding: The funding source, the Center for Evidence-based Policy, is supported by 17 organizations, including 15 state Medicaid programs. These organizations selected the topic and had input into the Key Questions for this review. The content and conclusions of the review are entirely determined by the Evidence-based Practice Center researchers. The authors of this report have no financial interest in any company that makes or distributes the products reviewed in this report.
THIS REPORT HAS BEEN SUPERSEDED
Final Report Drug Effectiveness Review Project
FDCP for diabetes and hyperlipidemia Page 5 of 73

PART I.
INTRODUCTION In many situations, drug therapy using a single drug (monotherapy) is inadequate to control the disease or leads to unacceptable adverse effects when the dose is increased to improve control. In such cases, the clinician can opt to add a second drug to improve the control, reducing the dose of the first drug to reduce the adverse events. Typically the second drug is one that has a different mechanism of action, allowing potential for improved control of the disease symptoms and a different adverse event profile. Many treatment guidelines recommend adding a second drug in such situations.1-3 The choice to prescribe 2 drugs to treat the same disease does increase the number of drug administrations the patient must take each day and at least in theory may reduce adherence. While there is evidence that multiple (3-4) administrations per day results in lower adherence than fewer per day (1-2), evidence regarding switching from twice daily dosing to once daily indicates an improvement in adherence, but not in treatment outcomes.4 Importantly, the impact of reducing the number of tablets taken only once or twice per day is not clear. For example, many medications used to treat type 2 diabetes or hyperlipidemia can be administered once per day. In this situation, adding a second drug that is also taken once per day may not lead to reduced adherence. The combination of 2 drug entities in one dosage form is known as a fixed-dose combination product (FDCP). The main advantage of such a combination product is purported to be convenience, with the suggestion that adherence or persistence with the medication regimen is improved. A recent Cochrane review of interventions to improve adherence found that for long-term treatments, only complex interventions resulted in improvements in health, and that those improvements were small.5 Observational evidence of different levels of adherence among groups of patients must be interpreted cautiously.6, 7 Another scenario for using a FDCP is when 2 diseases are commonly found together, such as hypertension and hyperlipidemia. In this case 2 drugs treating 2 different diseases are combined. This review will not be addressing this particular situation.
The perspective of this report is that of the DERP participants, primarily state Medicaid agencies, who framed the questions for this report around their need to understand if there are differences in outcomes when a FDCP is used compared to the 2 individual drugs co-administered. FDA approval of FDCPs is based primarily on evidence that the product is bio-equivalent to the component drugs co-administered, provided the component drugs co-administered have been previously shown to be safe and effective. FDA approval establishes that a FDCP is safe and effective. We are not interested in repeating this assessment, but rather in assessing the comparative benefits and harms of the FDCP versus the relevant comparator interventions: component drugs co-administered or monotherapy.
Our primary interest is in long-term health benefits, although we recognize that for some short-term benefits a link has been established to the longer-term benefits, and as such we are including those outcomes here also. For Type 2 diabetes, for example, a relationship between lower glycated hemoglobin (<7.0%) and decreased mortality and cardiovascular events was shown in the UK Prospective Diabetes Study (UK PDS) which included sulfonylureas and metformin.8 Many studies have shown a relationship between lower LDLc and decreased mortality and cardiovascular events in patients with dyslipidemia being treated with statins.9-12
Although the individual components of the FDCPs in this report have been shown to improve health outcomes, we believe it is still important to show whether outcomes are the same under the conditions of the FDCP. Naturally, the anticipated benefit of using 2 drugs is that
THIS REPORT HAS BEEN SUPERSEDED
Final Report Drug Effectiveness Review Project
FDCP for diabetes and hyperlipidemia Page 6 of 73
lower doses of each component drug can be used, leading to similar health outcomes but fewer adverse events overall. However, in the case of a FDCP it is not entirely clear that this assumption can be made.13-17 The evidence related to LDLc and health outcomes comes from drug classes with many long-term studies such that the balance of benefits and harms are known. In the case of ezetimibe however, long-term studies are not available – only extrapolation of effects from other drug classes are available.18, 19 Clinicians indicate that their major concern over FDCPs is the limitation in dose adjustment or titration, potentially leading to increased adverse events. For example, with FDCPs including sulfonylureas, excess hypoglycemia is a concern and clinicians indicate that among those patients approaching goal glucose, the increased efficacy is masked by the need to curtail titration to avoid hypoglycemia (peer reviewer communication September 2007).
Our participants are also interested in the comparison of these FDCPs to monotherapy. Guidelines for Type 2 diabetes and hyperlipidemia do not provide clear cut recommendations for first- or second-line approaches, but rather suggest various methods that can be applied, including using 1 or 2 drugs.1-3 Evidence about the comparative benefits and harms of FDCPs to monotherapy can provide useful information to guide practice in these cases.
We recognize that an advantage of FDCPs may be convenience, including convenience to the patient in having to take only 1 pill instead of 2 and to fill only 1 prescription instead of 2, to the prescriber in having to write only 1 prescription instead of 2, to the prescription benefit manager in having to handle 1 claim instead of 2, and so on. These potential benefits are not directly considered here, other than as they may be reflected in adherence, persistence and short and long-term health outcomes. Another aspect of convenience that is not directly considered here is that when dose adjustments are made in component drugs that are co-administered, a patient may be able to split tablets to reduce the dose or take 2 tablets to increase the dose depending on the situation. This would delay the need for filling a new prescription, but with a FDCP a change in dose of one component drug requires a new prescription. The advent of FDCPs may have impact on prescriber behavior, but this issue is outside the scope of this report.20 For the treatment of type 2 diabetes, there are 2 products that combine a sulfonylurea with metformin, 2 that combine metformin with a thiazolidinedione, 1 that combines metformin with a Dipeptidyl-Peptidase 4 (DPP-4) Inhibitor, and 2 that combine a thiazolidinedione with a sulfonylurea (Table 1).
THIS REPORT HAS BEEN SUPERSEDED
Final Report Drug Effectiveness Review Project
FDCP for diabetes and hyperlipidemia Page 7 of 73
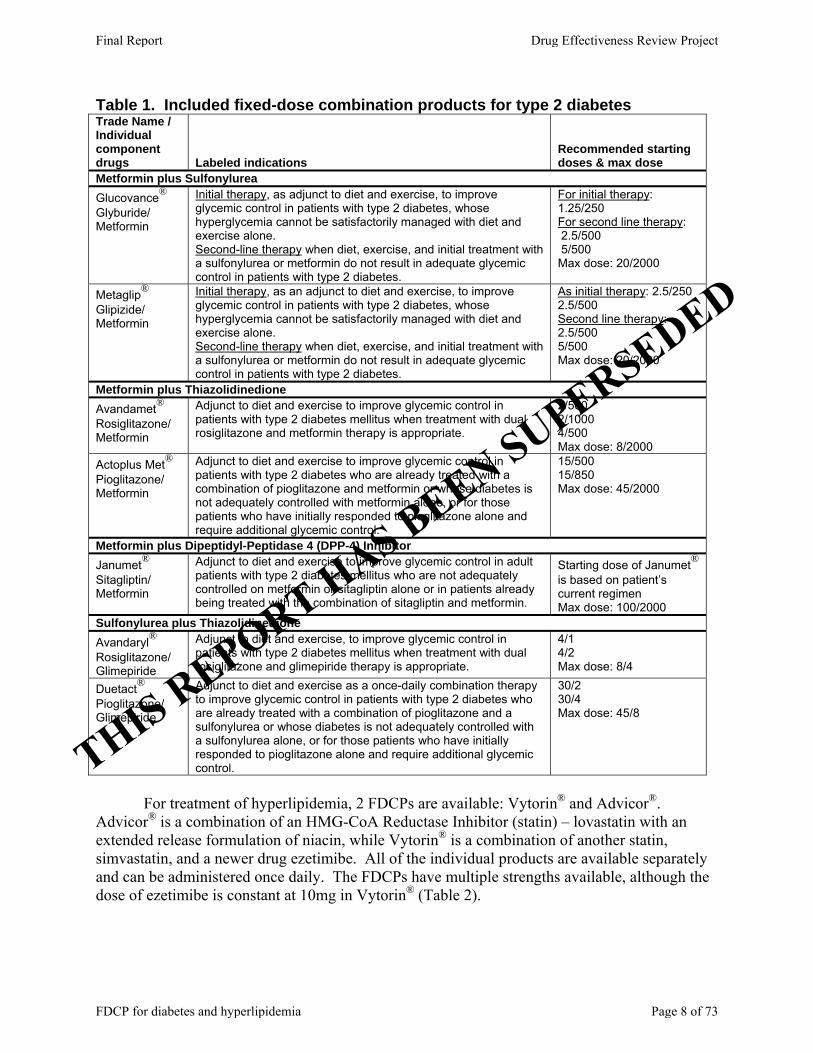
Table 1. Included fixed-dose combination products for type 2 diabetes Trade Name / Individual component drugs Labeled indications
Recommended starting doses & max dose
Metformin plus Sulfonylurea Glucovance® Glyburide/ Metformin
Initial therapy, as adjunct to diet and exercise, to improve glycemic control in patients with type 2 diabetes, whose hyperglycemia cannot be satisfactorily managed with diet and exercise alone. Second-line therapy when diet, exercise, and initial treatment with a sulfonylurea or metformin do not result in adequate glycemic control in patients with type 2 diabetes.
For initial therapy: 1.25/250 For second line therapy: 2.5/500 5/500 Max dose: 20/2000
Metaglip® Glipizide/ Metformin
Initial therapy, as an adjunct to diet and exercise, to improve glycemic control in patients with type 2 diabetes, whose hyperglycemia cannot be satisfactorily managed with diet and exercise alone. Second-line therapy when diet, exercise, and initial treatment with a sulfonylurea or metformin do not result in adequate glycemic control in patients with type 2 diabetes.
As initial therapy: 2.5/250 2.5/500 Second line therapy: 2.5/500 5/500 Max dose: 20/2000
Metformin plus Thiazolidinedione Avandamet® Rosiglitazone/ Metformin
Adjunct to diet and exercise to improve glycemic control in patients with type 2 diabetes mellitus when treatment with dual rosiglitazone and metformin therapy is appropriate.
2/500 2/1000 4/500 Max dose: 8/2000
Actoplus Met® Pioglitazone/ Metformin
Adjunct to diet and exercise to improve glycemic control in patients with type 2 diabetes who are already treated with a combination of pioglitazone and metformin or whose diabetes is not adequately controlled with metformin alone, or for those patients who have initially responded to pioglitazone alone and require additional glycemic control.
15/500 15/850 Max dose: 45/2000
Metformin plus Dipeptidyl-Peptidase 4 (DPP-4) Inhibitor Janumet® Sitagliptin/ Metformin
Adjunct to diet and exercise to improve glycemic control in adult patients with type 2 diabetes mellitus who are not adequately controlled on metformin or sitagliptin alone or in patients already being treated with the combination of sitagliptin and metformin.
Starting dose of Janumet® is based on patient’s current regimen Max dose: 100/2000
Sulfonylurea plus Thiazolidinedione Avandaryl® Rosiglitazone/ Glimepiride
Adjunct to diet and exercise, to improve glycemic control in patients with type 2 diabetes mellitus when treatment with dual rosiglitazone and glimepiride therapy is appropriate.
4/1 4/2 Max dose: 8/4
Duetact® Pioglitazone/ Glimepiride
Adjunct to diet and exercise as a once-daily combination therapy to improve glycemic control in patients with type 2 diabetes who are already treated with a combination of pioglitazone and a sulfonylurea or whose diabetes is not adequately controlled with a sulfonylurea alone, or for those patients who have initially responded to pioglitazone alone and require additional glycemic control.
30/2 30/4 Max dose: 45/8
For treatment of hyperlipidemia, 2 FDCPs are available: Vytorin® and Advicor®.
Advicor® is a combination of an HMG-CoA Reductase Inhibitor (statin) – lovastatin with an extended release formulation of niacin, while Vytorin® is a combination of another statin, simvastatin, and a newer drug ezetimibe. All of the individual products are available separately and can be administered once daily. The FDCPs have multiple strengths available, although the dose of ezetimibe is constant at 10mg in Vytorin® (Table 2).
THIS REPORT HAS BEEN SUPERSEDED
Final Report Drug Effectiveness Review Project
FDCP for diabetes and hyperlipidemia Page 8 of 73

Table 2. Included fixed-dose combination products for hyperlipidemia Trade Name / Individual component drugs Labeled indications
Recommended starting dose & max dose
Statin plus Niacin Advicor® Niacin/ Lovastatin
Primary Hypercholesterolemia (heterozygous familial and nonfamilial) and mixed dyslipidemia (Frederickson Types IIa and IIb) in: • Patients treated with lovastatin who require further TG-lowering or HDL-raising who may benefit from having niacin added to their regimen. • Patients treated with niacin who require further LDL-lowering who may benefit from having lovastatin added to their regimen.
500/20 Max dose: 2000/40
Statin plus Ezetimibe Vytorin® Ezetimibe/ Simvastatin
Primary Hypercholesterolemia Adjunctive therapy to diet for the reduction of elevated total-C, LDL-C, Apo B, TG, and non-HDL-C, and to increase HDL-C in patients with primary (heterozygous familial and non-familial) hypercholesterolemia or mixed hyperlipidemia. Homozygous Familial Hypercholesterolemia Reduction of elevated total-C and LDL-C in patients with homozygous familial hypercholesterolemia, as an adjunct to other lipid-lowering treatments (e.g., LDL apheresis) or if such treatments are unavailable.
10/10, 10/20, 10/40 Max dose: 10/80
This report is divided into 3 parts. Part I is the introduction and methods for the entire
review. Part II is the review of evidence for FDCPs to treat type 2 diabetes, and Part III is the review of evidence for FDCPs to treat hyperlipidemia. In this report, the term adherence is meant to imply any form of taking the medication as prescribed. This may include the precise number of pills consumed per time period, the rate of refill, the timing of dose administration, etc. The term persistence is meant to describe the ability of the patient to continue taking the medication as prescribed over time. This is measured as discontinuation rates or time to discontinuation. Also in this report, when the 2 component drugs of an FDCP are given separately but simultaneously, this will be referred to as ‘co-administration’.
Analytic Frameworks and Key Questions The purpose of this review is to review the evidence surrounding the FDCPs currently on the market to treat hyperlipidemia or type 2 diabetes. We want to examine the clinical evidence available for these products in drug naïve patients and patients who have failed first-line therapy compared to a single drug or to the individual component drugs of the FDCP taken simultaneously in producing their clinical effects. This includes long-term health outcomes such as reducing mortality as well as short-term outcomes such as reducing hemoglobin A1C or serum lipids. We are also interested in the comparison of adverse events. Lastly, when comparing the FDCP to its individual component drugs taken simultaneously, we are also interested in the impact on adherence. Is adherence improved with the FDCP and importantly, are there known links between an improvement in adherence and short- or long-term outcomes?
The Oregon Evidence-based Practice Center wrote preliminary analytic frameworks and accompanying key questions, identifying the populations, interventions, and outcomes of interest, and based on these, the eligibility criteria for studies. The analytic frameworks show the target populations, interventions, intermediate outcome measures, and health outcome measures we examined and indicate the strategy that we used to guide our literature search. The accompanying key questions correspond to selected numbered arrows in these frameworks. An example framework for each population is shown below (Figures 1 and 2). The complete set of
THIS REPORT HAS BEEN SUPERSEDED
Final Report Drug Effectiveness Review Project
FDCP for diabetes and hyperlipidemia Page 9 of 73

analytic frameworks is provided in Appendix A. These were reviewed and revised by representatives of organizations participating in the Drug Effectiveness Review Project (DERP). The participating organizations of DERP are responsible for ensuring that the scope of the review reflects the populations, drugs, and outcome measures of interest to both clinicians and patients. Figure 1. FDCP as a treatment option in patients with type-2 diabetes who have had insufficient response to monotherapy
Adverse effects
Long-term health outcomes: •Cardiovascular disease •Nephropathy •Neuropathy •Retinopathy
Combination product
Improvement in HbA1C
9 Improved adherence
Improvement in HbA1C
3
6b,c
7 4
9
Individual product
6b,c
4 3
9 9
5 8
9
9
Improved adherence 9 5
9
8 9
9 7
Decision to treat patient with
type 2 diabetes with 2 drugs
Figure 2. FDCP as a treatment option in patients with hyperlipidemia who have had insufficient response to monotherapy
Adverse effects
Long-term health outcomes: •Mortality •Cardiovascular disease •Cerebrovascular disease
Combination product
Improvement in serum lipids
9 Improved adherence
Improvement in serum lipids
3
6b,c
7 4
9
Individual product
9
9
8 5
9 9
6b,c
4
9 5
9
Improved adherence 8 9
7 9
3
Decision to treat patient with
hyperlipidemia with 2 drugs
THIS REPORT HAS BEEN SUPERSEDED
Final Report Drug Effectiveness Review Project
FDCP for diabetes and hyperlipidemia Page 10 of 73
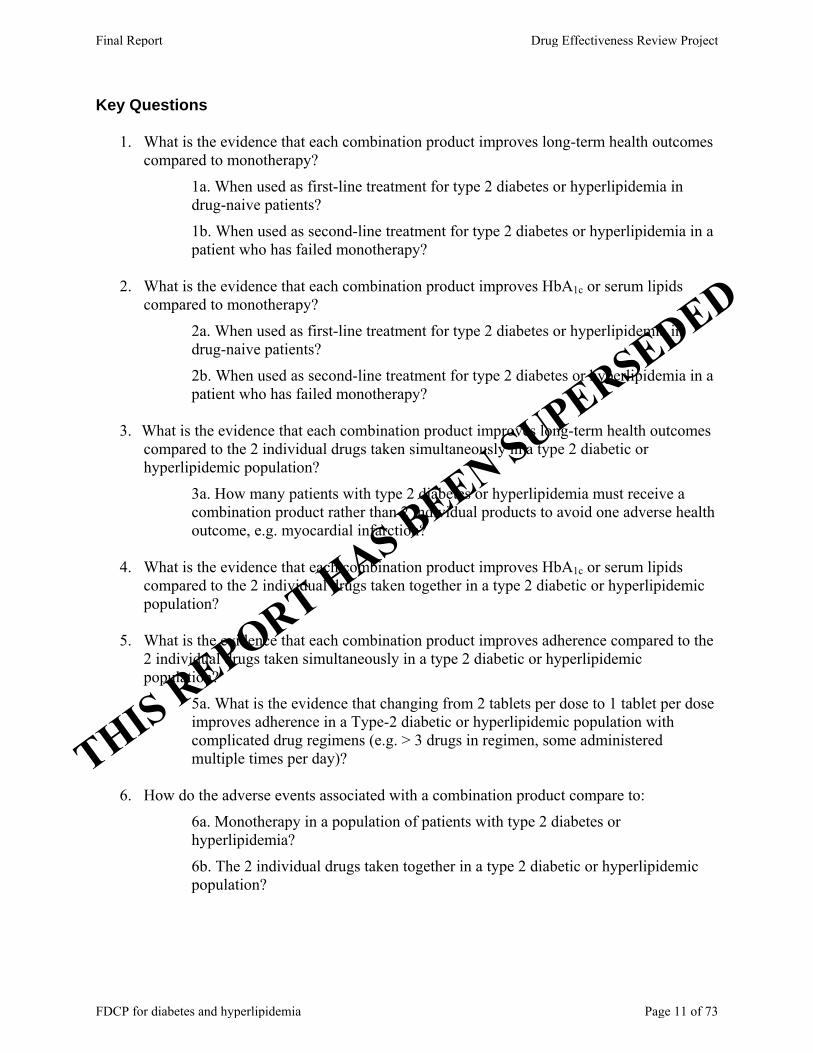
Key Questions
1. What is the evidence that each combination product improves long-term health outcomes compared to monotherapy?
1a. When used as first-line treatment for type 2 diabetes or hyperlipidemia in drug-naive patients?
1b. When used as second-line treatment for type 2 diabetes or hyperlipidemia in a patient who has failed monotherapy?
2. What is the evidence that each combination product improves HbA1c or serum lipids
compared to monotherapy?
2a. When used as first-line treatment for type 2 diabetes or hyperlipidemia in drug-naive patients?
2b. When used as second-line treatment for type 2 diabetes or hyperlipidemia in a patient who has failed monotherapy?
3. What is the evidence that each combination product improves long-term health outcomes compared to the 2 individual drugs taken simultaneously in a type 2 diabetic or hyperlipidemic population?
3a. How many patients with type 2 diabetes or hyperlipidemia must receive a combination product rather than 2 individual products to avoid one adverse health outcome, e.g. myocardial infarction?
4. What is the evidence that each combination product improves HbA1c or serum lipids
compared to the 2 individual drugs taken together in a type 2 diabetic or hyperlipidemic population?
5. What is the evidence that each combination product improves adherence compared to the
2 individual drugs taken simultaneously in a type 2 diabetic or hyperlipidemic population?
5a. What is the evidence that changing from 2 tablets per dose to 1 tablet per dose improves adherence in a Type-2 diabetic or hyperlipidemic population with complicated drug regimens (e.g. > 3 drugs in regimen, some administered multiple times per day)?
6. How do the adverse events associated with a combination product compare to:
6a. Monotherapy in a population of patients with type 2 diabetes or hyperlipidemia?
6b. The 2 individual drugs taken together in a type 2 diabetic or hyperlipidemic population?
THIS REPORT HAS BEEN SUPERSEDED
Final Report Drug Effectiveness Review Project
FDCP for diabetes and hyperlipidemia Page 11 of 73
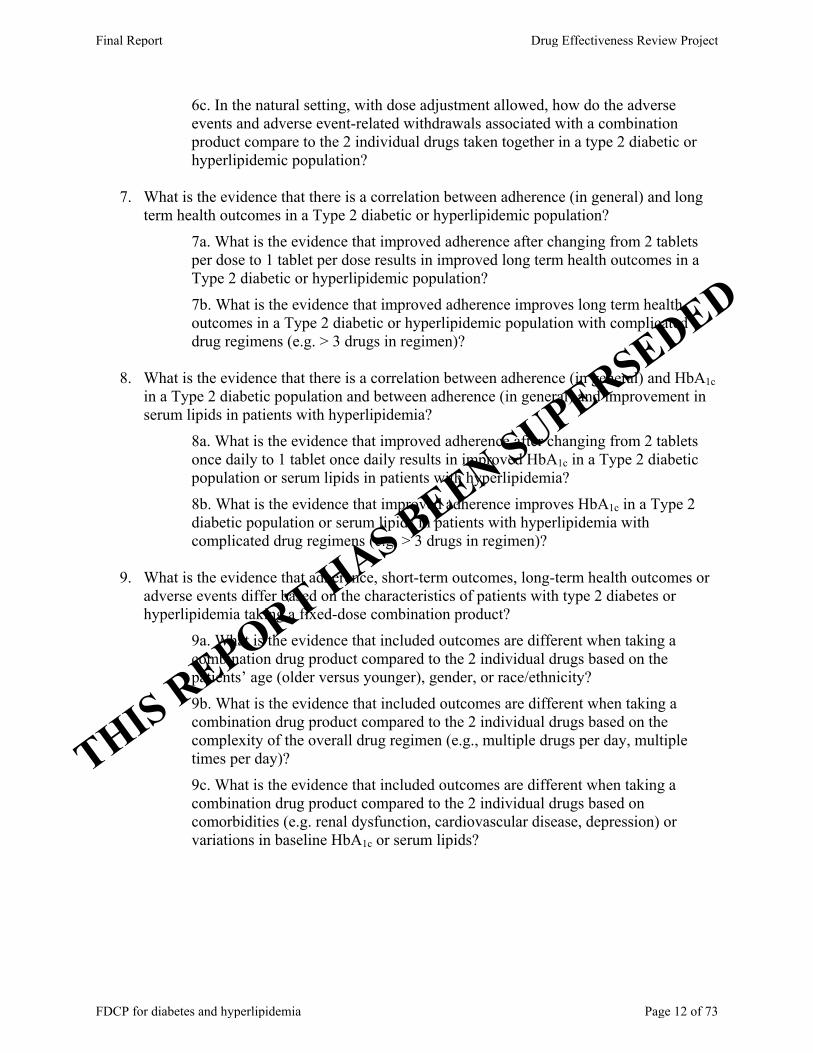
6c. In the natural setting, with dose adjustment allowed, how do the adverse events and adverse event-related withdrawals associated with a combination product compare to the 2 individual drugs taken together in a type 2 diabetic or hyperlipidemic population?
7. What is the evidence that there is a correlation between adherence (in general) and long term health outcomes in a Type 2 diabetic or hyperlipidemic population?
7a. What is the evidence that improved adherence after changing from 2 tablets per dose to 1 tablet per dose results in improved long term health outcomes in a Type 2 diabetic or hyperlipidemic population?
7b. What is the evidence that improved adherence improves long term health outcomes in a Type 2 diabetic or hyperlipidemic population with complicated drug regimens (e.g. > 3 drugs in regimen)?
8. What is the evidence that there is a correlation between adherence (in general) and HbA1c
in a Type 2 diabetic population and between adherence (in general) and improvement in serum lipids in patients with hyperlipidemia?
8a. What is the evidence that improved adherence after changing from 2 tablets once daily to 1 tablet once daily results in improved HbA1c in a Type 2 diabetic population or serum lipids in patients with hyperlipidemia?
8b. What is the evidence that improved adherence improves HbA1c in a Type 2 diabetic population or serum lipids in patients with hyperlipidemia with complicated drug regimens (e.g. > 3 drugs in regimen)?
9. What is the evidence that adherence, short-term outcomes, long-term health outcomes or
adverse events differ based on the characteristics of patients with type 2 diabetes or hyperlipidemia taking a fixed-dose combination product?
9a. What is the evidence that included outcomes are different when taking a combination drug product compared to the 2 individual drugs based on the patients’ age (older versus younger), gender, or race/ethnicity?
9b. What is the evidence that included outcomes are different when taking a combination drug product compared to the 2 individual drugs based on the complexity of the overall drug regimen (e.g., multiple drugs per day, multiple times per day)?
9c. What is the evidence that included outcomes are different when taking a combination drug product compared to the 2 individual drugs based on comorbidities (e.g. renal dysfunction, cardiovascular disease, depression) or variations in baseline HbA1c or serum lipids?
THIS REPORT HAS BEEN SUPERSEDED
Final Report Drug Effectiveness Review Project
FDCP for diabetes and hyperlipidemia Page 12 of 73
METHODS In DERP reports, we traditionally refer to the drug products by their generic names wherever possible. For this report, however, we are using the trade names for the FDCPs in an effort to make reading easier.
Literature Search To identify relevant citations, we searched Ovid MEDLINE® (1996 to May Week 4
2007), Cochrane Database of Systematic Reviews® (2nd Quarter 2007), and Cochrane Central Register of Controlled Trials® (2nd Quarter 2007), using terms for included drugs, indications, and study designs (see Appendix B for complete search strategies). We attempted to identify additional studies through hand searches of reference lists of included studies and reviews. In addition, we searched the FDA’s Center for Drug Evaluation web site for medical and statistical reviews of data submitted to the FDA for approval of a drug product for a given indication. Finally, the manufacturers of the products included in the review were requested to submit a dossier describing the studies relating to this review and their product. We searched dossiers submitted for studies not identified by our own searches (published and unpublished) and unpublished data from studies we did locate. All citations were imported into an electronic database (Endnote® v.9.0).
Study Selection Two reviewers independently assessed titles, and abstracts where available, of citations
identified from literature searches. Full-text articles of potentially relevant citations were retrieved and assessed for inclusion by two reviewers. Disagreements were resolved by consensus. Results published only in abstract form were not included. Unpublished study results were included if the study quality could be assessed based on the available information. Abstracts of studies were excluded, as were studies of only co-administered drugs, rather than the FDCP.
We reviewed studies using a hierarchy of evidence approach, where the best evidence is the focus of our synthesis for each question, population, intervention, and outcome addressed. As such, direct comparisons were preferred over indirect comparisons, and effectiveness and long-term harms outcomes were preferred to efficacy and short-term tolerability outcomes. In general trial evidence is preferred to observational study evidence with the caveat that the applicability of trial evidence must be considered in this decision on a case by case basis.
Inclusion Criteria
Type 2 diabetes Population(s) Adults (age > 18 years) with type 2 diabetes. First-line treatment refers to patients who have not previously been treated with drug therapy. Second-line treatment refers to patients who have previously been treated with drug therapy, but who have had insufficient response.
THIS REPORT HAS BEEN SUPERSEDED
Final Report Drug Effectiveness Review Project
FDCP for diabetes and hyperlipidemia Page 13 of 73

Interventions The drugs of interest are the fixed-dose combination products listed in Table 3 below. Comparators can be any oral drug used to treat type 2 diabetes mellitus. Table 3. Included drugs for type 2 diabetes
Fixed-dose Combination Products Individual drugs in combination Monotherapy Metformin plus Sulfonylurea Metaglip® 2.5/250mg glipizide; metformin hydrochloride Glucovance® 2.5/500mg glyburide; metformin hydrochloride
Metformin plus Thiazolidinedione Avandamet® 2/1000mg, 4/1000mg*, 2/500mg*, 1/500mg*, 4/500mg*
metformin hydrochloride; rosiglitazone maleate
Actoplus Met® 15/850mg
metformin hydrochloride; pioglitazone hydrochloride
Metformin plus Meglitinide Janumet® 500/50mg, 100/50mg metformin hydrochloride; sitagliptin Sulfonylurea plus Thiazolidinedione Avandaryl® 4/2mg, 4/1mg*, 4/4mg* glimepiride; rosiglitazone maleate Duetact® 2/30mg, 4/30mg glimepiride; pioglitazone
hydrochloride
glimepiride glipizide glyburide repaglinide nateglinide rosiglitazone maleate pioglitazone hydrochloride metformin hydrochloride sitagliptin
Outcomes Health Outcomes Mortality and morbidity from cardiovascular disease Hospitalizations, emergency department visits (e.g., number, length) Nephropathy Neuropathy Retinopathy Composite outcomes of above as defined by study authors Short-term (Intermediate) Outcomes Glycosylated hemoglobin (HbA1c) Adherence/persistence Harms Overall adverse events Major: those that are life-threatening, result in long-term morbidity, or require medical intervention to treat (e.g., lactic acidosis, hepatotoxicity, macular retinal edema, heart failure) General: (e.g., weight gain, headache, diarrhea, nausea and vomiting, dizziness) Withdrawals due to adverse events, time to withdrawal due to adverse events Hyperlipidemia Population(s) Adults (age > 18 years) at significantly increased risk for atherosclerotic disease due to primary hypercholesterolemia, mixed hyperlipidemia/dyslipidemia, homozygous familial hypercholesterolemia. First-line treatment refers to patients who have not previously been treated with drug therapy. Second-line treatment refers to patients who have previously been treated with drug therapy, but who have had insufficient response.
THIS REPORT HAS BEEN SUPERSEDED
Final Report Drug Effectiveness Review Project
FDCP for diabetes and hyperlipidemia Page 14 of 73

Interventions Table 4 details the included drugs for hyperlipidemia. Table 4. Included drugs for hyperlipidemia
Fixed-dose Combination Products
Individual drugs in combination
Monotherapy
Vytorin® 10/10mg, 10/20mg, 10/40mg, 10/80mg
Ezetimibe; simvastatin
Advicor® 750/20mg, 500/20mg*, 1000/20*
lovastatin; niacin
Lovastatin, Simvastatin, Fluvastatin, Rosuvastatin, Niacin, Atorvastatin, Pravastatin, Ezetimibe
∗ Canadian Product Outcomes Health Outcomes Mortality and/or morbidity from cardiovascular disease Mortality and/or morbidity from cerebrovascular disease (individual and composite outcomes) Nonfatal myocardial infarction, angina, cardiovascular death, all-cause mortality, stroke, and need for revascularization (coronary artery bypass graft, angioplasty and stenting) Short-term (Intermediate) Outcomes Serum lipids: LDL-c reduction or the percent of patients meeting NCEP goals; HDL-c increase Adherence/persistence Harms Overall adverse events Withdrawals due to adverse events, time to withdrawal due to adverse events Specific adverse events Major: those that are life-threatening, result in long-term morbidity, or require medical intervention to treat (e.g., rhabdomyolysis, hepatotoxicity, angioedema, elevations in liver enzymes or creatine phosphokinase levels, proteinuria, decline in renal function, increased risk of cancer) General: (e.g., myalgia, headache, upper respiratory infection, flushing, pruritus, hyperglycemia, diarrhea, nausea) Study Designs Included study designs are detailed in Table 5.
THIS REPORT HAS BEEN SUPERSEDED
Final Report Drug Effectiveness Review Project
FDCP for diabetes and hyperlipidemia Page 15 of 73
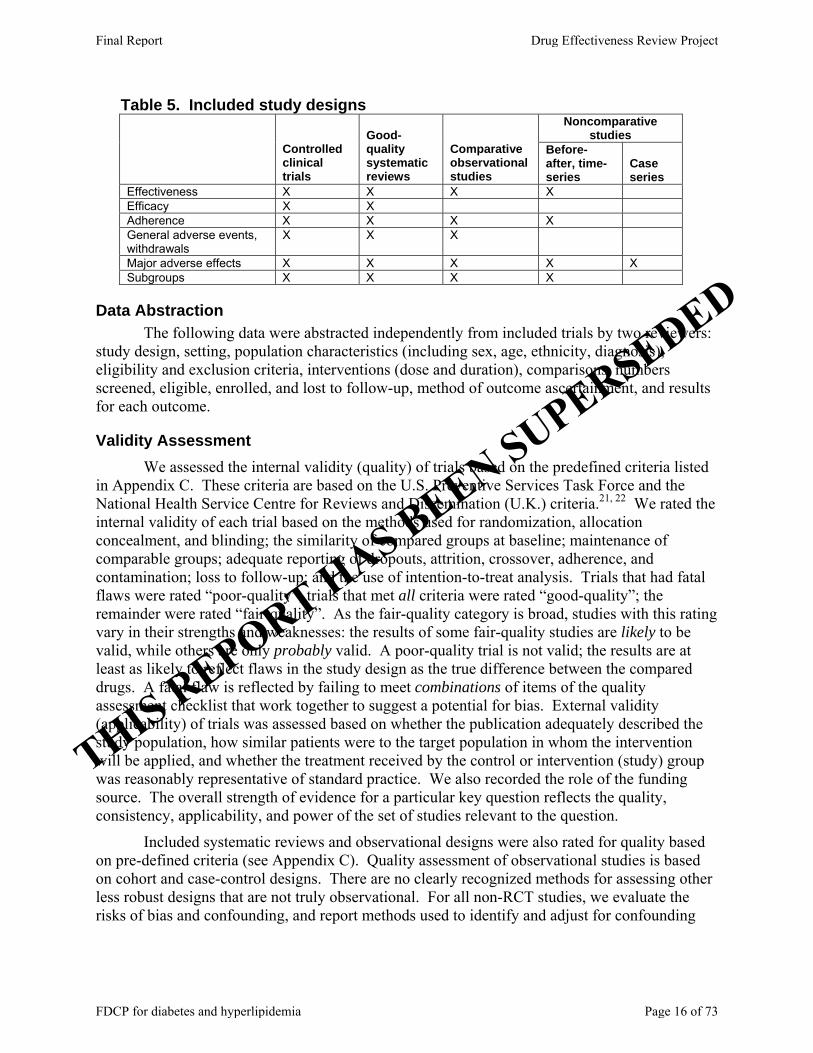
Table 5. Included study designs Noncomparative
studies
Controlled clinical trials
Good-quality systematic reviews
Comparative observational studies
Before-after, time-series
Case series
Effectiveness X X X X Efficacy X X Adherence X X X X General adverse events, withdrawals
X X X
Major adverse effects X X X X X Subgroups X X X X
Data Abstraction The following data were abstracted independently from included trials by two reviewers:
study design, setting, population characteristics (including sex, age, ethnicity, diagnosis), eligibility and exclusion criteria, interventions (dose and duration), comparisons, numbers screened, eligible, enrolled, and lost to follow-up, method of outcome ascertainment, and results for each outcome.
Validity Assessment We assessed the internal validity (quality) of trials based on the predefined criteria listed
in Appendix C. These criteria are based on the U.S. Preventive Services Task Force and the National Health Service Centre for Reviews and Dissemination (U.K.) criteria.21, 22 We rated the internal validity of each trial based on the methods used for randomization, allocation concealment, and blinding; the similarity of compared groups at baseline; maintenance of comparable groups; adequate reporting of dropouts, attrition, crossover, adherence, and contamination; loss to follow-up; and the use of intention-to-treat analysis. Trials that had fatal flaws were rated “poor-quality”; trials that met all criteria were rated “good-quality”; the remainder were rated “fair-quality”. As the fair-quality category is broad, studies with this rating vary in their strengths and weaknesses: the results of some fair-quality studies are likely to be valid, while others are only probably valid. A poor-quality trial is not valid; the results are at least as likely to reflect flaws in the study design as the true difference between the compared drugs. A fatal flaw is reflected by failing to meet combinations of items of the quality assessment checklist that work together to suggest a potential for bias. External validity (applicability) of trials was assessed based on whether the publication adequately described the study population, how similar patients were to the target population in whom the intervention will be applied, and whether the treatment received by the control or intervention (study) group was reasonably representative of standard practice. We also recorded the role of the funding source. The overall strength of evidence for a particular key question reflects the quality, consistency, applicability, and power of the set of studies relevant to the question.
Included systematic reviews and observational designs were also rated for quality based on pre-defined criteria (see Appendix C). Quality assessment of observational studies is based on cohort and case-control designs. There are no clearly recognized methods for assessing other less robust designs that are not truly observational. For all non-RCT studies, we evaluate the risks of bias and confounding, and report methods used to identify and adjust for confounding
THIS REPORT HAS BEEN SUPERSEDED
Final Report Drug Effectiveness Review Project
FDCP for diabetes and hyperlipidemia Page 16 of 73
whenever they are found. If these are not discussed in the text, they were not reported in the study.
Synthesis A qualitative analysis of the available evidence or lack of evidence was undertaken. For
this review, the data were inadequate for statistical analysis. We constructed evidence tables showing the study characteristics, quality ratings, and results for all included studies. In situations where numbers of patients experiencing an event were reported in a study, but no statistical analyses were presented, we calculated P values using chi squared analysis, and for those in whom a statistically significant difference was found, we also calculated numbers needed to treat or harm. Numbers needed to treat or harm were calculated based on the absolute risk difference: 1/(risk in group A – risk in group B). These calculations were done using StatsDirect statistical software (Camcode, UK).
Peer Review and Public Comment Original DERP reports are independently reviewed and commented upon by three to five
peer reviewers. Peer reviewers are identified through a number of sources, including but not limited to: professional society membership, acknowledged expertise in a particular field, prominent authorship in the published literature, or recommendation by DERP participating organizations. A listing of individuals who have acted as peer reviewers of DERP reports is available on the DERP website. In addition, the DERP process allows for a two-week public comment period prior to finalization of the report. Draft reports are posted on the DERP website and interested individuals or organizations have the ability to review the complete draft report and submit comments. Both peer review and public comments are discussed with the DERP participating organizations before a determination is made on what action should be taken in response.
THIS REPORT HAS BEEN SUPERSEDED
Final Report Drug Effectiveness Review Project
FDCP for diabetes and hyperlipidemia Page 17 of 73

PART II. Fixed Dose Combination Drug Products for the Treatment of Type 2 Diabetes
RESULTS
Overview Our searches identified 507 citations, 442 from Medline, 25 from the Cochrane Library, 4 from public comment, 1 from CDER (Center for Drug Evaluation and Research), 3 from a dossier submitted by the manufacturer of Actoplus Met®, 3 from a dossier submitted by the manufacturer of Avandamet®, 1 from manufacturer of Janumet®, 3 from dossier submitted by the manufacturer of Avandaryl®, 1 from dossier submitted by the manufacturer of Duetact®, 6 medical and statistical reviews from Drugs at FDA, and 18 from hand-searching of reference lists. Of these, we included 30 studies (3 pending review, see appendix E for details): 13 RCTs, 16 non-RCTs, and a meta-analysis (Figure 3). Among the non-RCTs, 4 came from reference lists of other included studies and 2 came from the Actoplus Met® dossier. The Avandamet® dossier also provided us with identification of an additional RCT. All remaining included studies were identified through Medline. Figure 3. Results of literature search for Type 2 Diabetes drugs
425 citations excluded (see report for criteria)
507 titles and abstracts identified through searches, dossiers, peer review and public comment
82 full-text publications retrieved for more detailed evaluation
52 publications excluded for not meeting inclusion criteria, specifically: • 22 wrong publication type (e.g. letter,
editorial, non-systematic review) • 2 wrong study design • 12 wrong outcome • 6 wrong intervention • 8 background papers • 1 wrong population • 1 foreign language
30 publications included (3 pending review-see Appendix E for details).
• 13 randomized controlled trials • 1 meta analysis • 16 observational studies
THIS REPORT HAS BEEN SUPERSEDED
Final Report Drug Effectiveness Review Project
FDCP for diabetes and hyperlipidemia Page 18 of 73
Summary Points
• We found no studies that evaluated long-term health outcomes for any available FDCP for type 2 diabetes. We found no trials that compared HbA1c control or adverse event rates between any type 2 diabetes FDCP and co-administration of their respective components.
• There is very limited supporting evidence that Glucovance® and Avandamet® may improve adherence compared to co-administration of their respective components and no studies were identified that explored this for the other FDCPs. Further, evidence was conflicting that there is any correlation between adherence to antidiabetic medication in general and either long-term health outcomes or HbA1c control.
• Glucovance® has been more extensively studied in trials (n=1,071 across 6 trials) compared to Metaglip® (n=608 in 2 trials), Avandaryl® (n=431 in 1 trial), or Avandamet® (n=155 in 1 trial). There have been no clinical studies conducted with Actoplus Met®, Duetact®, or Janumet®. Efficacy, safety and bioequivalence of these products were established based on studies of the co-administration of their respective separate components.
• First-line therapy with Glucovance®, Metaglip®, Avandaryl®, or Avandamet® in patients with baseline HbA1c of 8.2% or above consistently produced statistically significantly greater reductions in HbA1c compared to monotherapy with either of their respective components. These benefits from FDCP were often achieved at lower mean component doses than when using components as monotherapy.
o The magnitudes of the differences in HbA1c reductions between the FDCPs and their respective monotherapy components ranged from 0.5% to 0.8% for Glucovance®, 0.3% to 0.7% for Metaglip®, 0.5% to 0.7% for Avandamet®, and 0.6% to 0.8% for Avandaryl®.
o The rates at which patients reached the ADA goal of ≤ 7% were reported in trials of Glucovance® (4-5 months), Avandaryl® (7 months), or Avandamet® (8 months) and were generally greater for FDCPs than in patients using monotherapy. Numbers of patients that would need to be treated for an additional patient to reach the ADA goal when on an FDCP compared to a monotherapy are as follows:
Glucovance® vs. metformin = NNT of 4 to 6 Glucovance® vs. glyburide = NNT of 8 to 9 Avandamet® vs. rosiglitazone or metformin = NNT of 5 Avandaryl® vs. glimepiride or rosiglitazone = NNT of 3 to 4
• Second-line therapy trials were identified only for Glucovance® and Metaglip®. No evidence was found for the efficacy and safety of using any other type 2 diabetes FDCP for second-line therapy. Regardless of baseline HbA1c, Glucovance® and Metaglip® improved HbA1c control using lower mean dosages of either of their respective component monotherapies.
o The greatest differences in HbA1c reduction magnitudes were reported in a trial of Glucovance® in patients with relatively higher baseline HbA1c’s of 9.4% to 9.64%. Starting dosage strengths of 2.5/500mg and 5/500mg both reduced HbA1c by 1.7% more than glyburide monotherapy and by 1.9% more than metformin monotherapy.
THIS REPORT HAS BEEN SUPERSEDED
Final Report Drug Effectiveness Review Project
FDCP for diabetes and hyperlipidemia Page 19 of 73
o In remaining second-line therapy trials, Glucovance® generally reduced HbA1c by 0.6% to 1.0% more than either metformin or glyburide monotherapy and Metaglip® reduced mean HbA1c by 0.9% to 1.1% more than either glipizide or metformin monotherapy.
o More patients reached the ADA HbA1c goal of ≤ 7% taking Glucovance® or Metaglip® than those using either of their respective component monotherapies. Only 3 or 4 (NNT) patients must receive either Glucovance® or Metaglip®, rather than either respective component monotherapy, for an additional patient to reach the ADA goal within 18-24 weeks of treatment.
o Starting at the 5/500mg dosage strength of Glucovance® did not seem to greatly increase HbA1c control relative to starting at the lower dosage strength of 2.5/500mg.
• Among FDCPs with a sulfonylurea component, improved glycemic control was accompanied by increased frequency of hypoglycemia with higher dosages of Metaglip® and Glucovance®, but not for Avandaryl®, compared to sulfonylurea monotherapy.
o There was 1 additional case of hypoglycemia reported after 18-24 weeks for as few as every 6 to 20 patients (NNH) who took Glucovance® or Metaglip® rather than monotherapy with a sulfonylurea or metformin.
o Very few cases of hypoglycemia resulted in discontinuation or were classified as severe and none were reported as requiring medical assistance.
• Other than hypoglycemia, FDCPs generally did not differ substantially from the known adverse effect profiles of their monotherapy components.
• Regarding the effects of these drugs in subgroups, only very limited evidence was available from RCTs to suggest that differences in age, gender, or race had no measurable effect on HbA1c control outcomes for both Glucovance® and Metaglip®.
Detailed Assessment We identified studies that have been conducted specifically using fixed-dose combination
tablets comprised of glyburide/metformin (Glucovance®),23-30 glipizide/metformin (Metaglip®),31, 32 rosiglitazone/metformin (Avandamet®),33, 34 and rosiglitazone/glimepiride (Avandaryl®).35 No studies were identified that used the fixed-dose combination tablets comprised of pioglitazone/glimepiride (Duetact®),36 pioglitazone/metformin (Actoplus Met®),37 or sitagliptin/metformin (Janumet®).38 Rather, the efficacy and safety of Actoplus Met®, Duetact®, and Janumet® have been established based on trials using the co-administration of their separate components.
The majority of the randomized controlled trials were 4- to 6-month evaluations of glycemic control and general adverse events with combination tablet products compared to component monotherapy when used as initial treatment for patients with type 2 diabetes (Key Questions 2 and 6). Studies that compared type 2 diabetes combination tablet products to co-administration of their components were few, nonrandomized, and limited to analyses based on refill data from pharmacy claims databases.29, 30, 34
Section I of our detailed assessment reports glycemic control, adverse event, and adherence outcomes for each of the different combination tablet products separately and will address Key Questions 2, 4, 5, 6 and 9. Organization of Section I uses a best evidence approach and presents products in order based on volume of associated evidence; from the product with the most available evidence to the product with the least available evidence. Section II
THIS REPORT HAS BEEN SUPERSEDED
Final Report Drug Effectiveness Review Project
FDCP for diabetes and hyperlipidemia Page 20 of 73
summarizes the evidence applicable to Key Questions 7 and 8, regarding evaluation of the association between general type 2 diabetes medication adherence and primarily glycemic control.39-46 Although no studies reportedly evaluated the impact of medication adherence on specific long-term health outcomes, Section II summarizes evidence from a few retrospective observational studies that measured associations between medication adherence and hospitalization rates.41, 43, 46 We found no evidence to address Key Questions 1 or 3, regarding the effectiveness of combination tablet products in improving long-term health.
Section I. Glycemic control, adverse event, and adherence outcomes for combination tablet products A. Glucovance®
Glucovance® was the first type 2 diabetes combination tablet product to be FDA-approved for the U.S. market and has the distinction of being the most well-studied among its competitors. The majority of this research consists of randomized controlled trials comparing Glucovance® to monotherapy with either glyburide or metformin.23-28 So far, only retrospective, nonrandomized studies of prescription data from pharmacy databases have compared patient outcomes following co-administration of glyburide and metformin versus taking both ingredients in the form of a fixed-dose combination tablet product.29, 30, 47
1. Glucovance® compared to monotherapy with glyburide or metformin In this review, we included six trials of Glucovance® compared to monotherapy with
glyburide or metformin specifically as initial therapy for patients with Type 2 diabetes poorly controlled with diet and exercise alone23, 24, 27 or as second-line therapy for patients inadequately controlled by previous oral antidiabetic medications (Evidence Table 1).25, 26 Criteria used for diagnosis of Type 2 diabetes was not reported in any of these trials. Prior treatment failure criteria were not specified in one trial and it is not clear whether it was aimed at evaluating patients for use as first- or second-line therapy.28 In two trials conducted in European countries, Glucovance® and monotherapy comparator tablets used the ingredient glibenclamide, which is another name used for glyburide, outside of the U.S.23, 26
Methods. After brief run-in periods, patients in these trials were randomized to
Glucovance®, glyburide/glibenclamide, or metformin and were followed for 16-24 weeks. In initial therapy trials, Glucovance® dosages generally started at 1.25/250mg (glyburide or glibenclamide/metformin), with only one trial having a second Glucovance® group with a starting dosage of 2.5/500.27 In trials where Glucovance® was used as second-line therapy, starting dosages were consistently higher at 2.5/500mg or 5/500mg. One trial was conducted in a single-center in Vincenza, Italy and used a glyburide/metformin combined tablet product known as Glibomet that contains a 400mg strength of metformin that is not available in the U.S. or Canada.28 Starting dosages for monotherapy comparator groups were 2.5-10mg for glyburide/glibenclamide and 500mg for metformin. Dosages were generally titrated by one tablet at a time until FPG target values of ≤ 7 or 7.8 mmol/l were reached, or up to a maximum of 4 tablets per day. In all trials, patients receiving Glucovance® consistently required lower final mean dosages of glyburide/glibenclamide and metformin than patients receiving either ingredient as monotherapy.
THIS REPORT HAS BEEN SUPERSEDED
Final Report Drug Effectiveness Review Project
FDCP for diabetes and hyperlipidemia Page 21 of 73

In initial therapy trials, run-in periods consisted of either 1 week of eucaloric diet23 or 2 weeks of single-blind placebo.24, 27 In two initial therapy trials, up to 5.3% of enrolled patients were excluded prior to randomization due to noncompliance with study-related procedures during the 2-week, single-blind placebo run-in phases.24, 27 In second-line therapy trials, patients were only eligible for randomization if their FPG remained ≥ 7 mmol/l after a 2-week run-in period of either glyburide25 or metformin.26 Almost 11% of enrolled patients were excluded due to improved FPG after glyburide run-in in one second-line therapy trial,25 but it is unclear whether metformin run-in led to any exclusions in the other trial.26
All but one trial were rated fair quality and the other was rated poor quality (Evidence Table 2).28 Data from the poor quality trial will not be presented here, but is available in Evidence Table 1. A common flaw across trials was the exclusion of data from up to 20.5%30 of randomized patients from efficacy analyses. Additionally, in one trial there were more females randomized to glibenclamide (71%) than to metformin (53%) or Glucovance® (61%).23 Given the small size of this trial (n=50), the difference was not statistically significant and it is conceivable that the imbalance of female patients was a result of chance alone. In the poor quality trial, 17.5% of patients were excluded from the final analyses because of early study discontinuation due to withdrawal of consent (2.5%), hypoglycemic episodes (7.5%), or poor HbA1c control at >10% (7.5%). It was unclear whether the patients who dropped out due to poor HbA1c control did so while taking Glucovance® or glyburide. There is concern that if all had dropped out during Glucovance® therapy, exclusion of data from their last HbA1c observations at 10% could have biased the 6-month HbA1c mean in the direction of making the mean change appear greater than it actually was.
Patient characteristics. There were very few differences in baseline characteristics
between patients in the initial therapy trials compared to patients in the second-line therapy trials. Overall, patients were 56.4% male (range 46% to 62%) and had a mean age of 53.6 years (range 49 to 60 years). Race was only specified in three trials in which patients were 75.2% white.24, 25,
27 With the exception of one second-line therapy trial in which mean baseline HbA1c was notably higher at 9.5%,25 values ranged from 7.9% to 8.7% and overall mean BMI was 30.5 kg/m2 (range 29.7 to 31.3). The only clear distinction in disease severity factors between initial therapy and second-line therapy trials was that mean number of years since type 2 diabetes diagnosis was 6.9 years for second-line therapy trials and 3.0 years for patients in initial therapy trials.
Long-term health outcomes. No long-term health outcomes were reported in any study of
Glucovance® compared to monotherapy with either glyburide or metformin. HbA1c levels. Overall, patients receiving Glucovance® achieved superior HbA1c control
using lower dosages of glyburide and metformin than patients receiving monotherapy with either of the component ingredients. Primary efficacy was pre-specified as the mean change from baseline in HbA1c (% units) in the initial therapy trials and was described as 16-week HbA1c concentration25 or HbA1c
26 in the second-line therapy trials. HbA1c reductions were consistently greater with Glucovance® versus glyburide or metformin monotherapies (Table 6). Baseline HbA1c appeared to have some association with outcome in that groups with greater mean HbA1c levels at baseline were noted to achieve greater reductions during follow-up.
THIS REPORT HAS BEEN SUPERSEDED
Final Report Drug Effectiveness Review Project
FDCP for diabetes and hyperlipidemia Page 22 of 73

Three trials also reported the proportions of patients that reached the American Diabetes Association (ADA) treatment goal of an HbA1c concentration of 7% or lower.24, 26, 27 Overall, there were more patients taking Glucovance® that achieved an HbA1c of 7% or lower (mean=71.6% of patients; range=63.8% to 75.5%) compared to patients taking glyburide (mean=58% of patients; range=41.9% to 68%) or metformin (mean=51.5% of patients; range=37.6% to 62%), regardless of dosage or whether administered as initial or second-line treatment.
Table 6. HbA1c reductions in trials of Glucovance® versus glyburide or metformin monotherapy Change from baseline in HbA1c Glucovance®
Trial Baseline HbA1c (%) 1.25/250mg 2.5/500mg 5/500mg Glyburide Metformin
Initial therapy Bruce 2006
7.9 -0.9 N/A N/A -0.7 -0.2
Garber 2002*
8.2 -1.5‡§
-1.5ഠN/A -1.2 -1.0
Garber 2003
8.7 -2.3† N/A N/A -1.9 -1.5
Second-line therapy Marre 2002
7.9 N/A -1.2** -0.9** -0.3 -0.2
Blonde 2002
9.5 N/A -1.5* -1.5* +0.1 0
†p=0.0003 vs. either monotherapy; ‡p<0.001 vs. metformin; §p<0.016 vs. glyburide; ¥p<0.004 vs. glyburide; *p<0.001 vs. either monotherapy; **p<0.05 vs. either monotherapy Adverse events. No unexpected increases in risk of hypoglycemia were seen for Glucovance® compared to glyburide monotherapy at dosages not exceeding 7.6mg.24, 26, 27 However, risk of hypoglycemia was significantly increased for Glucovance® compared to glyburide monotherapy when both were used second-line at higher dosages in order to attain glycemic control in patients with higher baseline mean HbA1c levels (9.5%) (Table 7).25
THIS REPORT HAS BEEN SUPERSEDED
Final Report Drug Effectiveness Review Project
FDCP for diabetes and hyperlipidemia Page 23 of 73

Table 7. Pooled hypoglycemia rates for Glucovance® compared to glyburide monotherapy
Group 1 Group 2 Group 1 Group 2 Total
Marre2002
NR 5 2.5 5 8/103 (8%) 11/101 (11%)
14/103 (14%)
25/204(12%)
Garber 2003
≤ 2.8 mmol/l 7.6 3.7 N/A 16/151(11%)
19/171(11%)
N/A 19/171(11%)
Garber 2002
≤ 2.8 mmol/l 5.3 2.8 4.1 10/160(6%)
8/158(5%)
26/162(16%)
34/320(11%)
34/414 (8%)
N/A N/A 78/695 (11%)
Blonde 2002
≤ 3.3 mmol/l 20 8.8 17.4 3/167 (2%) NR NR 22/323 (7%)
Mean final glyburide dosages (mg)
Lower dosage trialsGlyburide
Hypoglycemiadefinition Glyburide
Hypoglycemia rates
3.79 (95% CI 1.24, 11.80)
Highest dose trial
AuthorYear
1.38 (95% CI 0.93, 2.04)Cochran Q = 1.221615, df = 2, p=0.54
Pooled rates
Pooled relative risk
Relative risk
Glucovance® Glucovance®
Otherwise, rates of all-cause adverse events, withdrawals due to adverse events, serious
adverse events, death, overall gastrointestinal adverse events, diarrhea, upper respiratory infection, nausea/vomiting, musculoskeletal pain, headache, and abdominal pain for Glucovance® were generally comparable or lower than monotherapy with either glyburide or metformin. A small number of serious adverse events or deaths were reported in patients taking Glucovance®.23-26 In one trial, 8 of 204 patients (4%) taking Glucovance® had unspecified serious adverse events, as defined as “adverse events that were known with certainty or suspected with good reason, to constitute a threat to life or to cause severe or permanent impairment.”26 Additionally, 1 patient taking Glucovance® in each of two other trials was rated as having a serious adverse event.23, 27 One case of angina was considered possibly related to Glucovance®27 and one case of coronary heart disease was rated as unrelated to treatment with Glucovance®.23 Only 4 deaths were reported across all groups of patients taking Glucovance®, with causes either unspecified24 or due to myocardial infarction.25 Out of these, all but 1 was rated as unrelated to treatment.25 Only considered possibly related to treatment was the death of a 50-year-old man who suffered a myocardial infarction within 107 days after randomization to Glucovance®.25
Subgroups. Only one trial reported on whether the outcomes of patients taking
Glucovance® could be affected by differences in demographic characteristics,25 and no trials addressed how complexity of overall drug regimens or comorbidities could impact outcome. When subgroup analyses based on patient demographics were performed based on outcome data from the one trial that compared the efficacy and safety of second-line therapy with Glucovance® or monotherapy with either glyburide or metformin, no differences in changes from baseline in HbA1c based on gender, race, and age were found for any of the treatment groups.25
Additionally, a meta-analysis48 was conducted that combined data from three25-27 of the six trials discussed above and looked at the comparative efficacy and safety of Glucovance®
THIS REPORT HAS BEEN SUPERSEDED
Final Report Drug Effectiveness Review Project
FDCP for diabetes and hyperlipidemia Page 24 of 73
versus monotherapy with either metformin or glyburide/glibenclamide based on potential influences of baseline HbA1c, weight, or age. The main findings were that Glucovance® was associated with significantly greater reductions in HbA1c and comparable tolerability compared to metformin or glyburide/glibenclamide, irrespective of baseline HbA1c, age, or BMI. It is important to consider, however, that these findings may change if data were added to the meta-analyses from the additional trials of Glucovance® compared to monotherapy with either glyburide/glibenclamide or metformin.
2. Glucovance® compared to co-administration of glyburide and metformin We found no randomized controlled trials that compared Glucovance® to co-
administration of glyburide and metformin. The only evidence regarding the comparison of Glucovance® versus co-administration of glyburide and metformin comes from three retrospective database studies (Evidence Tables 3 and 4).29, 30, 47 These non-randomized studies provided the basis for assessment of the association between adherence rates and HbA1c control or in tolerability for Glucovance® compared to co-administration of glyburide, but no long-term health outcomes were reported.
Association between adherence and HbA1c Methods. Two fair quality retrospective cohort studies examined rates of adherence to
antidiabetic therapy among type 2 diabetes patients enrolled in large pharmacy benefits management programs serving millions of individuals across the U.S.29, 30 The cohorts consisted of patients that had a pharmacy claim for an antidiabetic medication during identification periods from 2000 to 2001. One study focused only on patients new to combination therapy with either Glucovance® or glyburide co-administered with metformin and who were eligible for, but did not receive, any other oral antidiabetics during the previous 6 months.30 The other study by Melikian included patients classified as newly treated or previously treated.29 Newly treated patients were again defined as those who had no refills for antidiabetic medications in the 6 months prior to the index claim for Glucovance® or glyburide co-administered with metformin. Previously treated patients were classified by whether they were switched from monotherapy or co-administration of glyburide and metformin.
Refill data was collected for up to 180 days, with rates of adherence defined as the total days’ supply of medication obtained, divided by the total number of days in the observation periods. Between-groups differences in adherence rates were analyzed using either analysis of covariance29 or a multiple variable linear regression model, including adjustment for demographic factors and overall burden of illness (chronic disease score).30 Other important factors adjusted for were total pill burden,29 baseline HbA1c,
30 and insulin use29 for the cohorts of previously treated patients.
Although generally well-conducted, one disadvantage of using prescription refill-based assessments is that they don't take into account that patients could have had other medication sources. In attempt to reduce this risk, cohorts were restricted to only patients who were continuously eligible during the observation period. Regardless, we considered that refill-based data may not fully reflect actual medication use patterns. In one study, the actual mean numbers of observation days were reported and were noted as similar between groups.30 No such information was provided for patient cohorts in the other study by Melikian and this raises
THIS REPORT HAS BEEN SUPERSEDED
Final Report Drug Effectiveness Review Project
FDCP for diabetes and hyperlipidemia Page 25 of 73
concern about potential for bias on adherence rates based on possible between-groups differences in observational period duration.29
Patient characteristics. Newly treated patients (n=1727) were similar in demographics
across studies. Mean age was 58 years (range 57 to 62.5) and 58.1% of the population was male (range 49.5 to 60). Neither study provided information about race. For the cohort of previously treated patients, mean age was 67 years and 50.1% were male. Both studies measured comorbidities and overall health status using the Chronic Disease Score (CDS). The CDS was rated using medication refill data as markers for the presence of 27 chronic diseases, including hypertension, cardiac disease, depression, and hyperlipidemia. An overall composite score was calculated by unspecified methods of summing weighted scores for each of the 27 diseases. In one study, severity levels were prespecified as “mild/moderate” for scores of 11 or below and “severe” for scores above 11.30 Mean CDS was 7.6 (range 6.1 to 7.9) across the cohorts of newly treated patients and was 6.8 in the cohort of previously treated patients.
Adherence outcomes. Results were mixed across studies for the comparison of adherence
rates between Glucovance® or glyburide co-administered with metformin in newly treated patients. Mean adherence rates were not provided for patients in the smaller cohort (n=306), but it was reported that there were no statistically significant differences between patients receiving co-administration of glyburide and metformin and those receiving Glucovance®.29 In the larger cohort (n=1421), adjusted adherence rates were statistically significantly greater for patients taking Glucovance® compared to those taking glyburide co-administered with metformin (84% vs. 76% of days with drug supply; p<0.0001).30
Adherence rates in previously treated patients switched from monotherapy to Glucovance® had statistically significantly higher adherence rates than those switched to co-administration of glyburide and metformin (77% vs. 54%; p<0.001).29 Additionally, adherence rates increased statistically significantly when previously treated patients were switched from co-administration of glyburide and metformin to Glucovance® (71% vs. 87%; p<0.001).29
Adverse events. One retrospective study compared complication rates in patients using a
sulfonylurea co-administered with metformin before and after their switch to Glucovance®.47 This study sample was based on a review of medical records from 3 Veterans Affairs Medical Centers and 1 Department of Defense Medical Center and included 72 patients with type 2 diabetes that had been treated with glipizide or glyburide co-administered with metformin for at least 6 months prior to switching to Glucovance®. Mean follow-up duration for Glucovance® therapy was 196 days. The study sample was 97.2% male, with a mean age of 61.9 years, and was 72.2% white. Mean prognostic factors included a BMI of 32.9 kg/m2 and an HbA1c of 8.3% and, on average, they had been diagnosed with type 2 diabetes 7.6 years prior to study participation. More patients experienced hypoglycemia after being switched to Glucovance® (11.1% vs. 4.2%, p=NS), but this difference was not statistically significant. Other complications reported during therapy included 1 case of coronary artery bypass graft and 2 cases of diabetic foot disease in patients during the period of sulfonylurea/metformin co-administration and 2 cases of chest pain and 1 case of diabetic foot disease during the period of taking Glucovance®. We had no major concerns about the overall internal validity of this study and rated it fair.
THIS REPORT HAS BEEN SUPERSEDED
Final Report Drug Effectiveness Review Project
FDCP for diabetes and hyperlipidemia Page 26 of 73
Subgroups. Evidence of how outcomes may differ based on patient characteristics was only provided by one of the retrospective cohort studies that compared Glucovance® versus co-administration of glyburide and metformin and only related to adherence rates.29 For patients previously treated with monotherapy and switched to either Glucovance® or glyburide co-administered with metformin, interaction terms of covariance found to be statistically significant in the analysis of covariance model included age and total daily pill burden. Age <55 years (p=0.001) and total number of tablets per day, excluding target drugs, (p=0.024) were both found to be statistically significant predictors of adherence. No patient characteristics were reported to interact with adherence rates in newly treated patients or in the cohort of patients previously treated with monotherapy and switched to either Glucovance® or co-administration of glyburide and metformin.
3. Longer-term safety profile of Glucovance® Evidence regarding the longer-term safety profile of Glucovance® could only be found in
1 open-label, noncomparative study that followed patients for 52 weeks.49 This study included 828 adults with type 2 diabetes. These patients were those that had previously completed or had discontinued participation in a 32-week double-blind study (glyburide co-administered with metformin versus monotherapy with either component),27 and those who were enrolled directly into the open-label study. Study subjects were 57% male, they had a mean age of 55.7 years, 78.7% were white, 7.6% were black, 10.4% were Hispanic, and 3.3% were of other races. As for mean baseline prognostic factors, BMI was 30 kg/m2, HbA1c was 8.74%, and duration of type 2 diabetes was 3.25 years. Information about major events was limited to deaths and lactic acidosis. After 52 weeks, no cases of lactic acidosis were reported and deaths were rare (0.5%). Causes of death included plane crash, myocardial infarction, and cancer, and none were rated as being related to Glucovance® therapy. This study was fair to poor in quality.
B. Metaglip® We found 2 randomized controlled trials that evaluated the efficacy and safety of Metaglip® (glipizide/metformin) compared to monotherapy with either glipizide or metformin in a total of 1,115 patients with type 2 diabetes (Evidence Tables 1 and 2).31, 32 One trial that evaluated Metaglip® as first-line therapy (study #138-50) has not yet been published, but extensive details are available within the Center for Drug Evaluation and Research Medical Review.32 The other trials evaluated Metaglip® compared to glipizide or metformin monotherapy when used as second-line therapy in patients who had previously failed a trial of monotherapy of at least half the maximum labeled dose of a sulfonylurea.31 Criteria used for diagnosis of Type 2 diabetes was not reported in either trials.
Methods. In these trials patients were initially enrolled into 2-week, single-blind run-in periods of either placebo in the first-line therapy trial or glipizide 30mg in the second-line therapy trial. In the first-line therapy trial, 5.5% of patients were excluded from randomization due to noncompliance in the run-in period. In the second-line therapy trial, 17% of patients were excluded prior to randomization because they did not meet criteria following the glipizide run-in period. Subsequently, the remaining patients were randomized to Metaglip®, glipizide 30mg, or metformin 500mg and were followed for 18-24 weeks. Metaglip® starting dosages ranged from
THIS REPORT HAS BEEN SUPERSEDED
Final Report Drug Effectiveness Review Project
FDCP for diabetes and hyperlipidemia Page 27 of 73
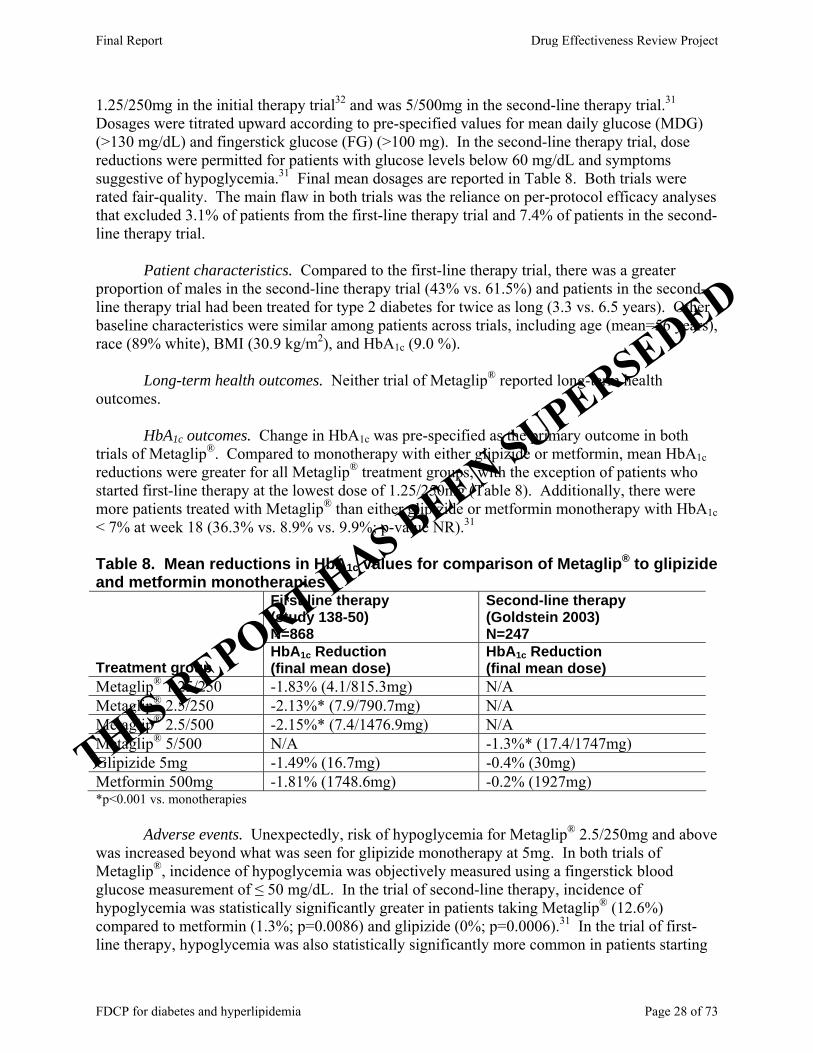
1.25/250mg in the initial therapy trial32 and was 5/500mg in the second-line therapy trial.31 Dosages were titrated upward according to pre-specified values for mean daily glucose (MDG) (>130 mg/dL) and fingerstick glucose (FG) (>100 mg). In the second-line therapy trial, dose reductions were permitted for patients with glucose levels below 60 mg/dL and symptoms suggestive of hypoglycemia.31 Final mean dosages are reported in Table 8. Both trials were rated fair-quality. The main flaw in both trials was the reliance on per-protocol efficacy analyses that excluded 3.1% of patients from the first-line therapy trial and 7.4% of patients in the second-line therapy trial.
Patient characteristics. Compared to the first-line therapy trial, there was a greater
proportion of males in the second-line therapy trial (43% vs. 61.5%) and patients in the second-line therapy trial had been treated for type 2 diabetes for twice as long (3.3 vs. 6.5 years). Other baseline characteristics were similar among patients across trials, including age (mean=56 years), race (89% white), BMI (30.9 kg/m2), and HbA1c (9.0 %).
Long-term health outcomes. Neither trial of Metaglip® reported long-term health
outcomes. HbA1c outcomes. Change in HbA1c was pre-specified as the primary outcome in both
trials of Metaglip®. Compared to monotherapy with either glipizide or metformin, mean HbA1c reductions were greater for all Metaglip® treatment groups, with the exception of patients who started first-line therapy at the lowest dose of 1.25/250mg (Table 8). Additionally, there were more patients treated with Metaglip® than either glipizide or metformin monotherapy with HbA1c < 7% at week 18 (36.3% vs. 8.9% vs. 9.9%; p-value NR).31
Table 8. Mean reductions in HbA1c values for comparison of Metaglip® to glipizide and metformin monotherapies
First-line therapy (study 138-50) N=868
Second-line therapy (Goldstein 2003) N=247
Treatment group HbA1c Reduction (final mean dose)
HbA1c Reduction (final mean dose)
Metaglip® 1.25/250 -1.83% (4.1/815.3mg) N/A Metaglip® 2.5/250 -2.13%* (7.9/790.7mg) N/A Metaglip® 2.5/500 -2.15%* (7.4/1476.9mg) N/A Metaglip® 5/500 N/A -1.3%* (17.4/1747mg) Glipizide 5mg -1.49% (16.7mg) -0.4% (30mg) Metformin 500mg -1.81% (1748.6mg) -0.2% (1927mg) *p<0.001 vs. monotherapies Adverse events. Unexpectedly, risk of hypoglycemia for Metaglip® 2.5/250mg and above was increased beyond what was seen for glipizide monotherapy at 5mg. In both trials of Metaglip®, incidence of hypoglycemia was objectively measured using a fingerstick blood glucose measurement of ≤ 50 mg/dL. In the trial of second-line therapy, incidence of hypoglycemia was statistically significantly greater in patients taking Metaglip® (12.6%) compared to metformin (1.3%; p=0.0086) and glipizide (0%; p=0.0006).31 In the trial of first-line therapy, hypoglycemia was also statistically significantly more common in patients starting
THIS REPORT HAS BEEN SUPERSEDED
Final Report Drug Effectiveness Review Project
FDCP for diabetes and hyperlipidemia Page 28 of 73
Metaglip® at 2.5/250mg (8%; p<0.05) or 2.5/500mg (9%; p<0.0001) than in those on glipizide (3%) or metformin (0%) monotherapy.32
Higher rates of withdrawal due to adverse events were seen in patients randomized to second-line therapy with the highest dosage of Metaglip® (mean final dose of 17.5/1747mg) compared to rates for patients taking either glipizide or metformin monotherapy (12.6% vs. 3.6% vs. 5.3%).31 The differences in adverse event withdrawal rates reached statistical significance only for the comparison between second-line therapy with Metaglip® versus glipizide (p=0.0337). Rates of withdrawal due to adverse events were comparable for all treatment groups in the first-line therapy trial, regardless of Metaglip® dosage (range 3.4% to 6.4%).32 Rates of all-cause adverse events were similar among patients randomized to second-line therapy with Metaglip® (63.2%) or monotherapy with either glipizide (67.9%) or metformin (73.3%), but were not reported in the CDER Medical Review for patients in the first-line therapy trial.
Among patients using Metaglip® as first- or second-line therapy, gastrointestinal, respiratory, and nervous system types of adverse events were reported at the highest frequencies (range 10.3% to 18.4%). There was a trend toward higher rates of headache for patients using Metaglip® as second-line therapy (12.6%) compared to those using glipizide (6%) or metformin (5%),31 but otherwise adverse events rates for Metaglip® were comparable to or lower than in the monotherapy treatment groups. There was only one death reported among Metaglip® trial participants. After 85 days of using Metaglip® as first-line therapy, this patient was diagnosed with acute myelogenous leukemia and later died of pulmonary hemorrhage.32 Serious adverse events were described as few, and none were determined to be treatment-related.
Subgroups. Subgroup analyses of reductions in HbA1c based on differences in baseline
patient characteristics were only available from the first-line therapy trial.32 In patients taking Metaglip®, there were no statistically significant differences in HbA1c reductions based on age, gender, or race. Subgroup analyses did not appear to explore differences in patient outcomes based on variations in the complexity of the overall drug regimen or based on comorbidities. C. Avandamet® We found only 2 studies of Avandamet®.33, 34 One randomized controlled trial compared Avandamet® to monotherapy with either rosiglitazone or metformin when used as first-line therapy in patients with type 2 diabetes that was inadequately controlled with diet and exercise alone (Evidence Tables 1 and 2).33 The other study by Vanderpoel was a retrospective database analysis that assessed change in medication adherence rates in patients who were switched to Avandamet® after previous treatment with either monotherapy or co-administration with metformin and/or rosiglitazone (Evidence Tables 3 and 4).34 Neither study reported the long-term health outcomes among enrolled patients taking Avandamet®, nor did they evaluate the glucose control properties or adverse event profile of Avandamet® when used as second-line therapy.
1. Avandamet® compared to monotherapy with either rosiglitazone or metformin
First-line therapy with Avandamet® was compared to monotherapy with either rosiglitazone or metformin in a fair-quality, 32-week trial of 468 patients with uncontrolled type 2 diabetes.33 Criteria used for diagnosis of Type 2 diabetes was not reported. Patients were
THIS REPORT HAS BEEN SUPERSEDED
Final Report Drug Effectiveness Review Project
FDCP for diabetes and hyperlipidemia Page 29 of 73

randomized to double-blinded treatment if both their HbA1c was greater than 7.5%, but less than or equal to 11%, and their FPG was 15 mmol/l or below after a 2-week screening period of diet and exercise alone. Medication dosages were started at 2/500mg for Avandamet®, 4mg for rosiglitazone, or 500mg for metformin and were increased based on a mean daily glucose target of 6.1 mmol/l or below. Final mean dosages were 7.2/1799mg for Avandamet®, 7.7mg with rosiglitazone, and 1847mg for metformin. Methods of randomization and allocation concealment were not described, but resulted in treatment groups that were well-balanced with regard to important baseline patient characteristics that may influence outcome. Eleven patients (2.3%) with no valid on-therapy assessment data were excluded from the primary efficacy analysis, but these level of exclusions were not judged to pose a serious threat to study results.
The study population had a mean age of 51 years and 57% of patients were male. The study population was somewhat racially diverse. 57% of patients were white, 22% latino, 13% asian, 5% black, and 3% other. As for prognostic factors, mean BMI was 32.8 kg/m2, mean duration of type 2 diabetes in years was 2.6 years, and mean baseline HbA1c was 8.8%.
Overall, efficacy findings from this trial favored Avandamet® over monotherapy with either rosiglitazone or metformin when used as first-line therapy in adults with uncontrolled type 2 diabetes. On the primary outcome of change in HbA1c, reductions were statistically significantly greater for patients taking Avandamet® (-2.3%) compared to reductions in patients taking monotherapy with rosiglitazone (-1.6%; p<0.0001) or metformin (-1.8%; p=0.0008). Additionally, more patients taking Avandamet® (77%) reached HbA1c levels of less than 7% as compared to 58.1% of patients taking rosiglitazone (p<0.0001) and 57.3% taking metformin (p<0.001).
Regarding safety, no deaths or congestive heart failure were reported in this trial and rates of serious adverse events were 3% in each treatment group. Adverse event type was specified for only 2 of the 14 patients with serious adverse events and both were cardiovascular in nature. There was a case of angina pectoris in a patient taking metformin monotherapy and another patient had a myocardial infarction (MI) while taking rosiglitazone. Regardless, no serious adverse events were considered related to study medication and none resulted in withdrawal from treatment. Overall, incidence of ischemic heart disease (including the angina and MI) was somewhat rare for Avandamet®, rosiglitazone, and metformin (0.6% vs. 1.2% vs. 1.3%), as was hypoglycemia (capillary blood glucose ≤ 2.78 mmol/l) (0.6% vs. 0% vs. 1.3%).
Avandamet® was not associated with any unexpected adverse effects compared to its monotherapy components. There were no significant increases in gastrointestinal adverse effects for Avandamet® compared to metformin monotherapy and no significant increases in edema or weight gain for Avandamet®. Rates of withdrawal due to adverse events were similar for Avandamet®, metformin, and rosiglitazone (1% vs. 2% vs. 3%).
No subgroup analyses of efficacy or safety outcomes based on differences in patient demographics, overall pill burden, or comorbidities were reported.
2. Avandamet® compared to co-administration of rosiglitazone and metformin
(Key Questions 4, 5, and 6b) The only evidence we found regarding the comparison between Avandamet® and co-
administration of rosiglitazone and metformin comes from a retrospective database study that focused on medication adherence (Key Question 5).34 We found no studies that compared Avandamet® to co-administration of rosiglitazone and metformin based on long-term outcomes (Key Question 4) or safety (Key Question 6b).
THIS REPORT HAS BEEN SUPERSEDED
Final Report Drug Effectiveness Review Project
FDCP for diabetes and hyperlipidemia Page 30 of 73

Changes in medication adherence rates associated with switching from rosiglitazone/metformin co-administration to Avandamet® were assessed based on refill data from a pharmacy claims database of a large health benefits company encompassing ~3.5 million covered members. The final study population consisted of 1,357 patients identified as having at least one pharmacy claim for Avandamet® or rosiglitazone/metformin co-administration during the 10 months between 11/1/2002 and 8/31/2003 and at least 2 additional prescription claims in each of the prior and subsequent 6-month periods. The “Dual/Dual” cohort consisted of the 1,230 patients that maintained rosiglitazone/metformin co-administration therapy throughout the entire study period and the “Dual/Fixed-Dose Combination Product (FDCP)” cohort consisted of the 127 patients that switched from rosiglitazone/metformin co-administration to Avandamet®. In this study, adherence was measured based on Medication Possession Ratio (MPR) calculations. MPR scores ranged from 0% to 100%, with higher values indicating higher adherence, and was calculated based on the following formula: (total days' supply obtained)/(date of last claim - date of first claim + days' supply of last claim).
We rated this study fair quality. The primary concern is the validity of calculating medication adherence based on prescription refill data. The main limitation of any refill-based adherence calculation method is the potential for inaccuracy in reflecting whether the medication was actually ingested by the patient. These types of methods are based on assumptions and don’t take into account that patients could have had other medication sources. The exclusion of patients who did not maintain continuous plan enrollment likely reduced the risk that patients had other medication sources, but could not eliminate it entirely. Another concern related to the systematic exclusion of patients with lapses in therapy > 60 days. It seems plausible that patients with lapses in therapy of > 60 days could have represented extreme cases of nonadherence and exclusion of their data could have skewed results in the direction of higher compliance. Finally, it was noted that there were more male patients in the dual/dual group compared to the dual/FDCP group (59.4% vs. 49.6%; p,0.034) and the mean age in the dual/dual group was also higher (56 vs. 53.69 years; p<0.02). It was clear that these factors were adjusted for, but this may not have fully accounted for any other associated between-groups differences. Very little information about patients’ diabetic status was provided. Overall mean total pill burden was 4.7 and 83% of all patients were using insulin with additional oral antidiabetics.
The primary outcome was change in MPR and between-group differences were analyzed using analysis of covariance methods that adjusted for a number of demographic and disease-related factors. Results of this analysis suggest that switching from rosiglitazone/metformin co-administration was associated with an increase in adherence (MPR change +3.5%), whereas adherence rates for patients in ongoing treatment with rosiglitazone/metformin co-administration actually dropped by -1.3%. After adjustment for all covariates, results suggest that the difference between mean change in adherence rates was statistically significant (4.8%; 95% CI 1.0%-8.6%). However, although statistically significant, no clinical events outcomes were reported, so it is not clear if a 4.8% increase in MPR has a clinically important impact. No information was provided about whether changes in MPR were affected by variations in total pill burden.
D. Avandaryl®
Evidence for Avandaryl® comes from one, 28-week randomized controlled trial specifically of drug-naïve patients with type 2 diabetes involving comparison to monotherapy with either glimepiride or rosiglitazone (Evidence Tables 1 and 2).35 To our knowledge, there
THIS REPORT HAS BEEN SUPERSEDED
Final Report Drug Effectiveness Review Project
FDCP for diabetes and hyperlipidemia Page 31 of 73
have been no trials of Avandaryl® in its actual combination tablet form used as second-line therapy and any efficacy and safety information about such use of this product is based on results from trials of glimepiride co-administered with rosiglitazone. We also know of no trials that compared Avandaryl® to glimepiride/rosiglitazone co-administration.
Patients were randomized to double-blinded treatment if they had a diagnosis of type 2 diabetes50 and an HbA1c of 7.5% to 12% after a 2-week screening period of diet and exercise alone (n=901). Medication was titrated based on a mean daily glucose target of below 110 mg/dL and final mean dosages were 4.0/3.2mg for Avandaryl® Regimen A, 6.8/2.9mg for Avandaryl® Regimen B, 3.5mg for glimepiride monotherapy, and 7.5mg for rosiglitazone monotherapy.
We rated this trial fair quality. Methods of randomization and allocation concealment were not described, but resulted in treatment groups that were well-balanced with regard to important baseline patient characteristics that may influence outcome. Up to 3% of the original 901 patients were excluded from efficacy analyses and 0.8% from safety analyses for unknown reasons. These levels of exclusions were not judged to pose any serious threats to study results.
Patients in this trial were 59% male, had a mean age of 54 years, and were 77% white. As for baseline prognostic factors, patients had a mean BMI of 32 kg/m2, HbA1c of 8.97% to 9.15%, FPG of 206.9 mg/dL to 214.1 mg/dL, and had been diagnosed with type 2 diabetes for a mean duration of 3 years.
Overall, efficacy findings from this trial favored Avandaryl® over monotherapy with either glimepiride or rosiglitazone when used as first-line therapy in drug-naïve adults with type 2 diabetes. On the primary outcome of change in HbA1c, reductions were statistically significantly greater for patients taking Avandaryl® Regimen A (-2.41%) or Regimen B (-2.52%) compared to reductions in patients taking monotherapy with either glimepiride (-1.72; p<0.0001) or rosiglitazone (-1.75%; p<0.0001). Also, statistically significantly more patients taking Avandaryl® Regimen A (74.7%) or Regimen B (72.4%) reached HbA1c levels of less than 7% as compared to 49.1% of patients taking glimepiride (p<0.0001) or 46.2% of patients taking rosiglitazone (p<0.0001). Proportions of patients reaching the American Association of Clinical Endocrinologists (AACE) goal of ≤ 6.5% were also reported and again Avandaryl® Regimen A (56.1%) and Regimen B (53.8%) were associated with higher rates than glimepiride (32.1%; p<0.0001) or rosiglitazone monotherapy (30.7%; p<0.0001).
Regarding adverse effects, there was only one occasion where Avandaryl® differed significantly from the known adverse effect profiles of its monotherapy components. Statistically significantly more patients gained weight taking either Regimen A (3.1%; p=0.03) or Regimen B (3.2%; p=0.03) of Avandaryl® when compared to rosiglitazone monotherapy (0.4%). The clinical significance of this finding is unclear, however, as weight gain criteria were not reported and resulted in treatment withdrawal for only 1 patient in the Avandaryl® Regimen A group. There were no significant differences between either regimen of Avandaryl® and rosiglitazone monotherapy for rates of edema or cardiac-ischemic events. One patient in each of the rosiglitazone monotherapy and Avandaryl® groups experienced congestive heart failure, but these events were considered unrelated to study medication. Incidence of confirmed hypoglycemia (<50 mg/dL) did not differ significantly between either Regimen A (3.6%) or Regimen B (5.5%) of Avandaryl® and glimepiride monotherapy (4.1%).
No subgroup analyses of efficacy or safety outcomes based on differences in patient demographics, overall pill burden, or comorbidities were reported.
THIS REPORT HAS BEEN SUPERSEDED
Final Report Drug Effectiveness Review Project
FDCP for diabetes and hyperlipidemia Page 32 of 73

Section II. Detailed assessment for evidence on correlations between outcomes in patients with type 2 diabetes and medication adherence in general (Key Questions 7 and 8)
Evidence on the association between medication adherence and health outcomes or hospitalizations (Key Question 7) were provided by 3 nonrandomized studies,43, 46 and another 6 nonrandomized studies analyzed the association between medication adherence and HbA1c control (Key Question 8) (Evidence Tables 3 and 4).39-42, 44, 45 A. Associations between medication adherence and health outcomes/hospitalizations
Hospitalizations. Decreased antidiabetic medication adherence was not consistently found to be a statistically significant predictor of increased risk of hospitalizations across two fair quality retrospective studies that used administrative claims data from patients with type 2 diabetes enrolled in different health care organizations in the U.S.43, 46 In both studies, medication adherence was quantified by using prescription refill data to calculate a MPR (total days' supply obtained)/(date of last claim - date of first claim + days' supply of last claim). Again, although commonly used as a measure of adherence, it is important to keep in mind that the MPR is only an indication of prescriptions filled and may not always be reflective of actual medication ingestion. In both studies, associations between medication adherence and hospitalizations were examined using regression analyses adjusted for various demographic, clinical, and overall health-status related factors. Additionally, one study considered the impact of overall antidiabetic medication pill burden as well as patterns of adherence to common concomitant medication therapies for hypertension and dyslipidemia.41
The first study sample consisted of 775 older adults with type 2 diabetes. The mean age was 74.23 years and 58% were female.46 Adequacy of patient selection methods was uncertain as eligibility criteria were not prespecified and it was unclear whether all potentially eligible plan members were included in the final study sample. The intention was to collect up to 5 years of prescription refill data for these patients, but the actual mean duration of the observation period was unclear. In this study, ‘hospitalization during previous year’ was associated with a non- statistically significant 0.0074-point decrease in MPR scores, whereas the -0.043-point decrease in MPR scores associated with ‘ER visit during previous year’ was found to be statistically significant (p<0.05). It was noted that 14% of patients were excluded from these regression analyses due to incomplete data, but that a comparison of non missing variables found no differences between included and excluded patients. There remains a risk that the missing data could have biased these results as it is conceivable that the data was missing due to problems with medication adherence or overall health status.
The second study sample consisted of 900 patients with type 2 diabetes.41 The overall mean age was 52 years and 55.2% of patients were male. Pre-specification of eligibility criteria was not described and it was unclear whether there were any potentially eligible healthcare plan enrollees that were selectively excluded from the final sample of 900 patients. Measurement of hospitalization was prespecified as being based on codes from the International Classification of Diseases, Ninth Revision, Clinical Modification (ICD-9-CM). Patients’ adherence levels were classified based on an empirically-supported MPR cut-off of 80%, with an MPR above 80% as “adherent” and an MPR below 80% as “nonadherent”. Medication adherence was assessed based on data across at least two refills in the year 2000 and hospitalizations were measured based on medical claims files from 2001, but there was no information about actual mean
THIS REPORT HAS BEEN SUPERSEDED
Final Report Drug Effectiveness Review Project
FDCP for diabetes and hyperlipidemia Page 33 of 73
observation duration. Therefore, there are concerns about whether the observation periods were sufficient in duration to fully assess the association between adherence and hospitalizations. After adjustment for numerous prespecified covariates, results of this study found that odds of hospitalization in 2001 were statistically significantly greater for “nonadherent” enrollees compared to “adherent” enrollees (OR 2.53; 95% CI 1.38-4.64). Medication regimen (multiple therapies versus single therapies) was not reported as being a significant covariate in the regression model.
Health outcomes. The impact of medication adherence on health outcomes was evaluated as part of the nonrandomized, prospective Medical Outcomes Study (MOS).43, 51 The sampling frame for this study was based on patients that enrolled in the cross-sectional component of the MOS in 1986 (n=20,223). Among these, patients with chronic medical conditions were contacted by telephone and invited to enroll in a longitudinal component. The final sample used in the analyses described herein (n=2,215) were limited to English-speakers who agreed enrolled in the longitudinal component of the MOS in the fall of 1986 and who agreed to complete a screening questionnaire and the self-administered Patient Assessment Questionnaire. Given the selective nature of sample, it is unclear how generalizable findings from this study are to the type 2 diabetes population as a whole. We had major concerns about the validity of the methods used to measure adherence and health outcomes. First, adherence was based on patient self-report as to the extent to which they had followed each of several treatment recommendations, including medication usage, over the past 4 weeks, with response options ranging from “none of the time” to “all of the time.” It was unclear as to whether the patients were aware of the study objective of associating adherence with health outcomes and how this might have biased their responses. Next, health outcomes were evaluated over a 2-year period based not on event data (e.g., rates of death), but on patient responses to the RAND 36-Item Health Survey 1.0 (SF-36), which includes measures of physical function, role limitations due to physical or emotional health problems, social functioning, pain, energy/fatigue, emotional well-being, and general health perceptions. Ultimately, we also question the reliability of assuming the presence of a temporal relationship between 4-week adherence data collected within 3-4 months of study enrollment and health status measured 2 years later. In terms of statistical methods, a multiple regression approach was used to measure the associations between adherence and health outcomes, with adjustment for primarily demographic factors. Descriptive information about the study sample was limited to the overall sample of 2125 patients with any number of chronic illnesses, including type 2 diabetes. It is unclear what proportion of patients were type 2 diabetics and no information about baseline characteristics were provided for this subgroup. For the group overall, mean age was 56 years, 59% were female, 20% were nonwhite, and 84% were high school graduates. The only finding reported that was related to medication adherence was, unexpectedly, that increased adherence to antidiabetic medication recommendations was associated with negative effects on physical health for insulin-using diabetics (t=-2.47, p<0.05). B. Associations between medication adherence and HbA1c control
The only evidence pertaining to the association between antidiabetic medication adherence and HbA1c control comes from 6 nonrandomized studies with conflicting results
THIS REPORT HAS BEEN SUPERSEDED
Final Report Drug Effectiveness Review Project
FDCP for diabetes and hyperlipidemia Page 34 of 73

(Evidence Tables 3 and 4).30, 39, 40, 42, 44, 45 Notably, this body of evidence was characterized by extreme heterogeneity in patient population characteristics, methods used to quantify medication adherence, duration of observation periods, and statistical analysis methods. Although the majority of studies reported positive associations between improved medication adherence and improved HbA1c control, serious concerns about the internal validity of these studies limit the strength of their findings.39, 40, 42, 45 Taken as a whole, findings from these studies were difficult to interpret. The main insight provided by this body of evidence is that further research is needed in this area with an emphasis on use of improved methodologies.
There was remarkable variation across these studies in all aspects of research design. Half were prospectively designed and relied on pill count data42 or patient self-report42, 44 to quantify medication adherence. The remaining studies were retrospective and relied on refill and laboratory data from administrative databases.30, 42, 44 Only two studies were rated fair quality30,
40 and the rest were rated poor quality.39, 42, 44, 45 The most common flaw among all but one of the poor quality studies was the failure to specify temporal criteria for HbA1c testing dates in relation to medication therapy dates.39, 44, 45 For example, in one study, results from a single HbA1c test that were obtained anytime in the previous year were analyzed based on one weeks’ worth of patient-reported adherence, regardless of their relation in time.44 In contrast, in a fair quality study, patients were required to have a baseline HbA1c within 30 days prior or 14 days subsequent to the medication index date and were also required to have a follow-up HbA1c within 76-194 days subsequent of initiating antidiabetic medication.30
The main flaw of the remaining poor quality study was related to missing data.42 Among the 384 enrolled patients, 83 (21.6%) were excluded from all analyses due to an invalid HbA1c test or other unspecified “inconsistencies with the study protocol”. It was unclear what proportion of the exclusions were due to invalid HbA1c tests or whether these irregularities occurred at random or due to systematic factors potentially related to adherence or glucose control. Bias due to these exclusions was therefore a serious concern.
Even among studies using similar sources of data, there was variation in methods of quantifying adherence. Methods used among studies that relied on prescription refill data included calculation of adherence based on the total days’ supply of medication divided by the number of days in the study period30, 39 and a categorical definition of adherence based on whether or not patients who purchased antidiabetic medication in the previous year switched to non-use between January and March.30, 39 Methods of quantifying adherence among studies using patient self-report included use of the Morisky Medication Adherence Scale to rate the number of “no” answers on each of 4 questions of nonadherence (e.g., “Do you ever forget to take your medication?”)42 or use of patient responses to two questions for determination of whether patients took all of their study medications on each of all days in the previous week (“perfect adherence” versus “less than perfect adherence”).44
Patient characteristics varied widely across studies, and ranged from patients from a low-income population in central Virginia,39 to patients from large healthcare management programs in the U.S. that were new to antidiabetic treatment,30, 45 to 1249 patients from a village located in Valencia, Spain (Rafecoler).40 Other populations included patients from six US-based practice sites participating in the Diabetes Goals Project42 and patients from a community health center based out of Massachusetts General Hospital.44
Formal meta-analyses were not possible due to heterogeneity in methods of outcome assessment, but we subjectively considered whether differences between studies as to whether or not they found a statistically significant association between adherence and HbA1c control could
THIS REPORT HAS BEEN SUPERSEDED
Final Report Drug Effectiveness Review Project
FDCP for diabetes and hyperlipidemia Page 35 of 73
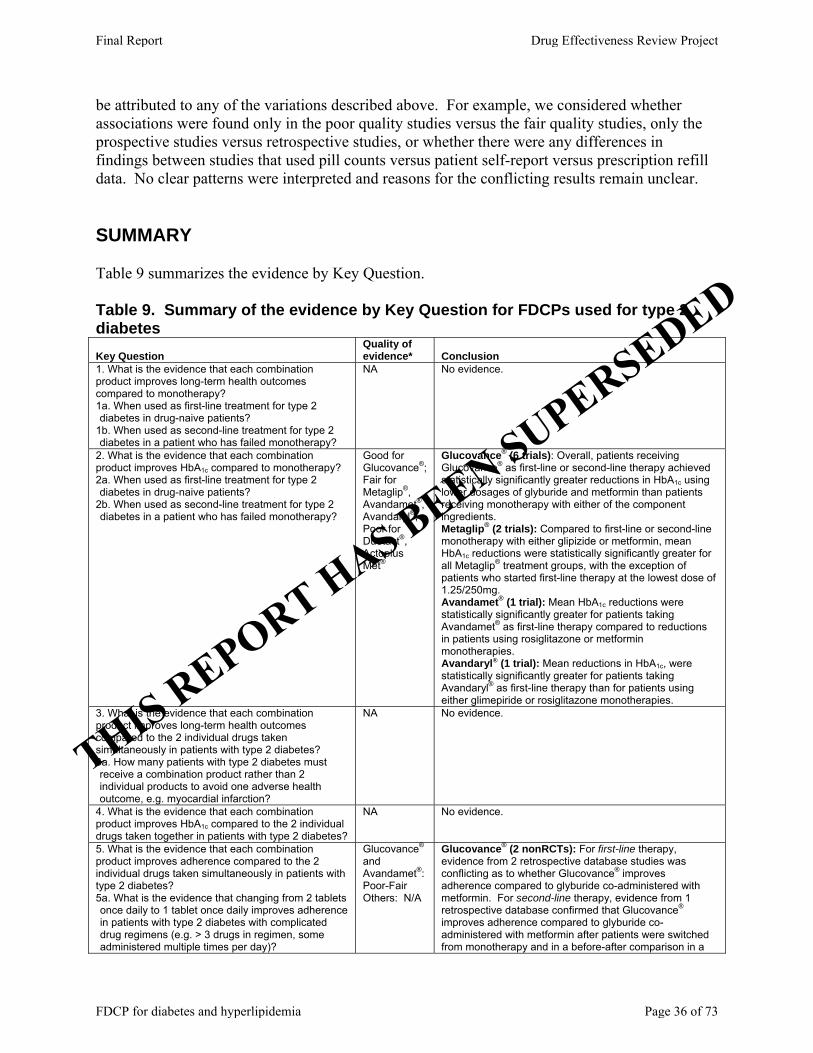
be attributed to any of the variations described above. For example, we considered whether associations were found only in the poor quality studies versus the fair quality studies, only the prospective studies versus retrospective studies, or whether there were any differences in findings between studies that used pill counts versus patient self-report versus prescription refill data. No clear patterns were interpreted and reasons for the conflicting results remain unclear. SUMMARY Table 9 summarizes the evidence by Key Question. Table 9. Summary of the evidence by Key Question for FDCPs used for type 2 diabetes Key Question
Quality of evidence* Conclusion
1. What is the evidence that each combination product improves long-term health outcomes compared to monotherapy? 1a. When used as first-line treatment for type 2
iabetes in drug-naive patients? d
d1b. When used as second-line treatment for type 2
iabetes in a patient who has failed monotherapy?
NA No evidence.
2. What is the evidence that each combination product improves HbA1c compared to monotherapy? 2a. When used as first-line treatment for type 2
iabetes in drug-naive patients? d
di2b. When used as second-line treatment for type 2
abetes in a patient who has failed monotherapy?
Good for Glucovance®; Fair for Metaglip®, Avandamet®, Avandaryl®; Poor for Duetact®, Actoplus Met®
Glucovance® (6 trials): Overall, patients receiving Glucovance® as first-line or second-line therapy achieved statistically significantly greater reductions in HbA1c using lower dosages of glyburide and metformin than patients receiving monotherapy with either of the component ingredients. Metaglip® (2 trials): Compared to first-line or second-line monotherapy with either glipizide or metformin, mean HbA1c reductions were statistically significantly greater for all Metaglip® treatment groups, with the exception of patients who started first-line therapy at the lowest dose of 1.25/250mg. Avandamet® (1 trial): Mean HbA1c reductions were statistically significantly greater for patients taking Avandamet® as first-line therapy compared to reductions in patients using rosiglitazone or metformin monotherapies. Avandaryl® (1 trial): Mean reductions in HbA1c, were statistically significantly greater for patients taking Avandaryl® as first-line therapy than for patients using either glimepiride or rosiglitazone monotherapies.
3. What is the evidence that each combination product improves long-term health outcomes compared to the 2 individual drugs taken simultaneously in patients with type 2 diabetes? 3a. How many patients with type 2 diabetes must
ceive a combination product rather than 2 dividual products to avoid one adverse health utcome, e.g. myocardial infarction?
reino
NA No evidence.
4. What is the evidence that each combination product improves HbA1c compared to the 2 individual drugs taken together in patients with type 2 diabetes?
NA No evidence.
5. What is the evidence that each combination product improves adherence compared to the 2 individual drugs taken simultaneously in patients with type 2 diabetes? 5a. What is the evidence that changing from 2 tablets
nce daily to 1 tablet once daily improves ad patients with type 2 diabetes with complicated rug regimens (e.g. > 3 drugs in regimen, some dministered multiple times per day)?
o herence inda
Glucovance® and Avandamet®: Poor-Fair Others: N/A
Glucovance® (2 nonRCTs): For first-line therapy, evidence from 2 retrospective database studies was conflicting as to whether Glucovance® improves adherence compared to glyburide co-administered with metformin. For second-line therapy, evidence from 1 retrospective database confirmed that Glucovance® improves adherence compared to glyburide co-administered with metformin after patients were switched from monotherapy and in a before-after comparison in a
THIS REPORT HAS BEEN SUPERSEDED
Final Report Drug Effectiveness Review Project
FDCP for diabetes and hyperlipidemia Page 36 of 73
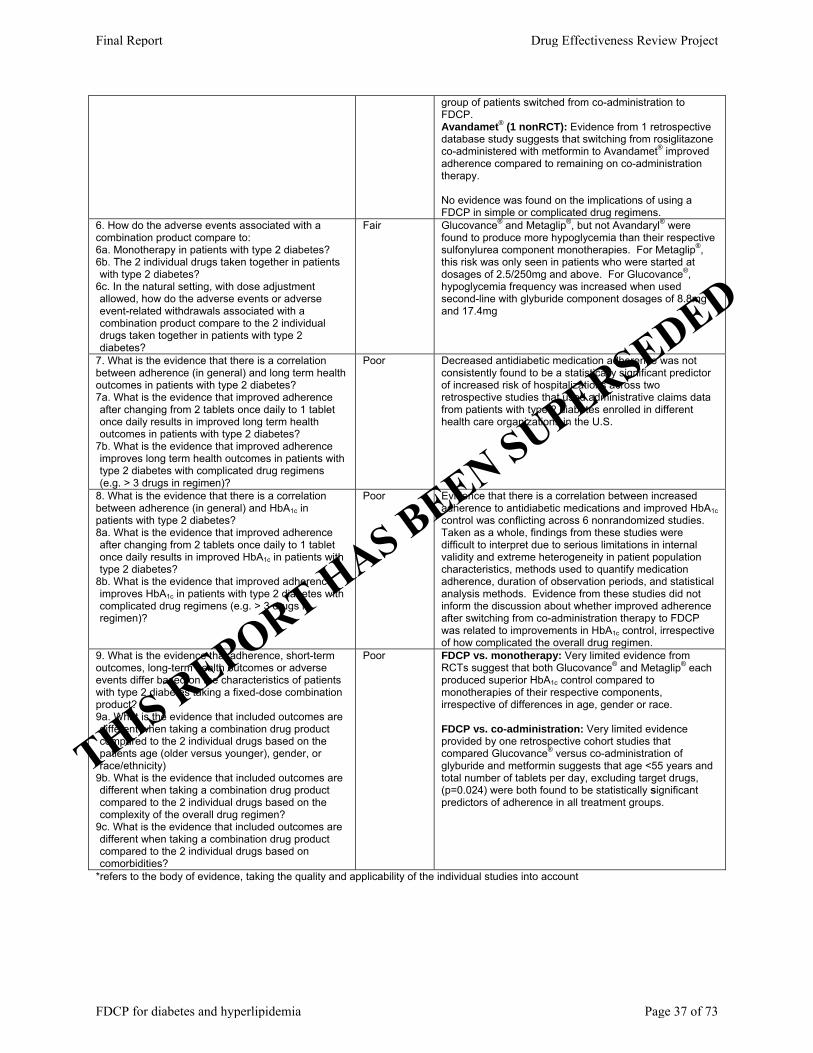
group of patients switched from co-administration to FDCP. Avandamet® (1 nonRCT): Evidence from 1 retrospective database study suggests that switching from rosiglitazone co-administered with metformin to Avandamet® improved adherence compared to remaining on co-administration therapy. No evidence was found on the implications of using a FDCP in simple or complicated drug regimens.
6. How do the adverse events associated with a combination product compare to: 6a. Monotherapy in patients with type 2 diabetes? 6b. The 2 individual drugs taken together in patients
ith type 2 diabetes? w
aecdd
6c. In the natural setting, with dose adjustment llowed, how do the adverse events or adverse vent-related withdrawals associated with a ombination product compare to the 2 individual rugs taken together in patients with type 2 iabetes?
Fair Glucovance® and Metaglip®, but not Avandaryl® were found to produce more hypoglycemia than their respective sulfonylurea component monotherapies. For Metaglip®, this risk was only seen in patients who were started at dosages of 2.5/250mg and above. For Glucovance®, hypoglycemia frequency was increased when used second-line with glyburide component dosages of 8.8mg and 17.4mg
7. What is the evidence that there is a correlation between adherence (in general) and long term health outcomes in patients with type 2 diabetes? 7a. What is the evidence that improved adherence
fter changing from 2 tablets once daily to 1 tablet nce daily results in improved long term health utcomes in patients with type 2 diabetes?
aoo
im h ty s (e
7b. What is the evidence that improved adherence proves long term health outcomes in patients wit
pe 2 diabetes with complicated drug regimen.g. > 3 drugs in regimen)?
Poor Decreased antidiabetic medication adherence was not consistently found to be a statistically significant predictor of increased risk of hospitalizations across two retrospective studies that used administrative claims data from patients with type 2 diabetes enrolled in different health care organizations in the U.S.
8. What is the evidence that there is a correlation between adherence (in general) and HbA1c in patients with type 2 diabetes? 8a. What is the evidence that improved adherence
fter changing from 2 tablets once daily to 1 tablet nce daily results in improved HbA1c in patients witpe 2 diabetes?
ao h ty
im h cre
8b. What is the evidence that improved adherence proves HbA1c in patients with type 2 diabetes wit
omplicated drug regimens (e.g. > 3 drugs in gimen)?
Poor Evidence that there is a correlation between increased adherence to antidiabetic medications and improved HbA1c control was conflicting across 6 nonrandomized studies. Taken as a whole, findings from these studies were difficult to interpret due to serious limitations in internal validity and extreme heterogeneity in patient population characteristics, methods used to quantify medication adherence, duration of observation periods, and statistical analysis methods. Evidence from these studies did not inform the discussion about whether improved adherence after switching from co-administration therapy to FDCP was related to improvements in HbA1c control, irrespective of how complicated the overall drug regimen.
9. What is the evidence that adherence, short-term outcomes, long-term health outcomes or adverse events differ based on the characteristics of patients with type 2 diabetes taking a fixed-dose combination product? 9a. What is the evidence that included outcomes are
ifferent when taking a combination drug product ompared to the 2 individual drugs based on the atients age (older versus younger), gender, or ce/ethnicity)
dcpra
dcc
dcc
9b. What is the evidence that included outcomes are ifferent when taking a combination drug product ompared to the 2 individual drugs based on the omplexity of the overall drug regimen?
9c. What is the evidence that included outcomes are ifferent when taking a combination drug product ompared to the 2 individual drugs based on omorbidities?
Poor FDCP vs. monotherapy: Very limited evidence from RCTs suggest that both Glucovance® and Metaglip® each produced superior HbA1c control compared to monotherapies of their respective components, irrespective of differences in age, gender or race. FDCP vs. co-administration: Very limited evidence provided by one retrospective cohort studies that compared Glucovance® versus co-administration of glyburide and metformin suggests that age <55 years and total number of tablets per day, excluding target drugs, (p=0.024) were both found to be statistically significant predictors of adherence in all treatment groups.
*refers to the body of evidence, taking the quality and applicability of the individual studies into account
THIS REPORT HAS BEEN SUPERSEDED
Final Report Drug Effectiveness Review Project
FDCP for diabetes and hyperlipidemia Page 37 of 73

PART III. Fixed Dose Combination Drug Products for the Treatment of Hyperlipidemia Scope
For treatment of hyperlipidemia, 2 FDCPs are available, Vytorin® and Advicor®. Advicor® is a combination of an HMG-CoA Reductase Inhibitor (statin) – lovastatin with an extended release formulation of niacin, while Vytorin® is a combination of another statin, simvastatin, and a newer drug ezetimibe. All of the individual products are available separately and can be administered once daily. The FDCPs have multiple strengths available, although the dose of ezetimibe is constant at 10mg in Vytorin®. The evidence for each product as it relates to efficacy, effectiveness, adverse events, and adherence compared to monotherapy or co-administration therapy and evidence in subgroups is reviewed separately. Evidence on the link between adherence and health outcomes in patients with hyperlipidemia is considered together. Evidence Tables of study data and quality assessments are available as addendum to this report.
RESULTS
Overview Our searches identified 347 citations: 284 from Medline, 13 from Cochrane Library, 24 from dossiers submitted by the manufacturer of Vytorin®, 20 from public comment, 4 from the FDA which included product labels and medical and statistical reviews of drugs, and 2 from peer review comment (Figure 4). Of these, we included 22 studies (4 studies pending review, see appendix E for details): 8 RCTs (reported in 10 publications), 3 systematic reviews, and 8 non RCTs, 1 dossier from the manufacturer of Vytorin®. All of the trials were comparing a combination product to monotherapy. No evidence was found for either product compared to taking the 2 component drugs simultaneously. Two observational studies evaluated the impact of adherence, while the others were open-label, single arm studies reporting adverse event or short-term efficacy data. All of the trials used a run-in period to ensure that patients a) complied with the required diet and b) met serum lipid criteria. Because many patients were excluded at this stage, it is not clear if the trials represent the typical patient population in primary care. All studies included were funded by the manufacturers of Vytorin® or Advicor®.
THIS REPORT HAS BEEN SUPERSEDED
Final Report Drug Effectiveness Review Project
FDCP for diabetes and hyperlipidemia Page 38 of 73
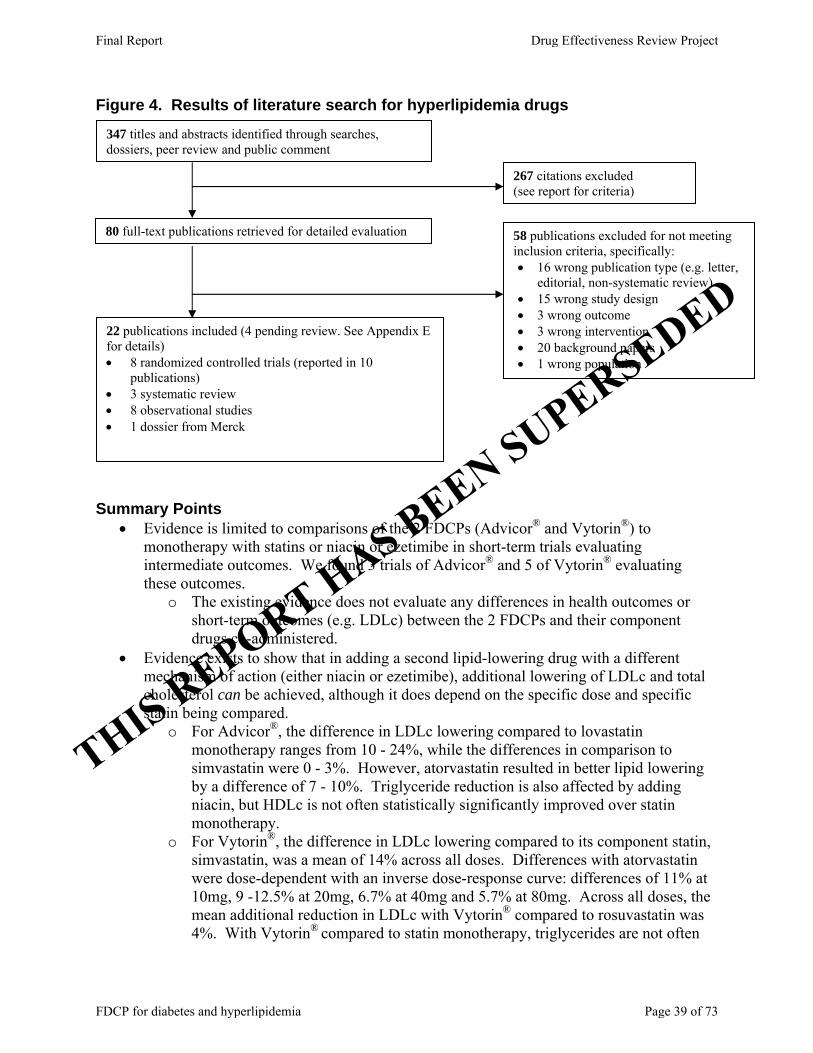
Figure 4. Results of literature search for hyperlipidemia drugs
80 full-text publications retrieved for detailed evaluation
267 citations excluded (see report for criteria)
347 titles and abstracts identified through searches, dossiers, peer review and public comment
22 publications included (4 pending review. See Appendix E for details) • 8 randomized controlled trials (reported in 10
publications) • 3 systematic review • 8 observational studies • 1 dossier from Merck
58 publications excluded for not meeting inclusion criteria, specifically: • 16 wrong publication type (e.g. letter,
editorial, non-systematic review) • 15 wrong study design • 3 wrong outcome • 3 wrong intervention • 20 background papers • 1 wrong population
Summary Points
• Evidence is limited to comparisons of the 2 FDCPs (Advicor® and Vytorin®) to monotherapy with statins or niacin or ezetimibe in short-term trials evaluating intermediate outcomes. We found 3 trials of Advicor® and 5 of Vytorin® evaluating these outcomes.
o The existing evidence does not evaluate any differences in health outcomes or short-term outcomes (e.g. LDLc) between the 2 FDCPs and their component drugs co-administered.
• Evidence exists to show that in adding a second lipid-lowering drug with a different mechanism of action (either niacin or ezetimibe), additional lowering of LDLc and total cholesterol can be achieved, although it does depend on the specific dose and specific statin being compared.
o For Advicor®, the difference in LDLc lowering compared to lovastatin monotherapy ranges from 10 - 24%, while the differences in comparison to simvastatin were 0 - 3%. However, atorvastatin resulted in better lipid lowering by a difference of 7 - 10%. Triglyceride reduction is also affected by adding niacin, but HDLc is not often statistically significantly improved over statin monotherapy.
o For Vytorin®, the difference in LDLc lowering compared to its component statin, simvastatin, was a mean of 14% across all doses. Differences with atorvastatin were dose-dependent with an inverse dose-response curve: differences of 11% at 10mg, 9 -12.5% at 20mg, 6.7% at 40mg and 5.7% at 80mg. Across all doses, the mean additional reduction in LDLc with Vytorin® compared to rosuvastatin was 4%. With Vytorin® compared to statin monotherapy, triglycerides are not often
THIS REPORT HAS BEEN SUPERSEDED
Final Report Drug Effectiveness Review Project
FDCP for diabetes and hyperlipidemia Page 39 of 73

improved by adding ezetimibe, but HDLc is increased an additional 0.4% to 4%. NCEP ATP III Goal was reached in more patients randomized to Vytorin® (89.7%) compared to atorvastatin or rosuvastatin across all doses:
Vytorin® 89.7% versus atorvastatin 81.1%, NNT 12 (95% CI 9-19) Vytorin® 95.9% versus rosuvastatin 93%, NNT 35 (95% CI 22-80)
• Adverse events reported were commonly those associated with statin use, although the addition of a second, non-statin drug did not appear to reduce the incidence of such adverse events as serum transaminase or CPK elevations compared to monotherapy.
o The addition of niacin with Advicor® did however increase the rate of withdrawals due to flushing and related adverse events.
• A single study of adherence indicated that the FDCP Advicor® did not result in higher adherence or persistence rates compared to monotherapy or co-administration. The additional adherence evidence supports the benefit of adhering to a statin at a minimum level of 80% MPR, but does not inform the discussion of a benefit provided by using a FDCP rather than co-administration in simple or complicated drug regimens.
• Evidence relating to efficacy, effectiveness, adverse events, and adherence in subgroups was limited.
o Advicor® Very limited evidence (single study sub-group analysis) indicates changes
in lipid parameters with niacin-containing regimens tended to be greater in women and that combination regimens produced the greatest lipid changes in patients > 65 years compared to monotherapies.
Geographic and medical specialty differences in prescribing and adherence were found, with those living in the southeast US and those under the care of an endocrinologist having the lowest compliance and the highest adverse event rates. Patients taking 2 drugs were older and more often male than those taking monotherapy.
o Vytorin® Very limited evidence (single non-randomized study) with Vytorin®
applies to patients with CHD or type 2 diabetes, indicating a smaller absolute benefit in additional lowering of LDLc after switching from statin monotherapy to Vytorin® compared to the reduction s seen in trials.
• Many of the questions posed in our analytic frameworks remain unanswered.
Advicor® The evidence for Advicor® relating to the 9 key questions is limited to 3 fair quality,
short term trials (16 to 28 weeks) comparing Advicor® to its individual components as monotherapy (lovastatin or niacin alone, 2 trials)52, 53 or to atorvastatin or simvastatin (1 trial),54 see Table 10 (Evidence Tables 5 and 6). In addition we found 2 open-label, uncontrolled studies with evidence of Advicor® adverse events in longer-term follow up and one database study of adherence compared to monotherapy. There is no evidence regarding long term health outcomes compared to monotherapy or co-administration, no evidence for efficacy outcomes (e.g. reduction in serum lipids) compared to co-administration, no evidence on harms compared to co-administration, and no evidence on the beneficial or harmful effects in subpopulations compared to co-administration of the individual drugs not in fixed dose combination (Key Questions 1, 3, 4, 6 b and c, and 9).
THIS REPORT HAS BEEN SUPERSEDED
Final Report Drug Effectiveness Review Project
FDCP for diabetes and hyperlipidemia Page 40 of 73
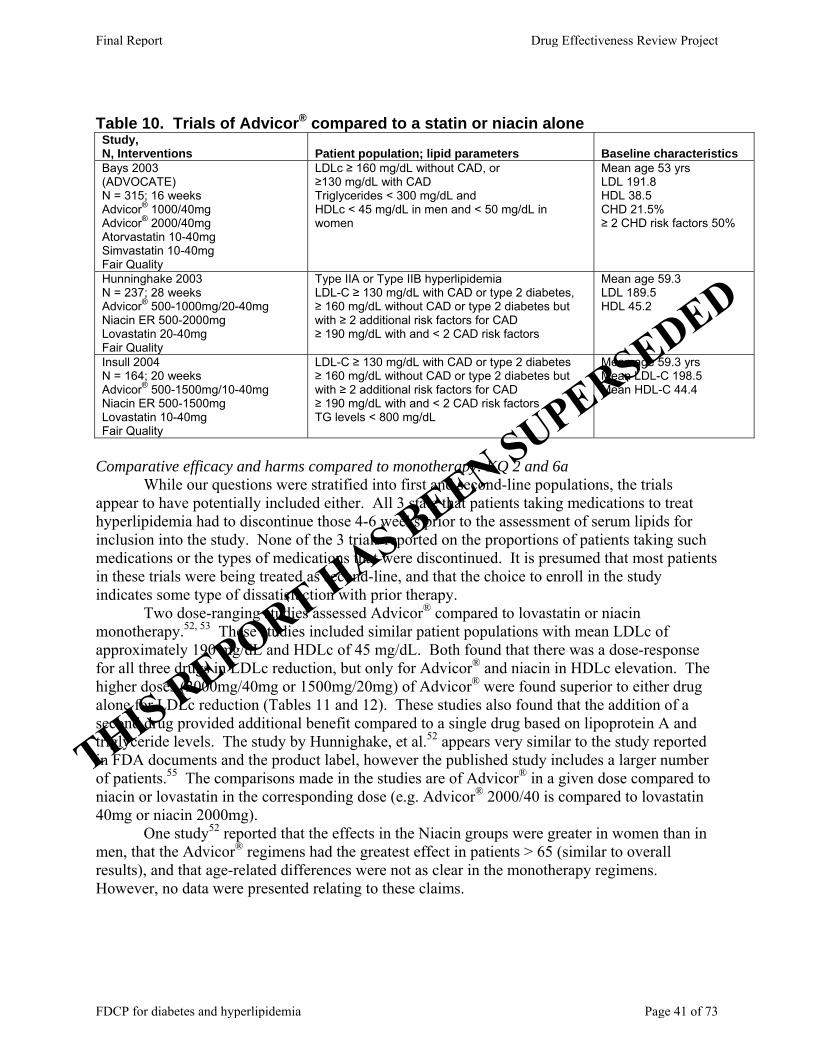
Table 10. Trials of Advicor® compared to a statin or niacin alone Study, N, Interventions Patient population; lipid parameters Baseline characteristics Bays 2003 (ADVOCATE) N = 315; 16 weeks Advicor® 1000/40mg Advicor® 2000/40mg Atorvastatin 10-40mg Simvastatin 10-40mg Fair Quality
LDLc ≥ 160 mg/dL without CAD, or ≥130 mg/dL with CAD Triglycerides < 300 mg/dL and HDLc < 45 mg/dL in men and < 50 mg/dL in women
Mean age 53 yrs LDL 191.8 HDL 38.5 CHD 21.5% ≥ 2 CHD risk factors 50%
Hunninghake 2003 N = 237; 28 weeks Advicor® 500-1000mg/20-40mg Niacin ER 500-2000mg Lovastatin 20-40mg Fair Quality
Type IIA or Type IIB hyperlipidemia LDL-C ≥ 130 mg/dL with CAD or type 2 diabetes, ≥ 160 mg/dL without CAD or type 2 diabetes but with ≥ 2 additional risk factors for CAD ≥ 190 mg/dL with and < 2 CAD risk factors
Mean age 59.3 LDL 189.5 HDL 45.2
Insull 2004 N = 164; 20 weeks Advicor® 500-1500mg/10-40mg Niacin ER 500-1500mg Lovastatin 10-40mg Fair Quality
LDL-C ≥ 130 mg/dL with CAD or type 2 diabetes ≥ 160 mg/dL without CAD or type 2 diabetes but with ≥ 2 additional risk factors for CAD ≥ 190 mg/dL with and < 2 CAD risk factors TG levels < 800 mg/dL
Mean age 59.3 yrs Mean LDL-C 198.5 Mean HDL-C 44.4
Comparative efficacy and harms compared to monotherapy: KQ 2 and 6a While our questions were stratified into first and second-line populations, the trials appear to have potentially included either. All 3 state that patients taking medications to treat hyperlipidemia had to discontinue those 4-6 weeks prior to the assessment of serum lipids for inclusion into the study. None of the 3 trials reported on the proportions of patients taking such medications or the types of medications that were discontinued. It is presumed that most patients in these trials were being treated as second-line, and that the choice to enroll in the study indicates some type of dissatisfaction with prior therapy. Two dose-ranging studies assessed Advicor® compared to lovastatin or niacin monotherapy.52, 53 These studies included similar patient populations with mean LDLc of approximately 190 mg/dL and HDLc of 45 mg/dL. Both found that there was a dose-response for all three drugs in LDLc reduction, but only for Advicor® and niacin in HDLc elevation. The higher doses (2000mg/40mg or 1500mg/20mg) of Advicor® were found superior to either drug alone for LDLc reduction (Tables 11 and 12). These studies also found that the addition of a second drug provided additional benefit compared to a single drug based on lipoprotein A and triglyceride levels. The study by Hunnighake, et al.52 appears very similar to the study reported in FDA documents and the product label, however the published study includes a larger number of patients.55 The comparisons made in the studies are of Advicor® in a given dose compared to niacin or lovastatin in the corresponding dose (e.g. Advicor® 2000/40 is compared to lovastatin 40mg or niacin 2000mg). One study52 reported that the effects in the Niacin groups were greater in women than in men, that the Advicor® regimens had the greatest effect in patients > 65 (similar to overall results), and that age-related differences were not as clear in the monotherapy regimens. However, no data were presented relating to these claims.
THIS REPORT HAS BEEN SUPERSEDED
Final Report Drug Effectiveness Review Project
FDCP for diabetes and hyperlipidemia Page 41 of 73

Table 11. Mean LDLc reductions in Advicor® trials ADVOCATE (Bays 2003) 16 weeks
Hunninghake 2003 28 weeks
Insul 2004 20 weeks
Advicor® 1000/40 = 39% Advicor® 1000/40 = 28%‡ Advicor® 1500/20 = 35%†† Advicor® 2000/40 = 42% Advicor® 2000/40 = 42%† Advicor® 2000/40 = 46%‡‡ Atorvastatin 40mg = 49%* Niacin 2000mg = 13.5% Lovastatin 20 = 22% Simvastatin 40mg = 39% Lovastatin 40mg = 32.2% Lovastatin 40 = 24% *p<0.05 for atorvastatin vs. Advicor® at either dose † p<0.05 for Advicor® 2000mg/40mg vs. Lovastatin or Niacin ‡ p<0.001 for Advicor® 2000mg/40mg vs. Advicor® 1000mg/20mg †† p<0.001 for Advicor® 1500/20 vs. Lovastatin 20mg ‡‡ p<0.001 for Advicor® 2000/40 vs. Lovastatin 40mg
Table 12. Mean HDLc elevations in Advicor® trials ADVOCATE (Bays 2003) 16 weeks
Hunninghake 2003 28 weeks
Insul 2004 20 weeks
Advicor® 1000/40 = 17%* Advicor® 1000/40 = 21.4% Advicor® 2000/40 = 32%** Advicor® 2000/40 = 30.4%**
Advicor® 10/500mg-40/2500mg = 8.6% to 32.9%
Atorvastatin 40mg = 6% Lovastatin 40mg = 6.4% Lovastatin 10mg-40mg = 5.4% to 9.5% Simvastatin 40mg = 7% Niacin 2000mg = 23.5% Niacin 500mg-2500mg = 2.8% to 33.1% *p<0.05 for Advicor® at either dose vs. atorvastatin or simvastatin **p=0.016 for Advicor® 2000/40 vs. 1000/20
It may be more interesting to make comparisons between a higher dose of a statin (e.g. lovastatin 80mg) compared to more moderate doses in the combination product (e.g. 2000mg/40mg), since the benefit of the combination product might include being able to use a lower dose of the statin or niacin to avoid potential dose-related adverse events of either drug. Clearly the dosing for monotherapy niacin or lovastatin was not at the top of the range for either, so simply giving 2 drugs with differing mechanisms of action compared to either drug alone at the lower doses does not make the best comparison for our purposes.
For example, in the third study, ADVOCATE,54 moderate doses of a highly potent statin, atorvastatin 40mg, was superior to Advicor® in reducing LDLc, while 40mg of simvastatin, considered less potent than atorvastatin on a mg per mg basis, was not superior. Similar to the other 2 studies, this study found that the addition of niacin brought about statistically significant benefits in HDLc increases not found with the statins alone. Apolipoprotein B was more reduced in the atorvastatin 40mg group at 16 weeks compared to the simvastatin or Advicor® 1000/40 group (p<0.05), and Apolipoprotein A1 was more elevated with Advicor® group (2000/40) than with either statin
In the studies of Advicor® compared to niacin ER or lovastatin monotherapy, withdrawal due to adverse events was higher in the groups of patients receiving niacin (23% and 20% with niacin ER and 18% and 19% with Advicor®) compared to lovastatin alone (9% and 10%).52, 53 Flushing was reported by 63% of those receiving niacin in some formulation, compared to 15% in the statin group in one of the studies,53 and was described as the most common adverse event leading to withdrawal in the other.52 Adverse events and withdrawals from study were poorly described in the ADVOCATE study, with 5 patients withdrawn due to unnamed adverse events but not clearly accounted for.54 Nonetheless, withdrawals due to adverse events was greater in the Advicor® group (estimated to be 15.5 to 19%) compared to the statin groups (estimated to be 8.5% for atorvastatin and 2.6% for simvastatin). Dizziness and flushing were reported more often with Advicor® than the statins.
THIS REPORT HAS BEEN SUPERSEDED
Final Report Drug Effectiveness Review Project
FDCP for diabetes and hyperlipidemia Page 42 of 73
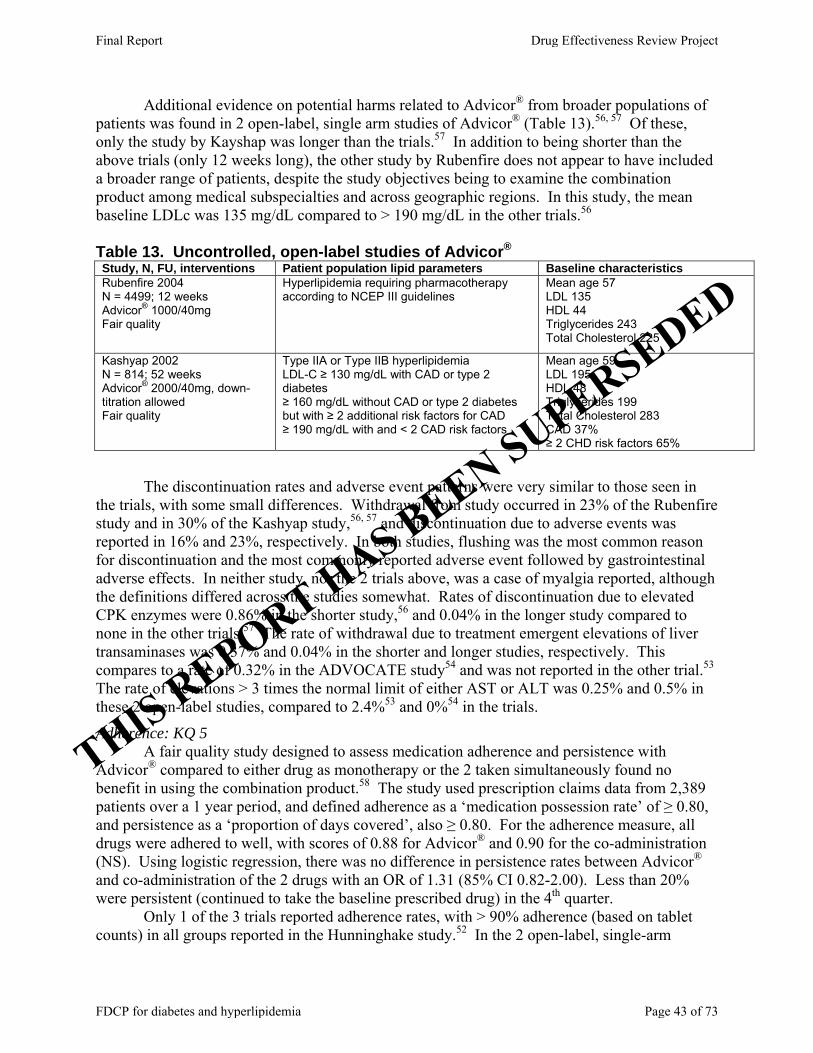
Additional evidence on potential harms related to Advicor® from broader populations of patients was found in 2 open-label, single arm studies of Advicor® (Table 13).56, 57 Of these, only the study by Kayshap was longer than the trials.57 In addition to being shorter than the above trials (only 12 weeks long), the other study by Rubenfire does not appear to have included a broader range of patients, despite the study objectives being to examine the combination product among medical subspecialties and across geographic regions. In this study, the mean baseline LDLc was 135 mg/dL compared to > 190 mg/dL in the other trials.56 Table 13. Uncontrolled, open-label studies of Advicor® Study, N, FU, interventions Patient population lipid parameters Baseline characteristics Rubenfire 2004 N = 4499; 12 weeks Advicor® 1000/40mg Fair quality
Hyperlipidemia requiring pharmacotherapy according to NCEP III guidelines
Mean age 57 LDL 135 HDL 44 Triglycerides 243 Total Cholesterol 225
Kashyap 2002 N = 814; 52 weeks Advicor® 2000/40mg, down-titration allowed Fair quality
Type IIA or Type IIB hyperlipidemia LDL-C ≥ 130 mg/dL with CAD or type 2 diabetes ≥ 160 mg/dL without CAD or type 2 diabetes but with ≥ 2 additional risk factors for CAD ≥ 190 mg/dL with and < 2 CAD risk factors
Mean age 59 LDL 195 HDL 48 Triglycerides 199 Total Cholesterol 283 CAD 37% ≥ 2 CHD risk factors 65%
The discontinuation rates and adverse event patterns were very similar to those seen in the trials, with some small differences. Withdrawal from study occurred in 23% of the Rubenfire study and in 30% of the Kashyap study,56, 57 and discontinuation due to adverse events was reported in 16% and 23%, respectively. In both studies, flushing was the most common reason for discontinuation and the most commonly reported adverse event followed by gastrointestinal adverse effects. In neither study, nor the 2 trials above, was a case of myalgia reported, although the definitions differed across the studies somewhat. Rates of discontinuation due to elevated CPK enzymes were 0.86% in the shorter study,56 and 0.04% in the longer study compared to none in the other trials.57 The rate of withdrawal due to treatment emergent elevations of liver transaminases was 0.37% and 0.04% in the shorter and longer studies, respectively. This compares to a rate of 0.32% in the ADVOCATE study54 and was not reported in the other trial.53 The rate of elevations > 3 times the normal limit of either AST or ALT was 0.25% and 0.5% in these 2 open-label studies, compared to 2.4%53 and 0%54 in the trials.
Adherence: KQ 5 A fair quality study designed to assess medication adherence and persistence with Advicor® compared to either drug as monotherapy or the 2 taken simultaneously found no benefit in using the combination product.58 The study used prescription claims data from 2,389 patients over a 1 year period, and defined adherence as a ‘medication possession rate’ of ≥ 0.80, and persistence as a ‘proportion of days covered’, also ≥ 0.80. For the adherence measure, all drugs were adhered to well, with scores of 0.88 for Advicor® and 0.90 for the co-administration (NS). Using logistic regression, there was no difference in persistence rates between Advicor® and co-administration of the 2 drugs with an OR of 1.31 (85% CI 0.82-2.00). Less than 20% were persistent (continued to take the baseline prescribed drug) in the 4th quarter.
Only 1 of the 3 trials reported adherence rates, with > 90% adherence (based on tablet counts) in all groups reported in the Hunninghake study.52 In the 2 open-label, single-arm
THIS REPORT HAS BEEN SUPERSEDED
Final Report Drug Effectiveness Review Project
FDCP for diabetes and hyperlipidemia Page 43 of 73
studies, the rate of adherence varied, with a rate of 77% (based on tablet count at the end of study) in the 12 week study57 and a rate of 94% (defined as the proportion of tablets taken as prescribed) in the longer study.56
Subgroups: KQ 9 No comparative evidence in subgroups was found for Advicor® versus co-administration
of the 2 drugs, although one of the trials found that changes in lipid parameters with niacin-containing regimens tended to be greater in women and that combination regimens produced the greatest lipid changes in patients > 65 years compared to monotherapies.52 One open-label, uncontrolled study reported geographic and medical specialty differences, with those living in the southeast US and those under the care of an endocrinologist having the lowest compliance and the highest adverse event rates.56 The study of adherence by LaFleur, et al. found differences in the demographic characteristics of patients taking Advicor®, co-administration of the 2 drugs, or the 2 drugs taken as monotherapy.58 Patients taking 2 drugs were older and more often male than those taking monotherapy. These characteristics were controlled for in the analysis described above. Vytorin®
The evidence for Vytorin® relating to the 9 key questions is limited to 5 short term trials (6 to 12 weeks) comparing Vytorin® to atorvastatin in 3 trials,59-61 to rosuvastatin in 1 trial,62 and to its individual components as monotherapy (simvastatin or ezetimibe alone) in 1 trial,63 see Table 14 (Evidence Tables 7 and 8). In addition, we found an open-label, uncontrolled before-after study with evidence of Vytorin® efficacy and adverse events in patients with type 2 diabetes or coronary heart disease with 3 months of follow up.64 There is no evidence meeting inclusion criteria regarding long term health outcomes compared to monotherapy or co-administration, for efficacy outcomes (e.g. reduction in serum lipids) compared to co-administration, on harms compared to co-administration, and on the beneficial or harmful effects in subpopulations compared to co-administration of the individual drugs not in fixed dose combination (Key Questions 1, 3, 4, 6 b and c, or 9). Again, the populations included in these studies are not limited to first or second-line treatment, however based on trial design it appears that most are patients who have previously been treated with drug therapy for hypercholesterolemia.
THIS REPORT HAS BEEN SUPERSEDED
Final Report Drug Effectiveness Review Project
FDCP for diabetes and hyperlipidemia Page 44 of 73
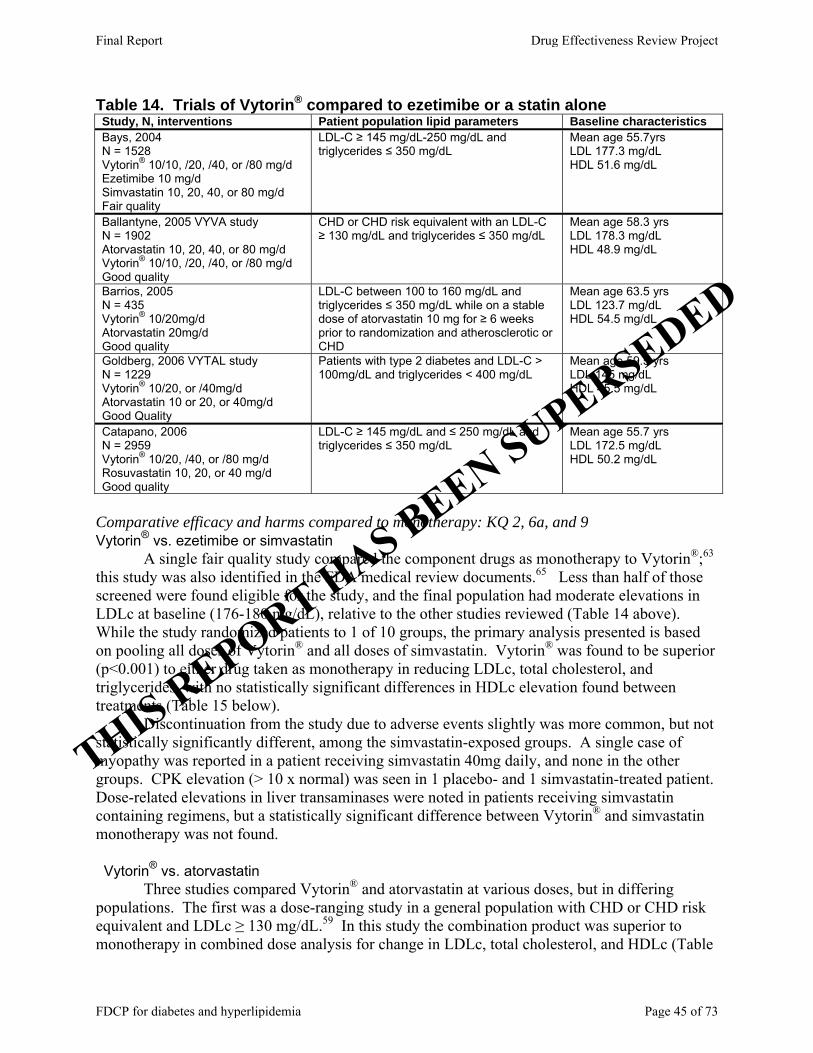
Table 14. Trials of Vytorin® compared to ezetimibe or a statin alone Study, N, interventions Patient population lipid parameters Baseline characteristics Bays, 2004 N = 1528 Vytorin® 10/10, /20, /40, or /80 mg/d Ezetimibe 10 mg/d Simvastatin 10, 20, 40, or 80 mg/d Fair quality
LDL-C ≥ 145 mg/dL-250 mg/dL and triglycerides ≤ 350 mg/dL
Mean age 55.7yrs LDL 177.3 mg/dL HDL 51.6 mg/dL
Ballantyne, 2005 VYVA study N = 1902 Atorvastatin 10, 20, 40, or 80 mg/d Vytorin® 10/10, /20, /40, or /80 mg/d Good quality
CHD or CHD risk equivalent with an LDL-C ≥ 130 mg/dL and triglycerides ≤ 350 mg/dL
Mean age 58.3 yrs LDL 178.3 mg/dL HDL 48.9 mg/dL
Barrios, 2005 N = 435 Vytorin® 10/20mg/d Atorvastatin 20mg/d Good quality
LDL-C between 100 to 160 mg/dL and triglycerides ≤ 350 mg/dL while on a stable dose of atorvastatin 10 mg for ≥ 6 weeks prior to randomization and atherosclerotic or CHD
Mean age 63.5 yrs LDL 123.7 mg/dL HDL 54.5 mg/dL
Goldberg, 2006 VYTAL study N = 1229 Vytorin® 10/20, or /40mg/d Atorvastatin 10 or 20, or 40mg/d Good Quality
Patients with type 2 diabetes and LDL-C > 100mg/dL and triglycerides < 400 mg/dL
Mean age 59.5 yrs LDL 145 mg/dL HDL 45.5 mg/dL
Catapano, 2006 N = 2959 Vytorin® 10/20, /40, or /80 mg/d Rosuvastatin 10, 20, or 40 mg/d Good quality
LDL-C ≥ 145 mg/dL and ≤ 250 mg/dL and triglycerides ≤ 350 mg/dL
Mean age 55.7 yrs LDL 172.5 mg/dL HDL 50.2 mg/dL
Comparative efficacy and harms compared to monotherapy: KQ 2, 6a, and 9 Vytorin® vs. ezetimibe or simvastatin A single fair quality study compared the component drugs as monotherapy to Vytorin®;63 this study was also identified in the FDA medical review documents.65 Less than half of those screened were found eligible for the study, and the final population had moderate elevations in LDLc at baseline (176-180 mg/dL), relative to the other studies reviewed (Table 14 above). While the study randomized patients to 1 of 10 groups, the primary analysis presented is based on pooling all doses of Vytorin® and all doses of simvastatin. Vytorin® was found to be superior (p<0.001) to either drug taken as monotherapy in reducing LDLc, total cholesterol, and triglycerides, with no statistically significant differences in HDLc elevation found between treatments (Table 15 below). Discontinuation from the study due to adverse events slightly was more common, but not statistically significantly different, among the simvastatin-exposed groups. A single case of myopathy was reported in a patient receiving simvastatin 40mg daily, and none in the other groups. CPK elevation (> 10 x normal) was seen in 1 placebo- and 1 simvastatin-treated patient. Dose-related elevations in liver transaminases were noted in patients receiving simvastatin containing regimens, but a statistically significant difference between Vytorin® and simvastatin monotherapy was not found. Vytorin® vs. atorvastatin Three studies compared Vytorin® and atorvastatin at various doses, but in differing populations. The first was a dose-ranging study in a general population with CHD or CHD risk equivalent and LDLc ≥ 130 mg/dL.59 In this study the combination product was superior to monotherapy in combined dose analysis for change in LDLc, total cholesterol, and HDLc (Table
THIS REPORT HAS BEEN SUPERSEDED
Final Report Drug Effectiveness Review Project
FDCP for diabetes and hyperlipidemia Page 45 of 73

15 below). LDLc and HDLc were statistically significantly better for Vytorin® across individual statin dose level comparisons while total cholesterol was improved significantly more with only the 10, 20, and 40mg statin doses of Vytorin® (see Table 15). A difference in effect on triglycerides was not found. In a combined dose analysis, patients receiving Vytorin® were more likely to have achieved their personal NCEP ATP III goals, 89.7% with Vytorin® versus 81.1% with atorvastatin, with an NNT 12 (95% CI 9-19). Adverse events reported were similar across groups, and no patient in either group reported myopathy (CPK elevation plus muscle symptoms). However, the rate of patients with ALT elevations and combined ALT or AST elevations was statistically significantly higher in the combined atorvastatin groups compared to the combined Vytorin® groups (10% vs. 0%; p=0.002 and 11% vs. 1%; p=0.006, respectively).
The second study was that of patients with CHD previously treated with atorvastatin 10mg/day, without complete success (LDL-C between 100 to 160 mg/dL), who were being considered for a dose increase.60 These patients were randomized to the next dose of atorvastatin (20mg/day) compared to Vytorin® at the second level dose 10/20mg/day. At the lower end of the dosing range for these 2 statins, there may not be important differences in potency, meaning that this comparison is less clinically meaningful than one that would compare a higher dose of statin monotherapy to lower doses of combination therapy.9 The study did find that Vytorin® 10/20mg per day was superior to atorvastatin 20mg per day in reducing LDLc and total cholesterol and in elevating HDLc (Table 15 below). A difference in the impact on triglycerides was not found. In this study adverse events were not different between the 2 treatments, with only 1 patient in the Vytorin® group having elevations in serum transaminases (ALT or AST) and none in the atorvastatin group. No patients in either group had CPK elevations or muscle symptoms of myopathy.
The third study treated patients with hypercholesterolemia and type 2 diabetes randomized to low to moderate doses of atorvastatin (10mg, 20mg or 40mg) or moderate doses of Vytorin® (10/20mg, 10/40mg).61 Again, the dose comparisons are not directly comparable to the doses of Vytorin® used. The analysis compares 10 or 20mg of atorvastatin to Vytorin® 10/20mg and 40mg of atorvastatin to Vytorin® 10/40mg. The study found that adding a second drug (ezetimibe) resulted in additional benefit in LDLc and total cholesterol reduction and HDLc elevations (Table 15 below), although triglyceride reduction was only statistically significantly different between the atorvastatin 10mg and Vytorin® 10/20mg groups (p=0.02). Additionally, the proportions of patients achieving the NCEP ATP III goal of < 70 mg/dL were statistically significantly greater in the Vytorin® groups (Table 15). Those achieving a NCEP ATP III goal of < 100 mg/dL were statistically significant when comparing the lower dose groups, but not the 40mg statin groups (Table 15). Subgroup analysis indicated that among patients with CHD risk equivalent, the ability to achieve NCEP ATP III optional goal of LDLc < 70 mg/dL was statistically significantly greater in the Vytorin® groups (57.1% on Vytorin® 10/40mg vs. 22.6% on atorvastatin 40mg; P<0.001), and that a difference in treatment effect was not found between those with CHD risk and those without. There were no differences in adverse event rates between the groups, although the rate of adverse events was high compared to the other studies (19.8% in the Vytorin® groups and 22.7% in the atorvastatin groups). This may be somewhat related to the patient population (hypercholesterolemia and type 2 diabetes). No patient had CPK elevations or myopathy in this study.
THIS REPORT HAS BEEN SUPERSEDED
Final Report Drug Effectiveness Review Project
FDCP for diabetes and hyperlipidemia Page 46 of 73
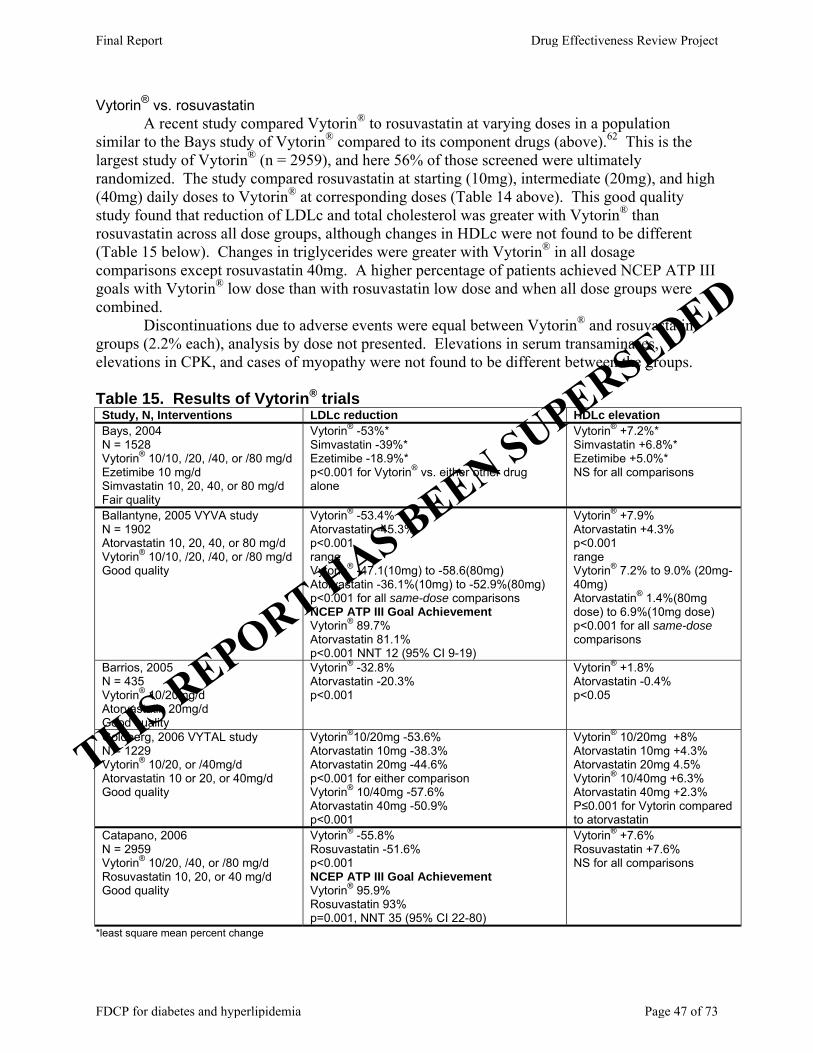
Vytorin® vs. rosuvastatin A recent study compared Vytorin® to rosuvastatin at varying doses in a population similar to the Bays study of Vytorin® compared to its component drugs (above).62 This is the largest study of Vytorin® (n = 2959), and here 56% of those screened were ultimately randomized. The study compared rosuvastatin at starting (10mg), intermediate (20mg), and high (40mg) daily doses to Vytorin® at corresponding doses (Table 14 above). This good quality study found that reduction of LDLc and total cholesterol was greater with Vytorin® than rosuvastatin across all dose groups, although changes in HDLc were not found to be different (Table 15 below). Changes in triglycerides were greater with Vytorin® in all dosage comparisons except rosuvastatin 40mg. A higher percentage of patients achieved NCEP ATP III goals with Vytorin® low dose than with rosuvastatin low dose and when all dose groups were combined. Discontinuations due to adverse events were equal between Vytorin® and rosuvastatin groups (2.2% each), analysis by dose not presented. Elevations in serum transaminases, elevations in CPK, and cases of myopathy were not found to be different between the groups. Table 15. Results of Vytorin® trials Study, N, Interventions LDLc reduction HDLc elevation Bays, 2004 N = 1528 Vytorin® 10/10, /20, /40, or /80 mg/d Ezetimibe 10 mg/d Simvastatin 10, 20, 40, or 80 mg/d Fair quality
Vytorin® -53%* Simvastatin -39%* Ezetimibe -18.9%* p<0.001 for Vytorin® vs. either other drug alone
Vytorin® +7.2%* Simvastatin +6.8%* Ezetimibe +5.0%* NS for all comparisons
Ballantyne, 2005 VYVA study N = 1902 Atorvastatin 10, 20, 40, or 80 mg/d Vytorin® 10/10, /20, /40, or /80 mg/d Good quality
Vytorin® -53.4% Atorvastatin -45.3% p<0.001 range Vytorin® -47.1(10mg) to -58.6(80mg) Atorvastatin -36.1%(10mg) to -52.9%(80mg) p<0.001 for all same-dose comparisons NCEP ATP III Goal Achievement Vytorin® 89.7% Atorvastatin 81.1% p<0.001 NNT 12 (95% CI 9-19)
Vytorin® +7.9% Atorvastatin +4.3% p<0.001 range Vytorin® 7.2% to 9.0% (20mg-40mg) Atorvastatin® 1.4%(80mg dose) to 6.9%(10mg dose) p<0.001 for all same-dose comparisons
Barrios, 2005 N = 435 Vytorin® 10/20mg/d Atorvastatin 20mg/d Good quality
Vytorin® -32.8% Atorvastatin -20.3% p<0.001
Vytorin® +1.8% Atorvastatin -0.4% p<0.05
Goldberg, 2006 VYTAL study N = 1229 Vytorin® 10/20, or /40mg/d Atorvastatin 10 or 20, or 40mg/d Good quality
Vytorin®10/20mg -53.6% Atorvastatin 10mg -38.3% Atorvastatin 20mg -44.6% p<0.001 for either comparison Vytorin® 10/40mg -57.6% Atorvastatin 40mg -50.9% p<0.001
Vytorin® 10/20mg +8% Atorvastatin 10mg +4.3% Atorvastatin 20mg 4.5% Vytorin® 10/40mg +6.3% Atorvastatin 40mg +2.3% P≤0.001 for Vytorin compared to atorvastatin
Catapano, 2006 N = 2959 Vytorin® 10/20, /40, or /80 mg/d Rosuvastatin 10, 20, or 40 mg/d Good quality
Vytorin® -55.8% Rosuvastatin -51.6% p<0.001 NCEP ATP III Goal Achievement Vytorin® 95.9% Rosuvastatin 93% p=0.001, NNT 35 (95% CI 22-80)
Vytorin® +7.6% Rosuvastatin +7.6% NS for all comparisons
*least square mean percent change
THIS REPORT HAS BEEN SUPERSEDED
Final Report Drug Effectiveness Review Project
FDCP for diabetes and hyperlipidemia Page 47 of 73

Observational study Using data collected prospectively from general practitioners and internists in the UK and Germany, the effect of switching patients with LDLc > 100 mg/dL during pretreatment with a statin at low to moderate doses (10-20mg/d) to Vytorin® (marketed as Inegy® in Germany) was evaluated.64 In this fair quality before-after study, patients also had to have either CHD or type 2 diabetes, and both groups were large. The mean age and proportion of males were similar to the trials above. The patients enrolled had important co-morbidities (hypertension and family history of CHD being the most common) which would have met exclusion criteria for the Bays and Ballantyne studies above,59, 63 and most patients (93%) had been previously treated with statin monotherapy, most commonly simvastatin. These study results are most comparable to the study by Barrios, et al.60 in which patients were pretreated with atorvastatin 10mg/day, although some of the patients included would have been excluded in the trial due to specific comorbidities. Switch to a 2 drug regimen from low to moderate dose statin therapy (depending on specific drug) resulted in additional reductions in LDLc, total cholesterol, and triglycerides and elevation in HDLc. These changes were smaller than the changes seen in the switching trial reported above, where Vytorin® resulted in an LDLc reduction of 32.8%, compared to 27-28% here.60 Small proportions of patients reported adverse events, with the most serious being related to statin therapy (Table 16 below). These data reflect a broader patient population, specifically patients with CHD or type 2 diabetes, co-morbid with hypercholesterolemia despite statin monotherapy. However, because it is a before-after study design, the strength of this evidence is lower because it is open to more biases and confounding. Table 16. Results after switch from statin monotherapy to Vytorin®64
Hildemann 2007 LDLc reduction HDLc elevation Adverse event rate Myalgia or CK elevations
n = 19,194 CHD n = 19,848 type 2 diabetes Mean 13 weeks follow-up
CHD: -27.9% DM: -27.3%
CHD: +9.3% DM: +10.1%
CHD: 0.3% DM: 0.16%
CHD: 0.12% DM: 0.08%*
*1 serious case Adherence: KQ 5 In the Ballantyne study of Vytorin® compared to atorvastatin monotherapy, all groups had very high adherence rates, with 97-98% in each group achieving ≥ 85% adherence.38 Similarly, in the Catapano study of Vytorin® compared to rosuvastatin monotherapy, a difference in adherence was not seen, with 97% of all treatment groups achieving ≥ 85% adherence.38 Subgroups: KQ 9 Gender Compared to rosuvastatin, Vytorin® had a larger effect on men than women in the study by Catapano.66 The difference in the mean change in LDLc was somewhat larger in men than women (-5.7% vs. -3.2%), although both were statistically significant compared to baseline (p<0.001). The interaction between drug and gender (using ANOVA) was statistically significant, p = 0.005.38
THIS REPORT HAS BEEN SUPERSEDED
Final Report Drug Effectiveness Review Project
FDCP for diabetes and hyperlipidemia Page 48 of 73
Age Assessments by age (< 65 years versus ≥ 65 years) indicate that for the comparison of rosuvastatin and Vytorin® the difference in the mean change in LDLc was very similar (-4.2% vs. -4.4%), with no difference found using ANOVA(p = 0.807).38 Race In the comparison of Vytorin® and rosuvastatin, the difference in the mean change in LDLc was the greatest in Black patients (-6.2%) compared to White (-4.1%) or ‘other’ (-4.0%). However, an ANOVA analysis of the interaction between drug and race did not indicate a statistically significant relationship, p = 0.492.38 For Black and ‘other’ patients, the differences were not statistically significant compared to baseline, although the sample sizes were very small per group (Black= 29-37 in Vytorin® groups, 27-38 in rosuvastatin groups; Other=30-31 in Vytorin® groups, 27-36 in rosuvastatin groups) and a difference may not have been detected. Comorbidity
Data from the Goldberg study of diabetic patients (Vytorin® vs. atorvastatin),61 the Hildemann study of patients with CHD or type 2 diabetes as well as other co-morbidities (Vytorin® only),64 and subgroup analysis from the Bays study (Vytorin® vs. simvastatin)63 indicate that Vytorin® is effective in reducing LDLc, total cholesterol, and triglycerides in these subgroups, similar to the pattern seen in the overall study populations. These studies do not provide evidence of a higher rate of adverse events among the groups compared to the narrower trial populations.
In the study of rosuvastatin monotherapy compared to Vytorin®, similar patterns of greater LDLc lowering with Vytorin® were found in various comorbidity groups (CHD, ≥ or < 2 risk factors for CHD, type 2 diabetes, metabolic syndrome =/- diabetes, baseline LDLc).62 In all of these groups the difference in the mean change in LDLc favored Vytorin®, with the difference being statistically significant (P=0.001). ANOVA did not reveal statistically significant relationships between these covariates and the difference in mean change in LDLc.38 Evidence of the link between improved adherence and outcomes (KQ 7 and 8) We identified a single fair quality study assessing the link between adherence to antihyperlipidemic drug treatments and health outcomes.67 In particular, this study assessed the relationship between adherence to statin therapy and attainment of LDLc goals among diabetics. The study used prescription and laboratory data from an HMO database, ultimately including 653 patients and calculated an MPR (medication possession rate) as the % of days when medication was available over a 9-month treatment period. Overall, the mean MPR was 70%, although the rates were higher among men (75%) than women (66%). The adherence threshold for achieving LDLc goal was 82%, with a probability of reaching the goal being 56-78% if the adherence rate was > 80% and 20-42% if the rate was < 80%. This analysis found that the choice of statin had a statistically significant impact on achieving LDLc goal (with atorvastatin being significantly more likely), but not on adherence. Unfortunately, the study did not examine other aspects of the patient’s drug regimen to assess impact of complicated versus simple therapeutic regimens. In fact, other than stratifying some data by gender, the study does not control for potential confounding factors. Also, this study assesses only statin use, primarily given once daily. As such, the study sheds only minimal light on the question of improved adherence using fewer administrations per day, such as a FDCP.
THIS REPORT HAS BEEN SUPERSEDED
Final Report Drug Effectiveness Review Project
FDCP for diabetes and hyperlipidemia Page 49 of 73

SUMMARY The existing evidence does not evaluate any differences in health outcomes or short-term outcomes (e.g. LDLc) between the 2 FDCPs and their component drugs co-administered. Existing studies only evaluate the 2 FDCPs compared to monotherapy with statins, or niacin or ezetimibe. Many of the questions posed in our analytic frameworks are unanswered. Evidence exists to show that in adding a second lipid-lowering drug with a different mechanism of action (either niacin or ezetimibe), additional lowering of LDLc and total cholesterol can be achieved, although it does in some cases depend on the specific dose of statin being compared. For Advicor®, triglyceride reduction is also affected by adding niacin, but HDLc is not often improved. With Vytorin®, triglycerides were improved more than statin monotherapy in lower dose/potency statin comparisons, but not in comparisons of higher dose/ potency statin monotherapy. Vytorin® resulted in greater improvements in HDLc in all comparisons. Adverse events reported were commonly those associated with statin use, although the addition of a second, non-statin drug did not appear to reduce the incidence of such adverse events as serum transaminase or CPK elevations. The addition of niacin with Advicor® did however increase the rate of withdrawals due to flushing and related adverse events. A single study of adherence indicated that the FDCP Advicor® did not result in higher adherence or persistence rates compared to monotherapy or co-administration. Unfortunately, the additional adherence evidence only supports the benefit of adhering to a statin at a minimum level of 80% MPR, but does not include a discussion of a benefit provided by using a FDCP rather than co-administration in simple or complicated drug regimens. Non-randomized studies (uncontrolled) do not provide additional evidence, although a study of Vytorin® in broader populations of patients with type 2 diabetes or CHD suggested a lower additional benefit than was seen under trial conditions. Table 17 summarizes the evidence by key question. Table 17. Summary of the evidence by Key Question for FDCPs used for hyperlipidemia
Key Question Quality of evidence* Conclusion
Advicor® (niacin/lovastatin) 1. What is the evidence that each combination product improves long-term health outcomes compared to monotherapy? 1a. When used as first-line treatment for hyperlipidemia in drug-naive patients?
1b. When used as second-line treatment for hyperlipidemia in a patient who has failed monotherapy?
NA No evidence.
2. What is the evidence that each combination product improves HbA1c compared to monotherapy? 2a. When used as first-line treatment for hyperlipidemia in drug-naive patients?
2b. When used as second-line treatment for hyperlipidemia in a patient who has failed monotherapy?
Fair Advicor®: 3 trials, indicating that Advicor® improves LDLc lowering more than lovastatin, but differences compared to simvastatin or atorvastatin are smaller and dose-dependent. Triglycerides not generally improved more than with statin monotherapy with Advicor®, but greater improvement in HDLc was seen.
3. What is the evidence that each combination product improves long-term health outcomes compared to the 2 individual drugs taken simultaneously in patients with hyperlipidemia? 3a. How many patients with hyperlipidemia must receive a combination product rather than 2 individual products to avoid one adverse health outcome, e.g. myocardial infarction?
NA No evidence.
4. What is the evidence that each combination product improves serum lipids compared to the 2 individual drugs taken together in patients with hyperlipidemia?
NA No evidence.
5. What is the evidence that each combination product Poor A single study of adherence indicated that the FDCP
THIS REPORT HAS BEEN SUPERSEDED
Final Report Drug Effectiveness Review Project
FDCP for diabetes and hyperlipidemia Page 50 of 73
improves adherence compared to the 2 individual drugs taken simultaneously in patients with hyperlipidemia? 5a. What is the evidence that changing from 2 tablets once daily to 1 tablet once daily improves adherence in patients with hyperlipidemia with complicated drug regimens (e.g. > 3 drugs in regimen, some administered multiple times per day)?
Advicor® did not result in higher adherence or persistence rates compared to monotherapy or co-administration. No evidence was found on the implications of using a FDCP in simple or complicated drug regimens.
6. How do the adverse events associated with a combination product compare to: 6a. Monotherapy in patients with hyperlipidemia? 6b. The 2 individual drugs taken together in patients with hyperlipidemia?
6c. In the natural setting, with dose adjustment allowed, how do the adverse events or adverse event-related withdrawals associated with a combination product compare to the 2 individual drugs taken together in patients with hyperlipidemia?
Fair Adverse events reported were commonly those associated with statin use, although the addition of niacin did not appear to reduce the incidence of such adverse events as serum transaminase or CPK elevations compared to monotherapy. The addition of niacin did however increase the rate of withdrawals due to flushing and related adverse events.
7. What is the evidence that there is a correlation between adherence (in general) and long term health outcomes in patients with hyperlipidemia? 7a. What is the evidence that improved adherence after changing from 2 tablets once daily to 1 tablet once daily results in improved long term health outcomes in patients with hyperlipidemia?
7b. What is the evidence that improved adherence improves long term health outcomes in patients with hyperlipidemia with complicated drug regimens (e.g. > 3 drugs in regimen)?
NA No evidence.
9. What is the evidence that adherence, short-term outcomes, long-term health outcomes or adverse events differ based on the characteristics of patients with hyperlipidemia taking a fixed-dose combination product? 9a. What is the evidence that included outcomes are different when taking a combination drug product compared to the 2 individual drugs based on the patients age (older versus younger), gender, or race/ethnicity?
Poor Very limited evidence with Advicor® indicates changes in lipid parameters with niacin-containing regimens tended to be greater in women and that combination regimens produced the greatest lipid changes in patients >65yrs compared to monotherapies. Geographic and medical specialty differences in prescribing and adherence were found, with those living in the southeast US, and those under the care of an endocrinologist having the lowest compliance and the highest adverse event rates. Patients taking 2 drugs were older and more often male than those taking monotherapy.
Vytorin® (ezetimibe/simvastatin) 1. What is the evidence that each combination product improves long-term health outcomes compared to monotherapy? 1a. When used as first-line treatment for hyperlipidemia in drug-naive patients?
1b. When used as second-line treatment for hyperlipidemia in a patient who has failed monotherapy?
NA No evidence.
2. What is the evidence that each combination product improves HbA1c compared to monotherapy? 2a. When used as first-line treatment for hyperlipidemia in drug-naive patients?
2b. When used as second-line treatment for hyperlipidemia in a patient who has failed monotherapy?
Fair Vytorin®: 5 trials, indicating that Vytorin® improves LDLc lowering more than simvastatin, atorvastatin and rosuvastatin. However, differences with rosuvastatin and higher doses of atorvastatin were smaller. Triglycerides improved with Vytorin®, HDLc not generally improved more than with statin monotherapy. Most of this evidence refers to second-line treatment; it is unclear what proportion, if any, was first-line treatment.
3. What is the evidence that each combination product improves long-term health outcomes compared to the 2 individual drugs taken simultaneously in patients with hyperlipidemia? 3a. How many patients with hyperlipidemia must receive a combination product rather than 2 individual products to avoid one adverse health outcome, e.g. myocardial infarction?
NA No evidence.
4. What is the evidence that each combination product improves serum lipids compared to the 2 individual drugs taken together in patients with hyperlipidemia?
NA No evidence.
5. What is the evidence that each combination product Poor No evidence was found on the implications of using a
THIS REPORT HAS BEEN SUPERSEDED
Final Report Drug Effectiveness Review Project
FDCP for diabetes and hyperlipidemia Page 51 of 73
improves adherence compared to the 2 individual drugs taken simultaneously in patients with hyperlipidemia? 5a. What is the evidence that changing from 2 tablets once daily to 1 tablet once daily improves adherence in patients with hyperlipidemia with complicated drug regimens (e.g. > 3 drugs in regimen, some administered multiple times per day)?
FDCP in simple or complicated drug regimens.
6. How do the adverse events associated with a combination product compare to: 6a. Monotherapy in patients with hyperlipidemia? 6b. The 2 individual drugs taken together in patients with hyperlipidemia?
6c. In the natural setting, with dose adjustment allowed, how do the adverse events or adverse event-related withdrawals associated with a combination product compare to the 2 individual drugs taken together in patients with hyperlipidemia?
Fair Adverse events reported were commonly those associated with statin use, although the addition of ezetimibe did not appear to reduce the incidence of such adverse events as serum transaminase or CPK elevations compared to monotherapy.
7. What is the evidence that there is a correlation between adherence (in general) and long term health outcomes in patients with hyperlipidemia? 7a. What is the evidence that improved adherence after changing from 2 tablets once daily to 1 tablet once daily results in improved long term health outcomes in patients with hyperlipidemia?
7b. What is the evidence that improved adherence improves long term health outcomes in patients with hyperlipidemia with complicated drug regimens (e.g. > 3 drugs in regimen)?
NA No evidence.
9. What is the evidence that adherence, short-term outcomes, long-term health outcomes or adverse events differ based on the characteristics of patients with hyperlipidemia taking a fixed-dose combination product? 9a. What is the evidence that included outcomes are different when taking a combination drug product compared to the 2 individual drugs based on the patients age (older versus younger), gender, or race/ethnicity?
Poor Very limited evidence with Vytorin® applies to patients with CHD or type 2 diabetes, indicating a benefit in additional lowering of LDLc after switching to Vytorin® from statin monotherapy.
Adherence Evidence 8. What is the evidence that there is a correlation between adherence (in general) and serum lipids in patients with hyperlipidemia? 8a. What is the evidence that improved adherence after changing from 2 tablets once daily to 1 tablet once daily results in improvement in serum lipids in patients with hyperlipidemia?
8b. What is the evidence that improved adherence improves serum lipids in patients with hyperlipidemia with complicated drug regimens (e.g. > 3 drugs in regimen)?
Poor The additional adherence evidence supports the benefit of adhering to a statin at a minimum level of 80% MPR, but does not inform the discussion of a benefit provided by using a FDCP rather than co-administration in simple or complicated drug regimens. No evidence was found on the implications of using a FDCP in simple or complicated drug regimens.
*refers to the body of evidence, taking the quality and applicability of the individual studies into account
THIS REPORT HAS BEEN SUPERSEDED
Final Report Drug Effectiveness Review Project
FDCP for diabetes and hyperlipidemia Page 52 of 73
REFERENCES 1. Chobanian AV, Bakris GL, Black HR, et al. The Seventh Report of the Joint National
Committee on Prevention, Detection, Evaluation, and Treatment of High Blood Pressure: the JNC 7 report.[see comment][erratum appears in JAMA. 2003 Jul 9;290(2):197]. JAMA. May 21 2003;289(19):2560-2572.
2. National Cholesterol Education Program Expert Panel on Detection EaToHBCiA. Third Report of the National Cholesterol Education Program (NCEP) Expert Panel on Detection, Evaluation, and Treatment of High Blood Cholesterol in Adults (Adult Treatment Panel III) final report.[see comment]. Circulation. Dec 17 2002;106(25):3143-3421.
3. American Diabetes A. Standards of medical care in diabetes.[erratum appears in Diabetes Care. 2005 Apr;28(4):990]. Diabetes Care. Jan 2005;28 Suppl 1:S4-S36.
4. McDonald HP, Garg AX, Haynes RB. Interventions to Enhance Patient Adherence to Medication Prescriptions: Scientific Review. JAMA. December 11, 2002 2002;288(22):2868-2879.
5. Haynes RB. Interventions for enhancing medication adherence. The Cochrane Collabortaion. 2005.
6. Influence of adherence to treatment and response of cholesterol on mortality in the coronary drug project. New England Journal of Medicine. 1980;303(18):1038-1041.
7. Simpson SH, Eurich DT, Majumdar SR, et al. A meta-analysis of the association between adherence to drug therapy and mortality.[see comment]. BMJ. Jul 1 2006;333(7557):15.
8. Anonymous. Intensive blood-glucose control with sulphonylureas or insulin compared with conventional treatment and risk of complications in patients with type 2 diabetes (UKPDS 33). Lancet. 1998;352(9131):837-853.
9. Helfand M, Carson S, Kelley C. Drug Class Review on HMG-CoA Reductase Inhibitors (Statins). http://www.ohsu.edu/drugeffectiveness/reports/documents/Statins%20Final%20Report%20Update%204%20Unshaded.pdf]. Accessed July 5, 2007.
10. Collaborators CTT. Efficacy and safety of cholesterol-lowering treatment: Prosoective meta-analysis of data from 90056 participants in 14 randomised trials of statins Lancet. 2005;366:1267-1278.
11. Robinson JG, Smith B, Maheshwari N, Schrott H. Pleiotropic effects of statins: Benefit beyond Cholesterol Reduction. Journal of the American College of Cardiology. 2005;46(10):1855.
12. NIH. Third report of the nationall cholesterol education program: detection, evaluation and treatment of high blood cholesterol in adults 2004.
13. Moulds RFW. Combination Products: love them or loathe them? Australian Prescriber. 2001;24(5):127-129.
14. Bailey CJ. Whence and whither the fixed-dose combination? Diabetes Vasc Dis Res. 2005;2:51-53.
15. Bakris GL. Achieving blood pressure goals: is fixed dose combination therapy the answer? Journal of Clinical Hypertension (Greenwich)). 2003;5:2-3.
16. Sica DA. Fixed dose combination therapy-is it time for this approach to hypertension and dyslipidemia management? Journal of Clinical Hypertension (Greenwich)). 2004;6:164-167.
THIS REPORT HAS BEEN SUPERSEDED
Final Report Drug Effectiveness Review Project
FDCP for diabetes and hyperlipidemia Page 53 of 73
17. Wofford JL. History of fixed dose combination therapy for hypertension [comment]. Archives of Internal Medicine. 1997;157:1044.
18. Bissonnette S, Habib R, Sampalis F, Boukas S. Efficacy and tolerability of ezetimibe 10mg/day coadministered with statins in patients with hypercholesterolemia who do not achieve target LDL-C while on statin monotherapy: A Canadian, multicenter, prospective study-the ezetrol add-on study. Canadian Journal of Cardiology. 2006;22(12):1035-1044.
19. Sampalis F, Bissonnette S, Habib R, Boukas S. Reduction is estimated risk of coronary artery disease after use of ezetimibe with statin The Annals of Pharmacotherapy. 2007;41:1345-1351.
20. Gerrits CM, Bhattacharya M, Manthena S, R. B, Perez A, Kupfer S. A comparison of pioglitazone and rosiglitazone for hospitalization for acute myocardial infarction in type 2 diabetes. Pharmacoepidemiology and Drug Safety. 2007.
21. Harris RP, Helfand M, Woolf SH, et al. Current methods of the third U.S. Preventive Services Task Force. American Journal of Preventive Medicine. 2001;20(3S):21-35.
22. Anonymous. Undertaking systematic reviews of research on effectiveness: CRD's guidance for those carrying out or commissioning reviews CRD Report Number 4 (2nd edition). York, UK: NHS Centre for Reviews and Dissemination; 2001. 4 (2nd edition).
23. Bruce S, Park JS, Fiedorek FT, Howlett HCS. Beta-cell response to metformin-glibenclamide combination tablets (Glucovance) in patients with type 2 diabetes. International Journal of Clinical Practice. Jul 2006;60(7):783-790.
24. Garber AJ, Donovan DS, Jr., Dandona P, Bruce S, Park J-S. Efficacy of glyburide/metformin tablets compared with initial monotherapy in type 2 diabetes. Journal of Clinical Endocrinology & Metabolism. Aug 2003;88(8):3598-3604.
25. Blonde L, Rosenstock J, Mooradian AD, Piper BA, Henry D. Glyburide/metformin combination product is safe and efficacious in patients with type 2 diabetes failing sulphonylurea therapy. Diabetes, Obesity & Metabolism. Nov 2002;4(6):368-375.
26. Marre M, Howlett H, Lehert P, Allavoine T. Improved glycaemic control with metformin-glibenclamide combined tablet therapy (Glucovance) in Type 2 diabetic patients inadequately controlled on metformin. Diabetic Medicine. Aug 2002;19(8):673-680.
27. Garber AJ, Larsen J, Schneider SH, Piper BA, Henry D, Glyburide/Metformin Initial Therapy Study G. Simultaneous glyburide/metformin therapy is superior to component monotherapy as an initial pharmacological treatment for type 2 diabetes. Diabetes, Obesity & Metabolism. May 2002;4(3):201-208.
28. Erle G, Lovise S, Stocchiero C, et al. A comparison of preconstituted, fixed combinations of low-dose glyburide plus metformin versus high-dose glyburide alone in the treatment of type 2 diabetic patients. Acta Diabetologica. Jun 1999;36(1-2):61-65.
29. Melikian C, White TJ, Vanderplas A, Dezii CM, Chang E. Adherence to oral antidiabetic therapy in a managed care organization: a comparison of monotherapy, combination therapy, and fixed-dose combination therapy. Clinical Therapeutics. Mar 2002;24(3):460-467.
30. Blonde L, Wogen J, Kreilick C, Seymour AA. Greater reductions in A1C in type 2 diabetic patients new to therapy with glyburide/metformin tablets as compared to glyburide co-administered with metformin. Diabetes, Obesity & Metabolism. Nov 2003;5(6):424-431.
THIS REPORT HAS BEEN SUPERSEDED
Final Report Drug Effectiveness Review Project
FDCP for diabetes and hyperlipidemia Page 54 of 73
31. Goldstein BJ, Pans M, Rubin CJ. Multicenter, randomized, double-masked, parallel-group assessment of simultaneous glipizide/metformin as second-line pharmacologic treatment for patients with type 2 diabetes mellitus that is inadequately controlled by a sulfonylurea. Clinical Therapeutics. Mar 2003;25(3):890-903.
32. Center for Drug Evaluation and Research. Metaglip Medical Review. http://www.fda.gov/cder/foi/nda/2002/21-460_Metaglip_Medr.pdf]. Accessed July 13, 2007.
33. Rosenstock J, Rood JA, Cobitz AR, Biswas N, Chou H, Garber A. Initial treatment with rosiglitazone/metformin fixed-dose combination therapy compared with monotherapy with either rosiglitazone or metformin in patients with uncontrolled type 2 diabetes. Diabetes, Obesity & Metabolism. 2006;8(6):650-660.
34. Vanderpoel DR, Hussein MA, Watson-Heidari T, Perry A. Adherence to a fixed-dose combination of rosiglitazone maleate/metformin hydrochloride in subjects with type 2 diabetes mellitus: a retrospective database analysis. Clinical Therapeutics. Dec 2004;26(12):2066-2075.
35. Chou HS. Initial treatment with fixed-dose combination rosiglitazone/glimepiride in patients with previously untreated type 2 diabetes. Diabetes, Obesity & Metabolism. 2007.
36. Takeda Pharmaceuticals North America Inc. Duetact® Product Information and Data Dossier: Submitted to the Drug Effectiveness Review Project; 2007.
37. Takeda Pharmaceuticals North America Inc. ACTOplus Met® Product Information and Data Dossier: Submitted to the Drug Effectiveness Review Project; 2007.
38. Merck & Co. Inc. Vytorin(r) Product Information and Data Dossier: Submitted to the Drug Effectiveness Review Project; 2007.
39. Schectman JM, Nadkarni MM, Voss JD. The association between diabetes metabolic control and drug adherence in an indigent population. Diabetes Care. Jun 2002;25(6):1015-1021.
40. Mateo J, Gil-Guillen VF, Mateo E, al. e. Multifactorial approach and adherence to prescribed oral medications in patients with type 2 diabetes. International Journal of Clinical Practice. 2006;60:422-428.
41. Lau DT, Nau DP. Oral antihyperglycemic medication nonadherence and subsequent hospitalization among individuals with type 2 diabetes. Diabetes Care. Sep 2004;27(9):2149-2153.
42. Krapek K, King K, Warren SS, et al. Medication adherence and associated hemoglobin A1c in type 2 diabetes. Annals of Pharmacotherapy. Sep 2004;38(9):1357-1362.
43. Hays R, Kravitz R, Mazel R, al. e. The impact of patient adherence on health outcomes for patients with chronic disease in the Medical Outcomes Study. Journal of Behavioral Medicine. 1994;17:347-360.
44. Grant RW, Devita NG, Singer DE, al. e. Polypharmacy and medication adherence in patients with type 2 diabetes. Diabetes Care. 2003;26:1408-1412.
45. Brown JB, Nichols GA, Glauber HS, Bakst A. Ten-year follow-up of antidiabetic drug use, nonadherence, and mortality in a defined population with type 2 diabetes mellitus. Clinical Therapeutics. Jun 1999;21(6):1045-1057.
46. Balkrishnan R, Rajagopalan R, Camacho F, Huston S, Murray F, Anderson R. Predictors of medication adherence and associated health care costs in an older population with type
THIS REPORT HAS BEEN SUPERSEDED
Final Report Drug Effectiveness Review Project
FDCP for diabetes and hyperlipidemia Page 55 of 73
2 diabetes mellitus: a longitudinal cohort study. Clinical Therapeutics. 2003;25(11):2958-2971.
47. Duckworth W, Marcelli M, Padden M, et al. Improvements in glycemic control in type 2 diabetes patients switched from sulfonylurea coadministered with metformin to glyburide-metformin tablets. Journal of Managed Care Pharmacy. May-Jun 2003;9(3):256-262.
48. Garber A, Marre M, Blonde L, et al. Influence of initial hyperglycaemia, weight and age on the blood glucose lowering efficacy and incidence of hypoglycaemic symptoms with a single-tablet metformin-glibenclamide therapy (Glucovance) in type 2 diabetes. Diabetes, Obesity & Metabolism. May 2003;5(3):171-179.
49. Garber AJ, Bruce S, Fiedorek FT. Durability of efficacy and long-term safety profile of glyburide/metformin tablets in patients with type 2 diabetes mellitus: an open-label extension study. Clinical Therapeutics. Sep 2002;24(9):1401-1413.
50. American Diabetes Association. Diagnosis and classification of diabetes mellitus. . Diabetes Care. 2005;28(Suppl. 1):S37-S42.
51. Tarlov AR, Ware JE, Greenfield S, Nelson EC, Perrin E, Zubkoff M. The Medical Outcomes Study: An Application of Methods for Monitoring the Results of Medical Care. JAMA : the Journal of the American Medical Association. 1989;262(7):925-930.
52. Hunninghake DB, McGovern ME, Koren M, et al. A dose-ranging study of a new, once-daily, dual-component drug product containing niacin extended-release and lovastatin. Clinical Cardiology. Mar 2003;26(3):112-118.
53. Insull W, Jr., McGovern ME, Schrott H, et al. Efficacy of extended-release niacin with lovastatin for hypercholesterolemia: assessing all reasonable doses with innovative surface graph analysis. Archives of Internal Medicine. May 24 2004;164(10):1121-1127.
54. Bays HE, Dujovne CA, McGovern ME, et al. Comparison of once-daily, niacin extended-release/lovastatin with standard doses of atorvastatin and simvastatin (the ADvicor Versus Other Cholesterol-Modulating Agents Trial Evaluation [ADVOCATE]). American Journal of Cardiology. Mar 15 2003a;91(6):667-672.
55. Food and Drug Administration. Advicor Product Label. 2005;2007(July 5). 56. Rubenfire M, Impact of Medical Subspecialty on Patient Compliance to Treatment Study
G. Safety and compliance with once-daily niacin extended-release/lovastatin as initial therapy in the Impact of Medical Subspecialty on Patient Compliance to Treatment (IMPACT) study. American Journal of Cardiology. Aug 1 2004;94(3):306-311.
57. Kashyap ML, McGovern ME, Berra K, et al. Long-term safety and efficacy of a once-daily niacin/lovastatin formulation for patients with dyslipidemia. American Journal of Cardiology. Mar 15 2002;89(6):672-678.
58. LaFleur J, Thompson CJ, Joish VN, Charland SL, Oderda GM, Brixner DI. Adherence and persistence with single-dosage form extended-release niacin/lovastatin compared with statins alone or in combination with extended-release niacin. Annals of Pharmacotherapy. Jul-Aug 2006;40(7-8):1274-1279.
59. Ballantyne CM, Abate N, Yuan Z, King TR, Palmisano J. Dose-comparison study of the combination of ezetimibe and simvastatin (Vytorin) versus atorvastatin in patients with hypercholesterolemia: the Vytorin Versus Atorvastatin (VYVA) study. American Heart Journal. Mar 2005;149(3):464-473.
60. Barrios V, Amabile N, Paganelli F, et al. Lipid-altering efficacy of switching from atorvastatin 10 mg/day to ezetimibe/simvastatin 10/20 mg/day compared to doubling the
THIS REPORT HAS BEEN SUPERSEDED
Final Report Drug Effectiveness Review Project
FDCP for diabetes and hyperlipidemia Page 56 of 73
dose of atorvastatin in hypercholesterolaemic patients with atherosclerosis or coronary heart disease. International Journal of Clinical Practice. Dec 2005;59(12):1377-1386.
61. Goldberg RB, Guyton JR, Mazzone T, et al. Ezetimibe/simvastatin vs atorvastatin in patients with type 2 diabetes mellitus and hypercholesterolemia: the VYTAL study. Mayo Clinic Proceedings. Dec 2006;81(12):1579-1588.
62. Catapano AL, Davidson MH, Ballantyne CM, et al. Lipid-altering efficacy of the ezetimibe/simvastatin single tablet versus rosuvastatin in hypercholesterolemic patients. Current Medical Research & Opinion. Oct 2006;22(10):2041-2053.
63. Bays HE, Ose L, Fraser N, et al. A multicenter, randomized, double-blind, placebo-controlled, factorial design study to evaluate the lipid-altering efficacy and safety profile of the ezetimibe/simvastatin tablet compared with ezetimibe and simvastatin monotherapy in patients with primary hypercholesterolemia. Clinical Therapeutics. Nov 2004;26(11):1758-1773.
64. Hildemann SK, Barho C, Karmann B, Darius H, Bestehorn K. Dual cholesterol inhibition with ezetimibe/simvastatin in pre-treated hypercholesterolaemic patients with coronary heart disease or diabetes mellitus: prospective observational cohort studies in clinical practice. Current Medical Research & Opinion. Apr 2007;23(4):713-719.
65. Food and Drug Administration. Vytorin FDA Medical Review. 2004;2007(July 5). 66. Catapano A, Brady WE, King TR, Palmisano J. Lipid altering-efficacy of ezetimibe co-
administered with simvastatin compared with rosuvastatin: a meta-analysis of pooled data from 14 clinical trials. Current Medical Research & Opinion. Jul 2005;21(7):1123-1130.
67. Parris ES, Lawrence DB, Mohn LA, Long LB. Adherence to statin therapy and LDL cholesterol goal attainment by patients with diabetes and dyslipidemia. Diabetes Care. Mar 2005;28(3):595-599.
THIS REPORT HAS BEEN SUPERSEDED
Final Report Drug Effectiveness Review Project
FDCP for diabetes and hyperlipidemia Page 57 of 73

Appendix A. Systematic review of Fixed-dose Combination Drug Products (FDCP) for the treatment of diabetes and hyperlipidemia Diabetes 1. FDCP as a first-line treatment option in patients with type-2 diabetes
2. FDCP as a second-line treatment option in type-2 diabetes
Decision to Treat Drug naive
Patient with Type 2 Diabetes
with Drugs (1st line treatment)
Adverse effects
Long-term health outcomes: •Cardiovascular disease •Nephropathy •Neuropathy •Retinopathy
Combination Product
Improvement in HbA1C
2a
Improvement in HbA1C
1a
6a
Monotherapy
1a
2a
6a
Patient with
Combination Product
Improvement in HbA1C
2b
Improvement in HbA1C
1b
6a
2b
Long-term health outcomes: •Cardiovascular disease •Nephropathy •Neuropathy •Retinopathy
1b
Monotherapy
6a
Adverse effects Type 2 Diabetes Who has failed
1st line treatment
THIS REPORT HAS BEEN SUPERSEDED
Final Report Drug Effectiveness Review Project
FDCP for diabetes and hyperlipidemia Page 58 of 73
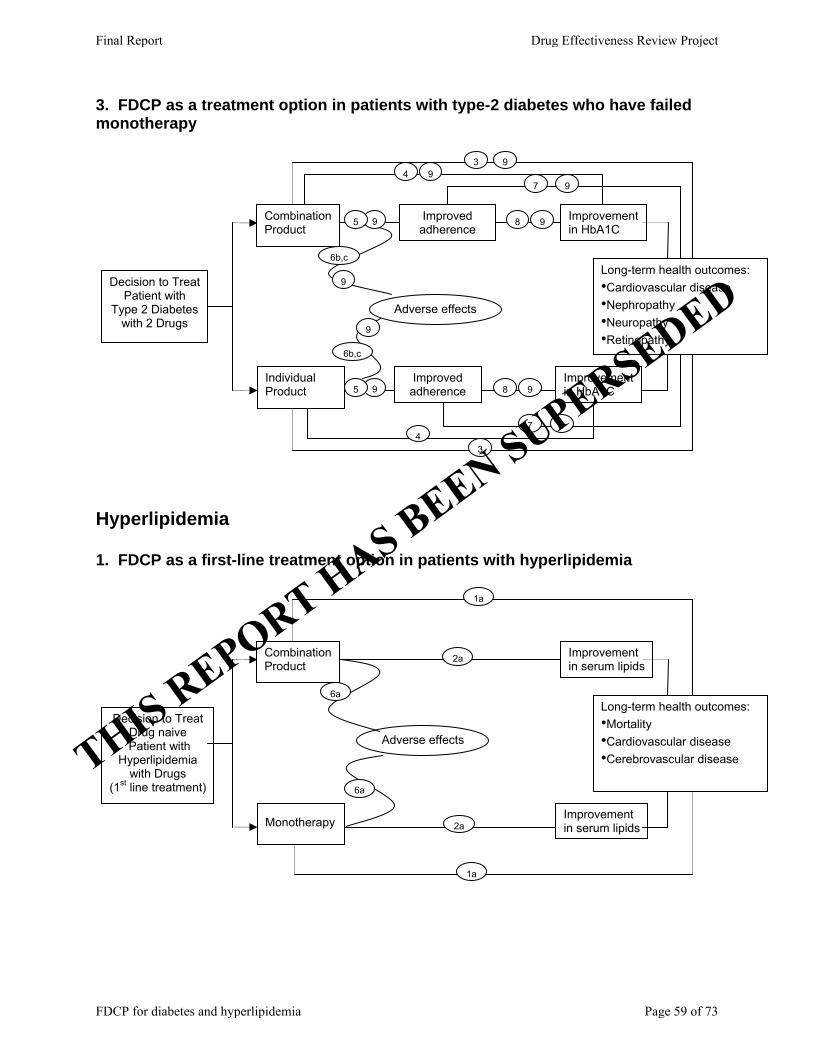
3. FDCP as a treatment option in patients with type-2 diabetes who have failed monotherapy
Decision to Treat Patient with
Type 2 Diabetes with 2 Drugs
Adverse effects
Long-term health outcomes: •Cardiovascular disease •Nephropathy •Neuropathy •Retinopathy
Combination Product
Improvement in HbA1C
9 Improved adherence
Improvement in HbA1C
3
6b,c
7 4
9
Individual Product
9
5 9
9
9
8 5
9 9
6b,c
4
Improved adherence 8 9
9 7
3
Hyperlipidemia 1. FDCP as a first-line treatment option in patients with hyperlipidemia
Decision to Treat Drug naive
Patient with Hyperlipidemia
with Drugs (1st line treatment)
Adverse effects
Long-term health outcomes: •Mortality •Cardiovascular disease •Cerebrovascular disease
Combination Product
Improvement in serum lipids
2a
Improvement in serum lipids
1a
6a
Monotherapy
6a
2a
1a
THIS REPORT HAS BEEN SUPERSEDED
Final Report Drug Effectiveness Review Project
FDCP for diabetes and hyperlipidemia Page 59 of 73

2. FDCP as a second-line treatment option in hyperlipidemia
3. FDCP as a treatment option in patients with hyperlipidemia who have failed monotherapy `
Patient with Hyperlipidemia who has failed
1st line treatment
Combination Product
Improvement in serum lipids
2b
Improvement In serum lipids
1b
6a Long-term health outcomes: •Mortality •Cardiovascular disease •Cerebrovascular disease
Monotherapy
1b
2b
Decision to Treat Patient with
Hyperlipidemia with 2 Drugs
Adverse effects
Long-term health outcomes: •Mortality •Cardiovascular disease •Cerebrovascular disease
Combination Product
Improvement In serum lipids
9 Improved adherence
Improvement In serum lipids
3
6b,c
7 4
9
Individual Product
6b,c
9
5 9
9
9
8 5
9 9
4
Improved adherence 8 9
9 7
3
6a
Adverse effects
THIS REPORT HAS BEEN SUPERSEDED
Final Report Drug Effectiveness Review Project
FDCP for diabetes and hyperlipidemia Page 60 of 73
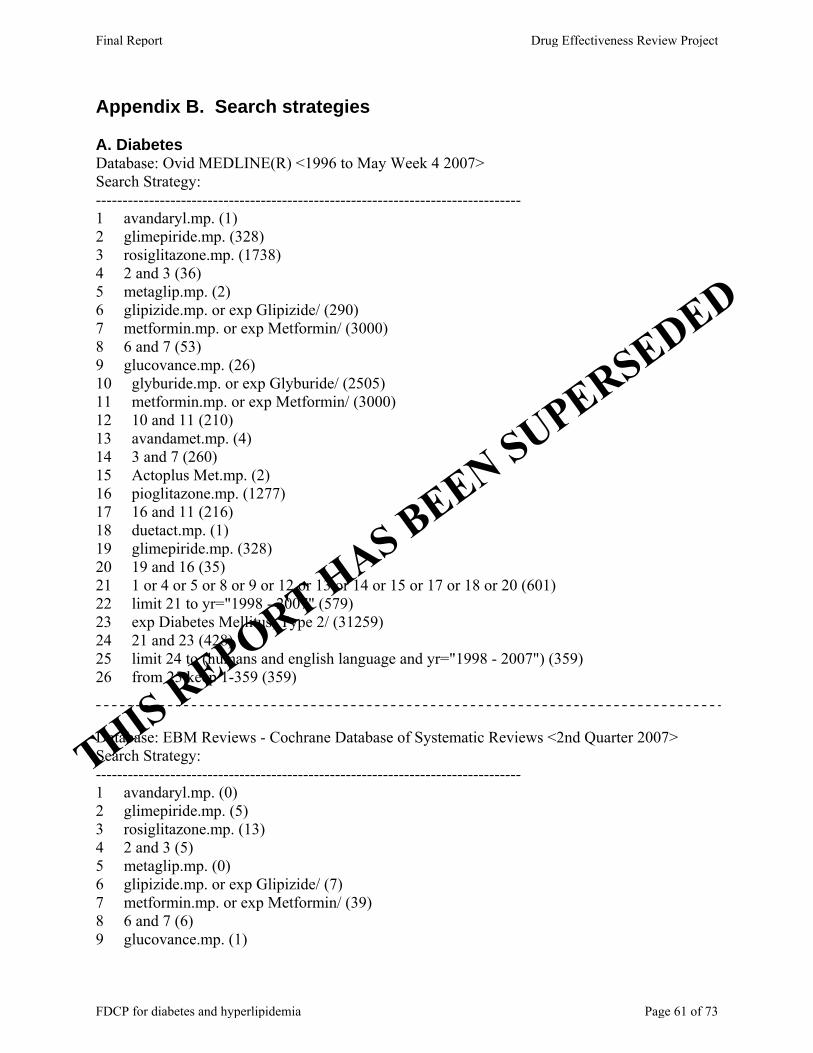
Appendix B. Search strategies A. Diabetes Database: Ovid MEDLINE(R) <1996 to May Week 4 2007> Search Strategy: -------------------------------------------------------------------------------- 1 avandaryl.mp. (1) 2 glimepiride.mp. (328) 3 rosiglitazone.mp. (1738) 4 2 and 3 (36) 5 metaglip.mp. (2) 6 glipizide.mp. or exp Glipizide/ (290) 7 metformin.mp. or exp Metformin/ (3000) 8 6 and 7 (53) 9 glucovance.mp. (26) 10 glyburide.mp. or exp Glyburide/ (2505) 11 metformin.mp. or exp Metformin/ (3000) 12 10 and 11 (210) 13 avandamet.mp. (4) 14 3 and 7 (260) 15 Actoplus Met.mp. (2) 16 pioglitazone.mp. (1277) 17 16 and 11 (216) 18 duetact.mp. (1) 19 glimepiride.mp. (328) 20 19 and 16 (35) 21 1 or 4 or 5 or 8 or 9 or 12 or 13 or 14 or 15 or 17 or 18 or 20 (601) 22 limit 21 to yr="1998 - 2007" (579) 23 exp Diabetes Mellitus, Type 2/ (31259) 24 21 and 23 (428) 25 limit 24 to (humans and english language and yr="1998 - 2007") (359) 26 from 25 keep 1-359 (359) Database: EBM Reviews - Cochrane Database of Systematic Reviews <2nd Quarter 2007> Search Strategy: -------------------------------------------------------------------------------- 1 avandaryl.mp. (0) 2 glimepiride.mp. (5) 3 rosiglitazone.mp. (13) 4 2 and 3 (5) 5 metaglip.mp. (0) 6 glipizide.mp. or exp Glipizide/ (7) 7 metformin.mp. or exp Metformin/ (39) 8 6 and 7 (6) 9 glucovance.mp. (1)
THIS REPORT HAS BEEN SUPERSEDED
Final Report Drug Effectiveness Review Project
FDCP for diabetes and hyperlipidemia Page 61 of 73

10 glyburide.mp. or exp Glyburide/ (6) 11 metformin.mp. or exp Metformin/ (39) 12 10 and 11 (6) 13 avandamet.mp. (0) 14 3 and 7 (13) 15 Actoplus Met.mp. (0) 16 pioglitazone.mp. (13) 17 16 and 11 (13) 18 duetact.mp. (0) 19 glimepiride.mp. (5) 20 19 and 16 (4) 21 1 or 4 or 5 or 8 or 9 or 12 or 13 or 14 or 15 or 17 or 18 or 20 (17) 22 from 21 keep 1-17 (17) Database: EBM Reviews - Cochrane Central Register of Controlled Trials <2nd Quarter 2007> Search Strategy: -------------------------------------------------------------------------------- 1 avandaryl.mp. (0) 2 glimepiride.mp. (110) 3 rosiglitazone.mp. (215) 4 2 and 3 (16) 5 metaglip.mp. (0) 6 glipizide.mp. or exp Glipizide/ (164) 7 metformin.mp. or exp Metformin/ (810) 8 6 and 7 (21) 9 glucovance.mp. (4) 10 glyburide.mp. or exp Glyburide/ (431) 11 metformin.mp. or exp Metformin/ (810) 12 10 and 11 (94) 13 avandamet.mp. (0) 14 3 and 7 (60) 15 Actoplus Met.mp. (0) 16 pioglitazone.mp. (177) 17 16 and 11 (51) 18 duetact.mp. (0) 19 glimepiride.mp. (110) 20 19 and 16 (16) 21 1 or 4 or 5 or 8 or 9 or 12 or 13 or 14 or 15 or 17 or 18 or 20 (216) 22 Type 2 diabetes.mp. [mp=title, original title, abstract, mesh headings, heading words, keyword] (2368) 23 Type II diabetes.mp. [mp=title, original title, abstract, mesh headings, heading words, keyword] (383) 24 22 or 23 (2735) 25 21 and 24 (139) 26 limit 25 to yr="1998 - 2007" (132)
THIS REPORT HAS BEEN SUPERSEDED
Final Report Drug Effectiveness Review Project
FDCP for diabetes and hyperlipidemia Page 62 of 73
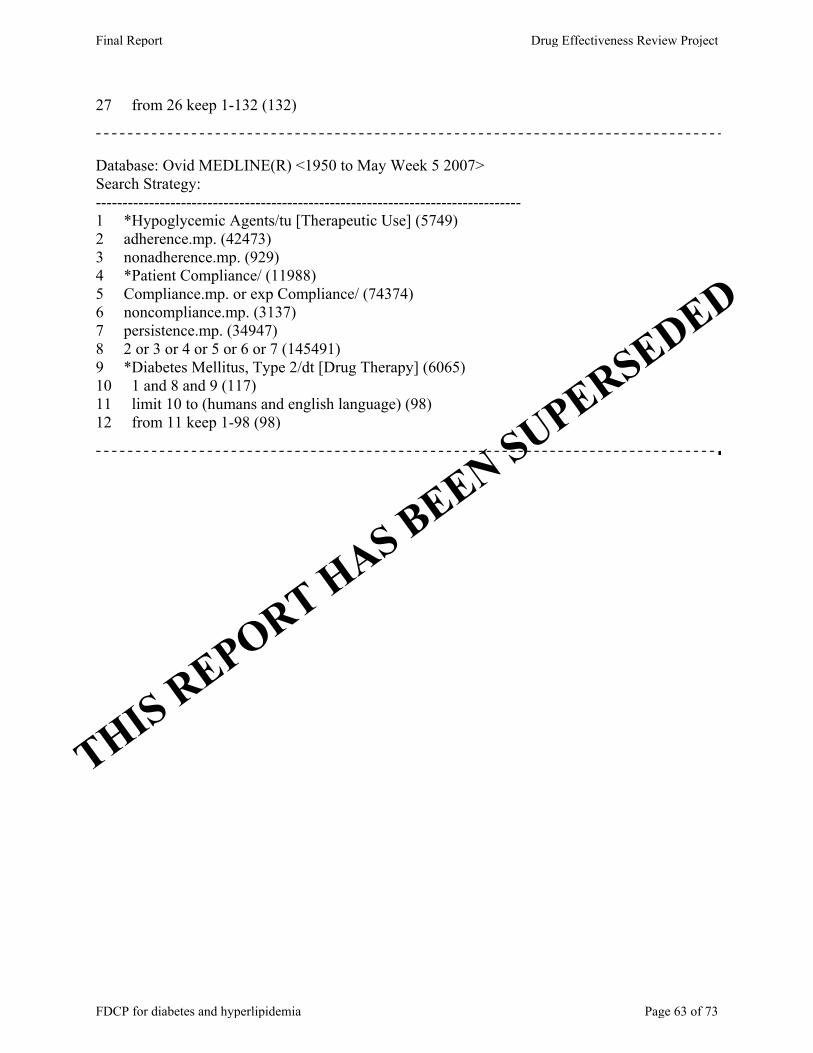
27 from 26 keep 1-132 (132) Database: Ovid MEDLINE(R) <1950 to May Week 5 2007> Search Strategy: -------------------------------------------------------------------------------- 1 *Hypoglycemic Agents/tu [Therapeutic Use] (5749) 2 adherence.mp. (42473) 3 nonadherence.mp. (929) 4 *Patient Compliance/ (11988) 5 Compliance.mp. or exp Compliance/ (74374) 6 noncompliance.mp. (3137) 7 persistence.mp. (34947) 8 2 or 3 or 4 or 5 or 6 or 7 (145491) 9 *Diabetes Mellitus, Type 2/dt [Drug Therapy] (6065) 10 1 and 8 and 9 (117) 11 limit 10 to (humans and english language) (98) 12 from 11 keep 1-98 (98)
THIS REPORT HAS BEEN SUPERSEDED
Final Report Drug Effectiveness Review Project
FDCP for diabetes and hyperlipidemia Page 63 of 73

B. Hyperlipidemia Database: Ovid MEDLINE(R) <1996 to May Week 3 2007> Search Strategy: -------------------------------------------------------------------------------- 1 vytorin.mp. (8) 2 advicor.mp. (7) 3 ezetimibe.mp. (500) 4 simvastatin.mp. or Simvastatin/ (3105) 5 3 and 4 (115) 6 lovastatin.mp. or exp Lovastatin/ (4110) 7 niacin.mp. or exp Niacin/ (1535) 8 6 and 7 (105) 9 1 or 2 or 5 or 8 (215) 10 limit 9 to (humans and english language) (181) 11 from 10 keep 1-181 (181) Database: EBM Reviews - Cochrane Central Register of Controlled Trials <2nd Quarter 2007> Search Strategy: -------------------------------------------------------------------------------- 1 vytorin.mp. [mp=title, original title, abstract, mesh headings, heading words, keyword] (1) 2 advicor.mp. [mp=title, original title, abstract, mesh headings, heading words, keyword] (2) 3 ezetimibe.mp. [mp=title, original title, abstract, mesh headings, heading words, keyword] (82) 4 simvastatin.mp. [mp=title, original title, abstract, mesh headings, heading words, keyword] (1022) 5 3 and 4 (35) 6 lovastatin.mp. [mp=title, original title, abstract, mesh headings, heading words, keyword] (641) 7 niacin.mp. [mp=title, original title, abstract, mesh headings, heading words, keyword] (261) 8 6 and 7 (41) 9 1 or 2 or 5 or 8 (76) 10 limit 9 to yr="1996 - 2007" (56) 11 from 10 keep 1-56 (56) Database: Ovid MEDLINE(R) <1950 to May Week 5 2007> Search Strategy: -------------------------------------------------------------------------------- 1 *Hyperlipidemia/bl, dt [Blood, Drug Therapy] (4277) 2 adherence.mp. (42473) 3 nonadherence.mp. (929) 4 *Patient Compliance/ (11988) 5 *Compliance/ (93) 6 compliance.mp. (74374)
THIS REPORT HAS BEEN SUPERSEDED
Final Report Drug Effectiveness Review Project
FDCP for diabetes and hyperlipidemia Page 64 of 73

7 noncompliance.mp. (3137) 8 persistence.mp. (34947) 9 2 or 3 or 4 or 5 or 6 or 7 or 8 (145491) 10 drug administration schedule.mp. or exp Drug Administration Schedule/ (60671) 11 *Antilipemic Agents/ad, tu [Administration & Dosage, Therapeutic Use] (3067) 12 10 or 11 (63678) 13 1 and 9 and 12 (57) 14 from 13 keep 1-57 (57)
THIS REPORT HAS BEEN SUPERSEDED
Final Report Drug Effectiveness Review Project
FDCP for diabetes and hyperlipidemia Page 65 of 73
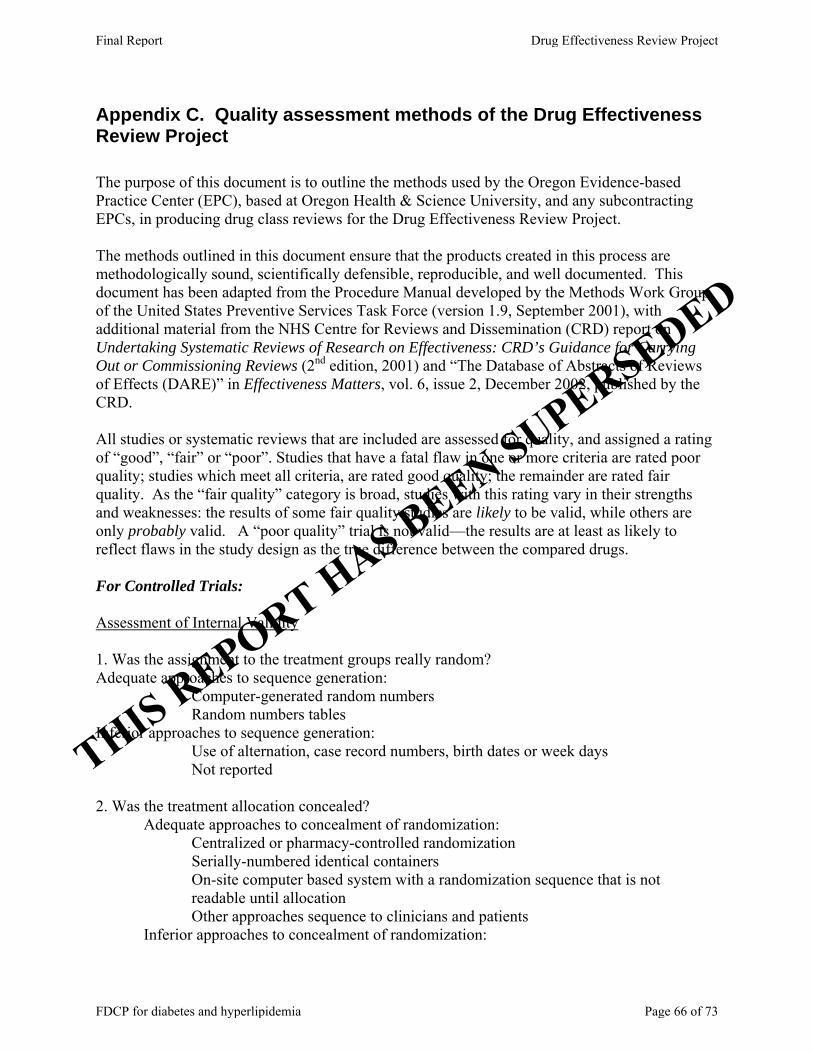
Appendix C. Quality assessment methods of the Drug Effectiveness Review Project The purpose of this document is to outline the methods used by the Oregon Evidence-based Practice Center (EPC), based at Oregon Health & Science University, and any subcontracting EPCs, in producing drug class reviews for the Drug Effectiveness Review Project. The methods outlined in this document ensure that the products created in this process are methodologically sound, scientifically defensible, reproducible, and well documented. This document has been adapted from the Procedure Manual developed by the Methods Work Group of the United States Preventive Services Task Force (version 1.9, September 2001), with additional material from the NHS Centre for Reviews and Dissemination (CRD) report on Undertaking Systematic Reviews of Research on Effectiveness: CRD’s Guidance for Carrying Out or Commissioning Reviews (2nd edition, 2001) and “The Database of Abstracts of Reviews of Effects (DARE)” in Effectiveness Matters, vol. 6, issue 2, December 2002, published by the CRD. All studies or systematic reviews that are included are assessed for quality, and assigned a rating of “good”, “fair” or “poor”. Studies that have a fatal flaw in one or more criteria are rated poor quality; studies which meet all criteria, are rated good quality; the remainder are rated fair quality. As the “fair quality” category is broad, studies with this rating vary in their strengths and weaknesses: the results of some fair quality studies are likely to be valid, while others are only probably valid. A “poor quality” trial is not valid—the results are at least as likely to reflect flaws in the study design as the true difference between the compared drugs. For Controlled Trials: Assessment of Internal Validity 1. Was the assignment to the treatment groups really random? Adequate approaches to sequence generation: Computer-generated random numbers Random numbers tables Inferior approaches to sequence generation: Use of alternation, case record numbers, birth dates or week days
Not reported 2. Was the treatment allocation concealed? Adequate approaches to concealment of randomization: Centralized or pharmacy-controlled randomization Serially-numbered identical containers
On-site computer based system with a randomization sequence that is not readable until allocation Other approaches sequence to clinicians and patients
Inferior approaches to concealment of randomization:
THIS REPORT HAS BEEN SUPERSEDED
Final Report Drug Effectiveness Review Project
FDCP for diabetes and hyperlipidemia Page 66 of 73

Use of alternation, case record numbers, birth dates or week days Open random numbers lists
Serially numbered envelopes (even sealed opaque envelopes can be subject to manipulation) Not reported
3. Were the groups similar at baseline in terms of prognostic factors? 4. Were the eligibility criteria specified? 5. Were outcome assessors blinded to the treatment allocation? 6. Was the care provider blinded? 7. Was the patient kept unaware of the treatment received? 8. Did the article include an intention-to-treat analysis, or provide the data needed to calculate it (i.e., number assigned to each group, number of subjects who finished in each group, and their results)? 9. Did the study maintain comparable groups? 10. Did the article report attrition, crossovers, adherence, and contamination? 11. Is there important differential loss to follow-up or overall high loss to follow-up? (give numbers in each group) Assessment of External Validity (Generalizability) 1. How similar is the population to the population to whom the intervention would be applied? 2. How many patients were recruited? 3. What were the exclusion criteria for recruitment? (Give numbers excluded at each step) 4. What was the funding source and role of funder in the study? 5. Did the control group receive the standard of care? 6. What was the length of follow-up? (Give numbers at each stage of attrition)
THIS REPORT HAS BEEN SUPERSEDED
Final Report Drug Effectiveness Review Project
FDCP for diabetes and hyperlipidemia Page 67 of 73

For Non-randomized Studies Assessment of Internal Validity 1. Was the selection of patients for inclusion non-biased (Was any group of patients systematically excluded)? 2. Is there important differential loss to follow-up or overall high loss to follow-up? (Give numbers in each group)
3. Were the events investigated specified and defined? 4. Was there a clear description of the techniques used to identify the events? 5. Was there non-biased and accurate ascertainment of events (independent ascertainers; validation of ascertainment technique)? 6. Were potential confounding variables and risk factors identified and examined using acceptable statistical techniques? 7. Did the duration of follow-up correlate to reasonable timing for investigated events? (Does it meet the stated threshold?) Assessment of External Validity 1. Was the description of the population adequate? 2. How similar is the population to the population to whom the intervention would be applied? 3. How many patients were recruited? 4. What were the exclusion criteria for recruitment? (Give numbers excluded at each step) 5. What was the funding source and role of funder in the study? Systematic Reviews: Is there a clear review question and inclusion/exclusion criteria reported relating to the primary studies?
A good quality review should focus on a well-defined question or set of questions, which ideally will refer to the inclusion/exclusion criteria by which decisions are made on whether to include or exclude primary studies. The criteria should relate to the four components of study design, indications (patient populations), interventions (drugs), and outcomes of interest. In addition, details should be reported relating to the process of decision-making,
THIS REPORT HAS BEEN SUPERSEDED
Final Report Drug Effectiveness Review Project
FDCP for diabetes and hyperlipidemia Page 68 of 73

i.e., how many reviewers were involved, whether the studies were examined independently, and how disagreements between reviewers were resolved.
1. Is there evidence of a substantial effort to search for all relevant research?
This is usually the case if details of electronic database searches and other identification strategies are given. Ideally, details of the search terms used, date and language restrictions should be presented. In addition, descriptions of hand-searching, attempts to identify unpublished material, and any contact with authors, industry, and research institutes should be provided. The appropriateness of the database(s) searched by the authors should also be considered, e.g. if MEDLINE is searched for a review looking at health education, then it is unlikely that all relevant studies will have been located.
2. Is the validity of included studies adequately assessed?
A systematic assessment of the quality of primary studies should include an explanation of the criteria used (e.g., method of randomization, whether outcome assessment was blinded, whether analysis was on an intention-to-treat basis). Authors may use either a published checklist or scale, or one that they have designed specifically for their review. Again, the process relating to the assessment should be explained (i.e. how many reviewers involved, whether the assessment was independent, and how discrepancies between reviewers were resolved).
3. Is sufficient detail of the individual studies presented?
The review should demonstrate that the studies included are suitable to answer the question posed and that a judgement on the appropriateness of the authors' conclusions can be made. If a paper includes a table giving information on the design and results of the individual studies, or includes a narrative description of the studies within the text, this criterion is usually fulfilled. If relevant, the tables or text should include information on study design, sample size in each study group, patient characteristics, description of interventions, settings, outcome measures, follow-up, drop-out rate (withdrawals), effectiveness results and adverse events.
4. Are the primary studies summarized appropriately?
The authors should attempt to synthesize the results from individual studies. In all cases, there should be a narrative summary of results, which may or may not be accompanied by a quantitative summary (meta-analysis).
For reviews that use a meta-analysis, heterogeneity between studies should be assessed using statistical techniques. If heterogeneity is present, the possible reasons (including chance) should be investigated. In addition, the individual evaluations should be weighted in some way (e.g., according to sample size, or inverse of the variance) so that studies that are considered to provide the most reliable data have greater impact on the summary statistic.
THIS REPORT HAS BEEN SUPERSEDED
Final Report Drug Effectiveness Review Project
FDCP for diabetes and hyperlipidemia Page 69 of 73
Appendix D. Excluded studies for type 2 diabetes 1. Bailey CJ, Bagdonas A, Rubes J, et al. Rosiglitazone/metformin fixed-dose combination
compared with uptitrated metformin alone in type 2 diabetes mellitus: a 24-week, multicenter, randomized, double-blind, parallel-group study. Clinical Therapeutics. Oct 2005;27(10):1548-1561.
2. Blonde L, Joyal S, Henry D, Howlett H. Durable efficacy of metformin/glibenclamide combination tablets (Glucovance) during 52 weeks of open-label treatment in type 2 diabetic patients with hyperglycaemia despite previous sulphonylurea monotherapy. International Journal of Clinical Practice. Sep 2004;58(9):820-826.
3. Chousa FP, Guillen VFG, Otero MD, Beltran DO, Lopez RP, Sanchez JM. Usefulness of six indirect methods to evaluate drug therapy compliance in non-insulin-dependent diabetes mellitus. Revista Clinica Espanola. 1997;197:555-559.
4. Diehl A, Bauer R, Sugarek N. Correlates of medication compliance in non-insulin-dependent diabetes mellitus. Southern Medical Journal. 1987;80(3):332-335.
5. Donahue SR, Turner KC, Patel S. Pharmacokinetics and pharmacodynamics of glyburide/metformin tablets (Glucovance) versus equivalent doses of glyburide and metformin in patients with type 2 diabetes. Clinical Pharmacokinetics. 2002;41(15):1301-1309.
6. Garber A, Klein E, Bruce S, Sankoh S, Mohideen P. Metformin-glibenclamide versus metformin plus rosiglitazone in patients with type 2 diabetes inadequately controlled on metformin monotherapy. Diabetes, Obesity & Metabolism. Mar 2006;8(2):156-163.
7. Gerrits CM, Bhattacharya M, Manthena S, R. B, Perez A, Kupfer S. A comparison of pioglitazone and rosiglitazone for hospitalization for acute myocardial infarction in type 2 diabetes. Pharmacoepidemiology and Drug Safety. 2007.
8. Glasgow R, McCaul K, Schafer L. Self-care behaviors and glycemic control in type I diabetes. Journal of Chronic Diseases. 1987;40(5):399-412.
9. Gulias-Herrero A, Aguilar-Salinas CA, Gomez-Perez FJ, Rull JA. The combination metformin/glyburide exerts its hypoglycemic effect mainly by increasing insulin secretion: a controlled, randomized, double-blind, crossover study. Diabetes, Nutrition & Metabolism - Clinical & Experimental. Oct-Dec 2003;16(5-6):268-276.
10. Home PD, Bailey CJ, Donaldson J, Chen H, Stewart MW. A double blind randomized study comparing the effects of continuing rosiglitazone+metformin therapy when starting insulin therapy in people with type 2 diabetes. Diabetic medicine : a journal of the British Diabetic Association. 2007;24:618-625.
11. O'Connor PJ, Fragneto R, Coulehan J, Crabtree BF. Metabolic control in non-insulin-dependent diabetes mellitus: factors associated with patient outcomes. Diabetes Care. Nov-Dec 1987;10(6):697-701.
12. Peterson GM, McLean S, Senator GB. Determinants of patient compliance, control, presence of complications, and handicap in non-insulin-dependent diabetes. Aust N Z J Med. 1984;14:135–141.
13. Rosenstock J, Rood JA, Cobitz AR, Huang C, Garber A. Improvement in glycaemic control with rosiglitazone/metformin fixed-dose combination therapy in patients with type 2 diabetes with very poor glycaemic control. Diabetes, Obesity & Metabolism. 2006;8(6):643-649.
14. Sclar DA, Robison LM, Skaer TL, Dickson WM, Kozma CM, Reeder CE. Sulfonylurea
THIS REPORT HAS BEEN SUPERSEDED
Final Report Drug Effectiveness Review Project
FDCP for diabetes and hyperlipidemia Page 70 of 73

pharmacotherapy regimen adherence in a Medicaid population: influence of age, gender, and race. Diabetes Educator. 537-8, 1999 Jul-Aug 1999;25(4):531-532.
15. Selby JV, Ettinger B, Swain BE, Brown JB. First 20 months' experience with use of metformin for type 2 diabetes in a large health maintenance organization. Diabetes Care. Jan 1999;22(1):38-44.
16. Shenolikar RA, Balkrishnan R, Camacho FT, Whitmire JT, Anderson RT. Comparison of medication adherence and associated health care costs after introduction of pioglitazone treatment in African Americans versus all other races in patients with type 2 diabetes mellitus: a retrospective data analysis. Clinical Therapeutics. Aug 2006;28(8):1199-1207.
17. Spoelstra JA, Stolk RP, Heerdink ER, et al. Refill compliance in type 2 diabetes mellitus: a predictor of switching to insulin therapy? Pharmacoepidemiology & Drug Safety. Mar 2003;12(2):121-127.
18. Venter HL, Joubert PH, Foukaridis GN. Compliance in black patients with non-insulin-dependent diabetes mellitus receiving oral hypoglycaemic therapy. South African Medical Journal Suid-Afrikaanse Tydskrif Vir Geneeskunde. May 4 1991;79(9):549-551.
19. Wan Mohamad WB, Tun Fizi A, Ismail RB, Mafauzy M. Efficacy and safety of single versus multiple daily doses of glibenclamide in type 2 diabetes mellitus. Diabetes Research & Clinical Practice. Aug 2000;49(2-3):93-99.
20. Watkins J, Williams T, Martin D, Hogan M, Anderson E. A study of diabetic patients at home. American Journal of Public Health. 1967;57:452-457.
21. Wooldridge K, Wallston K, Graber A, al. e. The relationship between health beliefs, adherence, and metabolic control of diabetes. Diabetes Educator. 1992;18:495-500.
Excluded studies-Hyperlipidemia 1. Ballantyne CM, Blazing MA, King TR, Brady WE, Palmisano J. Efficacy and safety of
ezetimibe co-administered with simvastatin compared with atorvastatin in adults with hypercholesterolemia. American Journal of Cardiology. Jun 15 2004;93(12):1487-1494.
2. Ballantyne CM AN, Yuan Z, et al. . Ezetimibe/simvastatin versus atorvastatin for patients who have diabetes mellitus and hypercholesterolemia. Diabetes. 2005;54(suppl 1):A235-A235.
3. Ballantyne CM DM, Catapano AL, et al. Evaluation of Ezetimibe/Simvastatin Versus Rosuvastatin in Hypercholesteroleic Patients with Type 2 Diabetes or Metabolic Syndrome. Diabetes. 2006;55(Suppl 1):A520-A520.
4. Bissonnette S, Habib R, Sampalis F, Boukas S. Efficacy and tolerability of ezetimibe 10mg/day coadministered with statins in patients with hypercholesterolemia who do not achieve target LDL-C while on statin monotherapy: A Canadian, multicenter, prospective study-the ezetrol add-on study. Canadian Journal of Cardiology. 2006;22(12):1035-1044.
5. Constance C, S. W, Chung N ea. Efficacy of ezetimibe/simvastatin 10/20mg and 10/40mg compared with atorvastatin 20mg in patients with type 2 diabetes mellitus. Diabetes, Obesity and Metabolism. 2007;9:575-584.
6. Constance C WS, Chung N, et al. Efficacy of Ezetimibe/Simvastatin 10/20 mg and 10/40 mg Compared to Atorvastain 20 mg in Type 2 Diabetic Patients. Diabetes. 2006;55(Suppl 1):A522-A522.
7. Cruz-Fernandez JM, Bedarida GV, Adgey CA, Allen C, Johnson-Levonas AO, Massaad
THIS REPORT HAS BEEN SUPERSEDED
Final Report Drug Effectiveness Review Project
FDCP for diabetes and hyperlipidemia Page 71 of 73
R. Efficacy and safety of ezetimibe co-administered with ongoing atorvastatin therapy in achieving low density lipoprotein goal in patients with hypercholesterolemia and coronary heart disease. International Journal of Clinical Practice. 2005;59(6):619-627.
8. Dobs AS. Coadministration of Ezetimibe and Simvastatin. Journal of American College of Cardiology.41(6 (supplement A):227A).
9. Feldman T DM, Shah A, et al. . Low density lipoprotein lowering efficacy of the ezetimibe/simvastatin combination tablet in a large cohort of elderly patients with primary hypercholesterolemia. J Am Geriatr Soc. . 2005;53(4):S78-S79.
10. Gagne C, Bays HE, Weiss SR, et al. Efficacy and safety of ezetimibe added to ongoing statin therapy for treatment of patients with primary hypercholesterolemia.[see comment]. American Journal of Cardiology. 2002;90(10):1084-1091.
11. O'Donnell DC, Brown CM, Piziak VK. Alternative therapy use and adherence to antihyperlipidemic drugs in a lipid clinic. American Journal of Health-System Pharmacy. Jun 1 2001;58(11):1017-1021.
12. Patel JV, Hughes EA. Efficacy, safety and LDL-C goal attainment of ezetimibe 10 mg-simvastatin 20 mg vs. placebo-simvastatin 20 mg in UK-based adults with coronary heart disease and hypercholesterolaemia. International Journal of Clinical Practice. Aug 2006;60(8):914-921.
13. Rasmussen JN, Chong A, Alter DA. Relationship between adherence to evidence-based pharmacotherapy and long-term mortality after acute myocardial infarction. JAMA. 2007;297(2):177-186.
14. Sampalis F, Bissonnette S, Habib R, Boukas S. Reduction is estimated risk of coronary artery disease after use of ezetimibe with statin The Annals of Pharmacotherapy. 2007;41:1345-1351.
15. Sharma M, Sharma DR, Singh V, et al. Evaluation of efficacy and safety of fixed dose lovastatin and niacin(ER) combination in asian Indian dyslipidemic patients: a multicentric study. Vascular Health & Risk Management. 2006;2(1):87-93.
16. Stein EA, Stender S, Mata P, et al. Achieving lipoprotein goals in patients at high risk with severe hypercholesterolemia: Efficacy and safety of ezetimibe coadministered with atorvastatin American Heart Journal. 2004:447-455.
17. Valdez CA, Ulrich H. Similar medication compliance and control of dyslipidemia with simvastatin or atorvastatin in a staff-model HMO medical clinic. Journal of Managed Care Pharmacy. Jul-Aug 2005;11(6):499-504.
THIS REPORT HAS BEEN SUPERSEDED
Final Report Drug Effectiveness Review Project
FDCP for diabetes and hyperlipidemia Page 72 of 73

Appendix E. Studies pending review Type 2 Diabetes 1. Feinbock C, Luger A, Klingler A, et al. Prospective multicentre trial comparing the
efficacy of, and compliance with, glimepiride or acarbose treatment in patients with type 2 diabetes not controlled with diet alone. Diabetes, Nutrition & Metabolism - Clinical & Experimental. Aug 2003;16(4):214-221.
2. Guillausseau PJ. Influence of oral antidiabetic drugs compliance on metabolic control in type 2 diabetes. A survey in general practice. Diabetes & Metabolism. Feb 2003;29(1):79-81.
3. Kuo Y-F, Ray L, Raji Mea. Inconsistent use of diabetes medications, diabetes complications, and mortality in older mexican americans over a 7-year period. Diabetes Care. 2003;26(11).
Hyperlipidemia 1. Bangalore S, Kamalakkannan G, Parkar S, Messerli FH. Fixed-dose combinations
improve medication compliance: a meta-analysis. American Journal of Medicine. 2007;120(8):713-719.
2. Michael Ho P, Magid DJ, Masoudi FA, McClure DL, Rumsfeld JS. Adherence to cardioprotective medications and mortality among patients with diabetes and ischemic heart disease. BMC Cardiovascular Disorders.6(48).
3. Michael Ho P, Rumsfeld JS, Masoudi FA, D.A M, M.E P, J.F. S. Effect of medication non adherence on hospitalization and mortality among patients with diabetes mellitus. Archives of Internal Medicine. 2006;166:1836-1841.
4. Sokol MC, McGuigan KA, Verbrugge RR, Epstein RS. Impact of medication adherence on hospitalization risk and healthcare cost.[see comment]. Medical Care. 2005;43(6):521-530.
Final Report Drug Effectiveness Review Project
FDCP for diabetes and hyperlipidemia Page 73 of 73
THIS REPORT HAS BEEN SUPERSEDED