drought monitoring & management e an indian experience · drought : a silent threat to indian...
TRANSCRIPT
Ravinder KaurProject DirectorWater Technology CenterIndian Agricultural Research Institute, New DelhiEmail: [email protected]
Drought Monitoring & Management –An Indian Experience
Ind
ian
Agr
icu
ltu
ral R
esea
rch
Inst
itu
te
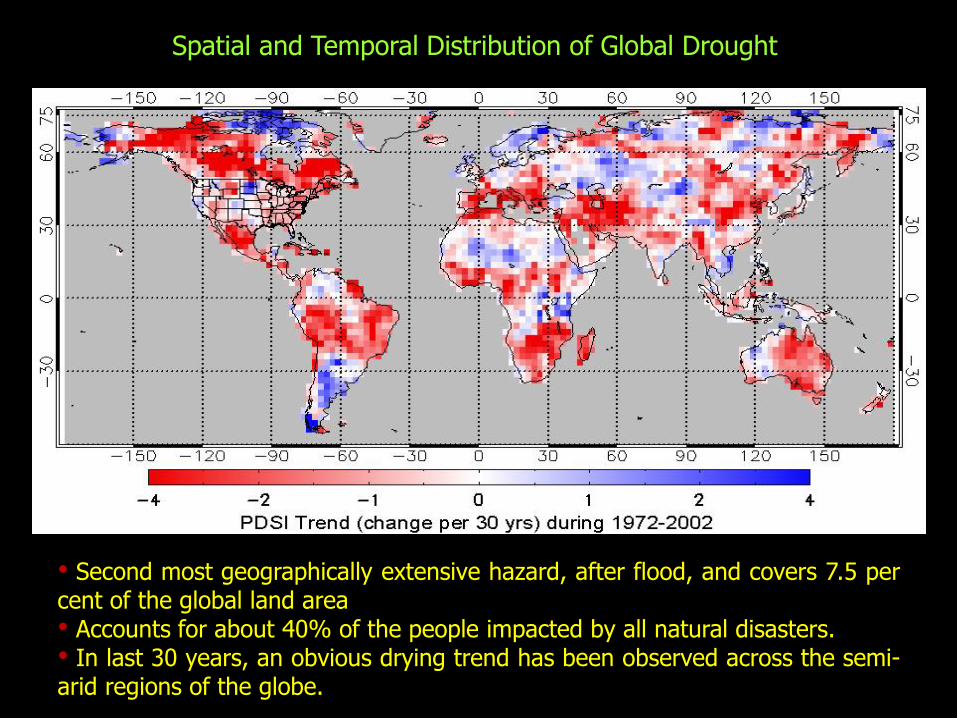
Spatial and Temporal Distribution of Global Drought
• Second most geographically extensive hazard, after flood, and covers 7.5 percent of the global land area• Accounts for about 40% of the people impacted by all natural disasters.• In last 30 years, an obvious drying trend has been observed across the semi-arid regions of the globe.
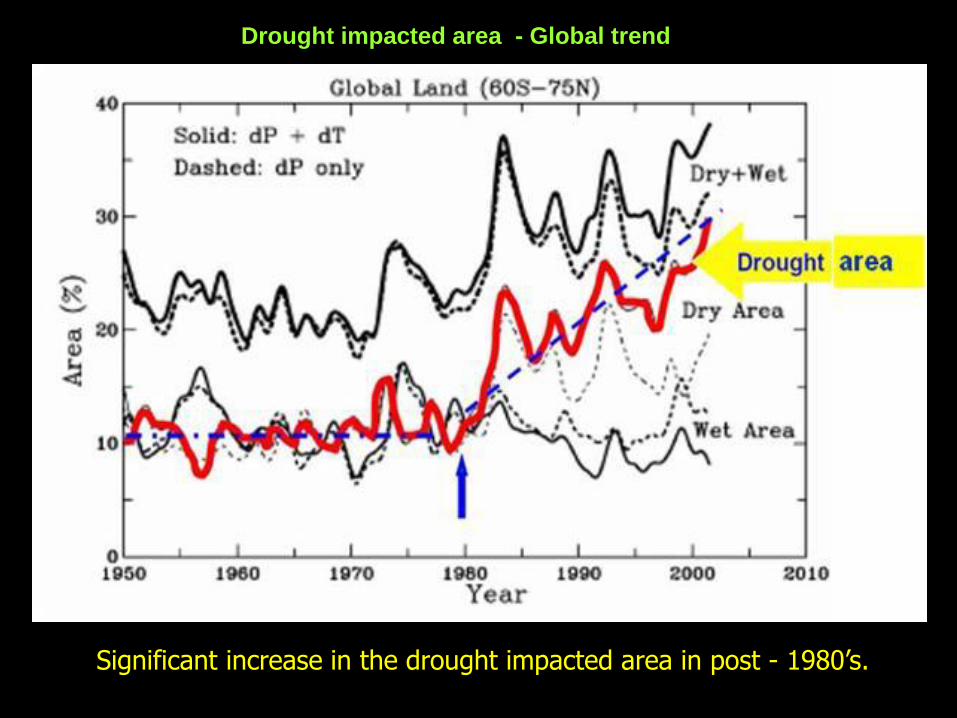
Significant increase in the drought impacted area in post - 1980’s.
Drought impacted area - Global trend
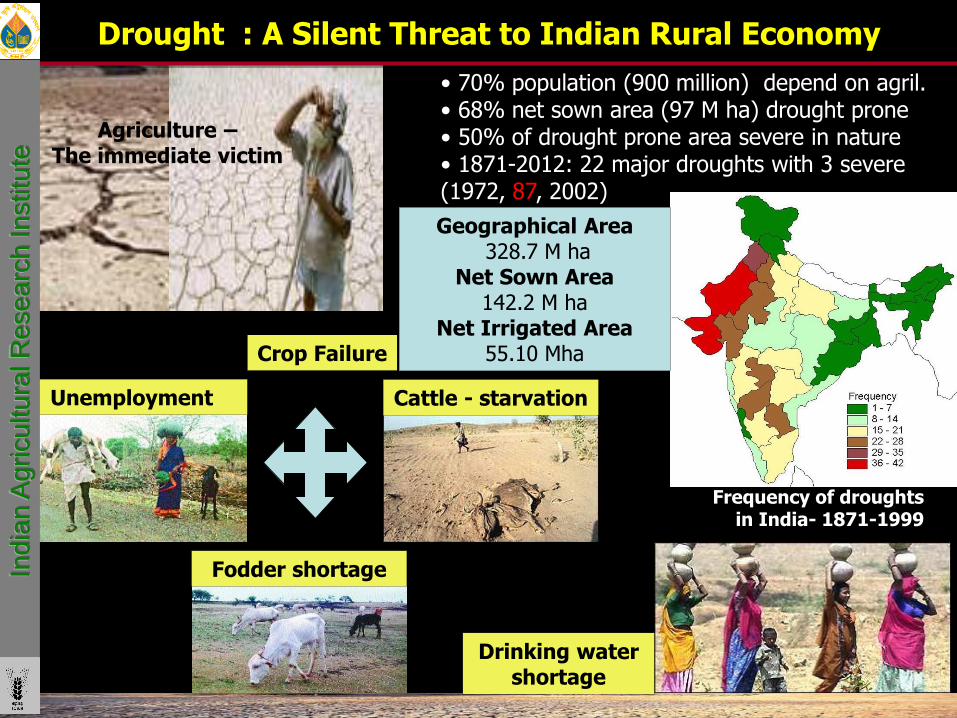
Drought : A Silent Threat to Indian Rural Economy
Unemployment Cattle - starvation
Fodder shortage
Agriculture –The immediate victim
Crop Failure
• 70% population (900 million) depend on agril.• 68% net sown area (97 M ha) drought prone• 50% of drought prone area severe in nature• 1871-2012: 22 major droughts with 3 severe (1972, 87, 2002)
Frequency of droughts in India- 1871-1999
Geographical Area328.7 M ha
Net Sown Area142.2 M ha
Net Irrigated Area55.10 Mha
Drinking water shortage
Ind
ian
Ag
ricu
ltu
ral R
ese
arc
h In
stitu
te
Ind
ian
Ag
ricu
ltu
ral R
ese
arc
h In
stitu
te
Government Initiatives
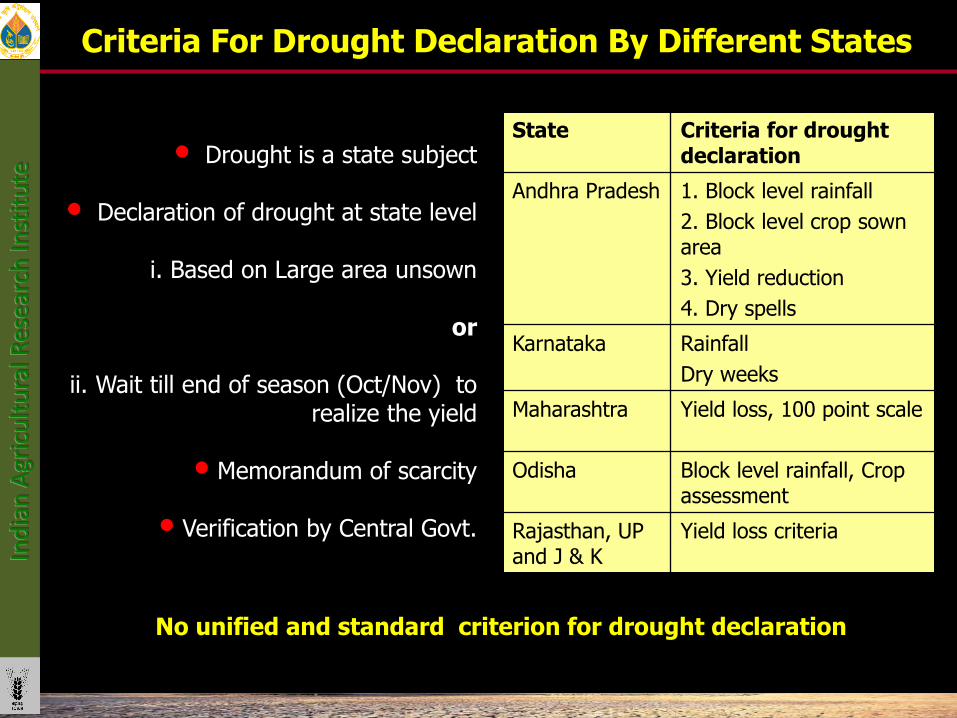
Criteria For Drought Declaration By Different States
State Criteria for drought declaration
Andhra Pradesh 1. Block level rainfall
2. Block level crop sown area
3. Yield reduction
4. Dry spells
Karnataka Rainfall
Dry weeks
Maharashtra Yield loss, 100 point scale
Odisha Block level rainfall, Crop assessment
Rajasthan, UP and J & K
Yield loss criteria
• Drought is a state subject
• Declaration of drought at state level
i. Based on Large area unsown
or
ii. Wait till end of season (Oct/Nov) to realize the yield
• Memorandum of scarcity
• Verification by Central Govt.
No unified and standard criterion for drought declaration
Ind
ian
Agr
icu
ltu
ral R
esea
rch
Inst
itu
te

Rainfall Deficiency / Yield loss/ Red. cropped area at Block and District level
Crop Weather Watch Group
District Collector monitors his district
State level drought is watched by State Relief Commissioner
Estimation of losses
Declaration
Verification by Federal Teams
Relief Quantum is decided
Drought Declaration Process
A nodal Inter-ministerial Group within the MOA responsible for all matters of drought;With
experts from climate, water, crop, input supply, extension, power & R&D agencies.
Ind
ian
Agr
icu
ltu
ral R
esea
rch
Inst
itu
te
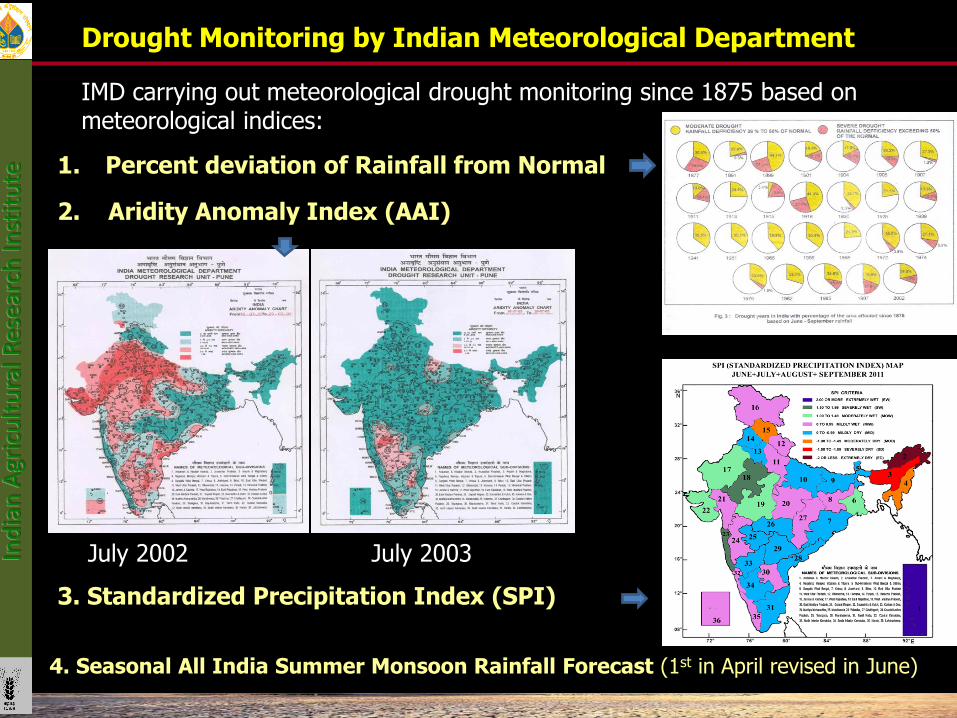
Drought Monitoring by Indian Meteorological Department
1. Percent deviation of Rainfall from Normal
2. Aridity Anomaly Index (AAI)
4. Seasonal All India Summer Monsoon Rainfall Forecast (1st in April revised in June)
3. Standardized Precipitation Index (SPI)
July 2002 July 2003
IMD carrying out meteorological drought monitoring since 1875 based on meteorological indices:
Ind
ian
Agr
icu
ltu
ral R
esea
rch
Inst
itu
te

Drought Assessment from Space : National Agricultural Drought Assessment and Monitoring System (NADAMS, NRSC, India)
Ind
ian
Agr
icu
ltu
ral R
esea
rch
Inst
itu
te
Our University- Initiatives
India
n A
gricu
ltura
l Rese
arc
h I
nst
itute
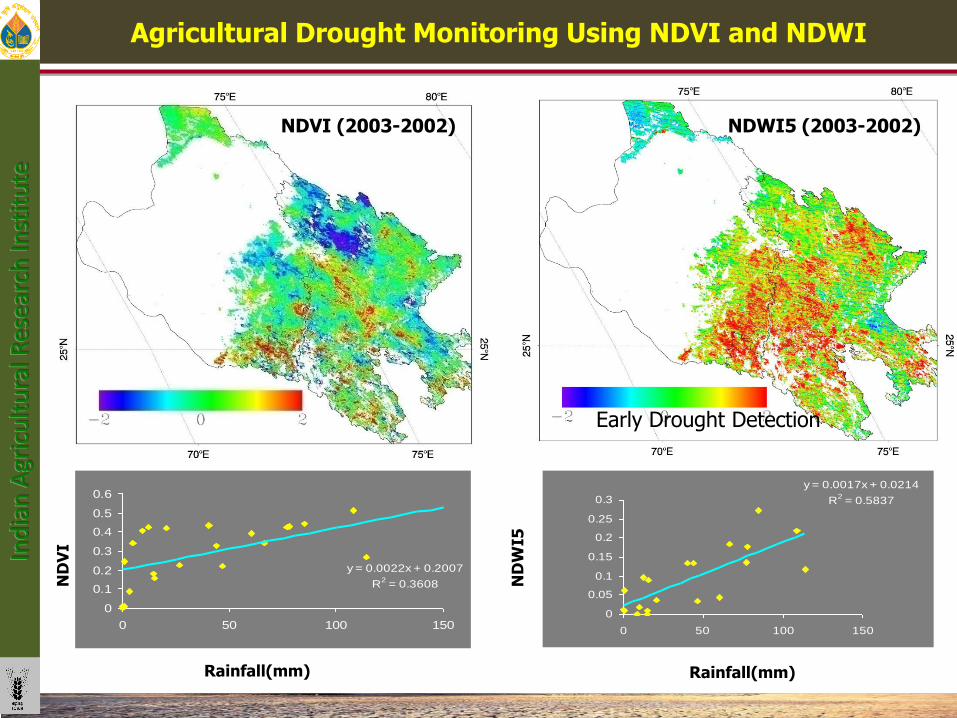
NDVI (2003-2002) NDWI5 (2003-2002)
Early Drought Detection
y = 0.0017x + 0.0214
R2 = 0.5837
0
0.05
0.1
0.15
0.2
0.25
0.3
0 50 100 150
Rainfall(mm)
ND
WI5
Rainfall(mm)
ND
VI
y = 0.0022x + 0.2007
R2 = 0.3608
0
0.1
0.2
0.3
0.4
0.5
0.6
0 50 100 150
Agricultural Drought Monitoring Using NDVI and NDWIIn
dia
n A
gric
ult
ura
l Res
earc
h In
stit
ute
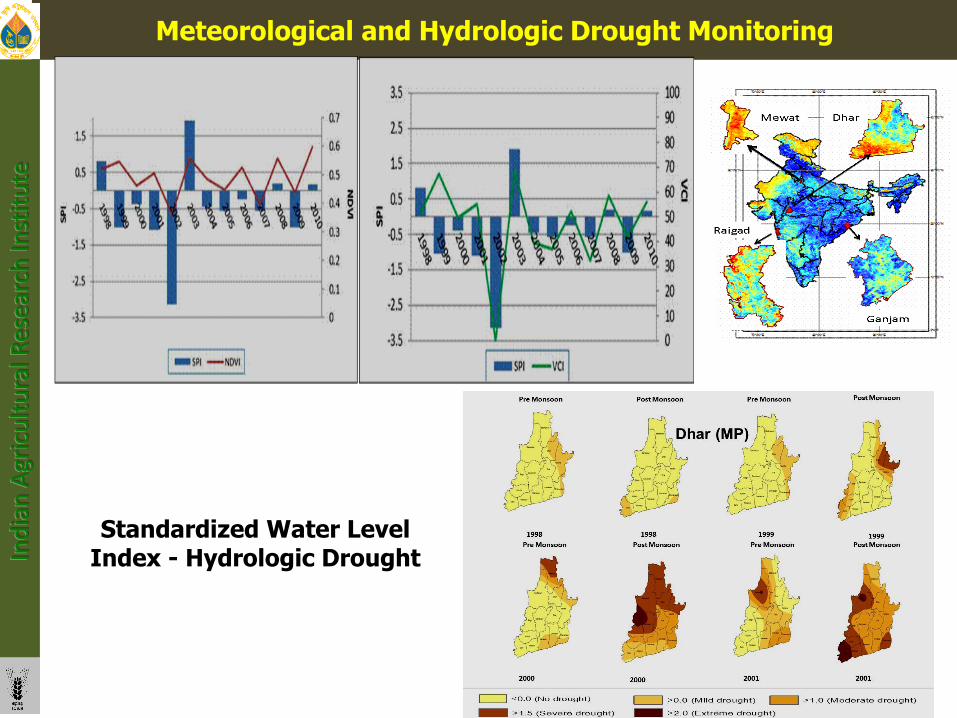
Meteorological and Hydrologic Drought Monitoring
Standardized Water Level Index - Hydrologic DroughtIn
dia
n A
gric
ult
ura
l Res
earc
h In
stit
ute
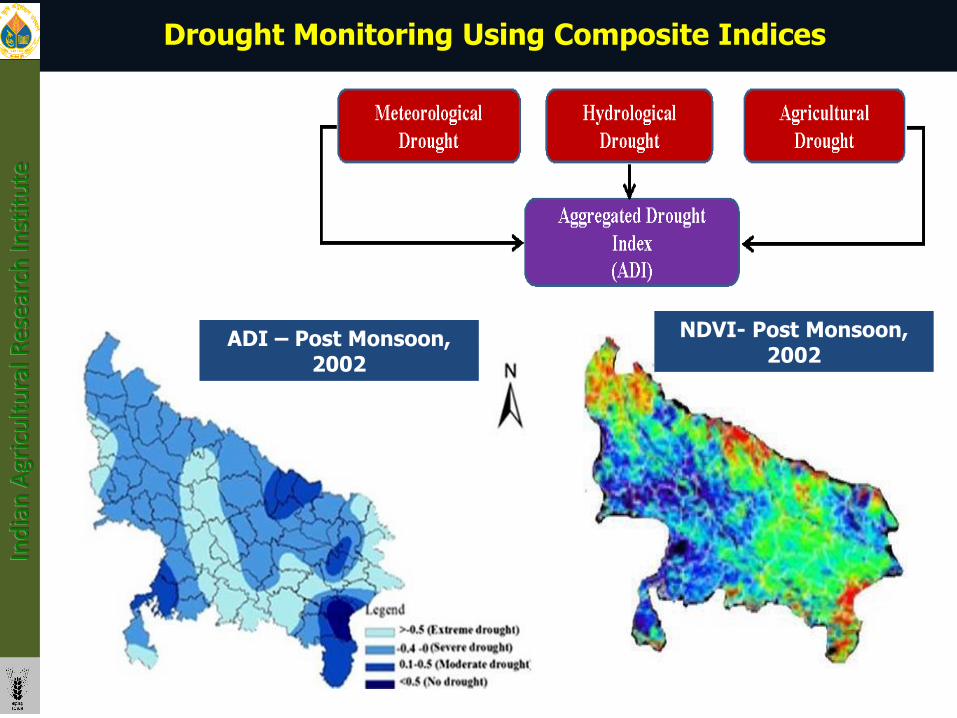
ADI – Post Monsoon, 2002
NDVI- Post Monsoon, 2002
Drought Monitoring Using Composite Indices
Purpose: To understand temporal and spatial variation of the hazard and establish comprehensive and integrated drought early warning system .
Ind
ian
Agr
icu
ltu
ral R
esea
rch
Inst
itu
te

SERCEI correlated well withyield deviations
Validation on Pune District, Maharashtra
Agricultural Drought Prediction
SERCEI Based Drought Scenario - 2015 for Pune, Maharastra
-1.00 to -1.49
2.00 to 1.00
+0.99 to -0.99
-1.00 to -2.00
Using GCM based rainfall
data
50% of test area under moderate to extreme drought
Drought Monitoring Using Composite IndicesIn
dia
n A
gric
ult
ura
l Res
earc
h In
stit
ute
Agricultural Drought Prediction
50% of test area under moderate to extreme drought
Agricultural Drought Vulnerability MappingIn
dia
n A
gric
ult
ura
l Res
earc
h In
stit
ute
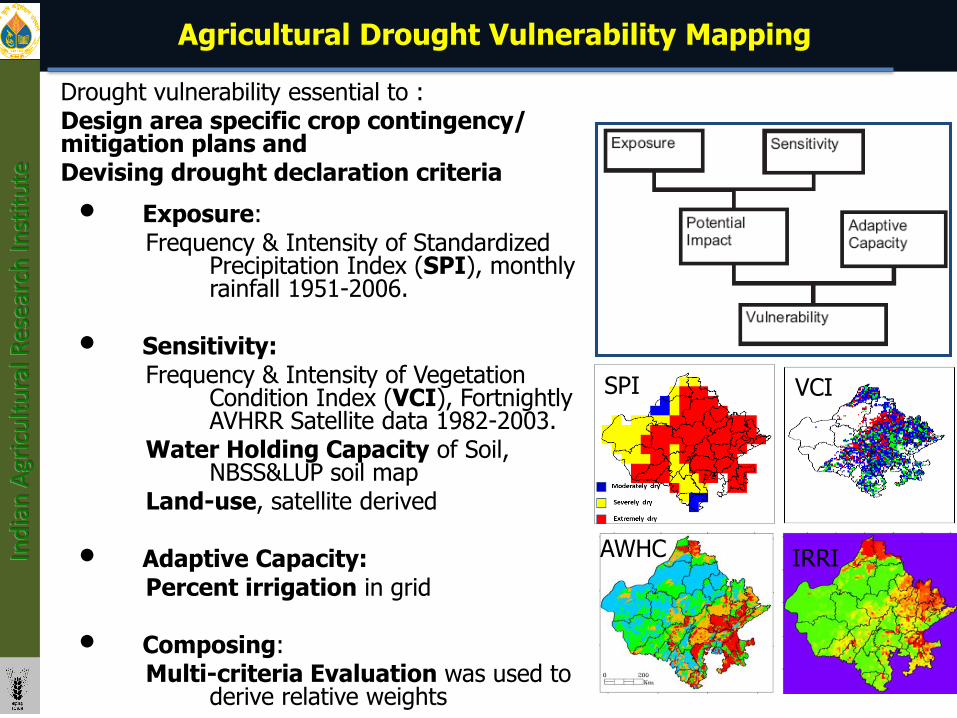
Drought vulnerability essential to :Design area specific crop contingency/ mitigation plans andDevising drought declaration criteria
• Exposure: Frequency & Intensity of Standardized
Precipitation Index (SPI), monthly rainfall 1951-2006.
• Sensitivity:Frequency & Intensity of Vegetation
Condition Index (VCI), Fortnightly AVHRR Satellite data 1982-2003.
Water Holding Capacity of Soil, NBSS&LUP soil map
Land-use, satellite derived
• Adaptive Capacity: Percent irrigation in grid
• Composing:Multi-criteria Evaluation was used to
derive relative weights
SPI VCI
AWHC IRRI
Our Drought Mitigation & Adaptation Efforts
India
n A
gricu
ltura
l Rese
arc
h I
nst
itute
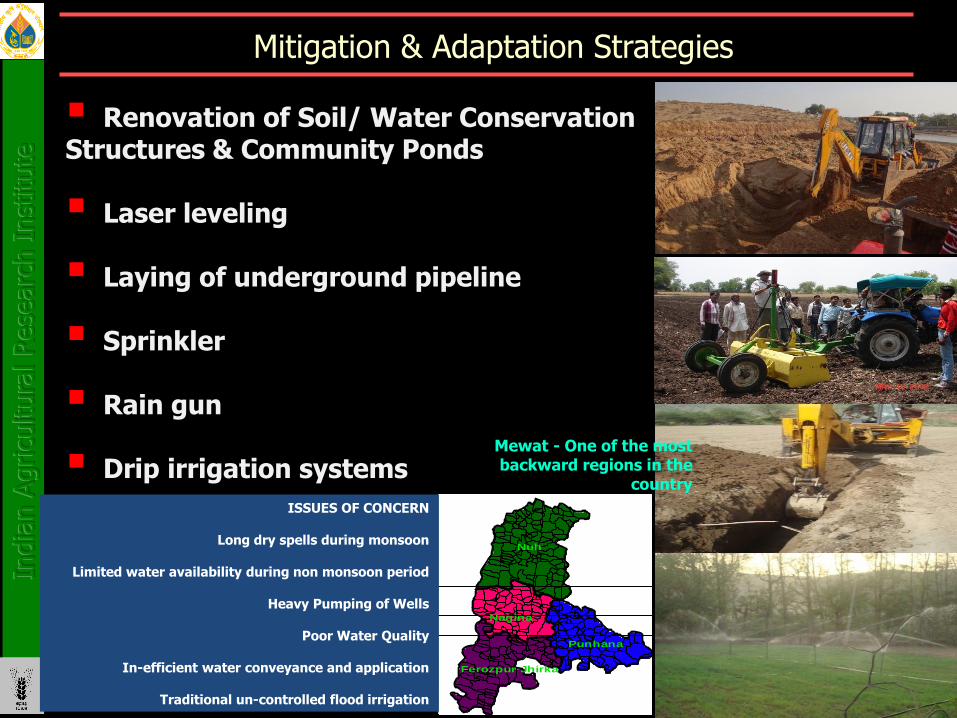
Mitigation & Adaptation StrategiesIn
dia
n A
gricu
ltura
l Rese
arc
h I
nst
itute
Renovation of Soil/ Water Conservation Structures & Community Ponds
Laser leveling
Laying of underground pipeline
Sprinkler
Rain gun
Drip irrigation systems
Nuh
Nagina
Punhana
Ferozpur Jhirka
Mewat - One of the most backward regions in the
country
ISSUES OF CONCERN
Long dry spells during monsoon
Limited water availability during non monsoon period
Heavy Pumping of Wells
Poor Water Quality
In-efficient water conveyance and application
Traditional un-controlled flood irrigation
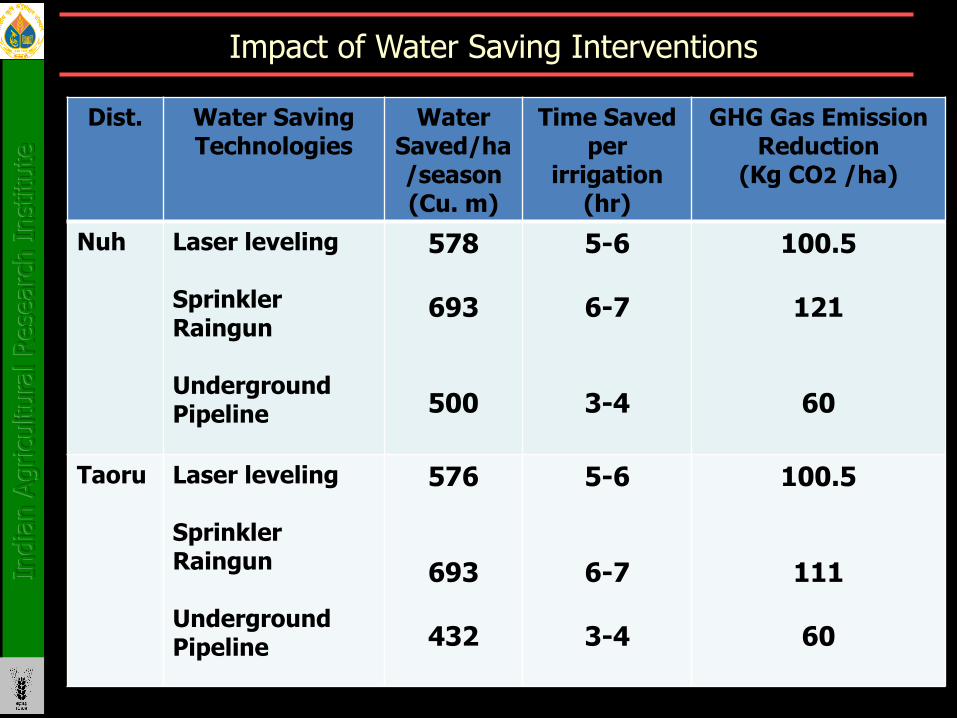
Impact of Water Saving InterventionsIn
dia
n A
gricu
ltura
l Rese
arc
h I
nst
itute
Dist. Water Saving Technologies
Water Saved/ha/season(Cu. m)
Time Saved per
irrigation(hr)
GHG Gas Emission Reduction
(Kg CO2 /ha)
Nuh Laser leveling
SprinklerRaingun
Underground Pipeline
578
693
500
5-6
6-7
3-4
100.5
121
60
Taoru Laser leveling
SprinklerRaingun
Underground Pipeline
576
693
432
5-6
6-7
3-4
100.5
111
60
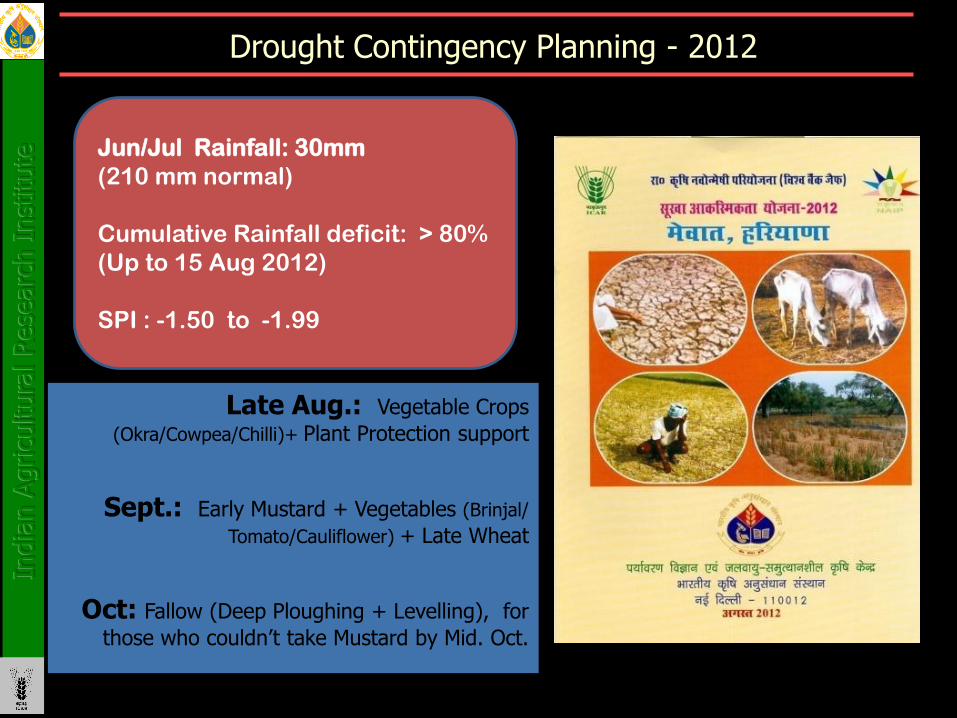
Late Aug.: Vegetable Crops
(Okra/Cowpea/Chilli)+ Plant Protection support
Sept.: Early Mustard + Vegetables (Brinjal/
Tomato/Cauliflower) + Late Wheat
Oct: Fallow (Deep Ploughing + Levelling), for
those who couldn’t take Mustard by Mid. Oct.
Jun/Jul Rainfall: 30mm
(210 mm normal)
Cumulative Rainfall deficit: > 80%
(Up to 15 Aug 2012)
SPI : -1.50 to -1.99
Drought Contingency Planning - 2012In
dia
n A
gricu
ltura
l Rese
arc
h I
nst
itute

Impact of Contingency Plan – Vegetable Crop Intervention (Rainy Season)In
dia
n A
gricu
ltura
l Rese
arc
h I
nst
itute
Okra Pusa A-4 New
Introduction
Rs.45,000
(US 670)
Chilli Pusa
Sadabahar
60
beneficiaries
Rs.
60,000(US
1000)
Cow pea Pusa
Sukomal
New
Introduction
Rs. 40,000
(US 597)
Rs. 20-25 thousand (or US300 -
370)/ha higher over Pearl Millet
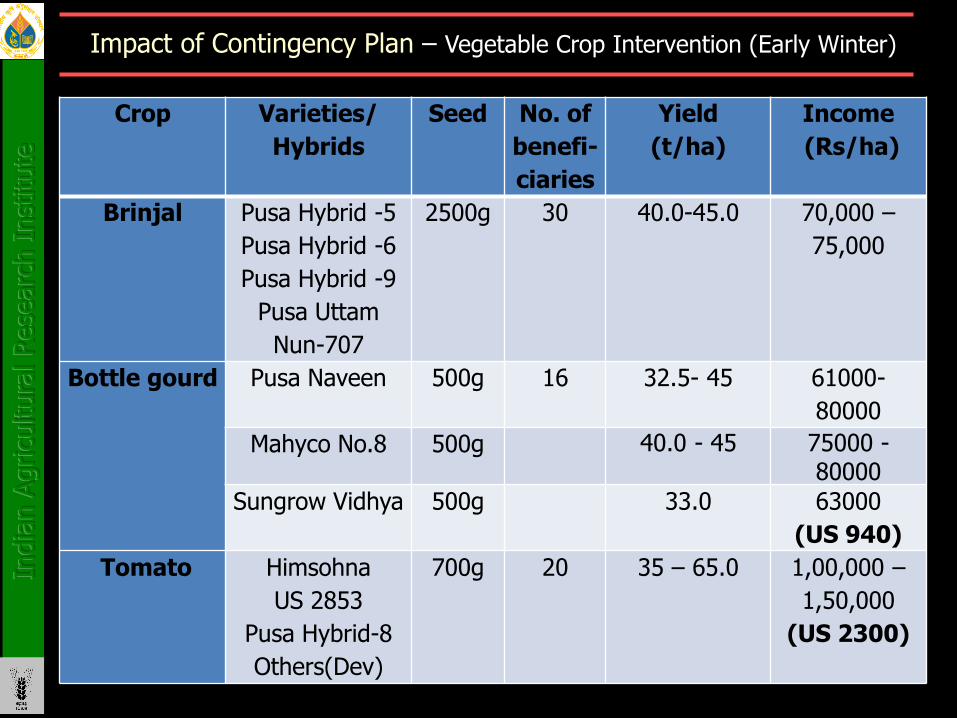
Crop Varieties/
Hybrids
Seed No. of
benefi-
ciaries
Yield
(t/ha)
Income
(Rs/ha)
Brinjal Pusa Hybrid -5
Pusa Hybrid -6
Pusa Hybrid -9
Pusa Uttam
Nun-707
2500g 30 40.0-45.0 70,000 –
75,000
Bottle gourd Pusa Naveen 500g 16 32.5- 45 61000-
80000
Mahyco No.8 500g 40.0 - 45 75000 -80000
Sungrow Vidhya 500g 33.0 63000
(US 940)
Tomato Himsohna
US 2853
Pusa Hybrid-8
Others(Dev)
700g 20 35 – 65.0 1,00,000 –
1,50,000
(US 2300)
India
n A
gricu
ltura
l Rese
arc
h I
nst
itute
Impact of Contingency Plan – Vegetable Crop Intervention (Early Winter)

•Farmers raising Vegetable in furrow system in Mewat
Bottle guard -30.0-35.0 t/ha &
Profit Rs. 61,000 – 75,000/ha
•Tomato : 35.0 t- 65.0 t/ha & •Profit : Rs. 1,00,000 – 1,50,000/ha
•Brinjal- 40.0-45.0 t/ha •Profit Rs. 70,000 –75,000/ha
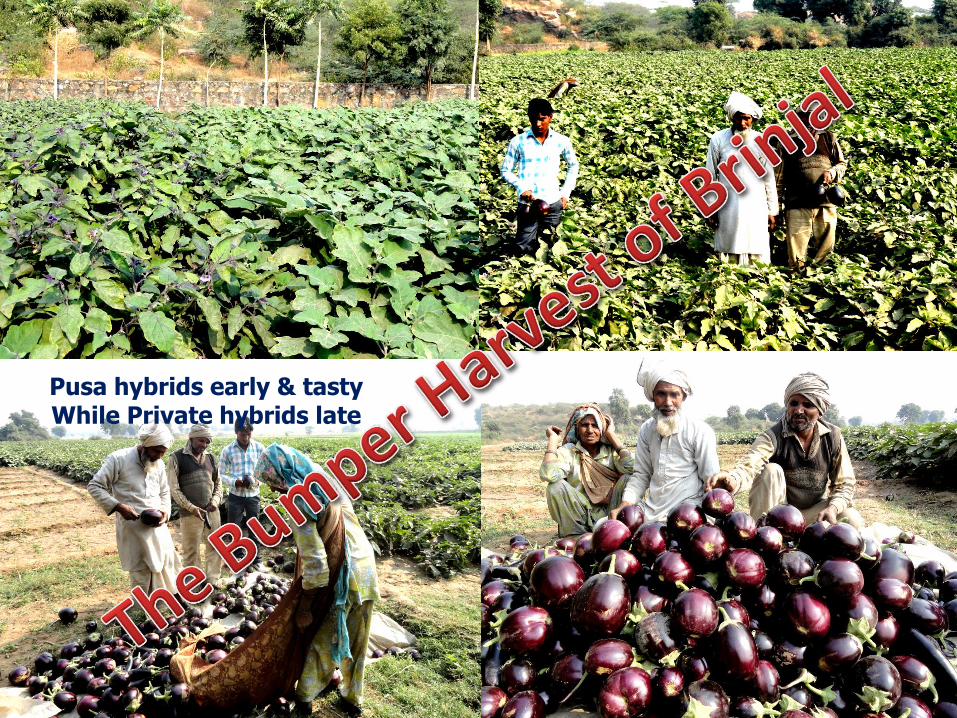
Pusa hybrids early & tastyWhile Private hybrids late
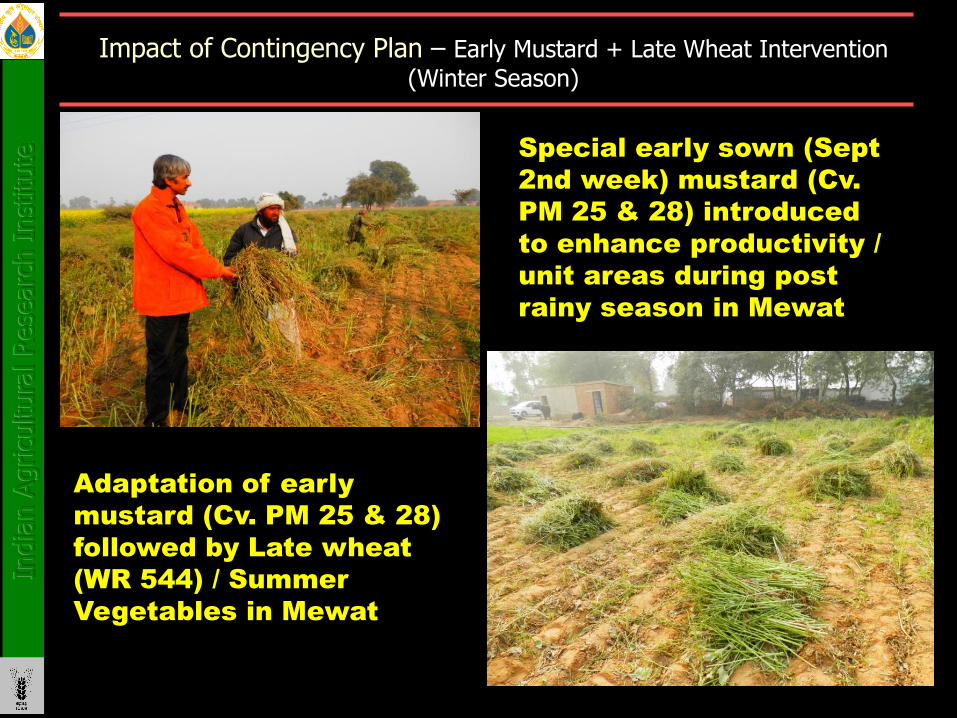
Special early sown (Sept
2nd week) mustard (Cv.
PM 25 & 28) introduced
to enhance productivity /
unit areas during post
rainy season in Mewat
Adaptation of early
mustard (Cv. PM 25 & 28)
followed by Late wheat
(WR 544) / Summer
Vegetables in Mewat
India
n A
gricu
ltura
l Rese
arc
h I
nst
itute
Impact of Contingency Plan – Early Mustard + Late Wheat Intervention
(Winter Season)
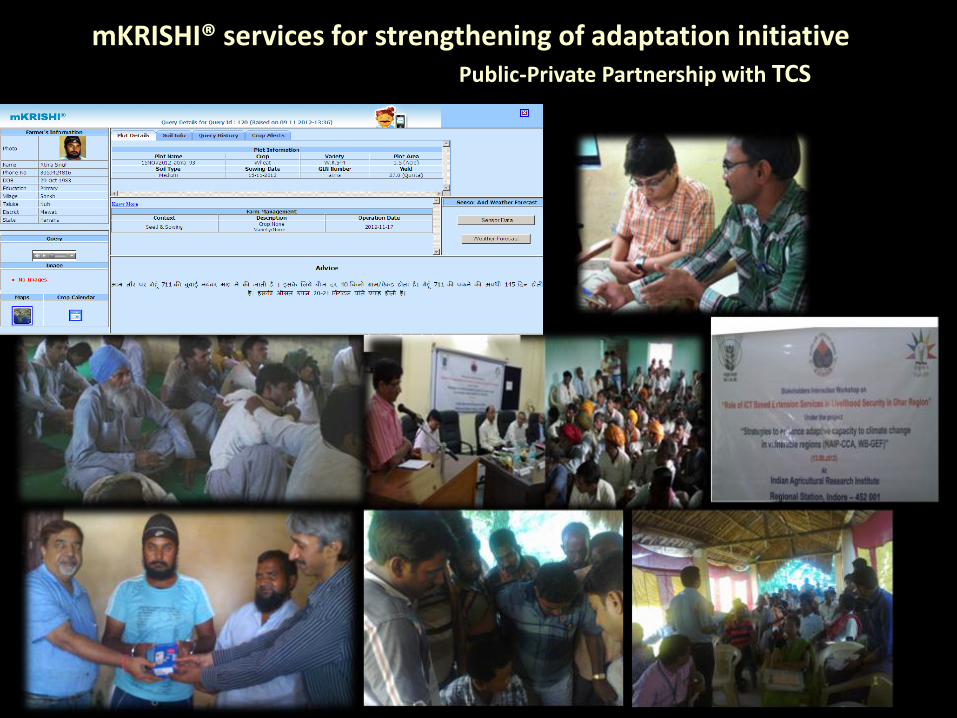
mKRISHI® services for strengthening of adaptation initiativePublic-Private Partnership with TCS

Interventions
Periodic de-worming/ Medication
Provisioning of Mineral Mixture and dietary supplements for 5 months
Promoting Multi-cut Fodder Sorghum –450 Households
Impacts
16% increased milk yield/day/head (Control – 7.38 lit/d and project intervention - 8.57 lit/d)
Household income Increase by Rs. 8,000/animal/lactation period
India
n A
gricu
ltura
l Rese
arc
h I
nst
itute
Impact of Other Livelihood Improving Strategies – Livestock Intervention
India
n A
gricu
ltura
l Rese
arc
h I
nst
itute
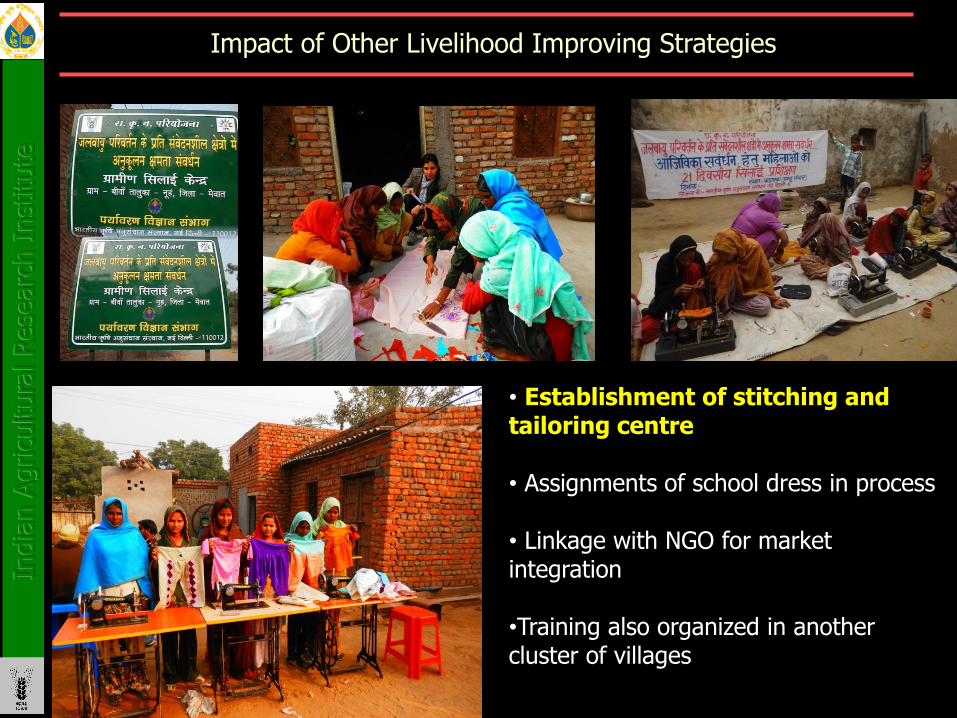
Impact of Other Livelihood Improving Strategies
• Establishment of stitching and tailoring centre
• Assignments of school dress in process
• Linkage with NGO for market integration
•Training also organized in another cluster of villages

UNL Team visit to villages in Mewat district
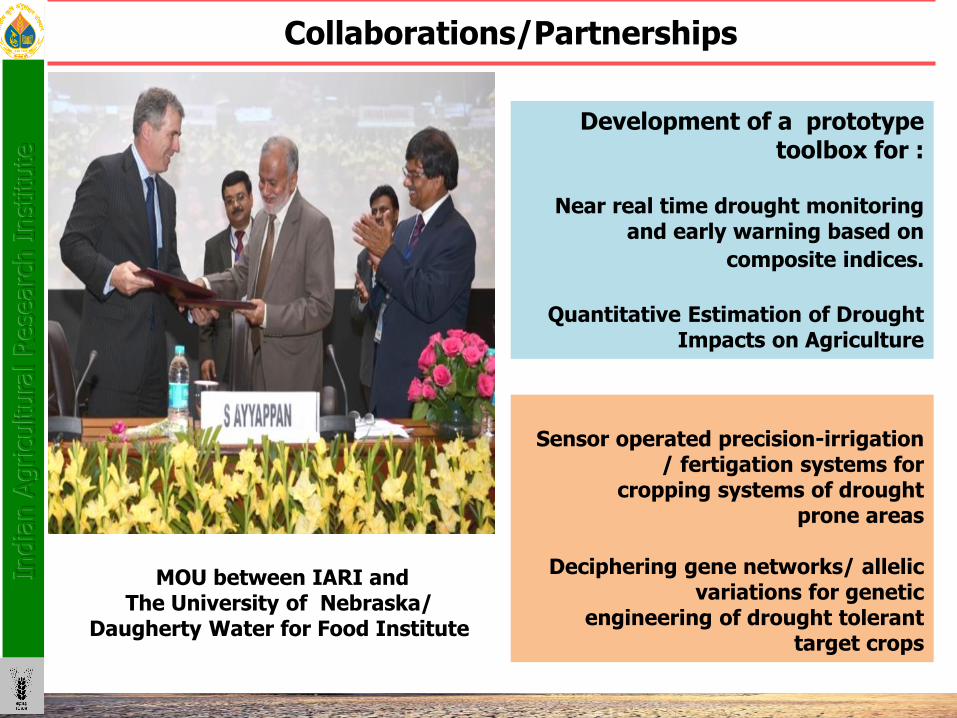
Collaborations/Partnerships
Development of a prototype toolbox for :
Near real time drought monitoring and early warning based on
composite indices.
Quantitative Estimation of Drought Impacts on Agriculture
India
n A
gricu
ltura
l Rese
arc
h I
nst
itute
MOU between IARI and The University of Nebraska/
Daugherty Water for Food Institute
Sensor operated precision-irrigation / fertigation systems for
cropping systems of drought prone areas
Deciphering gene networks/ allelic variations for genetic
engineering of drought tolerant target crops

Indian Drought Monitoring Process
South west monsoon contributes 80 % of total rainfall in Indiaduring four months i.e. June to September.
Drought recognized with a rainfall deficiency of more than20%.
Meteorologically, ± 19% deviation of rainfall from the long-term
mean is considered ‘normal’ in India. Deficiency in the range20–59% represents ‘moderate’ drought, and more than 60% is‘severe’ drought.
A year is considered to be a DROUGHT YEAR when the areaaffected by moderate and severe drought, either individually ortogether, is 20- 40% of the total area of the country.
When the spatial coverage of drought is more than 40% it iscalled as ALL INDIA SEVERE DROUGHT YEAR.
Ind
ian
Agr
icu
ltu
ral R
esea
rch
Inst
itu
te