drought in the scipp region - southern … · drought in the scipp region drought event ... water...
TRANSCRIPT

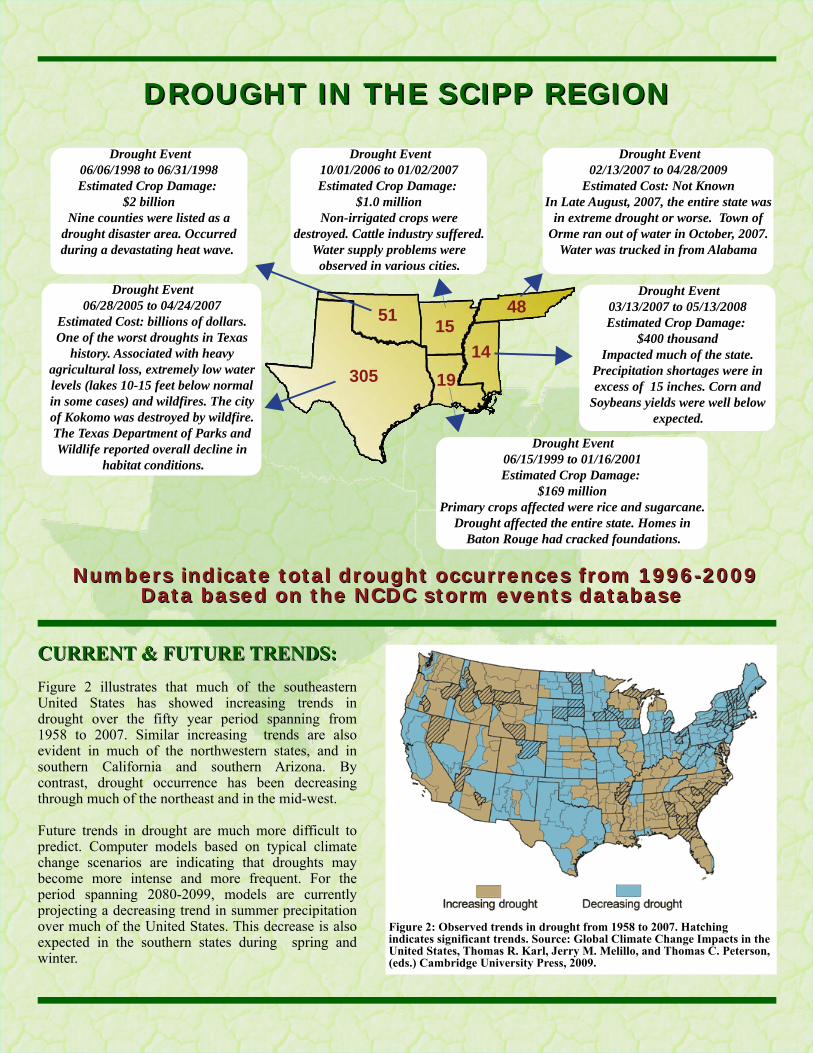
DDRROOUUGGHHTT IINN TTHHEE SSCCIIPPPP RREEGGIIOONNDrought Event
06/06/1998 to 06/31/1998Estimated Crop Damage:
$2 billionNine counties were listed as a
drought disaster area. Occurred during a devastating heat wave.
Drought Event10/01/2006 to 01/02/2007Estimated Crop Damage:
$1.0 millionNon-irrigated crops were
destroyed. Cattle industry suffered. Water supply problems were
observed in various cities.
Drought Event02/13/2007 to 04/28/2009
Estimated Cost: Not KnownIn Late August, 2007, the entire state was
in extreme drought or worse. Town of Orme ran out of water in October, 2007.
Water was trucked in from Alabama
Drought Event03/13/2007 to 05/13/2008Estimated Crop Damage:
$400 thousandImpacted much of the state.
Precipitation shortages were in excess of 15 inches. Corn and
Soybeans yields were well below expected.
Drought Event06/28/2005 to 04/24/2007
Estimated Cost: billions of dollars.One of the worst droughts in Texas
history. Associated with heavy agricultural loss, extremely low water levels (lakes 10-15 feet below normal in some cases) and wildfires. The city of Kokomo was destroyed by wildfire. The Texas Department of Parks and Wildlife reported overall decline in
habitat conditions.Drought Event
06/15/1999 to 01/16/2001Estimated Crop Damage:
$169 millionPrimary crops affected were rice and sugarcane.
Drought affected the entire state. Homes in Baton Rouge had cracked foundations.
NNuummbbeerrss iinnddiiccaattee ttoottaall ddrroouugghhtt ooccccuurrrreenncceess ffrroomm 11999966--22000099DDaattaa bbaasseedd oonn tthhee NNCCDDCC ssttoorrmm eevveennttss ddaattaabbaassee
305
51
19
1548
14
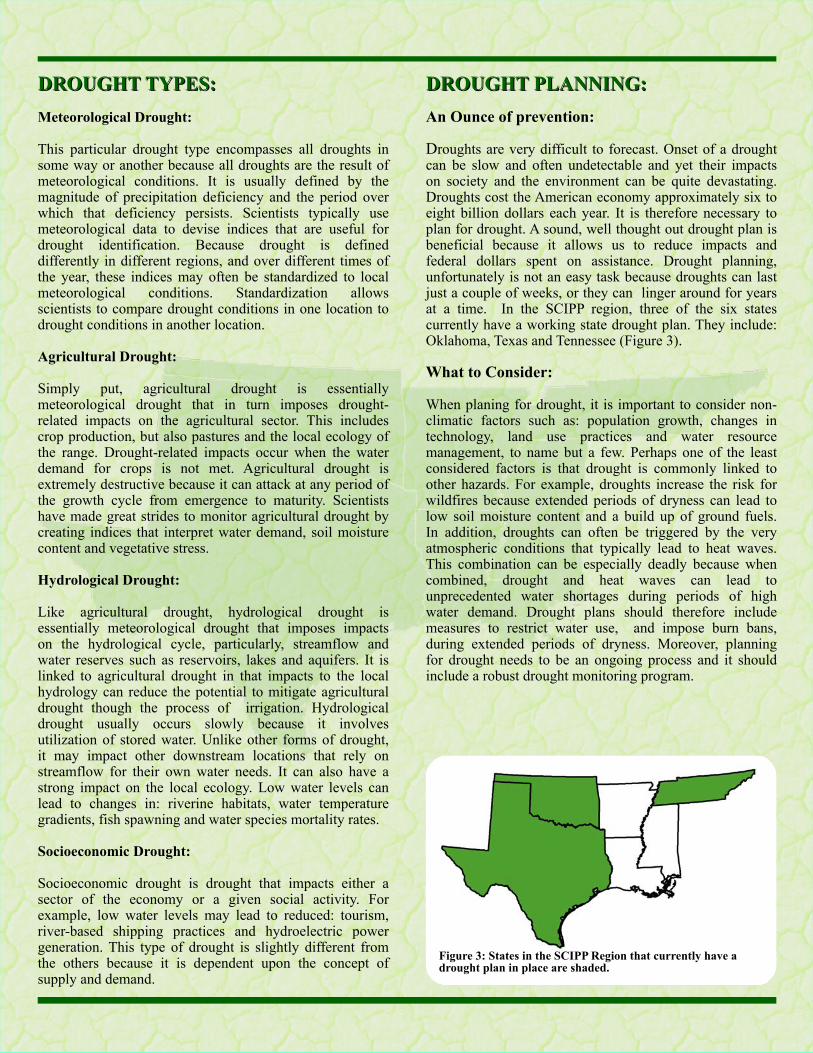
CCUURRRREENNTT && FFUUTTUURREE TTRREENNDDSS::Figure 2 illustrates that much of the southeastern United States has showed increasing trends in drought over the fifty year period spanning from 1958 to 2007. Similar increasing trends are also evident in much of the northwestern states, and in southern California and southern Arizona. By contrast, drought occurrence has been decreasing through much of the northeast and in the mid-west.
Future trends in drought are much more difficult to predict. Computer models based on typical climate change scenarios are indicating that droughts may become more intense and more frequent. For the period spanning 2080-2099, models are currently projecting a decreasing trend in summer precipitation over much of the United States. This decrease is also expected in the southern states during spring and winter.
Figure 2: Observed trends in drought from 1958 to 2007. Hatching indicates significant trends. Source: Global Climate Change Impacts in the United States, Thomas R. Karl, Jerry M. Melillo, and Thomas C. Peterson, (eds.) Cambridge University Press, 2009.
DDRROOUUGGHHTT TTYYPPEESS::Meteorological Drought:
This particular drought type encompasses all droughts in some way or another because all droughts are the result of meteorological conditions. It is usually defined by the magnitude of precipitation deficiency and the period over which that deficiency persists. Scientists typically use meteorological data to devise indices that are useful for drought identification. Because drought is defined differently in different regions, and over different times of the year, these indices may often be standardized to local meteorological conditions. Standardization allows scientists to compare drought conditions in one location to drought conditions in another location.
Agricultural Drought:
Simply put, agricultural drought is essentially meteorological drought that in turn imposes drought-related impacts on the agricultural sector. This includes crop production, but also pastures and the local ecology of the range. Drought-related impacts occur when the water demand for crops is not met. Agricultural drought is extremely destructive because it can attack at any period of the growth cycle from emergence to maturity. Scientists have made great strides to monitor agricultural drought by creating indices that interpret water demand, soil moisture content and vegetative stress.
Hydrological Drought:
Like agricultural drought, hydrological drought is essentially meteorological drought that imposes impacts on the hydrological cycle, particularly, streamflow and water reserves such as reservoirs, lakes and aquifers. It is linked to agricultural drought in that impacts to the local hydrology can reduce the potential to mitigate agricultural drought though the process of irrigation. Hydrological drought usually occurs slowly because it involves utilization of stored water. Unlike other forms of drought, it may impact other downstream locations that rely on streamflow for their own water needs. It can also have a strong impact on the local ecology. Low water levels can lead to changes in: riverine habitats, water temperature gradients, fish spawning and water species mortality rates.
Socioeconomic Drought:
Socioeconomic drought is drought that impacts either a sector of the economy or a given social activity. For example, low water levels may lead to reduced: tourism, river-based shipping practices and hydroelectric power generation. This type of drought is slightly different from the others because it is dependent upon the concept of supply and demand.
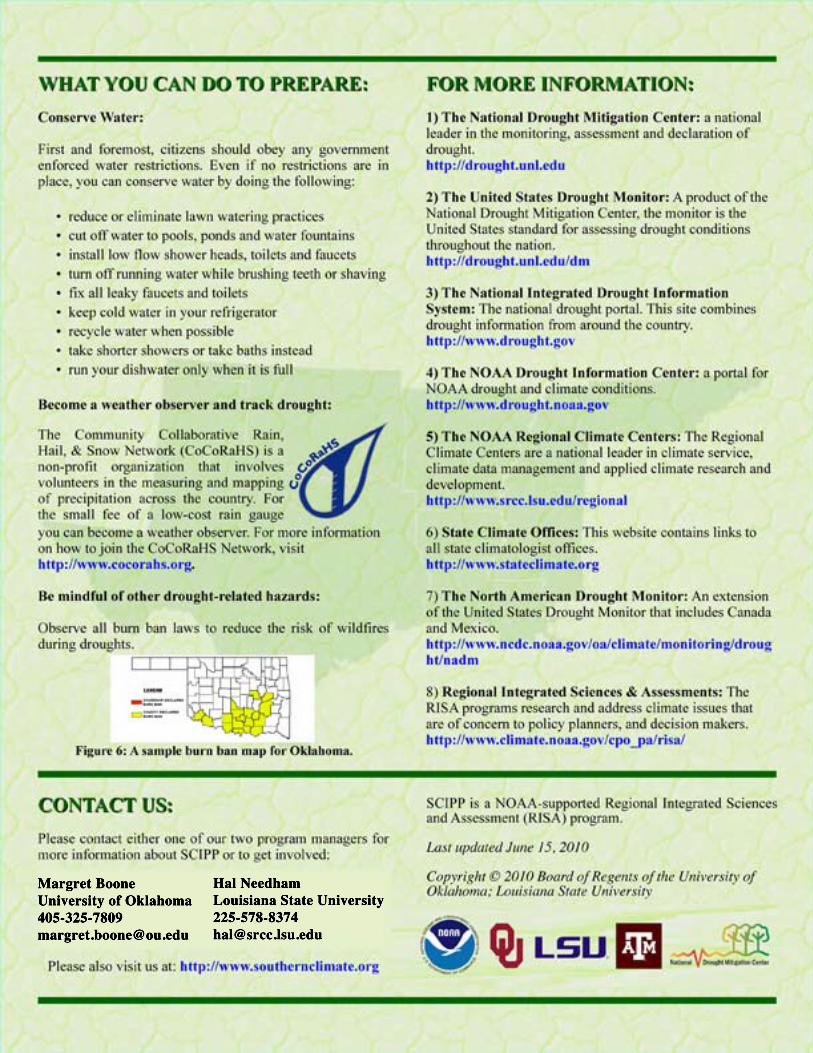
DDRROOUUGGHHTT PPLLAANNNNIINNGG::An Ounce of prevention:
Droughts are very difficult to forecast. Onset of a drought can be slow and often undetectable and yet their impacts on society and the environment can be quite devastating. Droughts cost the American economy approximately six to eight billion dollars each year. It is therefore necessary to plan for drought. A sound, well thought out drought plan is beneficial because it allows us to reduce impacts and federal dollars spent on assistance. Drought planning, unfortunately is not an easy task because droughts can last just a couple of weeks, or they can linger around for years at a time. In the SCIPP region, three of the six states currently have a working state drought plan. They include: Oklahoma, Texas and Tennessee (Figure 3).
What to Consider:
When planing for drought, it is important to consider non-climatic factors such as: population growth, changes in technology, land use practices and water resource management, to name but a few. Perhaps one of the least considered factors is that drought is commonly linked to other hazards. For example, droughts increase the risk for wildfires because extended periods of dryness can lead to low soil moisture content and a build up of ground fuels. In addition, droughts can often be triggered by the very atmospheric conditions that typically lead to heat waves. This combination can be especially deadly because when combined, drought and heat waves can lead to unprecedented water shortages during periods of high water demand. Drought plans should therefore include measures to restrict water use, and impose burn bans, during extended periods of dryness. Moreover, planning for drought needs to be an ongoing process and it should include a robust drought monitoring program.
Figure 3: States in the SCIPP Region that currently have a drought plan in place are shaded.
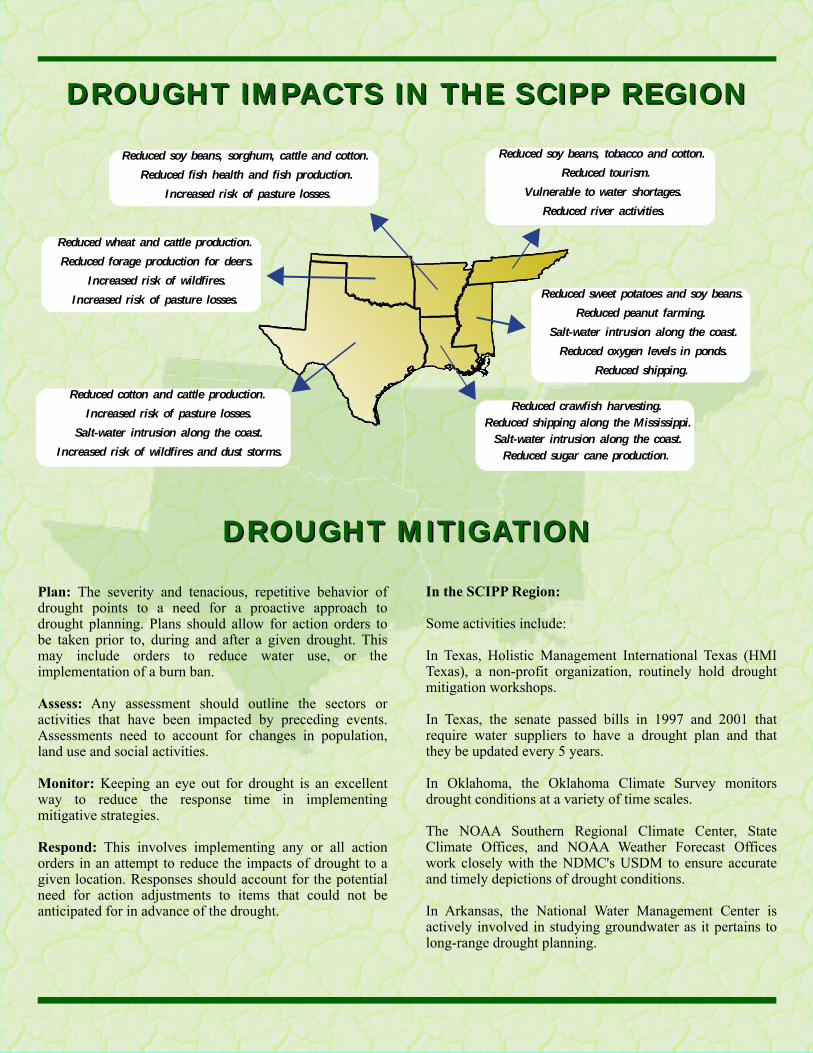
DDRROOUUGGHHTT IIMMPPAACCTTSS IINN TTHHEE SSCCIIPPPP RREEGGIIOONN
DDRROOUUGGHHTT MMIITTIIGGAATTIIOONN
Reduced wheat and cattle production. Reduced forage production for deers.
Increased risk of wildfires. Increased risk of pasture losses.
Reduced crawfish harvesting. Reduced shipping along the Mississippi. Salt-water intrusion along the coast.
Reduced sugar cane production.
Reduced cotton and cattle production. Increased risk of pasture losses.
Salt-water intrusion along the coast. Increased risk of wildfires and dust storms.
Reduced sweet potatoes and soy beans.Reduced peanut farming.
Salt-water intrusion along the coast. Reduced oxygen levels in ponds.
Reduced shipping.
Reduced soy beans, tobacco and cotton. Reduced tourism.
Vulnerable to water shortages. Reduced river activities.
Reduced soy beans, sorghum, cattle and cotton. Reduced fish health and fish production.
Increased risk of pasture losses.
Plan: The severity and tenacious, repetitive behavior of drought points to a need for a proactive approach to drought planning. Plans should allow for action orders to be taken prior to, during and after a given drought. This may include orders to reduce water use, or the implementation of a burn ban.
Assess: Any assessment should outline the sectors or activities that have been impacted by preceding events. Assessments need to account for changes in population, land use and social activities.
Monitor: Keeping an eye out for drought is an excellent way to reduce the response time in implementing mitigative strategies.
Respond: This involves implementing any or all action orders in an attempt to reduce the impacts of drought to a given location. Responses should account for the potential need for action adjustments to items that could not be anticipated for in advance of the drought.
In the SCIPP Region:
Some activities include:
In Texas, Holistic Management International Texas (HMI Texas), a non-profit organization, routinely hold drought mitigation workshops.
In Texas, the senate passed bills in 1997 and 2001 that require water suppliers to have a drought plan and that they be updated every 5 years.
In Oklahoma, the Oklahoma Climate Survey monitors drought conditions at a variety of time scales.
The NOAA Southern Regional Climate Center, State Climate Offices, and NOAA Weather Forecast Offices work closely with the NDMC's USDM to ensure accurate and timely depictions of drought conditions.
In Arkansas, the National Water Management Center is actively involved in studying groundwater as it pertains to long-range drought planning.

DDRROOUUGGHHTT MMOONNIITTOORRIINNGG
Figure 4: A sample map from the United States Drought Monitor, valid for April, 13, 2000. Map is Courtesy of the National Drought Mitigation Center.
Monitoring Drought:
Drought monitoring is important because it allows scientists to track and evaluate changes to moisture conditions as they occur. It involves any activity that examines the variables that define drought. Because of the complexities associated with defining drought, several key drought indicators have been developed. When combined, these indicators can paint a much clearer picture of drought conditions at a given location. Many drought-related tools and data products have been created, all of which assist scientists in the identification and evaluation of drought. One of the most common tools available is the USDM's weekly drought monitor map (Figure 4). The map is produced using a variety of drought indicators and input from scientists across the country. Both sources prove to be equally important in developing an accurate depiction of drought conditions from week to week. Popular drought indicators include: the Standardized Precipitation Index (SPI), the Palmer Drought Severity Index (PDSI), the Crop Moisture Index (CMI), and the seven day Mean Streamflow Percentiles.
The SPI is used to identify precipitation deficits at certain locations. The values are standardized so they may be compared to values in different climate regions. In December, 2009, drought scientists from across the world met in Lincoln, Nebraska and they agreed that the SPI should be the international standard indicator for drought monitoring.
The PDSI uses both precipitation and temperature to indicate differing degrees of dryness. The index is intended to be used as a measure of long term agricultural drought. The CMI is a derivative of the PDSI, and it is calculated in a similar fashion. Unlike the Palmer Index, however; the CMI reflects short-term moisture deficits and therefore it is quite useful in the identification of potential agricultural drought.
The 7-day streamflow Percentiles is also useful because it indicates standardized streamflow values at hydrological gauge stations throughout the country. Values below a 20 percentile correspond to hydrological drought. It can also help identify areas that may be impacted by upstream drought conditions.
Drought Monitoring Activities at SCIPP:
SCIPP developed a monitoring tool that examines drought conditions in the eleven southeastern states that span from Oklahoma and Texas, to Florida and the Carolinas (Figure 5). The tool is very useful because it aggregates precipitation by climate division. It also provides users the ability to evaluate wet or dry conditions in a historical perspective. The tool has several components that allow users to select various map layers over different time periods and start dates. The selectable time periods coincide with those that are used by drought scientists across the country, which in turn allows for robust comparisons of drought conditions. In addition, the tool makes use of the internationally recognized SPI. Since its release, the drought tool has become popular among drought monitoring scientists in the southeastern United States. The SCIPP drought tool is available at:http://www.southernclimate.org/products/precip.php
Figure 5: A screen shot of the SCIPP Southern U.S. drought monitoring tool.