drought bulletin of · pdf filedrought bulletin of pakistan ... linger for years even after...
TRANSCRIPT

Pakistan Meteorological Department
Drought Bulletin
of
Pakistan
January-March 2013
National Drought Monitoring Centre Pakistan Meteorological Department
Sector H-8/2, Islamabad – 44000,P.O.Box#1214,
Phone # +92-51-9250598, Fax # +92-51-9250368
Website: www.pakmet.com.pk, Email: [email protected]
2
Drought Bulletin
January – March, 2013
S.No. Contents Page No.
1. Introduction 3
2. Historical Background 5
3. Rainfall Distribution(Jan –Mar) 2013
• Mist And Fog
5
7
4. Drought products;
i. Standardized Precipitation Index analysis
ii. Cumulative Precipitation Anomaly
iii. Soil Moisture Analysis
iv. Water level of Reservoirs
8
8
9
10
11
5.
5.1
5.2
5.3
Agriculture
• Crop Condition:January-2013
• Crop Condition:February-2013
• Crop Condition: March: 2013
12
12
13
13
6. District wise impact of drought 14
7. Government reactions to drought 14
8. Recommendations 14
9. Acknowledgement 15
10. References 15
3
Quarterly Drought Bulletin January – March, 2013
By
National Drought/Environment Monitoring & Early Warning Centre,
Pakistan Meteorological Department,
Islamabad
1. Introduction
Pakistan has a long latitudinal extent and the rainfall variability during different seasons is
considerably high. The climate of the country in its lower southern half is arid and hyper-arid
while the northern half of country lies between semi arid to very humid. Some regions of the
country in each seasons, remain drastically dry and area always vulnerable to drought. If
subsequent seasons fail to generate significant precipitation, the drought conditions then are sure to
take the vulnerable regions in the grip. All the provinces of Pakistan have a history of facing major
droughts in the past.
Drought differs from other natural disaster (e.g. flood, tropical cyclones, tornadoes and
earthquakes etc) in the sense that the effects of drought often accumulate slowly over a
considerable period of time and may linger for years even after the termination of the event.
Because of this drought is often referred to as a “Creeping Phenomena”. Drought impacts are less
obvious and are spread over large geographical areas than are the damages that results from other
natural hazards. Consequently drought affects more people than any other environmental hazard.
Unfortunately, no organizations dealing with the drought issues exist in Pakistan and the responses
to drought for the distressed economic and social sector, whenever such situation arose, were taken
on emergency and on adhoc basis. It is thus inevitable need of the time and Pakistan
Meteorological Department (PMD) took an initiative to establish National Drought/Environment
monitoring and Early Warning Centre (NDMC) in 2004-05 after the worst drought during 1999-
2001 in Pakistan. The main objective is to monitor drought situation in the country and issue
advisory before time. Its national centre is in Islamabad while four Regional Drought Monitoring
Centers (RDMC’s) are in Lahore, Karachi, Peshawar and Quetta. These four RDMC’s cover those
region which comes under their jurisdiction. These centers serve as a hub for the monitoring,

4
collection, consolidation and analysis of drought related data from all the possible sources in the
country. In order to strength the network, 50 Automatic weather stations (AWS) have been
installed in different regions particularly the drought prone areas of the country. The data of eleven
meteorological parameters (air temperature, humidity, wind speed, wind direction, dew point, sea
level pressure, station level pressure, solar radiations, soil moisture at standard
depths(5,10,20,50,100)cm and snow level are transmitted through satellite and GPRS technology
after 3 hours. So, it has now become easy to access the data of remote areas of the country. NDMC
has installed 335 Ordinary Rainguages have been installed at districts level in four provinces as
shown in figure-1
Total Ordinary Rainguages Installed
335
128
42
83
82
Pakistan
Sindh
KPK
Punjab
Balochistan
Rainguages
Figure-1 Rain-gauges Network of Pakistan by NDMC
NDMC also monitoring the water level situation of small dams in Barani areas of the country.
NDMC using different indices like Standardized Precipitation Index (SPI), Normalized difference
Vegetation Index (NDVI), Cumulative Precipitation Anomaly (CPA), Rainfall Anomaly Index
(RAI), Percent of normal, Probability of occurrence, Percentage departure and soil moisture

5
analysis etc to monitor drought. NDMC issues fortnightly drought bulletin of the country.
Negotiations are underway with NGO‘s and National Disaster Management Authority (NDMA)
for utilization of drought advisories / bulletin to end users.
2. Historical Background.
The Indian sub-continent is predominantly characterized by a tropical monsoon climate and entire
regime is distinguished mainly by the differences in rainfall both in quantity and distribution. The
most important feature is the regional and temporal alteration of atmospheric flow patterns
associated with monsoon. There are two rainfall systems operating in the region (a) Southwest or
Summer monsoon and (b) Northeast or the Winter monsoon.
Fortunately Pakistan also falls in this region which receive heavy amount of rainfall in summer due
to SW monsoon and in winter due to western disturbances. The summer monsoon accounts for 70
to 80% of the annual rainfall over major parts of South Asia (IMD, 2009). In Pakistan, summer
monsoon accounts 60 to 70% of the annual rainfall during July to September (Chaudhry, 1992).
There is a large variability in the monsoon rainfall on both space and time scales.
Droughts in Pakistan region are mainly due to various kinds of failures of rains from southwest
monsoon. Also there seems to be some association between El Nino and La Nina events and weak
monsoons. Pakistan frequently experiences several droughts. The Punjab province experienced the
worst droughts in 1899, 1920 and 1935. Khyber Pakhtunkhwa (KPK) experienced the worst
droughts in 1902 and 1951, while Sindh had its worst droughts in 1871, 1881,1899,1931,1947 and
1999. Over more than hundred year’s period between 1871-1988, 11 out of 21 drought years were
El Nino years. The El Nino phase of the Southern Oscillations (ENSO) has direct impact on
drought in Pakistan as it poses mainly negative impact on summer monsoon.
Due to climate change, wet and dry cycles some years we receive more rains in wet spell and in
dry spell we receive less rain. Due to less rain we have drought and heavy rain we have floods
(flash flood, urban flood, costal flood and river flood).
3. Rainfall Distribution (Jan–Mar) 2013
During first quarter of the year (Jan-Mar) 2013, above-normal (+62 %) precipitation was observed
over Pakistan. During this quarter high temporal and spatial variable precipitation has been
observed. Normally January and February are the coldest month in the country and northern areas
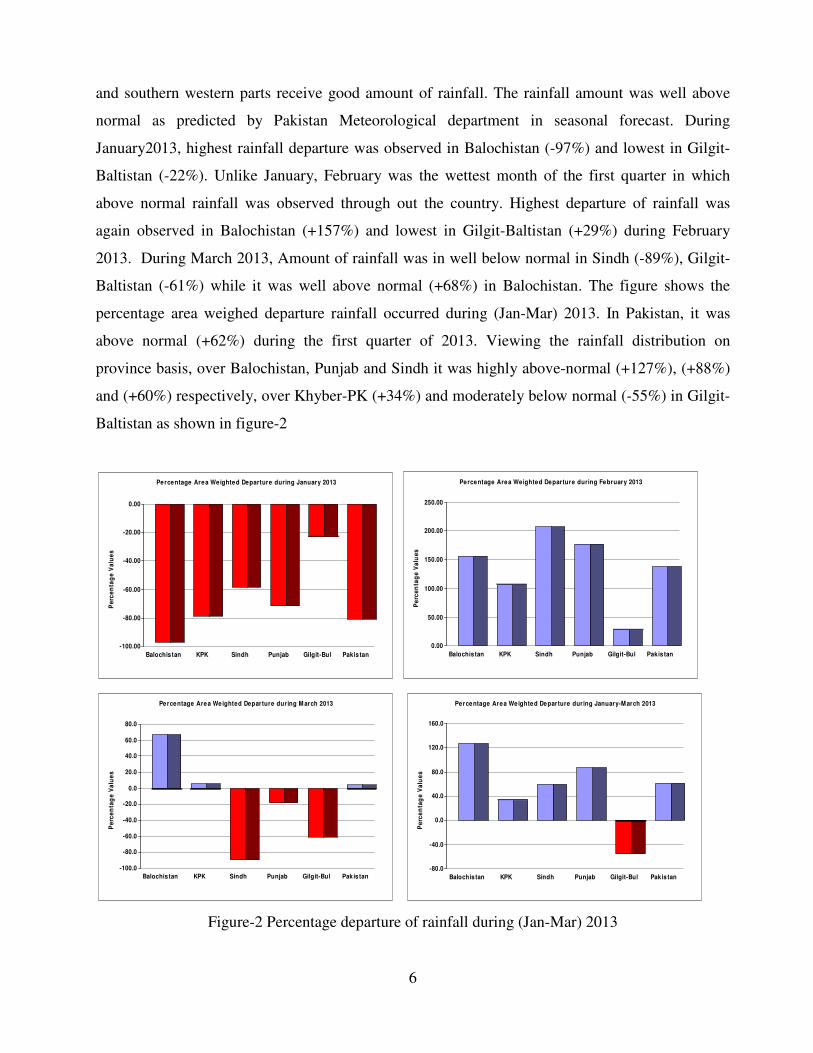
6
and southern western parts receive good amount of rainfall. The rainfall amount was well above
normal as predicted by Pakistan Meteorological department in seasonal forecast. During
January2013, highest rainfall departure was observed in Balochistan (-97%) and lowest in Gilgit-
Baltistan (-22%). Unlike January, February was the wettest month of the first quarter in which
above normal rainfall was observed through out the country. Highest departure of rainfall was
again observed in Balochistan (+157%) and lowest in Gilgit-Baltistan (+29%) during February
2013. During March 2013, Amount of rainfall was in well below normal in Sindh (-89%), Gilgit-
Baltistan (-61%) while it was well above normal (+68%) in Balochistan. The figure shows the
percentage area weighed departure rainfall occurred during (Jan-Mar) 2013. In Pakistan, it was
above normal (+62%) during the first quarter of 2013. Viewing the rainfall distribution on
province basis, over Balochistan, Punjab and Sindh it was highly above-normal (+127%), (+88%)
and (+60%) respectively, over Khyber-PK (+34%) and moderately below normal (-55%) in Gilgit-
Baltistan as shown in figure-2
-100.00
-80.00
-60.00
-40.00
-20.00
0.00
Pe
rce
nta
ge
Va
lue
s
Balochis tan KPK Sindh Punjab Gilgit-Bul Pakis tan
Percentage Area Weighted Departure during January 2013
0.00
50.00
100.00
150.00
200.00
250.00
Pe
rce
nta
ge
Va
lue
s
Balochis tan KPK Sindh Punjab Gilgit-Bul Pakis tan
Percentage Area Weighted Departure during February 2013
-100.0
-80.0
-60.0
-40.0
-20.0
0.0
20.0
40.0
60.0
80.0
Pe
rce
nta
ge
Va
lue
s
Balochis tan KPK Sindh Punjab Gilgit-Bul Pak is tan
Percentage Area Weighted Departure during M arch 2013
-80.0
-40.0
0.0
40.0
80.0
120.0
160.0
Pe
rce
nta
ge
Va
lue
s
Balochis tan KPK Sindh Punjab Gilgit-Bul Pakis tan
Percentage Area Weighted Departure during January-M arch 2013
Figure-2 Percentage departure of rainfall during (Jan-Mar) 2013
7
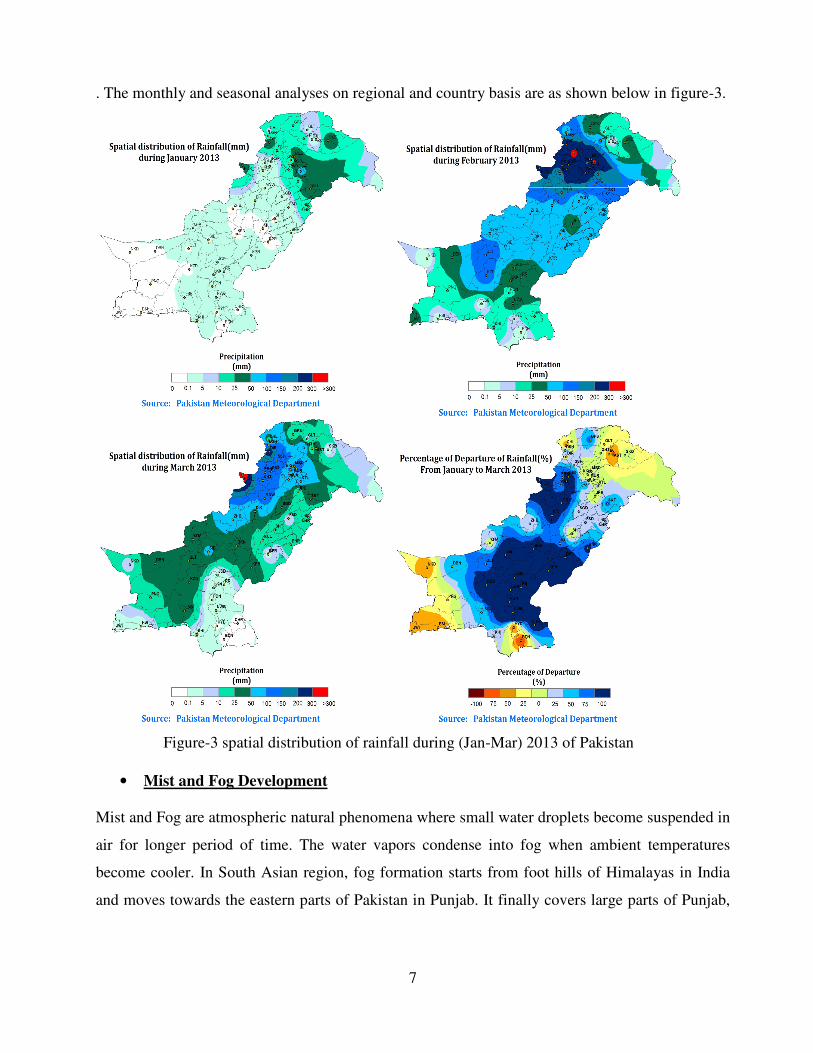
. The monthly and seasonal analyses on regional and country basis are as shown below in figure-3.
Figure-3 spatial distribution of rainfall during (Jan-Mar) 2013 of Pakistan
• Mist and Fog Development
Mist and Fog are atmospheric natural phenomena where small water droplets become suspended in
air for longer period of time. The water vapors condense into fog when ambient temperatures
become cooler. In South Asian region, fog formation starts from foot hills of Himalayas in India
and moves towards the eastern parts of Pakistan in Punjab. It finally covers large parts of Punjab,
8
major areas of Sindh crossing into adjoining districts of Balochistan across Sibbi, southern parts of
Khyber Pakhtunkhwa mainly around Indus river.
4. Drought products
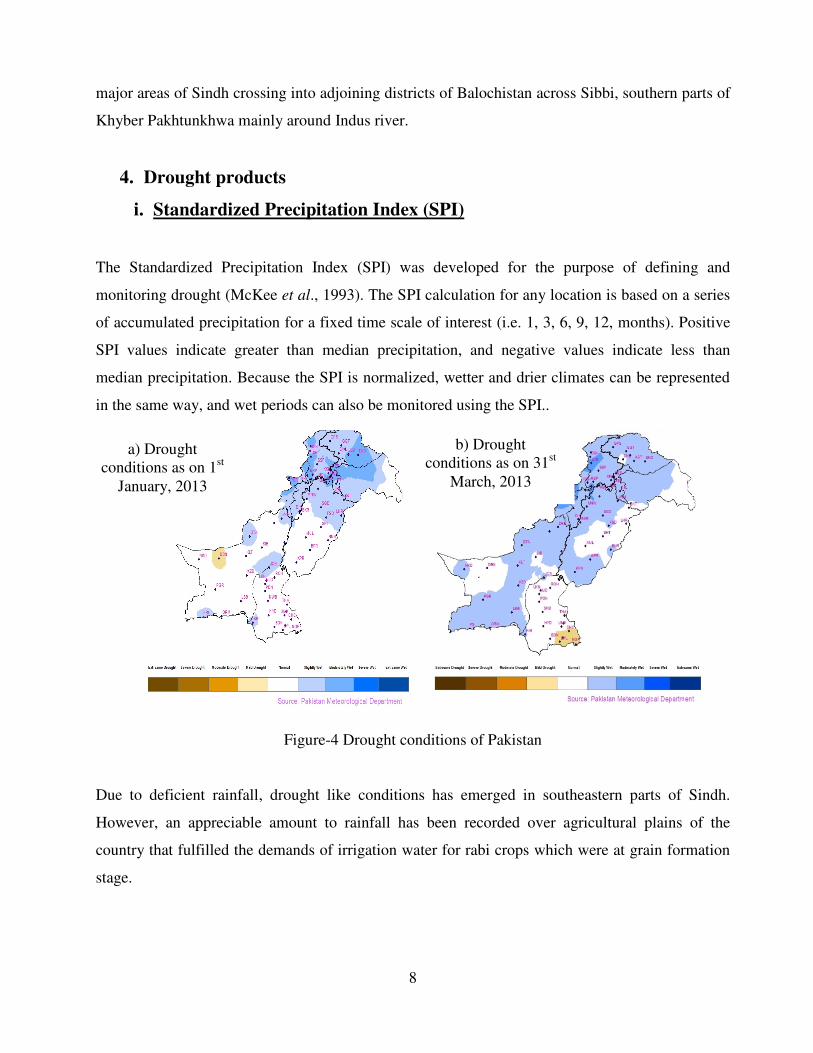
i. Standardized Precipitation Index (SPI)
The Standardized Precipitation Index (SPI) was developed for the purpose of defining and
monitoring drought (McKee et al., 1993). The SPI calculation for any location is based on a series
of accumulated precipitation for a fixed time scale of interest (i.e. 1, 3, 6, 9, 12, months). Positive
SPI values indicate greater than median precipitation, and negative values indicate less than
median precipitation. Because the SPI is normalized, wetter and drier climates can be represented
in the same way, and wet periods can also be monitored using the SPI..
Figure-4 Drought conditions of Pakistan
Due to deficient rainfall, drought like conditions has emerged in southeastern parts of Sindh.
However, an appreciable amount to rainfall has been recorded over agricultural plains of the
country that fulfilled the demands of irrigation water for rabi crops which were at grain formation
stage.
a) Drought
conditions as on 1st
January, 2013
b) Drought
conditions as on 31st
March, 2013

9
ii. Cumulative Precipitation Anomaly (CPA)
January is the coldest month of the year for Pakistan. Due to lower solar angle, active western
disturbance and sometimes extension of secondaries of frontogenatic systems at higher latitudes of
the country are cooler than the lower latitudes independent of elevation of the location. At high
elevations, the frequency of occurrence of freezing temperature is highest in January as a normal
feature. Westerly waves would continue to move along the middle latitudes and their troughs are
expected to extend south ward occasionally affecting country’s agricultural plains.
During February, the days were cooler and night’s temperatures were very cold. Such daytime and
night temperatures resulted into below normal mean daily temperatures throughout the cultivated
plains of the country. In this way temperature regime during February remained less favourable for
Rabi crop's growth and development process. The soil moisture reserves were available and lower
temperatures retard evapotranspirative loss of moisture.
March is normally the wettest month of winter season. Heating starts over the subcontinent due to
increasing solar angle and the sun shine over the equator during last decade of the month. Heating
trend triggers energetic weather systems, which resulted in increasing number of dust / wind
storms and precipitation. March marks substantial addition to Rabi season precipitation and rising
temperatures contribute significantly in photosynthesis process.
During January to March 2013, it was observed that Cumulative Precipitation Anomaly was
positive in southern and central parts except some of the barani areas, extreme north and south
western parts of Balochistan. Most parts of Eastern Sindh are under flood water because of
monsoon 2011 intense rainfall. The day time temperature is low and Evapotranspiration is
relatively stumpy as compare to the previous quarter therefore conditions are satisfactory and no
moisture stress has observed especially lower and central regions of the country. While the barani
areas of KPK and Potohar regions are under water stress.

10
(a) (b)
(c)
Figure-5 Cumulative precipitation anomaly during (Jan-Mar) 2013 of Pakistan
iii. Soil Moisture Anomaly (SMA)
It was observed that amount of rainfall during January to March was below normal in the country
as shown in figure-6. Soil moisture conditions in north eastern Punjab including barani areas and
central and north western parts of the country are slightly under stress. It was predicted that rainfall

11
will be well below normal in January-March 2013 due to which soil moisture stress may be more
strengthen especially in the rainfed areas of the country.
(a) (b)
(c)
Figure-6 soil moisture anomaly during (Jan-Mar) 2013 of Pakistan
iv. Water Level of Reservoirs
Pakistan has two main reservoirs of water in the form of dam i.e. Tarbela and Mangla. The dead
level of Tarbela is 1378feet while maximum conservation level is 1550feet while Mangla has dead
level of 1040feet and maximum conservation level of 1242feet. Due to good monsoon rains,
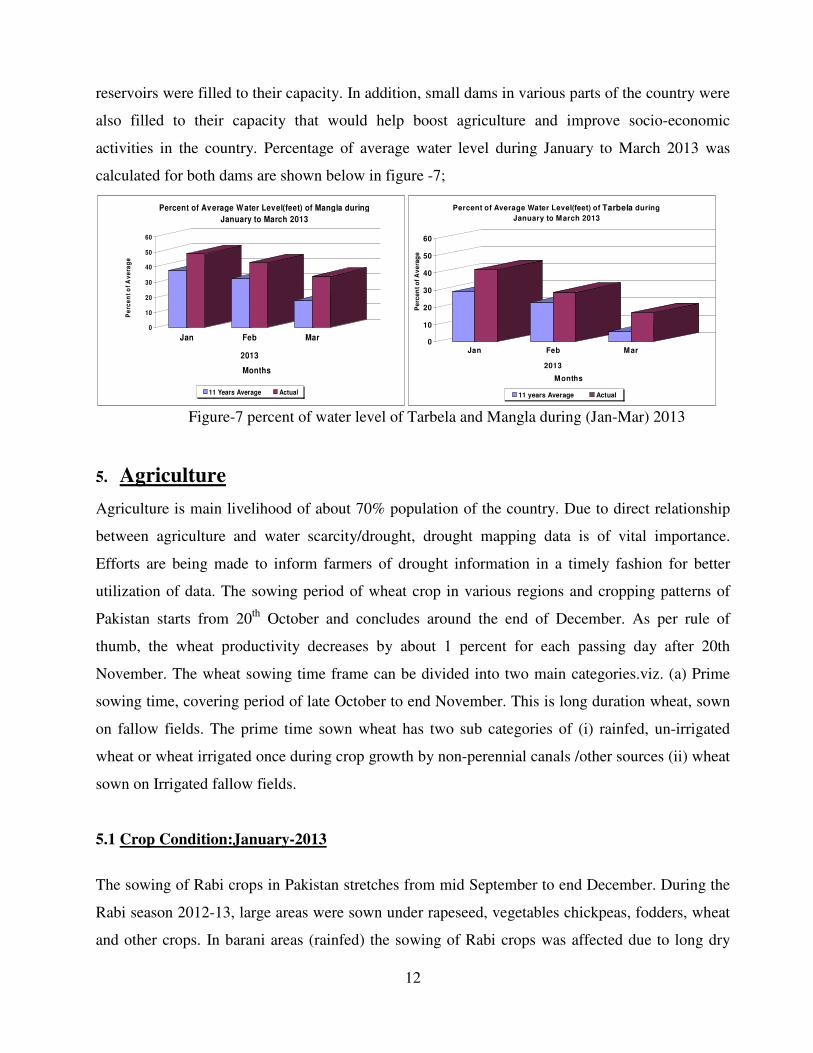
12
reservoirs were filled to their capacity. In addition, small dams in various parts of the country were
also filled to their capacity that would help boost agriculture and improve socio-economic
activities in the country. Percentage of average water level during January to March 2013 was
calculated for both dams are shown below in figure -7;
0
10
20
30
40
50
60
Pe
rce
nt
of
Av
era
ge
Jan Feb Mar
2013
Months
Percent of Average Water Level(feet) of Mangla during
January to March 2013
11 Years Average Actual
0
10
20
30
40
50
60
Pe
rce
nt
of
Av
era
ge
Jan Feb Mar
2013
Months
Percent of Average Water Level(feet) of Tarbela during
January to March 2013
11 years Average Actual
Figure-7 percent of water level of Tarbela and Mangla during (Jan-Mar) 2013
5. Agriculture
Agriculture is main livelihood of about 70% population of the country. Due to direct relationship
between agriculture and water scarcity/drought, drought mapping data is of vital importance.
Efforts are being made to inform farmers of drought information in a timely fashion for better
utilization of data. The sowing period of wheat crop in various regions and cropping patterns of
Pakistan starts from 20th
October and concludes around the end of December. As per rule of
thumb, the wheat productivity decreases by about 1 percent for each passing day after 20th
November. The wheat sowing time frame can be divided into two main categories.viz. (a) Prime
sowing time, covering period of late October to end November. This is long duration wheat, sown
on fallow fields. The prime time sown wheat has two sub categories of (i) rainfed, un-irrigated
wheat or wheat irrigated once during crop growth by non-perennial canals /other sources (ii) wheat
sown on Irrigated fallow fields.
5.1 Crop Condition:January-2013
The sowing of Rabi crops in Pakistan stretches from mid September to end December. During the
Rabi season 2012-13, large areas were sown under rapeseed, vegetables chickpeas, fodders, wheat
and other crops. In barani areas (rainfed) the sowing of Rabi crops was affected due to long dry

13
spell. The crops in these areas have been under moisture stress and there is a dire need of rainfall
in barani areas (rainfed) during early part of January. The sowing of wheat crop started from the
barani (rainfed) areas during mid October. This operation proliferated to irrigated-fallow areas in
November and to areas from the harvest of cotton and rice crops in December.
Rabi Crops
The sowing situation of Rabi crops is as follows:
• Wheat Crop
Wheat is the crop grown on the largest area in Pakistan. A question has arisen on the fraction of
wheat area coming from different cropping patterns. The temperature regimes greatly affect
growth of crop plants. Wheat crop flourishes with in a range of 4.0 °C to 37.0°C. The meiosis
process responsible for plant growth comes to a halt in wheat crop at ambient temperature of 4 0C
or below
5.2 Crop Situation: February, 2013
Wheat is the most important food security crop of Pakistan. The growth of wheat crop is generally
slow across the country due to multiple factors mainly low ambient temperatures. The harvest of
the crop is likely to be delayed by 10 days or so.
The weather variables as rainfall and temperature regimes significantly influence the productivity
of wheat crop. This is an opportune rabi season in terms of receiving nine rains of varying intensity
from December 2012 to February 2013, almost all over the country. This has kept the soils, free of
moisture stress and ambient temperatures in the cool range.
.
• Sowing of wheat in cotton-wheat cropping region:
The sowing of Rabi crops during the year 2012-13 started in a customary way except on the flood
affected districts of Sindh and Balochistan where irrigation water from flash floods kept ponding
for long periods.
5.3 Crop Situation: March, 2013
The principal time for harvest operations of wheat crop in Pakistan start mainly in early March
from Thar region of Sindh and gradually moves upcountry, touching Peshawar Valley of KP in
mid May.

14
Wheat Crop
The harvesting of wheat crop in lower Sindh starts at the end of February from areas around
UmerKot, Mirpurkhas and others. The harvest season moves upcountry progressively. The crop is
harvested in Upper Sindh, Southern parts of Balochistan, KP and Punjab in April and Central
Punjab and Potohar in late April /early May. The crop harvesting in Peshawar valley of KP is
carried in late May and in GB / Northern KP during June
5 District wise impact of drought
Due to wetter than normal season, no serious negative impacts of drought have been reported from
any part of the country. However there is mild drought reported in northeastern, southwestern parts
of Balochistan and barani areas of Punjab including Potohar plateau because of the below normal
rainfall during October to December 2011
6 Government reactions to drought
Due to deficient rainfall, mils drought was reported in southeastern parts of Sindh. The water
availability in major reservoirs is sufficient and higher than their past averages. These conditions
will increase due to above normal snowfall in the catchments areas. Water situation in the dams
will improve with the increase of temperature after mid-March It is therefore advised to all
stakeholders for an immediate water management strategy to avoid negative impacts of deficit
rainfall on agriculture sector. NDMC continued its monitoring activities and drought monitor was
regularly updated on fortnightly basis at PMD website http://www.pmd.gov.pk/ndmc/index.htm.
7 Recommendations
Natural disaster could not be stopped. Each disaster gives us a lesson to do better planning,
management and taking some precautionary measures to minimize its impacts in future. Following
are some recommendations to cope with the floods and droughts in Pakistan
• Pakistan dam’s water storage capacity is much less than the neighbouring countries like
India. Therefore it is the need of the hour to built large and small dames in catchments
areas especially the rainfall water during monsoon period.
• Manage the floods and storage the water
• The stored water will protect food security especially fulfill the water requirements of crops
during drought period in the country.

15
• The water will also be helpful in generating hydropower electricity which is essential
requirement of country and reduce the unemployment in the country.
8 Acknowledgement
National drought monitoring centre, Pakistan Meteorological Department, Islamabad
acknowledges SUPARCO and district office agricultural department Sargodha for sharing the
information.
9 References:
1. Chaudhry, Q.Z.1992: Analysis and Seasonal prediction of Pakistan Summer Monsoon
Rainfall, Ph.D. Thesis, Univ. of Philippines, Quezon City, Philippines.
2. Edwards, D.C.; and T. B. McKee. 1997. Characteristics of 20th century drought in the
United States at multiple time scales. Climatology Report Number 97–2, Colorado State
University, Fort Collins, Colorado.
3. FAO report available on web at www.fao.org/news/story/en/item/89752/icode/
4. McKee, T.B.; N.J. Doesken; and J. Kleist. 1993. The relationship of drought frequency and
duration to time scales. Preprints, 8th Conference on Applied Climatology, pp. 179–184.
January 17–22, Anaheim, California.
5. http://www.suparco.gov.pk/pages/pak-scms.asp