drop out eag_2013
TRANSCRIPT

8/10/2019 Drop Out EAG_2013
http://slidepdf.com/reader/full/drop-out-eag2013 1/47
EDUCATIONAL STATISTICSAT A GLANCE
GOVERNMENT OF INDIAMINISTRY OF HUMAN RESOURCE DEVELOPMENT
BUREAU OF PLANNING, MONITORING & STATISTICSNEW DELHI
2013

8/10/2019 Drop Out EAG_2013
http://slidepdf.com/reader/full/drop-out-eag2013 2/47

8/10/2019 Drop Out EAG_2013
http://slidepdf.com/reader/full/drop-out-eag2013 3/47

8/10/2019 Drop Out EAG_2013
http://slidepdf.com/reader/full/drop-out-eag2013 4/47
PROJECT TEAM
Shri SanjayDirector
Smt. Ruchika GuptaJoint Director
Shri M. C. ShuklaDeputy Director

8/10/2019 Drop Out EAG_2013
http://slidepdf.com/reader/full/drop-out-eag2013 5/47
CONTENTS
Table No.
Page No.
Part-I: Population and Literacy
1 Population -2001&2011 12 Estimated Population by Age Group-2010 1
3 Literacy rates (7+ Age group)- 2001 & 2011 2
4 Adult Literacy Rates (15+ Age Group)- 2001&2007-08
2
Part-II: Key Education Statistics 2010-11 (Provisional)5 Number of Institutions by Type 3
6 EnrolmentA: Level-wise Enrolment in School & Higher
Education4
B: % Enrolment at Ph.D., M.Phil.& PostGraduate Level in Major Disciplines/ subjects
5
C: % Enrolment at Under Graduate Level inMajor Disciplines/ Subjects
6
D: Enrolment in Higher Education throughRegular & Distance Mode
7
E: Representation of Foreign Student in Higher
Education
7
7 Number of Teachers and Pupil Teacher Ratio byType of Institution
8

8/10/2019 Drop Out EAG_2013
http://slidepdf.com/reader/full/drop-out-eag2013 6/47
8 Gender Parity Index 89 Gross Enrolment Ratio (GER) 910 Level-wise Drop–out Rates in School Education 1011 Examination Results
A: Class X Examination-2010 11B: Class XII Examination-2010 11C: Class XII - Selected Streams-2010 12
12 Open School Examination ResultsA: Class X Examination-2010 13B: Class XII Examination-2010 13
13 Expenditure (Centre +States/UTs) on Education
A: Expenditure (Center+States/UTs) onEducation by Type- 2009-10
14
B: Expenditure (Center+States/UTs) onEducation by Type- 2010-11
14
C: Expenditure (Center+States/UTs) onEducation by Type- 2011-12
14
D: Expenditure (Revenue) on Education byEducation and Other Departments by Sector-2009-10
15
E: Expenditure(Revenue) on Education byEducation and Other Departments by Sector-- Revised Estimate -2010-11
15

8/10/2019 Drop Out EAG_2013
http://slidepdf.com/reader/full/drop-out-eag2013 7/47
F : Expenditure(Revenue) on Education byEducation and Other Departments bySector --Budget Estimate -2011-12
15
Part-III: Time Series Data
14 Literacy Rates 16
15 Number of Recognized Educational Institutions 1616 Level-wise Enrolment
A: All Categories of Students 17B: SC Students 18C: ST Students 19
17 Number of Teachers by Type of School 2018 Gross Enrolment Ratio (GER)
A: All Categories of Students 21-22B: SC Students 23-24C: ST Students 25-26
19 Number of Girls enrolled per hundred Boysenrolled by Stages of School Education
27
20 Gender Parity Index (GPI)A: All Categories of Students 28
B: SC Students 29
C: ST Students 3021 Stage –wise Drop-out Rates in School Education

8/10/2019 Drop Out EAG_2013
http://slidepdf.com/reader/full/drop-out-eag2013 8/47
A: All Categories of Students 31B: SC Students 32
C: ST Students 3322 Pupil Teacher Ratio (PTR) 34
23 Number of Female Teachers per Hundred MaleTeachers
35
24 Public Expenditure on Education and GrossDomestic Product (GDP)
36

8/10/2019 Drop Out EAG_2013
http://slidepdf.com/reader/full/drop-out-eag2013 9/47
PART-I
POPULATION
AND
LITERACY

8/10/2019 Drop Out EAG_2013
http://slidepdf.com/reader/full/drop-out-eag2013 10/47
(in Crore)
Total
Male
Female
(Figure in '000)
Total SC ST6‐10 Years 116643 20500 10844 Primary
(I‐V)11‐13 Years 72593 12246 6100 Upper Primary
(VI‐VIII)6‐13 Years 189236 32746 16944 Elementary
(I‐VIII)14‐15 Years 48854 8055 4079 Secondary
(IX‐X)
6‐15 Years 238090 40801 21023 I‐X
16‐17 Years 49427 7797 3800 Sr. SecondaryXI‐XII6‐17 Years 287517 48598 24823 I‐XII
18‐23 Years 141682 22498 10779 Higher Education
1
Table1 -:Population Census - 2001 & 2011
53.20
102.80
2001 2011
58.74
62.31
121.05
Table -2: Estimated Population by Age Group -2010
EDUCATIONAL STATISTICS AT GLANCE
Corresponding Level of
Education Age group
Estimated Population
49.65
8/10/2019 Drop Out EAG_2013
http://slidepdf.com/reader/full/drop-out-eag2013 11/47
2011Total SC ST Total
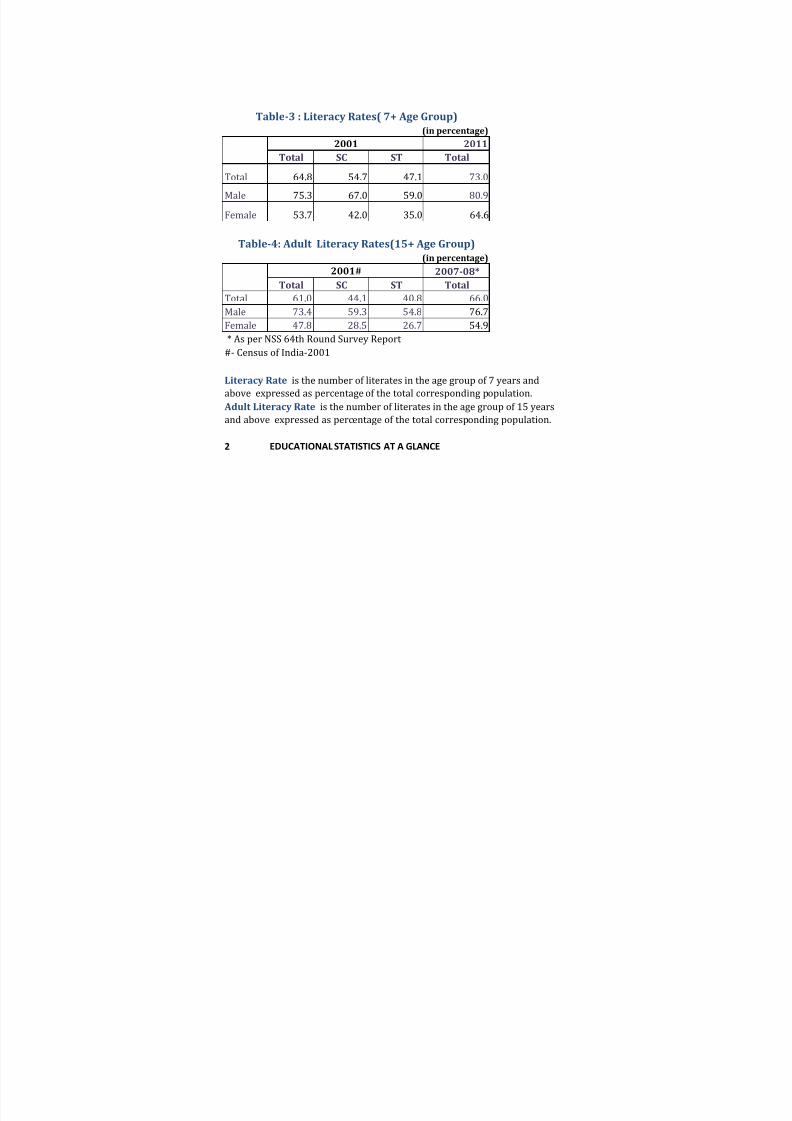
Total 64.8 54.7 47.1 73.0
Male 75.3 67.0 59.0 80.9Female 53.7 42.0 35.0 64.6
2007 -08*Total SC ST Total
Total 61.0 44.1 40.8 66.0Male 73.4 59.3 54.8 76.7Female 47.8 28.5 26.7 54.9 * As per NSS 64th Round Survey Report #‐ Census of India‐2001
2
Table -4: Adult Literacy Rates(15+ Age Group)
Table -3 : Literacy Rates( 7+ Age Group)
EDUCATIONAL STATISTICS AT A GLANCE
2001
2001#
Literacy Rate is the number of literates in the age group of 7 years and
above expressed as percentage of the total corresponding population. Adult Literacy Rate is the number of literates in the age group of 15 yearsand above expressed as percentage of the total corresponding population.
(in percentage)
(in percentage)

8/10/2019 Drop Out EAG_2013
http://slidepdf.com/reader/full/drop-out-eag2013 12/47
PART-II
KEY EDUCATIONSTATISTICS
2010-11(PROVISIONAL)

8/10/2019 Drop Out EAG_2013
http://slidepdf.com/reader/full/drop-out-eag2013 13/47
Number748547447600128370
71814
1396331Central University 41State Public University 281Deemed University 131State Private University 87
Central Open University 1State Open University 13
Institution of NationalImportance 59Institutions under StateLegislature Act 5Others 3Total 621
CollegeDiploma Level Technical 3586PGDM 496Diploma Level Nursing 2133Diploma Level TeacherTraining 4929Total 11144
3EDUCATIONAL STATISTICS AT A GLANCE
Stand AloneInstitution
HigherEducation
32974
Senior Secondary
Total
Universities
SchoolEducation
TypePrimaryUpper PrimarySecondary
Table -5: Number of Institutions by Type -2010 -11

8/10/2019 Drop Out EAG_2013
http://slidepdf.com/reader/full/drop-out-eag2013 14/47
Boys Gir s Tota Boys Gir s Tota Boys Gir s TotaPrimary(I‐V) 70468 64849 135317 14104 12947 27051 7674 7178 14852
Upper Primary
(VI‐VIII) 32808 29248 62056 5978 5321 11299 2837 2585 5422Elementary(I‐VIII) 103276 94097 197373 20082 18268 38350 10512 9762 20274
Secondary(IX‐X) 17453 14326 31779 3151 2562 5713 1202 970 2172
I‐X 120729 108423 229152 23233 20830 44063 11714 10732 22446Senior Secondary(XI‐XII) 10848 8568 19416 1677 1311 2988 629 465 1094
I‐XII 131577 116991 248568 24910 22141 47051 12343 11197 23540
Ph.D 48 30 78 NA NA NA NA NA NA
MPhil 12 13 25 NA NA NA NA NA NA
Post Graduate 1814 1456 3270 NA NA NA NA NA NA
Under Graduate 12118 9854 21972 NA NA NA NA NA NA
PG Diploma 90 50 140 NA NA NA NA NA NADiploma 1281 532 1813 NA NA NA NA NA NA
Certificate 67 77 144 NA NA NA NA NA NA
Integrated 36 21 57 NA NA NA NA NA NAHigher Education ‐Total
15466 12033 27499 1725 1320 3045 687 520 1208
NA‐Not Available
E D U C A T I O N A L S T A T I S T I C S A T A G L A N
C E
4
ST
Table -6 A : Level -wise Enrolment in School & Higher Education -2010 -11
Level All Categories SC
(in '000')

8/10/2019 Drop Out EAG_2013
http://slidepdf.com/reader/full/drop-out-eag2013 15/47
Discipline Ph.D. M.Phil. Post
GraduateAgriculture & Allied 3.44 0.11 0.53Commerce 3.26 5.50 6.98Computer Science/ ComputerApplication
1.80 3.11 6.41
Engineering & Technology 19.72 1.11 8.06Foreign Language 2.47 5.03 3.72
Home Science 0.93 0.21 0.31Indian Language 6.11 9.50 7.65Journalism & Mass Communication 0.52 0.34 0.56Law 0.89 0.85 1.00Management 4.78 1.57 22.65Medical Science 2.29 1.11 2.09Science 29.27 21.68 11.68Social Science 19.63 40.93 23.75Other 4.87 8.97 4.61
5 EDUCATIONAL STATISTICS AT A GLANCE
Table: 6B - % Enrolment in Higher Education at Ph.D.,M.Phil. & Post Graduate Level in Major Disciplines/ Subjects

8/10/2019 Drop Out EAG_2013
http://slidepdf.com/reader/full/drop-out-eag2013 16/47
Discipline % Enrolment Arts/ Humanities/ SocialSciences
46.61
Engineering & Technology 17.73
Commerce 13.54Science 10.85Computer
Science/Computer2.97
Medical Science 2.79Management 2.51Law 0.95Agriculture & Allied 0.61Other 1.45
6
Table: 6C- % Enrolment in Higher Educationat Under Graduate Level in Major Disciplines/ Subjects
EDUCATIONAL STATISTICS
AT
A
GLANCE

8/10/2019 Drop Out EAG_2013
http://slidepdf.com/reader/full/drop-out-eag2013 17/47
Mode Male Female Total %
Regular 13479707 10705588 24185295 88
Distance 1986852 1327602 3314454 12
Total 15466559 12033190 27499749
Counteries Male Female Total
All Counteries 17328 10203 27531
NEPAL 2608 2436 5044IRAN 1306 1283 2589AFGHANISTAN 1950 216 2166BHUTAN 765 488 1253
SUDAN 1113 531 1166UNITED STATES 493 522 1015CHINA 669 282 951IRAQ 787 104 891SRI LANKA 443 435 878MALAYSIA 263 567 830
EDUCATIONAL STATISTICS AT A GLANCE 7
Table 6D: Enrolment in Higher Education through Regular & Distace Mode
E: Representation of Foreign Student in Higher Education
Top 10 Counteries

8/10/2019 Drop Out EAG_2013
http://slidepdf.com/reader/full/drop-out-eag2013 18/47
Type of Institution No.of Teachers
Female Teachers per
100 Male Teachers
Pupil Teacher
Ratio
Primary 2100462 76 43
Upper Primary 1887343 80 33
Secondary 1244515 61 30
Senior Secondary 1255586 65 34
Higher Education NA 59 26*
Level Total SC STPrimary (I -V) 1.01 1.01 1.00Upper Primary (VI -VIII) 0.95 0.97 0.96Elementary (I -VIII) 0.99 1.00 0.99Secondary (IX-X) 0.88 0.91 0.86I-X 0.97 0.99 0.97Sr.Secondary (XI-XII) 0.86 0.90 0.76I-XII 0.96 0.98 0.96
Higher Education 0.86 0.84 0.79
8
Gender Parity
Index(GPI)
is the ratio of Girls GER to Boys GER ina given level of education.
Ratio by Type of Institution
Table -8: Gender Parity Index
EDUCATIONAL STATISTICS AT A GLANCE
Table -7: Number of Teachers and Pupil Teacher
NA-Not Available* Dose not include Stand Alone Institutions

8/10/2019 Drop Out EAG_2013
http://slidepdf.com/reader/full/drop-out-eag2013 19/47
Boys Girls Total Boys Girls Total Boys Girls TotalPrimary (I -V) 115.4 116.7 116.0 131.3 132.7 132.0 137.2 136.7 137.0
Upper Primary (VI -VIII) 87.7 83.1 85.5 93.8 90.6 92.3 90.7 87.0 88.9Elementary (I -VIII) 104.9 103.7 104.3 117.3 116.9 117.1 120.5 118.7 119.7Secondary (IX-X) 69.0 60.8 65.0 74.0 67.5 70.9 57.1 49.1 53.3
I-X 97.6 94.8 96.2 108.7 107.2 108.0 108.2 105.3 106.8Senior Secondary (XI-XII) 42.2 36.1 39.3 40.3 36.1 38.3 32.7 24.8 28.8
I-XII 88.0 84.8 86.5 97.5 96.0 96.8 96.8 92.8 94.8Higher Education 20.8 17.9 19.4 14.6 12.3 13.5 12.9 9.5 11.2
Gross Enrolment Ratio (GER) is the total student enrolment in a given level ofeducation , regardless of age expressed as percentage of the corresponding eligibleofficial age group population in a given school year
9
( in % age)
E D U C A T I O N A L S T A T I S T I C S
A T A G L A N C E
Level ALL SC ST
Table -9: Gross Enrolment Ratio(GER)

8/10/2019 Drop Out EAG_2013
http://slidepdf.com/reader/full/drop-out-eag2013 20/47
(in % age)
Boys Girls Total Boys Girls Total Boys Girls Total
I‐V 28.7 25.1 27.0 29.8 23.1 26.7 37.2 33.9 35.6
I‐VIII 40.3 41.0 40.6 46.7 39.0 43.3 54.7 55.4 55.0
I‐X 50.4 47.9 49.3 57.4 54.1 56.0 70.6 71.3 70.9
1 0
Table -10: Level -wise Drop -Out Rates in School EducationE D U C A T I O N A L S T A T I S T I C S A T A G L A N C E
ALL SC STLevel/ Category
Drop -out Rate is the percentage of students who drop out from agiven grade or cycle or level of education in a given school year.

8/10/2019 Drop Out EAG_2013
http://slidepdf.com/reader/full/drop-out-eag2013 21/47
1 1
Boys Girls Total Boys Girls Total Boys Girls Total
All 93.7 73.5 167.2 68.6 56.8 125.4 73.2 77.4 75.0
SC 15.2 11.7 26.9 10.2 8.3 18.5 67.2 71.3 69.0
ST 6.1 4.8 10.9 3.8 2.9 6.7 62.4 61.5 62.0
* ‐ Includes Regular & Private Students.#‐ Includes Students Passed in Annual & Supplementary Examinations.
Note: Percentages may not tally exactly due to rounding off
Boys Girls Total Boys Girls Total Boys Girls Total
All 58.6 45.5 104.1 42.9 37.1 80.0 73.2 81.5 76.8
SC 8.4 6.1 14.5 5.6 4.6 10.2 67.1 75.8 70.8
ST 3.5 2.4 5.9 2.3 1.7 4.0 65.4 69.7 67.2* ‐ Includes Regular & Private Students.#‐ Includes Students Passed in Annual & Supplementary Examinations.Note: Percentages may not tally exactly due to rounding off
E D
U C A T I O N A L S T A T I S T I C S A T A G L A N C E
Category Numbers of Students (in Lakh)Pass percentage Appeared* Passed#
B: Class XII Examination - 2010
Table -11: Examination Results A: Class X Examination - 2010
Category Numbers of Students (in Lakh)Pass percentage Appeared* Passed#
8/10/2019 Drop Out EAG_2013
http://slidepdf.com/reader/full/drop-out-eag2013 22/47
1 2
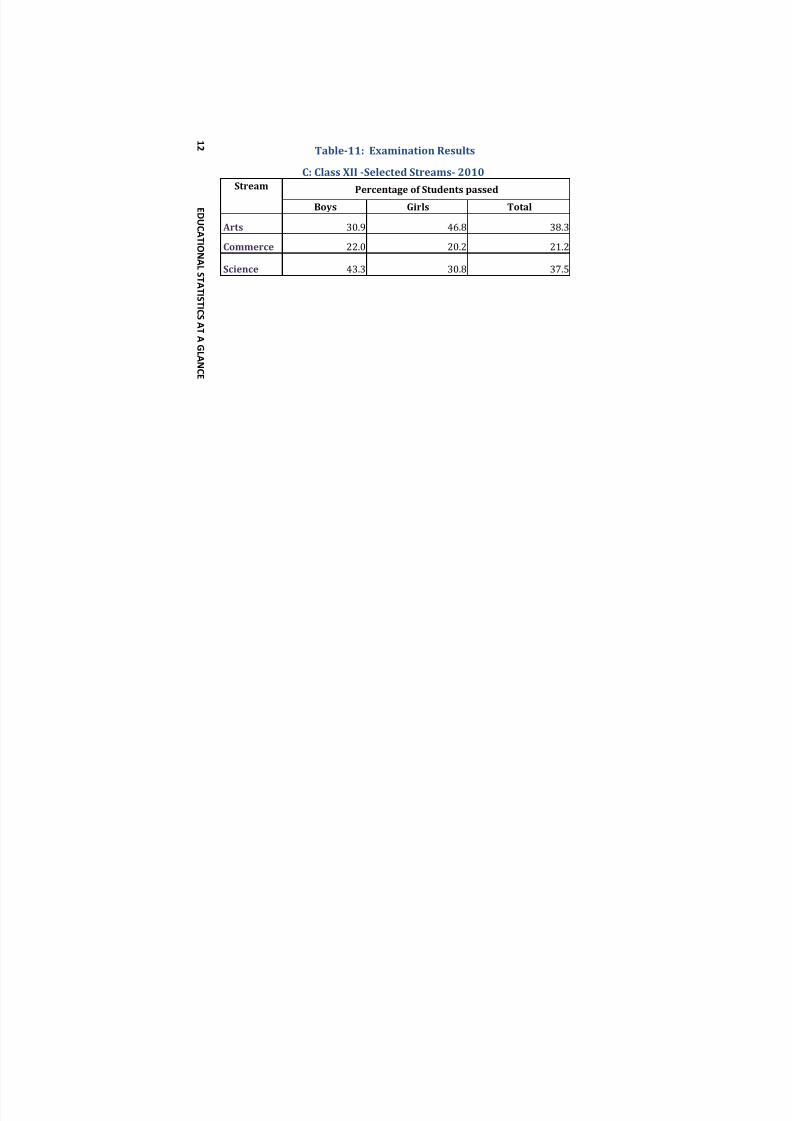
Boys Girls Total
Arts 30.9 46.8 38.3
Commerce 22.0 20.2 21.2
Science 43.3 30.8 37.5
E D U C A T I O N A L S T A T I S T I C S A T A G L A N C E
Stream
Table -11: Examination Results
C: Class XII -Selected Streams - 2010
Percentage of Students passed

8/10/2019 Drop Out EAG_2013
http://slidepdf.com/reader/full/drop-out-eag2013 23/47
Boys Girls Total Boys Girls Total Boys Girls Total
All 309 215 524 167 106 273 54.0 49.3 52.1
SC 44 28 72 23 14 37 52.3 50.0 51.4
ST 30 25 55 14 12 26 46.7 48.0 47.3
Boys Girls Total Boys Girls Total Boys Girls Total
All 196 109 305 111 54 165 56.6 49.5 54.1
SC 25 12 37 13 6 19 52.0 50.0 51.41 3 ST 12 11 23 6 6 12 50.0 54.5 52.2
B:Class XII Examination - 2010
E D U C A T I O N A L S T A T I S T I C S A T A G L A N C E
Table -12: Open School Examination Results A: Class X Examination - 2010
Category Numbers of Students (in '000')Pass percentage Appeared Passed
Category Numbers of Students (in '000')Pass percentage Appeared Passed

8/10/2019 Drop Out EAG_2013
http://slidepdf.com/reader/full/drop-out-eag2013 24/47
Revenue TotalExpenditure on Educationby Education Department
190136.08 193567.15
Expenditure on Educationby Other Departments
51119.94 51119.94
Total 241256.02 244687.09
Revenue Total
Expenditure on Educationby Education Department
244395.63 249338.20
Expenditure on Educationby Other Departments
61035.86 61035.86
Total 305431.49 310374.06
Revenue Total
Expenditure on Education
by Education Department 280600.81 286735.89Expenditure on Educationby Other Departments
67779.28 67779.28
Total 348380.09 354515.17
14
0.00 0.00
6073.28 61.80
EDUCATIONAL STATISTICS AT A GLANCE
6073.28 61.80
0.00 0.00
4871.12 71.45
C: Expenditure (Centre+States/UTs) on Education by Type - 2011 -12(BE)
Capital Loan & Advances
4871.12 71.45
B: Expenditure (Centre+States/UTs) on Education by Type - 2010 -11(RE)
Capital Loan & Advances
Table -13 A: Expenditure (Centre+States/UTs) on Education by Type - 2009 -10 (in Crore)
Capital Loan & Advances
3057.23 373.84
0.00 0.00
3057.23 373.84

8/10/2019 Drop Out EAG_2013
http://slidepdf.com/reader/full/drop-out-eag2013 25/47
States/UTs Centre Total States/UTs Centre Total
Elementary Education 77127.36 21739.85 98867.21 1.26 0.36 1.62Secondary Education 54494.25 5865.69 60359.94 0.89 0.10 0.99University & Higher Education 28015.68 18617.57 46633.25 0.46 0.30 0.76Adult Education 335.94 429.90 765.84 0.01 0.01 0.01Technical Education 17259.56 17370.22 34629.78 0.28 0.28 0.57Total (Education) 177232.79 64023.23 241256.02 2.90 1.05 3.95
States/UTs Centre Total States/UTs Centre Total
Elementary Education 96851.44 31744.19 128595.63 1.33 0.44 1.77
Secondary Education 69104.39 7470.35 76574.74 0.95 0.10 1.05
University & Higher Education 35523.93 22423.51 57947.44 0.49 0.31 0.80Adult Education 472.55 503.48 976.03 0.01 0.01 0.01Technical Education 21548.40 19789.26 41337.66 0.30 0.27 0.57Total (Education) 223500.71 81930.79 305431.50 3.08 1.13 4.20
States/UTs Centre Total States/UTs Centre Total
Elementary Education 112545.04 35205.58 147750.62 1.35 0.42 1.77Secondary Education 78187.15 9523.32 87710.47 0.94 0.11 1.05
University & Higher Education 38834.43 25066.90 63901.33 0.46 0.30 0.76
Adult Education 512.02 603.66 1115.68 0.01 0.01 0.01
Technical Education 24707.10 23194.89 47901.99 0.30 0.28 0.57
Total (Education) 254785.74 93594.35 348380.09 3.05 1.12 4.17
15
E: Expenditure (Revenue) on Education by Education and Other
F : Expenditure (Revenue) on Education by Education and Other
EDUCATIONAL STATISTICS AT A GLANCE
Sector
Expenditure on Education (Rs. Crore)
Expenditure as % of GDP
SectorExpenditure on Education
(Rs. Crore) Expenditure as
%
of
GDP
Departments by Sector --Revised Estimate -2010 -11
Departments by Sector -- Budget Estimate -2011 -12
D: Expenditure (Revenue) on Education by Education and Other Departments by Sector -2009 -10
SectorExpenditure on Education (Rs.
Crore)Expenditure as % of GDP

8/10/2019 Drop Out EAG_2013
http://slidepdf.com/reader/full/drop-out-eag2013 26/47
PART-III
TIME SERIES DATA

8/10/2019 Drop Out EAG_2013
http://slidepdf.com/reader/full/drop-out-eag2013 27/47
(% age)Census year Persons Males Females
1951 18.3 27.2 8.91961 28.3 40.4 15.41971 34.5 46.0 22.01981 43.6 56.4 29.81991 52.2 64.1 39.32001 64.8 75.3 53.72011 73.0 80.9 64.61951‐1971:Aged 5+, 1981‐2011: Aged 7+Source: Census of India‐2011.
Level/Year Primary Upper
Primary
Secondary/ Senior
Secondary
Level
Total Colleges
University /University
level Instt.
1950‐51 2097 136 74 578 271960‐61 3304 497 173 1819 451970‐71 4084 906 371 3277 821980‐81 4945 1186 516 6963 1101990‐91 5609 1515 798 5748 1842000‐01 6387 2063 1260 10152 254
2005‐06 7726 2885 1597 16982 3502007‐08 7876 3255 1722 23099 4062008‐09(P) 7894 3366 1832 27882 4402009‐10(P) 8232 3677 1899 28266 5342010‐11(P) 7485 4476 2002 32974 621
16
P:ProvisionalFor the year 2008 -09& 2010 -11 data on Higher Education is Final.
EDUCATIONAL STATISTICS AT A GLANCE
Table -14 : Literacy Rates
Table -15 : Number of Recognised Educational Institutions(In Absolute) (in '00')

8/10/2019 Drop Out EAG_2013
http://slidepdf.com/reader/full/drop-out-eag2013 28/47
1 7
(in lakhs)
Boys Girls Total Boys Girls Total Boys Girls Total Boys Girls Total1950‐51 138 54 192 26 5 31 13 2 15 3.5 0.5 4.01960‐61 236 114 350 51 16 67 27 7 34 8 2 101970‐71 357 213 570 94 39 133 57 19 76 26 7 331980‐81 453 285 738 139 68 207 76 34 110 35 13 481990‐91 570 404 974 215 125 340 128 63 191 34 15 49
2000‐01 640 498 1138 253 175 428 169 107 276 54 32 862005‐06 705 616 1321 289 233 522 223 161 384 88 55 1432006‐07 710 627 1337 298 246 544 229 169 398 96 60 1562007‐08 711 644 1355 310 262 572 252 193 445 106 66 1722008‐09(P) 700 645 1345 294 260 554 256 199 455 112 73 1852009‐10(P) 708 648 1356 318 276 594 267 215 482 124 83 2072010‐11(P) 705 648 1353 328 292 620 283 229 512 155 120 275
For the year 2008 ‐09 & 2010 ‐11 data on Higher Education is Final.
.
Higher Education Year/Level
Primary (I -V)E
D U C A T I O N A L S T A T I S T I C S
A T A G L A N C E
Table -16: Level -wise Enrolment A: All Categories of Students
Upper Primary (VI -VIII)
Secondary/ Senior Secondary ( IX-XII)
P‐Provisional,
NA
‐Not
Available

8/10/2019 Drop Out EAG_2013
http://slidepdf.com/reader/full/drop-out-eag2013 29/47
(in lakhs)
Boys Girls Total Boys Girls Total Boys Girls Total Boys Girls Total1980‐81 72 38 110 16 6 22 9 3 12 NA NA NA1983‐84 80 45 125 23 10 33 14 4 18 NA NA NA1986‐87 79 46 125 23 11 34 11 4 15 NA NA NA1989‐90 95 59 154 26 13 39 17 6 23 NA NA NA1990‐91 97 60 157 27 14 41 17 6 23 NA NA NA
2000‐01 121 91 212 41 26 67 24 14 38 NA NA NA2005‐06 140 113 253 53 38 91 34 22 56 10 6 162006‐07 144 118 262 54 39 93 35 23 59 12 6 182007‐08 137 125 262 53 46 99 36 27 63 15 9 242008‐09(P) 138 127 265 56 49 105 37 29 66 14 8 222009‐10(P) 138 127 265 58 51 109 46 36 82 15 9 242010‐11(P) 141 129 270 59 53 112 48 39 87 17 13 30
1 8 For the year 2008 ‐09 & 2010 ‐11 data on Higher Education is Final.
P‐Provisional, NA‐Not Available
Higher Education E D U
C A T I O N A L S T A T I S T I C S
A T A G L A N C E
Table -16: Level -wise Enrolment
B: SC Students
Year/Level
Primary (I -V)
Upper Primary (VI -VIII)
Secondary/ Senior Secondary
(IX-XII)

8/10/2019 Drop Out EAG_2013
http://slidepdf.com/reader/full/drop-out-eag2013 30/47
1 9
(in lakhs)
Boys Girls Total Boys Girls Total Boys Girls Total Boys Girls Total1980‐81 31 15 47 5 2 7 2 1 3 NA NA NA1983‐84 37 20 57 8 3 11 3 1 4 NA NA NA1986‐87 42 24 66 10 4 14 4 2 6 NA NA NA1989‐90 49 29 78 11 5 16 6 2 8 NA NA NA1990‐91 49 29 78 11 6 17 7 2 9 NA NA NA
2000‐01 63 47 110 19 12 31 10 5 15 NA NA NA2005‐06 75 67 142 25 20 45 13 9 22 4 2 62006‐07 76 68 144 26 20 46 15 10 25 4 3 72007‐08 76 70 146 26 21 47 14 10 24 6 3 92008‐09(P) 79 73 152 27 23 50 16 11 27 6 3 92009‐10(P) 79 73 152 28 23 51 17 13 30 7 4 112010‐11(P) 77 72 149 28 26 54 18 14 32 7 5 12
For the year 2008 ‐09 & 2010 ‐11 data on Higher Education is Final.P‐Provisional, NA‐Not Available
Higher Education E D U C A T I O N A L S T A T I S T I C S A T A G L A N C E
Table -16: Level -wise Enrolment C: ST Students
Year/Level
Primary (I -V)
Upper Primary (VI -VIII)
Secondary/ Senior Secondary (IX-XII)

8/10/2019 Drop Out EAG_2013
http://slidepdf.com/reader/full/drop-out-eag2013 31/47
Male Female Total Male Female Total Male Female Total
1950‐51 456 82 538 73 13 86 107 20 127
1960‐61 615 127 742 262 83 345 234 62 296
1970‐71 835 225 1060 463 175 638 474 155 629
1980‐81 1021 342 1363 598 253 851 669 257 926
1990‐91 1143 473 1616 717 356 1073 917 417 1334
2000‐01 1221 675 1896 820 506 1326 1184 577 17612005‐06 1326 858 2184 998 673 1671 1333 821 2154
2006‐07 1403 920 2323 1039 678 1717 1388 860 2248
2007‐08 1288 1027 2315 1063 717 1780 1331 796 2127
2008‐09(P) 1315 1048 2363 1092 772 1864 1362 796 2158
2009‐10(P) 1335 1145 2480 1111 802 1913 1438 901 2339
2010‐11(P) 1194 906 2100 1048 839 1887 1537 963 2500
2 0 Till the year 2009 ‐10, the number of teachers in primary schools included
those in pre ‐primary schools also.
E D U C A T I O
N A L S T A T I S T I C S A T A G
L A N C E
P‐Provisional,
Table -17 : Number of Teachers by Type of School( in thousands)
Year/LevelPrimary Upper Primary Secondary/ Sr. Secondary

8/10/2019 Drop Out EAG_2013
http://slidepdf.com/reader/full/drop-out-eag2013 32/47
2 1
Boys Girls Total Boys Girls Total Boys Girls Total
1950‐51 60.6 24.8 42.6 20.6 4.6 12.7 46.4 17.7 32.1
1960‐61 82.6 41.4 62.4 33.2 11.3 22.5 65.2 30.9 48.7
1970‐71 95.5 60.5 78.6 46.5 20.8 33.4 75.5 44.4 61.9
1980‐81 95.8 64.1 80.5 54.3 28.6 41.9 82.2 52.1 67.5
1990‐91 94.8 71.9 83.8 80.1 51.9 66.7 90.3 65.9 78.6
2000‐01 104.9 85.9 95.7 66.7 49.9 58.6 90.3 72.4 81.6
2005‐06 112.8 105.8 109.4 75.2 66.4 71.0 98.5 91.0 94.9
2006‐07 114.6 108.0 111.4 77.6 69.6 73.8 100.4 93.5 97.1
2007‐08 115.3 112.6 114.0 81.5 74.4 78.1 102.4 98.0 100.3
2008‐09(P) 114.3 114.4 114.4 77.9 74.4 76.2 100.5 99.1 99.82009‐10(P) 115.5 115.4 115.5 84.5 78.3 81.5 103.8 101.1 102.5
2010‐11(P) 115.4 116.7 116.0 87.7 83.1 85.5 104.9 103.7 104.3P‐Provisional
Table -18 : Gross Enrolment Ratio(GER) A : All Categories of Students
E D U C A T I O N A L S T A T I S T I C S A T A G L A N C E
Upper primary (VI -VIII)
11 -13 Years
Elementary (I -VIII)
6 -13 YearsLevel/
Year
Primary ( I-V)
6 -10 Years

8/10/2019 Drop Out EAG_2013
http://slidepdf.com/reader/full/drop-out-eag2013 33/47
Boys Girls Total Boys Girls Total Boys Girls Total Boys Girls Total
2001‐02 NA NA NA NA NA NA 38.2 27.7 33.3 9.3 6.7 8.1
2002‐03 NA NA NA NA NA NA 41.3 33.2 37.5 10.3 7.5 9.0
2003‐04 NA NA NA NA NA NA 42.9 34.3 38.9 10.6 7.7 9.2
2004‐05 57.4 45.3 51.7 30.8 24.5 27.8 44.3 35.1 39.9 11.6 8.2 10.02005‐06 57.6 46.2 52.2 31.4 25.2 28.5 44.6 35.8 40.4 13.5 9.4 11.6
2006‐07 58.6 47.4 53.5 31.5 26.1 28.9 45.0 36.8 41.1 14.5 10.0 12.4
2007‐08 62.6 53.2 58.2 36.3 30.4 33.5 49.4 41.9 45.8 15.2 10.7 13.1
2008‐09(P) 64.2 55.0 59.8 37.0 31.2 34.3 50.6 43.1 47.0 15.8 11.4 13.7
2 2 2009‐10(P) 66.7 58.5 62.7 38.3 33.3 35.9 52.4 45.9 49.3 17.1 12.7 15.0
2010‐11(P) 69.0 60.8 65.0 42.2 36.1 39.3 55.5 48.4 52.1 20.8 17.9 19.4
For the year 2008 ‐09 & 2010 ‐11 data on Higher Education is Final.
E D U C A T I O N A L S T A T I S T I C S A T A G L A N C E
Secondary/ Senior Secondary
(IX-XII)
14 -17 years
Secondary (IX-X)
14 -15years
P‐Provisional, NA‐Not Available
Higher Education 18 -23 years
Senior Secondary (XI-XII)
16 -17years Level/
Year
Table -18 : Gross Enrolment Ratio(GER) A: All Categories of Students

8/10/2019 Drop Out EAG_2013
http://slidepdf.com/reader/full/drop-out-eag2013 34/47
2 3
Boys Girls Total Boys Girls Total Boys Girls Total
1986‐87 103.8 64.8 84.8 52.7 26.6 40.4 85.1 50.8 68.4
1990‐91 125.5 86.2 106.4 68.7 35.8 52.7 100.6 63.5 82.5
1995‐96 109.9 83.2 97.1 71.4 44.5 58.5 109.0 78.5 94.3
2000‐01 107.3 85.8 96.8 76.2 53.3 65.3 97.3 75.5 86.8
2005‐06 126.3 110.2 118.6 81.0 65.1 73.5 109.5 93.7 102.0
2006‐07 131.6 115.4 123.8 83.1 67.3 75.7 113.5 97.8 106.0
2007‐08 125.5 124.3 124.9 82.1 78.1 80.2 109.3 107.3 108.4
2008‐09(P) 130.2 130.1 130.1 86.8 83.6 85.3 114.1 112.9 113.5
2009‐10(P) 127.8 128.7 128.3 90.5 86.6 88.6 113.9 112.9 113.5
2010‐11(P) 131.3 132.7 132.0 93.8 90.6 92.3 117.3 116.9 117.1P -Provisional
Table -18: Gross Enrolment Ratio(GER)
B: SC Students
E D U C A T I O N A L S T A T I S T I C S A T A G L A N C E
Upper primary (VI -VIII)
11 -13 Years
Elementary (I -VIII)
6 -13 YearsLevel/ Year
Primary ( I-V)
6 -10 Years

8/10/2019 Drop Out EAG_2013
http://slidepdf.com/reader/full/drop-out-eag2013 35/47
Boys Girls Total Boys Girls Total Boys Girls Total Boys Girls Total2001‐02 NA NA NA NA NA NA 37.2 26.9 32.6 7.7 3.6 5.82002‐03 NA NA NA NA NA NA 36.9 25.7 31.8 8.0 3.7 6.02003‐04 NA NA NA NA NA NA 37.6 27.5 33.0 8.3 4.3 6.4
2004‐05 52.2 37.6 45.4 26.6 19.1 23.2 39.8 28.7 34.7 8.1 5.2 6.72005‐06 54.8 40.3 48.1 27.9 20.9 24.7 41.6 30.9 36.4 10.1 6.4 8.42006‐07 58.3 44.6 51.9 29.2 21.8 25.8 44.0 33.3 39.0 11.5 6.9 9.42007‐08 55.8 48.9 52.6 30.1 25.3 27.9 43.1 37.5 40.5 13.2 8.6 11.02008‐09(P) 57.4 51.8 54.8 30.9 26.6 28.9 44.4 39.5 42.1 12.5 8.3 10.52009‐10(P) 71.2 63.5 67.6 37.4 33.5 35.6 54.5 48.8 51.8 13.0 9.0 11.12010‐11(P) 74.0 67.5 70.9 40.3 36.1 38.3 57.3 52.2 54.9 14.6 12.3 13.5
P -Provisional, NA-Not Available2 4 For the year 2008 -09 & 2010 -11 data on Higher Education is Final.
Table -18 : Gross Enrolment Ratio(GER)
B : SC Students
E D U C A T I O N A L S T A T I S T I C S A T A G L A N C E
Level/ Year
Senior Secondary (XI -XII)
16 -17years
Secondary/Senior
Secondary (IX-XII)
14 -17 years
Higher Education 18 -23 years
Secondary (IX-X)
14 -15years

8/10/2019 Drop Out EAG_2013
http://slidepdf.com/reader/full/drop-out-eag2013 36/47
2 5
Boys Girls Total Boys Girls Total Boys Girls Total1986‐87 111.0 68.0 90.1 45.6 21.9 34.1 87.1 51.1 69.61990‐91 125.4 81.4 104.0 53.9 26.7 40.7 99.6 60.2 80.4
1995‐96 115.0 80.2 96.9 57.3 35.0 46.5 105.7 75.1 90.92000‐01 116.9 85.5 101.1 72.5 47.7 60.2 102.5 73.5 88.02005‐06 131.4 121.1 126.4 77.5 64.9 71.5 111.9 101.3 106.72006‐07 134.4 124.0 129.3 80.2 68.2 74.4 114.7 104.2 109.62007‐08 136.4 130.6 133.6 81.1 70.2 75.8 116.3 108.9 112.72008‐09(P) 142.7 138.8 140.8 86.0 77.5 81.9 122.0 116.6 119.42009‐10(P) 139.7 137.4 138.6 87.8 78.8 83.4 121.2 116.4 118.9
2010‐11(P) 137.2 136.7 137.0 90.7 87.0 88.9 120.5 118.7 119.7P‐Provisional
E D U C A T I O N A L S T A T I S T I C S A T A G L A N C E
Level/ Year
Primary (I -V)
6 -10 Years
Upper primary (VI -VIII)
11 -13 Years
Table -18 : Gross Enrolment Ratio(GER) C : ST Students
Elementary (I -VIII)
6 -13 Years

8/10/2019 Drop Out EAG_2013
http://slidepdf.com/reader/full/drop-out-eag2013 37/47
2 6
Boys Girls Total Boys Girls Total Boys Girls Total Boys Girls Total2001‐02 NA NA NA NA NA NA 31.0 19.8 25.7 5.8 2.6 4.22002‐03 NA NA NA NA NA NA 30.5 20.5 25.7 5.6 2.4 4.02003‐04 NA NA NA NA NA NA 32.4 21.0 27.0 6.2 3.1 4.7
2004‐05 43.3 30.5 37.2 21.5 12.6 17.2 33.0 22.0 27.7 6.3 3.5 4.92005‐06 44.7 33.0 39.1 21.7 13.1 17.5 33.7 23.4 28.7 8.6 4.7 6.62006‐07 47.5 35.6 41.8 23.4 14.7 19.2 35.9 25.3 30.8 9.5 5.5 7.52007‐08 48.8 37.2 43.3 24.3 16.2 20.3 36.9 26.9 32.1 12.4 6.7 9.52008‐09(P) 51.8 40.9 46.6 26.3 18.6 22.5 39.5 29.9 34.9 11.6 6.7 9.22009‐10(P) 54.2 44.2 49.4 31.4 22.3 26.9 43.5 33.7 38.7 13.1 7.5 10.32010‐11(P) 57.1 49.1 53.3 32.7 24.8 28.8 45.4 37.3 41.5 12.9 9.5 11.2 P -Provisional, NA-Not Available For the year 2008 -09 & 2010 -11 data on Higher Education is Final.
Higher Education 18 -23 years
Secondary
(IX-X) 14 -15 years
Table -18 : Gross Enrolment Ratio(GER) C : ST Students
E D U C A T I O N A L S T A T I S T I C S A T A G L A N C E
Level/ Year
Senior Secondary
(XI-XII) 16 -17 years
Secondary/ Senior Secondary
(IX-XII) 14 -17 years

8/10/2019 Drop Out EAG_2013
http://slidepdf.com/reader/full/drop-out-eag2013 38/47
Year/Level Primary
(I -V)
Upper Primary (VI -VIII)
Secondary ( IX-X)
Higher Education
1950‐51 39 18 16 13
1960‐61 48 32 23 21
1970‐71 60 41 35 28
1980‐81 63 49 44 36
1990‐91 71 58 50 46
2000‐01 78 69 63 58
2005‐06 87 81 73 62
2006‐07 88 82 73 622007‐08 91 84 77 63
2008‐09(P) 92 89 78 65
2009‐10(P) 92 87 81 67
2010‐11(P) 92 89 82 78P-Provisional
27EDUCATIONAL STATISTICS AT A GLANCE
Table -19 : Number of Girls Enrolment per hundred Boys Enrolled by Stages of Education
For
the
year
2008
-09
&
2010
-11
data
on
Higher
Education
is
Final.

8/10/2019 Drop Out EAG_2013
http://slidepdf.com/reader/full/drop-out-eag2013 39/47
2 8
Years/ Level
Primary (I -V)
Upper
Primary (VI -VIII)
Elementary (I -VIII)
Secondary (IX-X)
Senior
Secondary (XI-XII)
(IX-XII) Higher
Education
1950‐51 0.41 0.22 0.38 NA NA NA NA1960‐61 0.50 0.34 0.47 NA NA NA NA1970‐71 0.63 0.45 0.59 NA NA NA NA1980‐81 0.67 0.53 0.63 NA NA NA NA1990‐91 0.75 0.61 0.71 NA NA NA NA
2000‐01 0.82 0.75 0.80 NA NA NA NA2005‐06 0.94 0.88 0.92 0.80 0.80 0.80 0.692006‐07 0.94 0.90 0.93 0.81 0.83 0.82 0.692007‐08 0.98 0.91 0.96 0.85 0.84 0.85 0.702008‐09(P) 1.00 0.96 0.99 0.85 0.84 0.85 0.722009‐10(P) 1.00 0.93 0.97 0.88 0.87 0.88 0.742010‐11(P) 1.01 0.95 0.99 0.88 0.86 0.87 0.86 P
-Provisional,
NA
-Not
Available
E D U C A T I O N A L S T A T I S T I C S A T A G L A N C E
Table -20 : Gender Parity Index (GPI) A : All Categories of Students
For the year 2008 -09 & 2010 -11 data on Higher Education is Final.

8/10/2019 Drop Out EAG_2013
http://slidepdf.com/reader/full/drop-out-eag2013 40/47
Years/ Level Primary (I -V)
Upper Primary (VI -VIII)
Elementary (I -VIII)
Secondary (IX-X)
Senior Secondary
(XI-XII)(IX-XII) Higher
Education
1986‐87 0.62 0.50 0.60 NA NA NA NA1990‐91 0.69 0.52 0.63 NA NA NA NA1995‐96 0.76 0.62 0.72 NA NA NA NA2000‐01 0.80 0.70 0.78 NA NA NA NA
2005‐06 0.87 0.80 0.86 0.74 0.75 0.74 0.63
2006‐07 0.88 0.81 0.86 0.76 0.75 0.76 0.602007‐08 0.99 0.95 0.98 0.88 0.84 0.87 0.652008‐09(P) 1.00 0.96 0.99 0.90 0.86 0.89 0.66
2009‐10(P) 1.01 0.96 0.99 0.89 0.89 0.90 0.692010‐11(P) 1.01 0.97 1.00 0.91 0.90 0.91 0.84
P -Provisional, NA-Not Available2
9
Table -20 : Gender Parity Index (GPI)
B : SC StudentsE D U
C A T I O N A L S T A T I S T I C S
A T A G L A N C E
For
the
year
2008
-09
&
2010
-11
data
on
Higher
Education
is
Final.

8/10/2019 Drop Out EAG_2013
http://slidepdf.com/reader/full/drop-out-eag2013 41/47
3 0
Years/ Level
Primary (I -V)
Upper Primary (VI -VIII)
Elementary (I -VIII)
Secondary (IX-X)
Senior Secondary
(XI-XII)(IX-XII)
Higher Education
1986‐87 0.61 0.48 0.59 NA NA NA NA1990‐91 0.65 0.50 0.60 NA NA NA NA1995‐96 0.70 0.61 0.71 NA NA NA NA2000‐01 0.73 0.66 0.72 NA NA NA NA2005‐06 0.91 0.84 0.90 0.74 0.61 0.69 0.552006‐07 0.92 0.85 0.91 0.75 0.63 0.71 0.582007‐08 0.96 0.87 0.94 0.76 0.67 0.73 0.542008‐09(P) 0.97 0.90 0.96 0.80 0.71 0.76 0.582009‐10(P) 0.98 0.90 0.96 0.82 0.71 0.78 0.572010‐11(P) 1.00 0.96 0.99 0.86 0.76 0.82 0.74
E D U C A T I O N A L S T A T I S T I C S A T A G L A N C
Table -20 : Gender Parity Index (GPI) C : ST Students

8/10/2019 Drop Out EAG_2013
http://slidepdf.com/reader/full/drop-out-eag2013 42/47
Boys Girls Total Boys Girls Total Boys Girls Total
1960‐61 61.7 70.9 64.9 75.0 85.0 78.3 NA NA NA1970‐71 64.5 70.9 67.0 74.6 83.4 77.9 NA NA NA1980‐81 56.2 62.5 58.7 68.0 79.4 72.7 79.8 86.6 82.5
1990‐91 40.1 46.0 42.6 59.1 65.1 60.9 67.5 76.6 71.32000‐01 39.7 41.9 40.7 50.3 57.7 53.7 66.4 71.5 68.62005‐06 28.7 21.8 25.7 48.7 49.0 48.8 60.1 63.6 61.62006‐07 24.6 26.8 25.6 46.4 45.2 45.9 58.6 61.5 59.92007‐08 25.7 24.4 25.1 43.7 41.3 42.7 56.6 57.3 56.72008‐09(P) 26.7 22.9 24.9 44.9 38.9 42.3 55.8 56.0 55.92009‐10(P) 30.3 27.3 28.9 40.6 44.4 42.4 53.4 52.0 52.82010‐11(P) 28.7 25.1 27.0 40.3 41.0 40.6 50.4 47.9 49.3
3 1 P‐Provisional, NA‐Not Available
E
D U C A T I O N A L S T A T I S T I C S A T A G L A N C E
Classes (I -V)
Classes (I -VIII)
Table -21 : Drop -Out Rates in School Education
Classes (I -X)Year/
Classes
A : All Categories of Students

8/10/2019 Drop Out EAG_2013
http://slidepdf.com/reader/full/drop-out-eag2013 43/47
3 2
Boys Girls Total Boys Girls Total Boys Girls Total1990‐91 46.3 54.0 49.4 64.3 73.2 67.8 74.3 83.4 85.02001‐02 43.7 47.1 45.2 58.6 63.6 60.7 71.1 74.9 72.72002‐03 41.1 41.9 41.5 58.2 62.2 59.9 69.7 74.9 71.92003‐04 36.8 36.2 36.6 57.3 62.2 59.4 71.4 75.5 73.12004‐05 32.7 36.1 34.2 55.2 60.0 57.3 69.1 74.2 71.32005‐06 32.1 33.8 32.9 53.7 57.1 55.2 68.2 73.7 70.62006‐07 32.3 39.9 35.9 51.6 55.0 53.1 66.6 72.2 69.02007‐08 34.4 24.5 30.1 53.6 51.1 52.5 68.1 68.9 68.42008‐09(P) 30.1 22.7 26.7 50.9 44.0 47.9 66.5 66.6 66.62009‐10(P) 32.7 25.3 29.3 50.6 52.0 51.3 58.5 59.7 59.02010‐11(P) 29.8 23.1 26.7 46.7 39.0 43.3 57.4 54.1 56.0P‐Provisional
E D U C A T I O
N A L S T A T I S T I C S A T A G L A N C E
Table -21 : Drop -Out Rates in School Education
B : SC Students
Classes (IV)
Classes (IVIII)
Classes (IX)Year/
Classes

8/10/2019 Drop Out EAG_2013
http://slidepdf.com/reader/full/drop-out-eag2013 44/47
Boys Girls Total Boys Girls Total Boys Girls Total
1990‐91 60.3 66.1 62.5 75.7 82.2 78.6 83.3 87.7 85.02001‐02 51.0 54.1 52.3 67.3 72.7 68.7 79.9 82.9 81.22002‐03 50.8 52.1 51.4 66.9 71.2 68.7 78.4 83.0 80.32003‐04 49.1 48.7 48.9 69.0 71.4 70.1 77.9 81.2 79.32004‐05 42.6 42.0 42.3 65.0 67.1 65.9 77.8 80.7 79.02005‐06 40.2 39.3 39.8 62.9 62.9 62.9 78.0 79.2 78.52006‐07 30.6 35.8 33.1 62.8 62.2 62.5 77.3 79.1 78.12007‐08 31.0 31.7 31.3 62.6 62.3 62.5 76.0 78.0 76.92008‐09(P) 32.2 30.2 31.3 57.7 59.0 58.3 75.6 76.9 76.22009‐10(P) 35.2 33.7 34.5 55.2 60.6 57.8 74.7 75.9 75.22010‐11(P) 37.2 33.9 35.6 54.7 55.4 55.0 70.6 71.3 70.9
3 3 P‐Provisional
C : ST Students
Table -21 : Drop -Out Rates in School Education
E D U C A T I O N A L S T A T I S T
I C S A T A G L A N C E
Classes (I -X)Year/
Classes
Classes (IV)
Classes ( I-VIII)

8/10/2019 Drop Out EAG_2013
http://slidepdf.com/reader/full/drop-out-eag2013 45/47
Type of School/ Years
Primary School
Upper Primary School
Secondary/ Senior Secondary School
Higher Education
1950‐51 24 20 21 NA1960‐61 36 31 25 NA1970‐71 39 32 25 NA1980‐81 38 33 27 NA1990‐91 43 37 31 NA2000‐01 43 38 32 NA2005‐06 46 34 33 26
2006‐07 44 34 33 NA2007‐08 47 35 35 202008‐09(P) 44 34 35 212009‐10(P) 42 34 34 242010‐11(P) 43 33 32 26*
* Dose not include Stand Alone Institutions P-Provisional, NA-Not Available
34
For the year 2008 -09 & 2010 -11 data on Higher Education is Final.
EDUCATIONAL STATISTICS AT A GLANCE
Table -22 : Pupil Teacher Ratio (PTR)

8/10/2019 Drop Out EAG_2013
http://slidepdf.com/reader/full/drop-out-eag2013 46/47
Type of School/
Years
Primary School
Upper Primary
School
Secondary/ Senior
Secondary School
Higher Education
1950‐51 20 18 19 NA1960‐61 21 32 27 NA1970‐71 27 38 33 NA1980‐81 33 42 38 NA1990‐91 41 50 46 NA2000‐01 55 62 49 NA
2005‐06 65 67 62 NA2006‐07 66 65 62 NA2007‐08 80 67 60 NA2008‐09(P) 80 71 58 NA2009‐10(P) 86 72 63 NA2010‐11(P) 76 80 63 59 P‐Provisional
35
per Hundred Male TeachersTable -23 : Number of Female Teachers
EDUCATIONAL STATISTICS AT A GLANCE
For the year 2010 -11 data on Higher Education is Final

8/10/2019 Drop Out EAG_2013
http://slidepdf.com/reader/full/drop-out-eag2013 47/47
Year GDP at Current price
(at Factor cost) (Rs. crore)
Total Expenditure on Education by
Education & other Deptts.
(Rs. crore)
Expenditure on Education by
Education & other Deptts. as % of GDP
1951 ‐52 10080 64.46 0.641960 ‐61 16220 239.56 1.481970 ‐71 42222 892.36 2.111980 ‐81 130178 3884.2 2.981990 ‐91 510964 19615.85 3.842000 ‐01 1925017 82486.48 4.282005 ‐06 3390503 113228.71 3.342006 ‐07 3953276 137383.99 3.482007 ‐08 4582086 155797.27 3.402008 ‐09 5303567 189068.84 3.562009 ‐10 6108903(P) 241256.01 3.952010 ‐11(RE) 7266967(P) 305431.50 4.202011 ‐12(BE) 8353495(P) 348380.09 4.17
RE: Revised Estimate BE: Budget Estimate
36
Table -24: Public Expenditure on Education and
Gross Domestic Product (GDP)
EDUCATIONAL STATISTICS AT A GLANCE