drop impact onto a cantilever beam: behavior of the
TRANSCRIPT

InterfacialPhenomena and Heat Transfer, 7(1):85–96 (2019)
DROP IMPACT ONTO A CANTILEVER BEAM:BEHAVIOR OF THE LAMELLA AND FORCEMEASUREMENT
Huanchen Chen,1 Xurui Zhang,2 Beatriz Defez Garcia,3Anastasios Georgoulas,4 Marin Deflorin,1 Qingxia Liu,2Marco Marengo,4 Zhenghe Xu,2,5 & Alidad Amirfazli1,∗
1Department of Mechanical Engineering, York University, Toronto, ON M3J 1P3, Canada2Department of Chemical and Materials Engineering, University of Alberta, Edmonton, ABT6G 1H9, Canada
3Centro de Investigación en Tecnologías Gráficas, Universitat Politècnica de València, Valencia,46022, Spain
4Advanced Engineering Centre, School of Computing, Engineering and Mathematics,University of Brighton, Brighton BN2 4GJ, United Kingdom
5Department of Materials Science and Engineering, Southern University of Science andTechnology, Shenzhen 518055, China
*Address all correspondence to: Alidad Amirfazli, Department of Mechanical Engineering, YorkUniversity, Toronto, ON M3J 1P3, Canada; Tel.: (+1) 416-736-5901, E-mail: [email protected]
Original Manuscript Submitted: 5/12/2019; Final Draft Received: 7/23/2019
In this work, the process of drop impact onto an elastic surface (a cantilever beam) was studied. Different from previousstudies which typically focused on the behavior of the elastic surface (e.g., deformation and oscillation), the focus of thiswork is to examine the behavior of the resulting lamella during the impact. It was found that the maximum contactdiameter of the lamella in an elastic impact compared to impact onto a ridged surface is significantly smaller (e.g., 17%for impact at 2 m/s). The results were explained through an analysis of impact energy and the stored elastic energy inthe beam. In this work, we also demonstrated how to use a cantilever beam to measure maximum drop impact force.It was found that a large natural frequency of the cantilever beam is needed for the maximum force measurement toproduce acceptable values.
KEY WORDS: drop impact, lamella, impact force, cantilever, spreading
1. INTRODUCTION
The process of drop impact onto a solid surface is widely seen in both nature and industrial applications (Yarin, 2006;Josserand and Thoroddsen, 2016; Chen et al., 2017; Yarin and Weiss, 1995; Li et al., 2014a). When a drop impactsa surface, the kinetic energy of the drop converts into surface energy, due to an increase in the interfacial area byflattening of the droplet and the creation of a lamella (Yarin and Weiss, 1995; Li et al., 2014a). Depending on theelasticity of the target surface, the impact can be divided into two categories, drop impact onto rigid surfaces, anddrop impact onto soft/elastic surfaces. An impact force is generated upon a drop touching the surface. For impact ontoa rigid surface, the surface is not deformed (Chen et al., 2017; Yarin and Weiss, 1995); most drop impact processesin technical applications and seen in nature fall into this category, e.g., spray painting or rain drops falling on a roof.When a drop impacts a soft/elastic surface, the surface can deform, e.g., when rain drops impact leaves. In this casethe deformation of the surface will affect the process (Li et al., 2014a,b; Mangili et al., 2012).
2169–2785/19/$35.00 © 2019 by Begell House, Inc. www.begellhouse.com 85

86 Chenet al.
Compared with drop impact onto a rigid surface (rigid impact), fewer works have focused on understanding theprocess of drop impact onto a soft/elastic surface (elastic impact) (Zhang et al., 2017; Gart et al., 2015; Ahmad etal., 2014; Wong et al., 2017; Dressaire et al., 2016; Weisensee et al., 2016). Li et al. (2014a) studied the vibrationsof different types of elastic surfaces as a result of drop impact. Gart et al. (2015) studied the behavior of an elasticbeam (cantilever beam) upon the impact of a drop. The effects of the surface wettability on the beam behavior wereinvestigated. The results in Gart et al. (2015) show that beams with a small contact angle experience a much highertorque and bending energy than the ones with larger contact angle. The deformation of the surface/beam can alsopossibly affect the lamella during the impact process. However, the above studies and others (Weisensee et al., 2017;Kim et al., 2018), focused mainly on understanding the elastic surface/beam behavior during the impact, e.g., how thesurface deforms, or the beam vibrates, during the impact process. The focus of this study is different than the abovestudies in that we investigate the differences in lamella behavior between the rigid and elastic impacts.
For elastic impact, we used a cantilever beam system. The impact force of a droplet deforms a cantilever beam;the relationship between the displacement (Y), caused by a point force acting on a beam, and the magnitude of theforce (F ) is
F =3EI
L3Y, (1)
whereL is the distance between the point force and the fixed end of the beam;E and I are Young’s modulusand the moment of inertia of the beam, respectively. Equation (1) indicates a linear relation betweenF and thedisplacement (Y ). Therefore, by knowing the value of the displacement, one can calculate the value ofF acting on thebeam.
Such understanding also provides a possible method to measure the impact force during the impact process (Liet al., 2014b). The value of the impact force, particularly its maximum value, is an important parameter, for example,for erosion of materials where the drop impacts at large velocities (Li et al., 2014b), seen in compressor blades. Inthe literature, the impact force is typically obtained by numerical simulation, e.g., integration of the pressure createdby the drop during the impact. There are a limited number of studies that experimentally determined the impact forceof a droplet; they used a 1D piezoelectric force transducer (Li et al., 2014b; Zhang et al., 2017; Soto et al., 2014;Gordillo et al., 2018).
In this study, we explore another method to measure the maximum impact force, i.e., using a cantilever beam.This is also different from Kim et al. (2018) where deflection of a double clamped beam was measured using anoptical deflection technique, together with a second-order differential equation for beam deflection to estimate theexternal force applied by the droplet to the surface. Here, together with experimentation with cantilever beams, wealso developed a coupled numerical framework, where a computational fluid dynamics (CFD) simulation (based ona volume of fluid method, VOF) was coupled with a solid mechanics one (a finite element analysis, FEA). The FEAmodel was used to simulate the displacement of the cantilever beam so that the displacement function can be obtained.This displacement function can be converted into a force function (measured impact force,Fm) using Eq. (1), whichis denoted as the transfer function in Fig. 1. The VOF model provided the input force (Fin) signal for the FEA model.This framework (see Fig. 1) was used to study the effectiveness of using a cantilever beam (with differentω0) tomeasure the force of impact. The performance of the virtual beam can be evaluated by comparing the VOF forcefunction with the FEA force function. For example, a good match betweenFm andFin suggests that the selectedbeam can provide an accurate force measurement. Since the maximum impact force occurs in a short time, suchforce is typically considered as a dynamic force. For a dynamic force measurement, the natural frequency (ω0) of theforce sensor can strongly affect the accuracy of the dynamic force measurement (Li et al., 2014b). Therefore, anotherfocus of this work is to show howω0 of the beam affects the accuracy of the maximum drop impact force measure-ment.
The first goal of this work is to study the difference in the lamella behavior between the rigid and elastic impactsunder the same impact conditions. Experimentally, the drop impact on both a cantilever beam and a rigid surfacewas compared. The second goal is to demonstrate how a cantilever beam can be used to measure the maximumimpact force of a droplet and specifically show the effect of the natural frequency of the beam on the force measure-ment.
Interfacial Phenomena and Heat Transfer

Drop Impact onto a Cantilever Beam 87
FIG. 1: Flow chart for the numerical framework used in virtual experiments simulating a cantilever beam as a force sensor tomeasure droplet impact force
2. METHODS
2.1 Experimental Setup
To find the transfer function for a cantilever beam for use in Eq. (1) several methods exist to obtain the displace-ment/deformation of the surface. One of the most direct methods is to measure the displacement/deformation using ahigh-speed camera to track the motion of the beam during the impact process. This approach works when the beamhas a small stiffness (i.e., large deformation) (Gart et al., 2015). For a stiff beam, deformation is typically small. Dueto the limitation of the camera resolution, measurement of displacement is usually not sufficiently accurate (this pointwas confirmed in our in-house tests).
Therefore, in this work, a bimorph system was used to capture the beam deformation as well as the force appliedat the beam. In a bimorph system, the deformation of the beam induces a charge (Q). The relation betweenQ andFis shown below:
Q =32FL2
t2d13 =
92EI
Lt2Y d13 (2)
whereL is the length of the bimorph,t is the thickness of the bimorph, andd13 is the piezo materials charge constant.Therefore, by measuring the charge, the displacement of the beam as well as the force value can be obtained.
The experimental setup for this study is shown in Fig. 2. A hydrophobic surface was attached to the cantileverbimorph [20 mm× 3 mm× 0.35 mm (C-82) from Fuji Ceramics Co.] using a stainless-steel clamp. The hydrophobicsurface was fabricated by hydrophobizing a borosilicate glass surface with dimethyldichlorosilane. The advancingand receding contact angles of the surface were 101.9◦ ± 0.5◦ and 95.4◦ ± 1.1◦, respectively. A syringe positionedabove the surface was used to generate distilled water drops with a diameter of 2.3 mm. The water droplet wasreleased from two different heights to obtain two impact velocities (1.5 and 2.0 m/s). The impact point was ensured tobe the center of the surface for all the tests, as shown in Fig. 2. The bottom view of the camera was used to insure theimpact occurs at the center of the surface. Every drop impact case was repeated three times to ensure repeatability.The side view camera was used to record the behavior of the liquid lamella at 5000 fps.
A bimorph charge amplifier connected to a PC was used to measure the charge generated by the deformationof the bimorph. Knowing the charge generated by the bimorph after applying a known force, the bimorph can be
Volume 7, Issue 1, 2019

88 Chenet al.
FIG. 2: (a) Schematic view of the experimental setup (the deformation is exaggerated for graphical clarity). (b) Image of thebimorph setup.
calibrated (so to determine the transfer function). The calibration procedure used in this work was the same as de-scribed in Wang et al. (2013).
To understand the effect of the cantilever beam deformation on the spreading of the lamella, experiments of dropimpact onto rigid surfaces were also performed. For these rigid impact experiments, instead of placing the surface onthe bimorph cantilever beam, the surface was placed on the top of a 10-mm-thick transparent glass plate.
2.2 Numerical Simulation
A numerical framework was developed to evaluate the performance of a virtual beam in the impact force measure-ment. As discussed in the Introduction, this numerical framework consists of two parts: a VOF model and a FEAmodel.
2.2.1 Volume of Fluid Simulation
An enhanced volume of fluid (VOF) method was implemented in OpenFOAM CFD Toolbox (an open-source CFDplatform) to calculate the generated impact force. With the VOF model, the behavior of the spreading drops as well asthe flow within the lamella was obtained. The impact force (Fim) was calculated as the force exerted by the dropletto the bottom boundary of the computational domain through post-processing of the imposed pressure by the droplet.This impact force (Fim) was not only used as the input force signal, but also as the reference for evaluating the virtualforce in test results.
With the VOF approach, the transport equation for the volume fraction,α, of the secondary (dispersed) phase issolved simultaneously with a single set of continuity and Navier–Stokes equations for the entire flow field. The corre-sponding volume fraction of the primary phase was simply calculated as(1− α). The main underlying assumptionsare that the two fluids are Newtonian, incompressible, and immiscible.
The proposed VOF-based numerical simulation framework has been developed within the general context ofOpenFOAM CFD Toolbox. The governing equations for continuity, momentum, and volume fraction transport canbe written as
∇ · U⃗ = 0, (3)
∂ρbU⃗
∂t+∇ ·
(ρbU⃗ U⃗
)= −∇p+∇ · µb
(∇U⃗ +∇UT
)+ ρbf + Fs (4)
Interfacial Phenomena and Heat Transfer
Drop Impact onto a Cantilever Beam 89
∂a
∂t+∇ ·
(αU⃗
)−∇ · (α (1− α)Ur) = 0, (5)
where the bulk fluid properties are calculated as weighted averages of the individual phase properties as follows:
ρb = ρα+ ρ̂(1− α), (6)
µb = µα+ µ̂+ µ̂ (1− α) (7)
In the VOF method,α is advected by the velocity field. For the case of incompressible flow, this is equivalentto volume fraction conservation, which makes the method mass conservative. Interface sharpening is very importantin simulating two-phase flows of two immiscible fluids. In OpenFOAM the sharpening of the interface is achievedartificially by introducing an extra compression term in the advection equation ofα [last term in the left-hand side ofEq. (5)].Ur is the artificial compression velocity which is calculated from the following relationship:
Ur = nf min
[Cγ
|φ||sf |
, max
(|φ|sf
)]. (8)
Finally, the surface tension force is modeled as a volumetric force using the continuum surface force (CSF)method by Brackbill et al. (1992), applying the following equations:
Fs = γκ (∇α) (9)
κ = ∇ ·(
∇α̃
|∇α̃|
)(10)
whereγ is the surface tension coefficient andκ is the curvature of the interface. As mentioned previously, the utilizednumerical simulation framework constitutes an enhanced version of the original VOF-based solver of OpenFOAM,that suppresses numerical artifacts of the original model, known as “spurious currents.” The proposed enhancementinvolves the calculation of the interface curvatureκ using the smoothed volume fraction valuesα̃, which are obtainedfrom the initially calculatedα field, smoothing it over a finite region near the interface. All other equations use theinitially calculated (nonsmoothed) volume fraction values ofα. Further details on the proposed numerical modelingframework can be found in Georgoulas et al. (2015) and Vontas et al. (2017). For the present numerical simulations, anadditional dynamic contact angle (DCA) treatment (i.e., Kistler’s model) was adopted [see Kistler (1993) for details].
2.2.2 Finite Element Simulation
The FEA simulation was performed using commercial software, ANSYS. The FEA model was built with three parts:surface, clamp, and the bimorph cantilever beam. The dimensions and material properties of each component inANSYS were set according to the experimental setup (as shown in Fig. 3). The surface was fully constrained byfixing it onto the cantilever bimorph. Tetrahedron meshes were used for the FEA simulation. The FEA model had atotal 7560 meshes and 18,598 nodes (mesh independence verification was done). The damping ratio of the systemin the FEM was calculated using the experimental results of the output force, i.e., fitting the experimental outputforce as a damped sine function. The damping ratio was measured to beζ = 0.0192. The FEA analysis in this workwas focused on the three main modes of oscillation, based on the general theory of damped vibration for cantileverbeams. The transfer function of the beam was the relation between a known force applied at the contact point and thedisplacement of the beam obtained from the simulation. In the FEA simulation, the force generated from the VOFsimulation was used as a point input force.
3. RESULTS AND DISCUSSION
3.1 Behavior of the Spreading Lamella
The evolution of the contact diameter of lamella (d) is shown in Fig. 4;d was normalized asη = d/d0, whered0 is thedrop diameter before the impact. In Fig. 4, typical results for rigid and elastic drop impact cases are shown (with the
Volume 7, Issue 1, 2019

90 Chenet al.
FIG. 3: (a) Dimensions (in cm) of the experimental setup modeled in the FEA simulation. (b) 3D view of the model used in FEAsimulation.
FIG. 4: Typical evolution of normalized lamella contact diameter (η) during impact of a drop at 2 m/s for elastic and rigid impacts.The surface is spin coated by Teflon AF for the rigid impact and modified with dimethyldichlorosilane for the elastic impact (bothsurfaces have the same wettability).
same wettability). In general, the two impact behaviors are very similar in some aspects. The liquid lamella expandsrapidly when the drop just hits the surface. A maximumη (ηmax) was reached approximately 3.2 ms after the impactfor both cases. The lamella started to recede (ηdecreases) afterηmax was reached. In the receding phase, two stagesof receding can be observed for both impact cases: a fast receding (from 3.2 ms to approximately 13 ms), and a slowreceding (after 13 ms). A significant difference in the slopes for the two curves can be observed in these two stages,suggesting the receding speeds of the lamella at the two stages are different. Since the receding contact angle of thesurface is larger than 90◦, a total rebound of the drop can be observed at the end of the impact; i.e., the value ofη
decreased to zero.Although the two cases show similar behaviors, there are differences as well. Firstly, the values ofηmax for the
two cases are different. By analyzing the two impact cases (at 2 m/s), the values ofηmax were found to be 3.82±0.13 for the rigid impact and 3.23± 0.22 for the elastic surface (18% smaller); henceηmax of the rigid impact issignificantly larger than that of the elastic surface. Another difference is the receding speed of the contact line duringthe receding process (after 3.2 ms of impact). As compared with elastic impact,η decreases to zero first, although therigid impact case has a largerηmax. This observation suggests that the contact line in the rigid impact case receded
Interfacial Phenomena and Heat Transfer

Drop Impact onto a Cantilever Beam 91
faster than that of the elastic impact (this was observed for all tests). Due to different behaviors in the receding phase,one can observe two different rebound behaviors. For the rigid impact, the drop broke into two drops and reboundedto a high position, while the drop only detached slightly from the surface in the elastic impact (see the snapshot of thedrops in Fig. 4). Such differences were not only observed in the cases of 2 m/s impact velocity, but also for 1.5 m/simpact velocity. For example, the value ofηmax was found to be 3.24± 0.13 and 2.62± 0.17 (24% smaller than thatof rigid impact) for rigid and elastic impact, respectively.
The difference inηmax for the rigid and elastic impacts can be understood by analyzing the transfer of energyduring the impact process. For drop impact, it is typically believed that there is no flow within the liquid at the momentthat the lamella reachesηmax; hence, the kinetic energy of the system (Ek) is zero. Therefore, the kinetic energy ofthe drop is converted into the surface free energy (Es) atηmax for the rigid impact. The value ofEs is equal toβEk,whereβ is the transfer ratio (βis assumed to be the same for both elastic and rigid impacts). However, as the surfacedeforms during the impact (cantilever bending), part of the kinetic energy will be stored as elastic energy (Ee) in thebeam for the elastic impact. Therefore, the surface free energy for the elastic impact,Es = βEk−Ee, will be smallerthan that for the rigid impact (it is assumed that any viscous dissipation is the same for both cases). As surface freeenergy (Es) is directly related to the maximum contact diameter (Chen et al., 2017), the smallerEs of the elasticimpact results in a smaller value ofηmax.
Another way to understand the difference forηmax between rigid and elastic impacts is to examine the relativespeed between the drop and the surface during the impact. A key parameter which determines the maximum spreadingdiameter is not the absolute velocity of the drop, but the relative velocity between the drop and the surface (Lee andKim, 2004). For rigid impacts, the surface is fixed. Therefore, the relative velocity between the drop and the surfaceis the absolute velocity of the drop (2 m/s for the case shown in Fig. 4). For elastic impact, the surface has a velocitydue to the bending of the bimorph. For example, Fig. 5(a) shows the displacement of the beam at the contact point forthe 2 m/s elastic drop impact; the surface moves downwards until approximately 6 ms [see the inset in Fig. 5(a)]. Thisobservation suggests that the surface has a downwards velocity when the liquid lamella is reachingηmax. Therefore,for the elastic surface, the relative velocity between the surface and the drop is actually smaller than 2 m/s. This leadsto a smaller value ofηmax for the elastic impact.
The difference ofEs atηmax can also be the reason for the different receding speeds of the contact line betweenthe rigid and elastic impacts. A system always tends to reach a state of minimum surface free energy (named asEmin
s ).When the system is not in the minimum surface energy state (e.g., lamella atηmax), the liquid will spontaneouslyevolve its shape (e.g., recedes) to allow reaching the minimum surface energy state. In the drop impact phenomenon,the drop contact diameter at the minimum surface energy status is typically smaller thanηmax. Therefore, the lamellarecedes. The value ofEmin
s for a given system is decided by contact angle, surface tension, liquid volume, and solidsurface free energy (Brakke, 1996). Therefore, for elastic and rigid impact cases (with the same drop and surfacewetting properties) shown in Fig. 4, the system should have the same value ofEmin
s . As the rigid impact has a largerEs at the moment ofηmax compared to that of the elastic impact, the lamella in the rigid impact will have a strongertendency to evolve its shape to reach the minimum surface energy state. Such stronger tendency results in a quickerlamella receding for the rigid impact.
Figure 5(a) also shows the behavior of the beam after the maximum diameter is reached, until 0.5 s after theimpact; it shows the beam oscillates. Using Fourier analysis, it was found that the beam oscillated with the firstnatural frequency of 44.3 Hz. The small oscillations [see the inset in Fig. 5(a)] are caused by the second naturalfrequency of the system. Due to the damping, the magnitude of the oscillations decreases with time. For the case ofdrop impact at 1.5 m/s, similar behavior was observed [see Fig. 5(b)]. The only difference is the magnitude of theamplitude for the oscillations. The difference in the amplitude is understood easily as the impact at 2 m/s has a largerkinetic energy as compared to that of 1.5 m/s. Therefore, the impact force generated by the drop is larger leading to alarger bending of the beam.
3.2 Force Measurement
So far, the evolution of a drop during the impact was discussed. In this section, we will focus on discussion of how acantilever beam can be used to measure the droplet impact force. Based on the displacement curves shown in Fig. 5,
Volume 7, Issue 1, 2019

92 Chenet al.
FIG. 5: (a) Typical measured displacement of the beam for drop impact at 2 m/s (a) and 1.5 m/s (b) on a cantilever beam. Theshaded region in the inset indicates the moment when the maximum displacement occurs. The oscillatory process of the beamcontinues after 500 ms (data not shown).
the impact force as a function of time can be obtained. Figure 6 shows the measured force (using the cantileverbimorph) for impact at 2 and 1.5 m/s; the measured force oscillates after the impact. The maximum impact force wasobserved at 6 ms [see the inset in Fig. 6(a)]. Such observation deviates from the behavior discussed in Fig. 4 (notethatηmax is reached at 3.2 ms). A maximum force at 6 ms is also different from the literature (Mangili et al., 2012;Li et al., 2014b) which reported it to be before the time forηmax. As Fig. 4 shows, the drop rebounds after 26 ms(no contact with the surface); so no force should act on the surface by the drop. This tells us that the force obtainedfrom the bimorph may not be in sync with the drop impact process. The reason for such discrepancy can be the smallnatural frequency of the system (44 Hz) needed to capture the impact force instantaneously. For the drop impact,the maximum force occurs at approximately 0.2–0.3 ms (depending on the system) (Li et al., 2014b). The cantileverbeam system with a low natural frequency of 44 Hz takes more than 22 ms (much larger than 0.2–0.3 ms) to finishone oscillation. Therefore, the maximum force disappears before the beam can react.
Based on the discussion above, we can infer that our system used in the experiments with its low natural frequency(44.3 Hz) cantilever beam is not suitable for the impact force measurement. To find what should be the needed systemproperties, we use the numerical framework discussed, to conduct virtual impact force measurements. With thisnumerical framework, the impact force of a water droplet (diameter of 2.3 mm) at 2 m/s impacting on a surface withan advancing contact angle of 103◦ (same as the surface used in 2 m/s elastic impact) was obtained; see Fig. 7. Theforce curve from the VOF simulation is different from Fig. 6(a). The impact force increases with the increase of timewith the maximum force occurring at approximately 0.22 ms after the impact (before lamella reachesηmax)—notethe negative sign signifies the direction of force in Figs. 6 and 7. The impact force decreases slowly after reaching the
Interfacial Phenomena and Heat Transfer

Drop Impact onto a Cantilever Beam 93
FIG. 6: The force measured by the bimorph during the impact of a droplet at 2 m/s (a) and 1.5 m/s (b) on a cantilever beam. Thedashed line indicates the moment when the maximum force occurs. Note that the negative sign for the force simply implies thedownward direction of the force.
FIG. 7: Evolution of the impact force of a 2.3-mm-diameter drop impact on a rigid surface (θa: 102◦ andθr: 95◦) generated usingVOF simulation. The impact speed used in this simulation was 2 m/s. Note that the negative sign for the force simply implies thedownward direction of the force.
Volume 7, Issue 1, 2019
94 Chenet al.
maximum force. Such observation (e.g., the time for the maximum force) matches with the previous studies (Mangiliet al., 2012; Li et al., 2014b); e.g., in Mangili et al. (2012), the maximum surface deformation was at∼ 0.54 ms whena liquid drop impacts onto a soft surface. This finding suggests that the maximum impact force occurs earlier than0.54 ms after the impact (0.22 ms found in VOF simulation fits in this range).
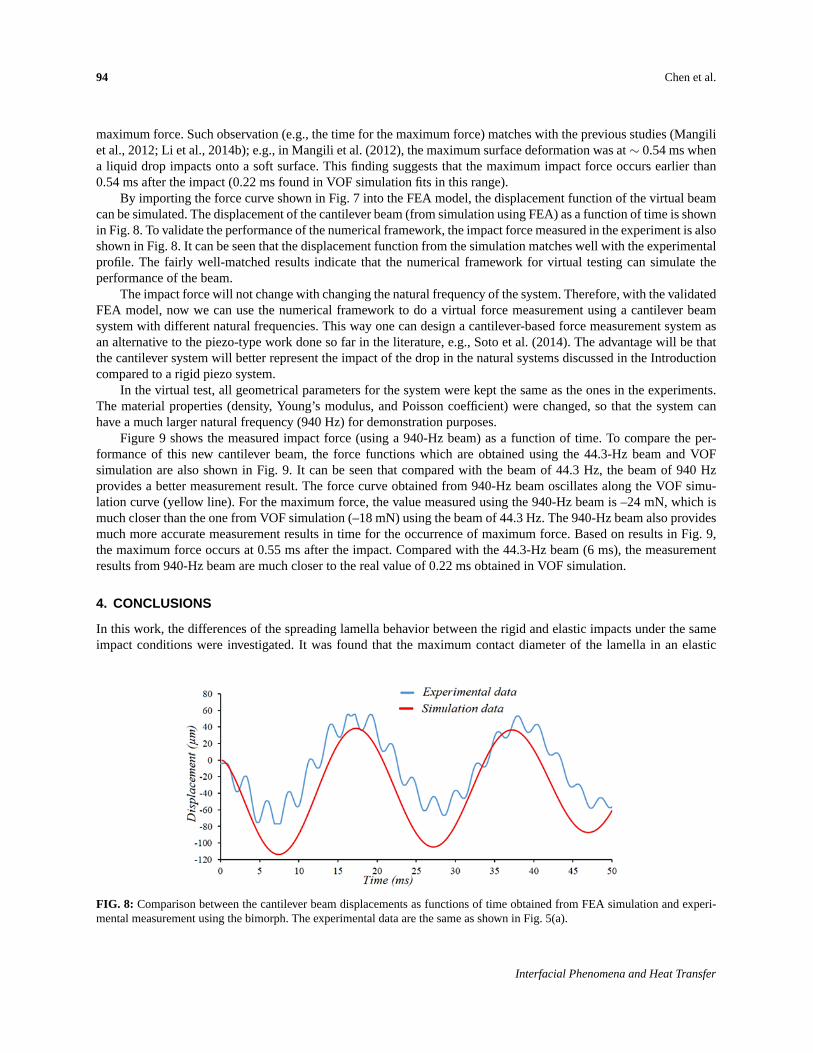
By importing the force curve shown in Fig. 7 into the FEA model, the displacement function of the virtual beamcan be simulated. The displacement of the cantilever beam (from simulation using FEA) as a function of time is shownin Fig. 8. To validate the performance of the numerical framework, the impact force measured in the experiment is alsoshown in Fig. 8. It can be seen that the displacement function from the simulation matches well with the experimentalprofile. The fairly well-matched results indicate that the numerical framework for virtual testing can simulate theperformance of the beam.
The impact force will not change with changing the natural frequency of the system. Therefore, with the validatedFEA model, now we can use the numerical framework to do a virtual force measurement using a cantilever beamsystem with different natural frequencies. This way one can design a cantilever-based force measurement system asan alternative to the piezo-type work done so far in the literature, e.g., Soto et al. (2014). The advantage will be thatthe cantilever system will better represent the impact of the drop in the natural systems discussed in the Introductioncompared to a rigid piezo system.
In the virtual test, all geometrical parameters for the system were kept the same as the ones in the experiments.The material properties (density, Young’s modulus, and Poisson coefficient) were changed, so that the system canhave a much larger natural frequency (940 Hz) for demonstration purposes.
Figure 9 shows the measured impact force (using a 940-Hz beam) as a function of time. To compare the per-formance of this new cantilever beam, the force functions which are obtained using the 44.3-Hz beam and VOFsimulation are also shown in Fig. 9. It can be seen that compared with the beam of 44.3 Hz, the beam of 940 Hzprovides a better measurement result. The force curve obtained from 940-Hz beam oscillates along the VOF simu-lation curve (yellow line). For the maximum force, the value measured using the 940-Hz beam is –24 mN, which ismuch closer than the one from VOF simulation (–18 mN) using the beam of 44.3 Hz. The 940-Hz beam also providesmuch more accurate measurement results in time for the occurrence of maximum force. Based on results in Fig. 9,the maximum force occurs at 0.55 ms after the impact. Compared with the 44.3-Hz beam (6 ms), the measurementresults from 940-Hz beam are much closer to the real value of 0.22 ms obtained in VOF simulation.
4. CONCLUSIONS
In this work, the differences of the spreading lamella behavior between the rigid and elastic impacts under the sameimpact conditions were investigated. It was found that the maximum contact diameter of the lamella in an elastic
FIG. 8: Comparison between the cantilever beam displacements as functions of time obtained from FEA simulation and experi-mental measurement using the bimorph. The experimental data are the same as shown in Fig. 5(a).
Interfacial Phenomena and Heat Transfer

Drop Impact onto a Cantilever Beam 95
FIG. 9: Evolutions of the impact force measured using a 940-Hz beam, a 44.3-Hz beam [same as Fig. 6(a)], and VOF simulation(same as Fig. 7). The impact conditions (i.e., surface contact angle, impact speed, and drop volume) are the same as shown inFig. 8.
impact is significantly smaller than that of a rigid impact. This is due to the elastic/bending energy stored in the beamfor the elastic impact case. The cantilever beam is shown to be a method that can measure the maximum impact forceadequately as an alternate to piezo-type force measurement systems. Numerical simulation showed the need to use ahigh natural frequency beam for impact force measurement to be acceptable.
ACKNOWLEDGMENT
We thank NSERC (The Natural Sciences and Engineering Research Council of Canada) for the funding support.
REFERENCES
Ahmad, M.A., Piezoelectric Water Drop Energy Harvesting,J. Electron. Mater., vol. 43, no, 2, pp. 452–458, 2014.
Brackbill, J.U., Kothe, D.B., and Zemach, C., A Continuum Method for Modeling Surface Tension,J. Comput. Phys., vol. 100,no. 2, pp. 335–354, 1992.
Brakke, K.A., The Surface Evolver and the Stability of Liquid Surfaces,Proc. R. Soc. London, Ser. A, vol. 354, pp. 2143–2157,1996.
Chen, N., Chen, H., and Amirfazli, A., Drop Impact onto a Thin Film: Miscibility Effect,Phys. Fluids, vol. 29, no. 9, pp. 092106(1–7), 2017.
Dressaire, E., Sauret, A., Boulogne, F., and Stone, H.A., Drop Impact on a Flexible Fiber,Soft Matter, vol.12, pp. 200–208, 2016.
Gart, S., Mates, J.E., Megaridis, C.M., and Jung, S., Droplet Impacting a Cantilever: A Leaf-Raindrop System,Phys. Rev. Appl.,vol. 3, pp. 044019(1–8), 2015.
Georgoulas, A., Koukouvinis, P., Gavaises, M., and Marengo, M., Numerical Investigation of Quasi-Static Bubble Growth andDetachment from Submerged Orifices in Isothermal Liquid Pools: The Effect of Varying Fluid Properties and Gravity Levels,Int. J. Multiphase Flow, vol. 74, pp. 59–78, 2015.
Gordillo, L., Sun, T.-P., and Cheng, X., Dynamics of Drop Impact on Solid Surfaces: Evolution of Impact Force and Self-SimilarSpreading,J. Fluids Mech., vol. 840, no. 10, pp. 190–214, 2018.
Josserand, C. and Thoroddsen, S.T., Drop Impact on a Solid Surface,Annu. Rev. Fluid Mech., vol. 48, pp. 365–391, 2016.
Kim, J.H., Rothstein, J.P., and Shang, J.K., Dynamics of a Flexible Superhydrophobic Surface during a Drop Impact,Phys. Fluids,vol. 30, pp. 072102(1–8), 2018.
Volume 7, Issue 1, 2019

96 Chenet al.
Kistler, S., Hydrodynamics of Wetting, inWettability, New York: Marcel Dekker, pp. 311–430, 1993.
Lee, H.J. and Kim, H., Control of Drop Rebound with Solid Target Motion,Phys. Fluids, vol.16, no. 10, pp. 3715–3719, 2004.
Li, H., Tian, C., and Deng, Z.D., Energy Harvesting from Low Frequency Applications Using Piezoelectric Materials,Appl. Phys.Rev., vol.1, pp. 041301(1–20), 2014a.
Li, J., Zhang, B., Guo, P., and Lv, Q., Impact Force of a Low Speed Water Droplet Colliding on a Solid Surface,J. Appl. Phys.,vol. 116, p. 214903, 2014b.
Mangili, S., Antonini, C., Marengo, M., and Amirfazli, A., Understanding the Drop Impact Phenomenon on Soft PDMS Substrates,Soft Matter, vol. 8, pp. 10045–10054, 2012.
Soto, D., De Lariviere, A.B., Boutillon, X., Clanet, C., and Quere, D., The Force of Impacting Rain,Soft Matter., vol.10, pp.4929–4934, 2014.
Vontas, K., Andredaki, M., Georgoulas, A., Nikas, K.S., and Marengo, M., Numerical Investigation of Droplet Impact on SmoothSurfaces with Different Wettability Characteristics: Implementation of a Dynamic Contact Angle Treatment in OpenFOAM,Proc. of ILASS–Europe 2017. 28th Conf. on Liquid Atomization and Spray Systems, vol. 28, pp. 6–8, 2017.
Wang, L., Sharp, D., Masliyah, J., and Xu, Z., Measurement of Interactions between Solid Particles, Liquid Droplets, and/or GasBubbles in a Liquid Using an Integrated Thin Film Drainage Apparatus,Langmuir, vol.29, no. 11, pp. 3594–3603, 2013.
Weisensee, P.B., Ma, J., Shin, Y.H., Tian, J., Chang, Y., King, W.P., and Miljkovic, N., Droplet Impact on Vibrating Superhy-drophobic Surfaces,Phys. Rev. Fluids, vol.2, pp. 103601(1–14), 2017.
Weisensee, P.B., Tian, J., Miljkovic, N., and King, W.P., Water Droplet Impact on Elastic Superhydrophobic Surfaces,Sci. Rep.,vol. 6, pp. 30328(1–9), 2016.
Wong, V.K., Ho, J.H., and Sam, H.K., On Accumulation of Water Droplets in Piezoelectric Energy Harvesting,J. Intell. Mater.Syst. Struct., vol. 28, no. 4, pp. 521–530, 2017.
Yarin, A.L. and Weiss, D.A., Impact of Drops on Solid Surfaces: Self-Similar Capillary Waves, and Splashing as a New Type ofKinematic Discontinuity,J. Fluid Mech., vol. 283, pp. 141–173, 1995.
Yarin, A.L., Drop Impact Dynamics: Splashing, Spreading, Receding, Bouncing,Annu. Rev. Fluid Mech., vol.38, pp. 159–192,2006.
Zhang, B., Li, J., Guo, P., and Lv, Q., Experimental Studies on the Effect of Reynolds and Weber Numbers on the Impact Forcesof Low-Speed Droplets Colliding with a Solid Surface,Exp. Fluids, vol. 58, pp. 125(1–12), 2017.
Interfacial Phenomena and Heat Transfer