"driving it home. choosing the right path for fueling … · june 2007 driving it home:...
TRANSCRIPT

June 2007 Driving It Home:
Choosing the Right Path for Fueling North America’s Transportation Future
A joint report by:Natural Resources Defense Council
Western Resource Advocates
Pembina Institute
AuthorsAnn BordetskyNatural Resources Defense Council
Susan Casey-LefkowitzNatural Resources Defense Council
Deron Lovaas Natural Resources Defense Council
Elizabeth Martin-PereraNatural Resources Defense Council
Melanie NakagawaNatural Resources Defense Council
Bob Randall Western Resources Advocates
Dan WoynillowiczPembina Institute
Sustainable Energy Solut ions

Driving It Home: Choosing the Right Path for Fueling North America's Transportation Future
About NRDCThe Natural Resources Defense Council is an international nonprofit environmental organization with more than 1.2 million members and online activists. Since 1970, our lawyers, scientists, and other environmental specialists have worked to protect the world’s natural resources, public health, and the environment. NRDC has offices in New York City, Washington, D.C., Los Angeles, San Francisco, and Beijing. Visit us at www.nrdc.org.
About the Pembina InstituteThe Pembina Institute creates sustainable energy solutions through innovative research, education, consulting and advocacy. It promotes environmental, social and economic sustainability in the public interest by developing practical solutions for communities, individuals, governments and businesses. The Pembina Institute provides policy research, leadership and education on climate change, energy issues, green economics, energy efficiency and conservation, renewable energy and environmental governance. More information about the Pembina Institute is available at www.pembina.org or by contacting: [email protected].
About Western Resources AdvocatesFounded in 1989, Western Resources Advocates is a nonprofit conservation organization dedicated to protecting the Interior West’s land, air, and water. Priorities include protecting special public lands from oil and gas development, promoting a clean energy future, and advocating for urban water conservation and restoration of rivers and lakes. Western Resource Advocates has offices in Boulder, Salt Lake City, and Carson City. To learn more, please visit www.westernresourceadvocates.org.
Acknowledgments Coordinated by Susan Casey-Lefkowitz, NRDC, the following authors contributed to this report: Ann Bordetsky, NRDC; Susan Casey-Lefkowitz, NRDC; Deron Lovaas, NRDC; Elizabeth Martin-Perera, NRDC; Melanie Nakagawa, NRDC; Bob Randall, WRA; and Dan Woynillowicz, Pembina Institute. The authors would like to thank the following people for providing their time and expertise to the report: Alyssa Go, Roland Hwang, and Johanna Wald. The authors would also like to thank reviewers Liz Barratt-Brown, Stephen D’Esposito, Debbie Hammel, Nathanael Greene, Dan Lashof, Andrew Logan, Amy Mall, George Peridas, and John Steelman. Thank you to the Pew Charitable Trusts and the International Boreal Conservation Campaign for helping to fund this project.
NRDC Director of Communications: Phil GutisNRDC Marketing and Operations Director: Alexandra KennaughNRDC Publications Manager: Lisa GoffrediProduction: Tanja Bos, www.bosscott.comCover Photo: ©2005 The Pembina Institute
Copyright 2007 by the Natural Resources Defense Council.
For additional copies of this report, send $5.00 plus $3.95 shipping and handling to NRDC Publications Department, 40 West 20th Street, New York, NY 10011. California residents must add 7.5% sales tax. Please make checks payable to NRDC in U.S. dollars. The report is also available online at www.nrdc.org/policy
This report is printed on paper that is 100 percent post-consumer recycled fiber, processed chlorine free.

iii
Table of ContentsExecutive Summary iv
Chapter 1: Transportation Fuel at a Crossroads 1 The Demand Side: The Gas-Guzzling Transportation Sector The Supply Side: Strained Production Capacity Price Trends: Opening a Pandora’s Box The High Environmental Price of Unconventional Fuels
Chapter 2: Canadian Tar Sands: Scraping the Bottom of the Barrel in Endangered Forests 4 Race to Develop Tar Sands How Do You Get Oil From Tar Sands? Environmental and Social Costs of Tar Sands Are Too High Canada Is Becoming America’s Gas Tank What Needs To Be Done: Stem Destructive Development
Chapter 3: Oil Shale Extraction: Drilling Through the American West 10 Getting Oil From Shale Oil Shale Development Poses Serious Environmental and Social Risks Bush Administration Races to Tap Untested Oil Shale Technology What Needs to Be Done: Stop Risky Shale Development Before It Starts
Chapter 4: Liquid Coal: A “Clean Fuel” Mirage 15 Converting Coal into Global Warming Pollution at the Pump The Damaging Legacy of King Coal: Impacts on Our Health, Land, and Water Liquid Coal: A “Clean Fuel” Mirage What Needs To Be Done: Cease Development of Liquid Coal
Chapter 5: The Investment Landscape: Dirty Fuels Are Risky Business 19 Taxpayers Are Footing the Bill for Unsavory Oil Deals Global Warming: Market Concern Is Heating Up Liabilities of Unconventional Oil Make Investments a Losing Proposition Recommendations for Investors
Chapter 6: The Clean Path for Transportation 24 Set the Bar for Substitute Fuels Deploy More Fuel-Efficient Technologies and Manage Travel Demand Offer Consumers More Choices and Provide Incentives to Use Them
Conclusion 30
Endnotes 31

iv
Executive Summary
Unfortunately, the United States and Canada remain largely focused on scraping the bottom of the barrel by betting on lower-grade and difficult-to-access raw fossil fuels, including those extracted from tar sands, oil shale, and even coal. The United States, as the number-one consumer of oil in the world, is the primary driver behind the development of oil substitutes in North America. This report explores for the first time the full scale of the damage that our enormous appetite for energy could have on the air we breathe, the water we drink, our climate, and our invaluable wildlands.
“Unconventional” Fuels Are Not the AnswerEach of the fuel sources described in this report—tar sands, oil shale, and liquid coal—comes with its own set of serious risks to our health, to our environment, and to the
bottom line of businesses that invest in these high-carbon fossil fuels. Development of these fuels is fundamentally incompatible with our need for cleaner fuels to preserve our air, protect our lands, and avert dangerous global warming.
For example:n Tar sands extraction in Canada’s Boreal Forest is destroying virtually undisturbed wilderness areas with a vast network of open pit mines, wells, roads, and pipes. n Oil shale drilling in parts of Colorado, Utah, and Wyoming would drain scarce western water resources, threaten wildlife habitat, and increase air pollution that can contribute to asthma and emphysema, cause mercury poisoning, and even lead to premature death.n Liquid coal development in the West risks increasing global warming pollution, degrading the scenic beauty and wilderness value of our 46 western national parks, and
North America stands at an energy crossroads. With the world fast
approaching the end of cheap, plentiful conventional oil, we now face a
choice: to develop ever-dirtier sources of transportation fuel derived from
fossil fuels—at an even greater cost to our health and environment—or to set a course
for a more sustainable energy future of clean, renewable fuels. Fortunately, we have the
solutions at hand to guide us toward a cleaner fuel future: By increasing the efficiency
of our cars and trucks to “stretch” our supply of conventional oil, and by developing
low-carbon substitutes such as sustainably produced biofuels, we can continue to
power our cars and trucks while safeguarding our health, our communities, and
our environment.
Driving It Home: Choosing the Right Path for Fueling North America's Transportation Future
v
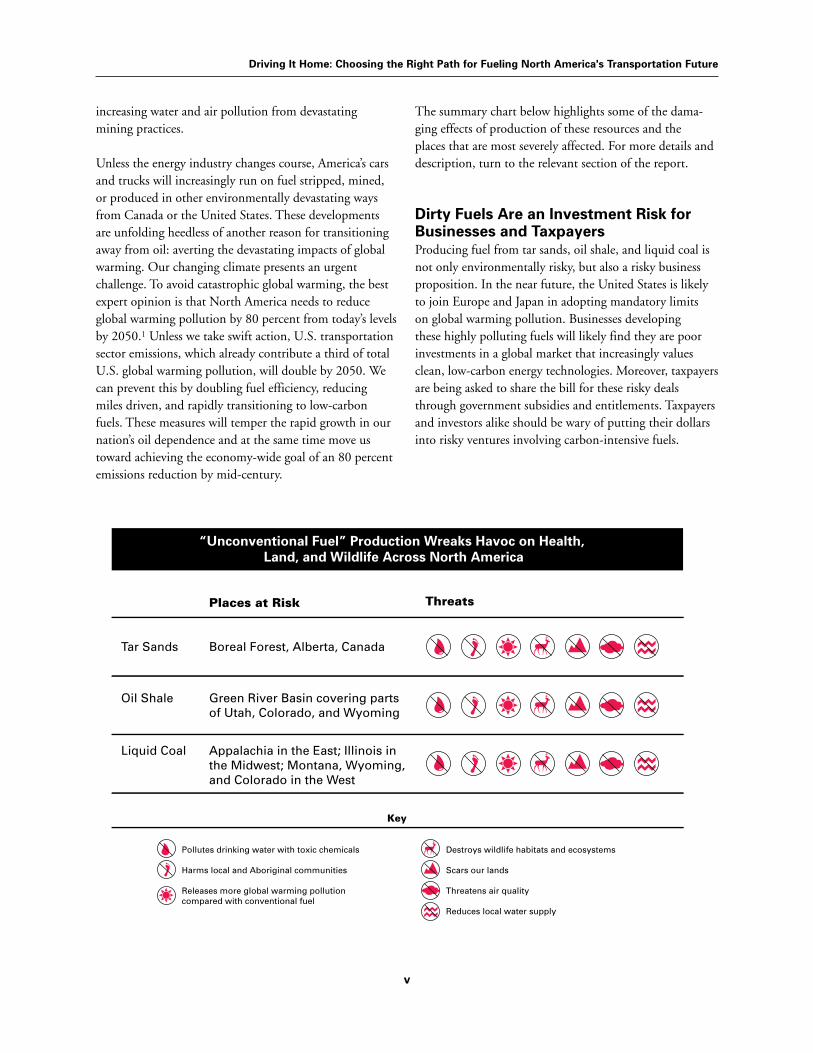
increasing water and air pollution from devastating mining practices.
Unless the energy industry changes course, America’s cars and trucks will increasingly run on fuel stripped, mined, or produced in other environmentally devastating ways from Canada or the United States. These developments are unfolding heedless of another reason for transitioning away from oil: averting the devastating impacts of global warming. Our changing climate presents an urgent challenge. To avoid catastrophic global warming, the best expert opinion is that North America needs to reduce global warming pollution by 80 percent from today’s levels by 2050.1 Unless we take swift action, U.S. transportation sector emissions, which already contribute a third of total U.S. global warming pollution, will double by 2050. We can prevent this by doubling fuel efficiency, reducing miles driven, and rapidly transitioning to low-carbon fuels. These measures will temper the rapid growth in our nation’s oil dependence and at the same time move us toward achieving the economy-wide goal of an 80 percent emissions reduction by mid-century.
The summary chart below highlights some of the dama-ging effects of production of these resources and the places that are most severely affected. For more details and description, turn to the relevant section of the report.
Dirty Fuels Are an Investment Risk for Businesses and TaxpayersProducing fuel from tar sands, oil shale, and liquid coal is not only environmentally risky, but also a risky business proposition. In the near future, the United States is likely to join Europe and Japan in adopting mandatory limits on global warming pollution. Businesses developing these highly polluting fuels will likely find they are poor investments in a global market that increasingly values clean, low-carbon energy technologies. Moreover, taxpayers are being asked to share the bill for these risky deals through government subsidies and entitlements. Taxpayers and investors alike should be wary of putting their dollars into risky ventures involving carbon-intensive fuels.

Driving It Home: Choosing the Right Path for Fueling North America's Transportation Future
vi
Solutions for a Clean, Efficient, and Secure Energy FutureThere are serious costs and consequences of hewing to the high-pollution path for fueling North America’s transportation sector. Fortunately, there are solutions we can put in place now—as investors, as policymakers, and as industry leaders—that will help steer North America onto the cleaner road.
RECOMMENDATIONS FOR INvESTORS Investors should:n demand transparency regarding the full financial risks associated with the environmental and social liabilities of unconventional sources of liquid fuel; n assign a financial value for the short- and long-term environmental risks of unconventional sources of liquid fuel, including the cost of emissions-control technology, and require companies to articulate strategies for mitigating these risks; andn consider the competitiveness of unconventional sources of liquid fuel in a carbon-constrained market and actively evaluate fuel technologies based on their potential to meet a low-carbon fuel obligation.
RECOMMENDATIONS FOR INDUSTRyn Automakers should promote technologies that power vehicles with electricity, not oil. n Truck and airplane manufacturers should deploy new, advanced technologies to get farther on less oil.
RECOMMENDATIONS FOR POLICyMAkERSPolicymakers should:n establish a low-carbon fuel performance standard that requires a less carbon-intensive fuel mix over time and creates a competitive market for clean fuels;n enact reasonable sustainability standards and global warming pollution safeguards to reduce unintended environmental harms from increasing biofuels production;n require all vehicles to be flex-fuel;n require, and help finance, the transformation of retail fuel delivery to provide more fuel options at the pump;n raise fuel economy standards for cars and light trucks;n adopt fuel economy performance standards for heavy trucks and tires; andn invest in transit and provide incentives for people to opt out of driving.
A Better Way ForwardThis report examines the path North America is on to fuel its cars and trucks, starting with a supply-and-demand analysis of the current state of transportation fuels. We next turn to the existing and future impacts of the three pollution-heavy fossil fuel extraction methods touted by North American governments and industry: tar sands, oil shale, and liquid coal. Finally, we outline a cleaner path to reduced reliance on oil and reduced global warming pollution, highlighting the growing consensus among business leaders, defense experts, and energy experts that investment in environmentally sustainable fuels, energy efficiency, and fuel economy can bring new, cleaner technologies to the market and provide more environmentally sustainable transportation choices.
The race to tap so-called “unconventional” fuel sources threatens the Athabasca River delta in Alberta, Canada, the largest freshwater delta in the world. The Athabasca is downstream from polluting tar sands operations.

1
CHAPTER 1
Transportation Fuel at a Crossroads
Most experts agree that we are approaching the end of cheaply accessible
oil. Many experts predict a peaking of conventional oil production a few
years or at most a few decades away.2 What replaces oil will profoundly
affect our security, economy, and environment. In the United States, conventional oil
production peaked in 1970 and has been stagnant ever since, in spite of continued
exploration and investment.3 We’re scouring the earth for more oil, from the tar-
like substance mixed with sands excavated from under the Boreal forests of Alberta,
Canada, to material mined from shale under the U.S. Rockies, to coal stripped from
the mountains of the American West and Appalachia and manufactured into synthetic
liquid fuel. North America may well be transitioning from cheap, accessible oil toward
costlier, lower-quality, and environmentally destructive fossil fuel resources.
At this critical crossroads for fueling our future, we must now make a choice about how to meet our transportation needs. Will we do so by compounding our addiction to oil by fixating on even dirtier, unconventional fossil fuels? Or will we choose a new path toward environmentally sound fuels, new low-carbon technologies, and cleaner approaches to transportation?
The choice is ours to make.
The Demand Side: The Gas-Guzzling Transportation SectorTransportation outweighs every other sector in petroleum consumption, accounting for two-thirds of total U.S. oil demand (see Figure 1).
Figure 1
Most of our petroleum is consumed by transportation. Ninety-seven percent of transportation energy comes from petroleum-derived fuels.Source: Annual Energy Outlook 2007, EIA.

Driving It Home: Choosing the Right Path for Fueling North America's Transportation Future
2
America consumes more oil per capita than any other country in the world, using up a quarter of the oil produced globally. And high prices haven’t slowed us down: Even in the context of sustained high oil prices in the last five years, fuel use trends remain largely unchanged. Instead, our transportation fuel demand continues to rise relentlessly; in fact, as of 2005, transportation accounted for more than 28 percent of our total energy use.4
The Supply Side: Strained Production CapacityBooming demand has outstripped production and refining capacity in recent years. This is in part due to what some have dubbed “the end of cheap oil,” as exploration and production of oil fields move to the most difficult-to-access and technically challenging locales, such as deepwater fields.5
The rise of national oil companies (NOCs) as the keepers of an increasing portion of the world’s remaining oil endowment has sparked concerns among some analysts about constraints on supply due to concentration of ownership among politically unstable countries such as Iran and Venezuela.6 According to a new Rice University study, 77 percent of the world’s 1.148 trillion barrels of proven reserves are in the hands of the national companies; 14 of the top 20 oil-producing companies are state-controlled.7
Supply concerns are unlikely to be eased by the growing clout of the world’s oil cartel, the Organization of Petroleum Exporting Countries (OPEC), which added Angola as its newest member this year.8 OPEC is now poised to control more than 50 percent of the oil market in coming years, up from 35 percent today.9
Price Trends: Opening a Pandora’s BoxNorth American consumers have been hit hard at the pump in the past few years as a result of booming demand and concerns about supply. High prices, in turn, spur producers’ interest in excavating for dirty fuel—despite the higher cost to our health and environment.
In the beginning of 2004, the average price of a barrel of oil in the global marketplace passed the $30 mark, and it
shows no sign of going down anytime soon. According to Energy Information Administration (EIA) projections, oil prices for 2007-2008 will remain at an average of $64 per barrel.10 High prices are making high-carbon fuel sources more attractive to producers, whereas low-carbon fuels—which rely on new industries—still struggle to attract investments in an economy that does not have mandatory global warming pollution controls. Untapped high-carbon energy sources—though risky—are plentiful, with oil shale and tar sands combined representing 3.5 trillion barrels.11
Unless industry, policymakers, and the public are motivated to steer another course, continued price trends will likely cause us to stumble into much greater use of high-carbon fuels. The Energy Information Administration (EIA) confirms this in its most recent projections, which assume no change in current policy. And interest in unconventional fuel will only jump if the EIA’s high-price scenario comes to pass and prices breach the $100-per-barrel mark by 2030—something that would have seemed unlikely a few short years ago, but seems possible now.12 The graph below shows the growth, in percentage, of unconventional sources of liquid fuels in two possible scenarios for price trends in EIA’s most recent Annual Energy Outlook: The reference case (ending at $59 a barrel in 2030) and a high-price case (ending at $101 a barrel in 2030).
Figure 2
Source: Annual Energy Outlook 2007, EIA.
Unfortunately, the shift to these unconventionals is already underway, as starkly described by oil industry expert Leonardo Maugeri: “[A] process of ‘deconventionalization’ of reserves is taking place…coming from both new and traditional producing countries, and from unconventional sources such as gas liquids, ultra-deep offshore deposits,

Driving It Home: Choosing the Right Path for Fueling North America's Transportation Future
3
ultra-heavy oils, shale oils, and tar sands.”13 International oil companies are already pressing forward with new investments, as shown in Table 1.
Table 1: Major Corporations Are Investing in “Unconventional” Oil and Liquid Coal
Company Investing in Unconventional Fuel?
Tar Sands Oil Shale Liquid Coal
ExxonMobil Yes Yes Unclear14
Royal Dutch Shell Yes Yes Yes
Chevron Corp. Yes Yes Yes
ConocoPhillips Yes Yes Yes
Again, price trends help explain the growing interest in these investments. Tar sands exploitation becomes economically viable above a threshold of $30 per barrel, and production of liquid fuels derived from oil shale and coal could become similarly viable at slightly higher prices.15,16 However, large upfront capital investments are required, and these fuels are much more costly to produce on a per-unit basis than those derived from conventional oil (see the chapters that discuss these resources in depth for more details).17
Huge capital investment is indeed required to get these new industries off the ground. In its World Energy Outlook reference case, the International Energy Agency (IEA) estimates that annual global investments in field exploration and development, including unconventional oil and liquefied coal projects, must average $125 billion (in 2005 dollars) from 2006-2030, or 25 percent higher than in the past decade.18 Much of this capital could be put to other uses; sinking it into development of high-carbon fuels poses serious risks.
The High Environmental Price of Unconventional FuelsExtraction of tar sands, oil shale, and coal for fuel also comes with terrible risks to the environment and communities. Fuel production from these sources is energy intensive, and the production process emits a far higher amount of global warming pollution than does conventional oil production (see Figure 3). Moreover, extraction of all three resources comes at enormous cost to our water, air, forests, wetlands, and wildlife and places serious burdens on community infrastructure and public health.
Figure 3
We now turn to a detailed assessment of the cost and consequences of choosing to fuel our transportation future with these three high-pollution alternatives to conventional oil.

4
Race to Develop Tar SandsIn North America, tar sands are primarily found under an area of Alberta’s Boreal forest and wetlands that is larger than the state of Florida.20 The tar sands are estimated to contain 1.7 trillion barrels of crude bitumen. Only recently deemed commercially viable, such reserves make Canada second in the world in oil reserves, after Saudi Arabia.21
Commercial development of the tar sands began near Fort McMurray, Alberta, with open-pit strip mines in the late 1960s and continued at a slow pace through the 1970s and 1980s. Until the mid-1990s, tar sands development was considered unprofitable and risky. Then the Alberta government and the government of Canada, together with the oil industry, laid out a new, 25-year strategy for tar sands oil production.22 The strategy included proposals for new tax breaks, an investment-friendly royalty regime with low royalty rates, and a new marketing face for the tar sands that rebranded them “oil sands,” a term deemed more attractive than “tar sands.” Now, with rising oil prices and significant oil deposits becoming harder to find, the
petroleum industry is flocking to the tar sands. Production of oil from Alberta’s tar sands has doubled over the last 10 years to approximately 1.1 million barrels per day in 2005.23
However, there is a growing backlash in Alberta against the rapid pace of tar sands development. The rate of growth of the environmental “footprint” of tar sands development has resulted in the United Nations Environment Program identifying the Athabasca tar sands region as one of the world’s top 100 hotspots of environmental change.24 Albertans are voicing concern that environmental, public health, and infrastructure needs are not able to keep pace with the current rate of development. An overwhelming majority of Albertans (91 percent) has said they expect the environment to be protected, even if this slows down opportunities for tar sands development.25 Residents of Fort Chipewyan, a community of about 1,200 people 300 kilometers downstream of Fort McMurray, have been diagnosed with a high number of illnesses, including leukemia, lymphomas, lupus, and autoimmune diseases.
CHAPTER 2
Canadian Tar Sands: Scraping the Bottom of the Barrel in Endangered Forests
The oil industry is transforming millions of acres of Boreal forest and wetlands
in Alberta, Canada, to extract and produce low-grade petroleum fuel. This
vast, intact forest ecosystem is home to bears, wolves, and lynx and provides
breeding ground for 30 percent of North America’s songbirds and 40 percent of our
waterfowl.19 The Boreal is also home to First Nations communities, many of which
rely on fishing, hunting, and trapping for their livelihoods. But the rush to strip-mine
and drill the tar sands will scrape away and fragment millions of acres of this wild
forest, transforming Canadian wildlands into America’s gas tank.

Driving It Home: Choosing the Right Path for Fueling North America's Transportation Future
5
This led the Fort McMurray medical examiner, Dr. John O’Connor, to state that “he’d like some answers before more developments are approved,” citing an unusually high number of immune system diseases affecting the thyroid.26 Similarly, the mayor and city council of the Regional Municipality of Wood Buffalo—the economic hub of tar sands development—voted unanimously to put the brakes on all future oil sands development until infrastructure issues are addressed.27
How Do you Get Oil From Tar Sands? Tar sands consist of a mixture of 85 percent sand, clay, and silt; 5 percent water; and 10 percent crude bitumen—the tarlike substance that can be converted to oil.28 Once separated from the sand, the bitumen is still low-grade, heavy oil that must undergo an energy-intensive process to turn it into a synthetic crude oil that more closely resembles conventional crude oil.
Today, most tar sands oil production results in vast open-pit mines—some as large as three miles wide and 200 feet deep. But only a small fraction of the bitumen deposits are close enough to the surface to be mined. The bulk of the established reserves (82 percent) are deeper and must be extracted by an energy-intensive process of injecting high-pressure steam into the ground to soften the bitumen so it can be pumped to the surface. 29, 30 Tar sands oil production uses enormous amounts of both water and energy—from mining and drilling the tar sands to processing the bitumen that is eventually converted to oil.31 Natural gas is the current fuel of choice in the tar sands because it has been readily available and relatively inexpensive. Altogether, the tar sands industry consumes enough natural gas every day to heat roughly 4 million American homes.
The tar sands’ incredible appetite for energy also has triggered proposals to build new natural gas pipelines and
Existing Refineries Receiving Tar Sands OilCommerce City, CO (Suncor)32 Rosemont, Minnesota (Flint Hills Resources/ Pine Bend Refinery)33 Whiting, Indiana (BP)34 Toledo, Ohio (Sunoco)35 Superior, Wisconsin (Murphy Oil)36 Warren, Pennsylvania (United Refining)37
Joliet, Illinois (ExxonMobil)38 Billings, Montana (ConocoPhillips)39 Billings, Montana (ExxonMobil)40 Wood River, Illinois (ConocoPhillips)41 Robinson, Illinois (Marathon Oil)42 Coffeyville, Kansas (Coffeyville)43 El Dorado, Kansas (Frontier Oil)44 Cattlesburg, Kentucky (Marathon Oil)45
St. Paul, MN (Flint Hills Resources)46 Laurel, Montana (Cenex, CHS)47 Detroit, Michigan (Marathon Oil)48 Borger, TX (ConocoPhillips)49 Anacortes, Washington (Tesoro)50 Ferndale, Washington (ConocoPhilips)51 Sinclair, Wyoming (Sinclair)52 Cheyenne, Wyoming (Frontier Oil)53
Proposed Refineries to Receive/Upgrade Tar Sands Oil

Driving It Home: Choosing the Right Path for Fueling North America's Transportation Future
6
Tar sands extraction would turn the pristine Boreal wilderness into a network of pipelines and refineries.©2005 The Pembina Institute.
open up new areas to natural gas drilling, including a 758-mile pipeline and gas fields through the pristine Boreal wilderness of the Mackenzie Valley in the Northwest Territories.54 One of the last large, intact portions of the Boreal forest, the Mackenzie Valley is home to grizzly bear and caribou and is the breeding ground of many migratory birds—all of which will be harmed by the pipeline and associated development it will facilitate. Oil companies such as ExxonMobil, active in both the Mackenzie Gas Project and the tar sands, have acknowledged that the Mackenzie Valley pipeline would be an important part of the infrastructure for fueling the oil sands.55
Using a relatively low-emissions fuel—natural gas—in a process that is so intensive that overall global warming pollution is increased just doesn’t make sense in today’s world. However, other emerging sources of energy for fueling tar sands development are not necessarily better. Gasification of coal or oil sands residue (the coke by-
product of upgrading) is the most commonly proposed alternative to natural gas and would bring with it even higher global warming pollution emissions unless mitigating technologies, such as carbon capture and disposal, are employed from the start. Further, concerns about the need for a clean energy source in the tar sands are often accompanied by the question of whether nuclear energy would be an option to reduce global warming pollution emissions. Nuclear energy is not an acceptable option at this point in the tar sands for several reasons, including the large capital investments and costs involved in building nuclear power plants, the environmental damage associated with fuel mining, concerns about nuclear security and proliferation, and concerns with storage, transportation, and management of nuclear waste.
Driving It Home: Choosing the Right Path for Fueling North America's Transportation Future
7
Environmental and Social Costs of Tar Sands Are Too High
ABORIGINAL COMMUNITIES FEAR FOR THEIR HEALTH, WATER, AND LANDAboriginal communities with traditional territories in the Alberta tar sands oil development region see the direct effects of development on their environment, culture, and traditional land uses. The Mikisew Cree First Nation and the Athabasca Chipewyan Nation have expressed concerns about the way Alberta is handling environmental and public health issues in the tar sands region, for instance by pulling out of a regional process set up to deal with cumulative environmental impacts.56 Specifically, the Mikisew Cree First Nation, which lives with the downstream impacts of tar sands development, has expressed concerns about water pollution, toxic waste management, ecological restoration, water level reductions in rivers and aquifers, decline in wildlife populations such as moose and muskrat, and loss of fish habitat.57
GLOBAL WARMING POLLUTION FROM TAR SANDS OIL PRODUCTION IS HIGHER THAN FROM CONvENTIONAL OIL PRODUCTIONCanada’s tar sands are the single largest contributor to global warming pollution growth in Canada.58 Further, tar sands oil production generates almost three times as much global warming pollution as conventional oil production because of the massive amounts of energy needed to extract, upgrade, and refine the oil.59 Global warming pollution emissions from tar sands production already totaled 25 megatons in 2003—more than the global warming pollution emissions from all the cars in Maryland that year.60, 61 Tar sands–related global warming pollution is projected to more than quadruple to between 108 and 126 megatons by 2015.62 As of early 2007, oil companies and government were discussing possibilities for carbon capture and disposal in the tar sands region, but without clear funding and timelines for the actual construction of such a system. Tar sands development is also largely responsible for the recent regional increase in air pollution from nitrogen oxides, sulphur dioxide, volatile organic compounds, and particulate matter.63
OPEN-PIT MINES AND INTENSIvE DRILLING ARE TURNING THE BOREAL FOREST INTO A WASTELAND“Tar sands” is a misleading name for a region that is still mostly undisturbed Boreal, including forests and wetlands. The Boreal is home to many species sensitive to industrial development, such as caribou and lynx. But open-pit mining turns this valuable ancient forest into a wasteland with polluted waters. Drilling in the tar sands requires such a complex of wells, roads, and pipes in areas where drilling is taking place that every part of the forest will be within a few hundred yards of an industrial intrusion. Although the companies in the tar sands assert that the land is reclaimed after mining, there has not yet been any mine fully reclaimed.64 Forest, peatlands, and wetlands ecosystems are highly complex, and it is unlikely they will regenerate in areas filled with mine waste.65
TOxIC WASTE POLLUTION AND WATER WITHDRAWALS THREATEN DELICATE WETLANDS AND RIvER ECOSySTEMS Both mining and drilling operations in the tar sands have severe impacts on water in Alberta. The tar sands region is rich in wetlands in the form of bogs, fens, shallow ponds, shoreline marshes, and river delta systems, such as the Peace-Athabasca Delta just downstream from the tar sands (to the north). The Alberta Chamber of Resources has identified water use as one of the top four challenges for mining operations.66 Mining operations require dredging wetlands, taking large amounts of water from the rivers. The ecological integrity of any aquatic ecosystem requires that adequate flows and seasonal variations in flow be maintained. Fish populations such as walleye, goldeye, and long-nose sucker are vulnerable, particularly when water withdrawals reduce winter habitat in the Athabasca River.67 But water allocations for existing, approved, and planned tar sands mining operations are expected to quadruple over allocations for existing projects in 2004.68
In-situ operations that take water from underground aquifers can also harm the area’s water supply. The hydrology in this region is a complex network of underground freshwater and saline aquifers, ground waters, and wetlands. The links among these systems are not yet fully understood, nor are the impacts of the water withdrawals and surface land and water destruction.69

Driving It Home: Choosing the Right Path for Fueling North America's Transportation Future
�
Table 2: Major Companies Investing in Tar Sands
Company Mining In-Situ Mackenzie Refining Tar Drilling Gas Project Sands Oil in U.S.?83
Chevron Texaco84 Yes No No Not available
ConocoPhillips Yes Yes Yes Yes
Encana No Yes No Yes
Imperial/ Exxon Mobil Yes Yes Yes Yes
Murphy Oil Yes Yes No Yes
PetroCanada Yes Yes No No
Royal Dutch Shell Yes Yes Yes Not available
Suncor Yes Yes No Yes
Syncrude (Canadian Yes No No Yes Oil Sands Ltd, Imperial /Exxon, Petro-Canada, ConocoPhillips, Murphy Oil)
TotalFina Yes85 Yes86 No No
One specific concern is that taking water out of underground aquifers could cause surface water to sink —causing, for example, a loss of wetlands.70
Tar sands mines also require extensive human-made wastewater reservoirs—which the industry calls “tailings ponds”—that pose another potential threat to wildlife and water. Collectively, these pools of waste cover almost 20 square miles, and are so vast that they can be seen from space.71 The high concentrations of pollutants such as naphthenic acids in tar sands tailings ponds are acutely toxic to aquatic life.72, 73 To chase off migratory birds, propane cannons go off at random intervals and scarecrows stand guard on floating barrels. Many of the tailings ponds are next to water bodies such as the Athabasca River, and there are concerns about potential leakage from existing tailings ponds and from future “remediated” or buried tailings. Alberta Environment does not regulate naphthenic acids, and future management of these pollutants is fraught with uncertainty.74, 75
Canada Is Becoming America’s Gas TankAmerica is Canada’s largest market for crude oil exports. The United States imports oil from the tar sands both in final refined form and in forms that still need further refining (synthetic crude oil or blended bitumen). Tar sands oil is primarily used to produce fuels (motor gasoline, diesel, jet fuel, and heating oil)
and petrochemicals. By 2005, Canada was already exporting almost 1.5 million barrels per day of crude oil to the United States.76 In fact, 66 percent of Canada’s oil production is exported, and since 1995, the United States has received 99 percent of these exports.77
While Canada’s domestic demand for oil has remained stable, growing foreign demand, almost exclusively from the United States, is driving increased oil production, much of which is coming from Alberta’s tar sands.78 In 2004 the oil industry invested almost US$9 billion79 in Alberta’s tar sands and more than US$100 billion could be invested between 2006 and 2015 if all announced projects proceed.80
With this frenzy of activity, Canada’s National Energy Board projected that oil production from the tar sands could increase from a little over 1 million barrels per day to between 3 and 4.4 million barrels per day by 2015.81 It also noted that growing American oil demand coupled with continuing concerns about geopolitical events and security of supply would make Canada an attractive and secure source of supply.82 In January 2006, a two-day oil summit was held in Houston, Texas, organized by the U.S. Department of Energy, Canada’s department of Natural Resources, and representatives of the oil industry. According to media reports, the minutes of the meeting documented plans for a “five-fold expansion” of tar sands production in a relatively “short time-span,” facilitated

Driving It Home: Choosing the Right Path for Fueling North America's Transportation Future
9
in part by streamlining environmental regulations for new projects.87 While the Prime Minister’s Office noted that the Canadian government would not streamline environmental assessments to speed up development,
the recently released federal budget included C$60 million to establish a Major Project Management Office to “streamline the review of natural resource projects,” “cut in half the average regulatory review period,” and develop “legislative and administrative options to further consolidate and streamline regulatory processes.” 88, 89, 90, 91 However, if tar sands oil development is to continue even at its current rate of expansion, it will need additional upgrading capacity, which is likely to include additional refineries and pipelines in the United States.
U.S. refineries primarily in the Midwest and the Rockies already take and refine Canadian crude oil, including oil from Alberta’s tar sands.92 Currently there is a move among U.S.-based refineries to expand in order to handle synthetic crude oil and bitumen from Canadian tar sands. For example, Suncor Energy bought a Denver-area refinery in 2003 for US$150 million (C$220 million) and plans to spend US$445 million to upgrade the refinery to handle tar sands crude.93 In September 2006, BP entered the final planning stage of a US$3 billion investment in Canadian heavy crude oil processing at its Whiting Refinery in northwest Indiana.94 Also in 2006, Marathon Oil proposed an upgrade for its refinery in Detroit to process heavy Canadian crude.95 Another sign of the planned increase in U.S. refining of tar sands oil can be seen in the plans for a new transboundary pipeline to export oil from the tar sands in Alberta to the U.S. Midwest.96 As of early 2007, the pipeline was going through its permitting and environmental impact assessment process in both countries. The project’s proponents say that the pipeline will be able to deliver 435,000 barrels per day (bpd) of crude oil to existing terminals in Missouri (Salisbury) and Illinois (Wood River and Patoka), with possible expansion of system capacity in the future up to 591,000 bpd.97
What Needs to Be Done: Stem Destructive Development Tar sands development comes at a high price both financially and as a result of extensive environmental damage and impacts on surrounding communities. It is clear that continued tar sands extraction would only take us farther down the dirty energy path, when there is such opportunity to be moving toward a cleaner energy future.The immediate solution to the runaway pace and environmental problems related to tar sands oil development is a moratorium on new project approvals. This will allow a rigorous, full-cost analysis to be completed that considers the significant environmental and social costs of existing and planned tar sands development.
Tar sands oil development should not be the solution to our transportation fuel needs, but to the extent that it does continue, it must occur under much stricter environmental and social protections.98 Further development of the tar sands should, at a minimum, be preceded by:
n better consultation with Aboriginal communities and real attention to their concerns and those of other local communities; n strict standards for water management, watershed preservation, and air pollution controls; n reduction of global warming emissions from tar sands production through a combination of efficiency improvements and other carbon emissions reductions and through carbon dioxide capture and disposal; and99 n an interconnected network of protected areas and corridors to maintain the ecological integrity of the Boreal forest and wildlife habitat.

10
With U.S. reserves estimated at about 1 trillion barrels of oil equivalent, oil shale has periodically been seen as a substitute source of oil. But large-scale development has never gotten off the ground, largely due to substantial cost and technical challenges associated with processing the shale and safely disposing of the waste. Attempts to develop the resource in response to the OPEC oil embargo in the 1970s famously failed in 1982 when Exxon closed the doors to its $5 billion Colony Oil Shale Plant near Rifle, Colorado, rendering 2,100 workers in western Colorado unemployed overnight.100
Though no conclusive measures of economic feasibility exist, potentially recoverable oil shale resources of the Green River Formation are often put at between 500 billion and 1.1 trillion barrels of oil. Even the midpoint of these estimates—800 billion barrels—is still more than triple the proven oil reserves of Saudi Arabia.101 About 500 billion barrels of potential shale oil are thought to be located in the Piceance Basin of western Colorado alone, meaning that this 1,200 square-mile area could
CHAPTER 3
Oil Shale Extraction: Drilling Through the American West
Oil shale is a sedimentary rock found in vast quantities in the Green River
Formation, which lies beneath portions of Colorado, Utah, and Wyoming.
When heated to extreme temperatures, shale can be converted into liquid
petroleum, which can be further refined into transportation fuel. Any large-scale oil
shale development poses substantial threats to the air, water, wildlife, and communities
of the western United States. Despite the serious risks of mining oil shale, the amount
of potential oil in the Green River Formation makes it an attractive proposition for
many oil companies.
Vast quantities of oil shale lie beneath the Green River Formation area in the Western United States.

Driving It Home: Choosing the Right Path for Fueling North America's Transportation Future
11
hold as much oil as the entire world’s proven oil reserves.102
Federal lands overlie about 80 percent of the in-place shale resources in the Piceance Basin.
Recent record-high gasoline prices have led the federal government and industry to reevaluate oil shale as a potential source of domestic liquid fuel. Congress included provisions in the omnibus Energy Policy Act of 2005 to accelerate activities that might lead to leasing and development of federal oil shale resources.103
Getting Oil From ShaleOil shale contains kerogen, a precursor to petroleum. Extracting the petroleum from oil shale involves heating the rock to temperatures reaching 900° F to turn the kerogen into a liquid—in essence, speeding up what it takes nature millions of years to accomplish. The term “oil shale” is a misnomer, a marketing term that refers to the end product available after processing, and not the rock itself.
Shale oil can be produced in two ways. The traditional method is to mine it through open-pit or underground mines, crush vast amounts to the size of gravel, and then cook it in a surface retort. Modern methods attempt to produce shale oil in-situ, or in place, by heating the shale where it lies deep underground and then extracting the liquid from the ground with conventional well technology. Experimental in-situ methods proposed on federal research leases in Colorado include heating the shale with electric resistance heaters, fracturing the shale before heating it by circulating hot CO2 gas through the formation, or circulating superheated steam through a closed-loop system to create a “broad horizontal layer of boiling oil” deep underground.104 None of these in-situ methods has been proven to work or to be economical, and each comes with substantial risks.
SHELL’S OIL SHALE RESEARCH PROJECT UNDERSCORES SHALE’S RISkS
Shell Exploration and Production Company has been conducting research activities using in-situ technologies on private land in Rio Blanco County, Colorado, off and on for the last 20 years. Shell’s experimental process involves inserting closely spaced electrical resistance heaters deep in the ground and heating a 1,000-foot-thick section of the kerogen-rich Mahogany Zone to about 750° F over a two- to three-year period. Shell also proposes installing a freeze wall around the site by circulating refrigerant through closely spaced wells on the project’s perimeter to prevent groundwater from mixing with produced hydrocarbons. Although Shell claims to have produced about 1,500 barrels of light oil and gas (about 2 barrels a day), its project has caused a disturbance of virtually 100 percent of the surface area of its site, required substantial amounts of energy, and left behind residual char that could damage the water supply.
Though Shell has spent two decades refining its in-situ process at its private test site, it still cannot say how much energy its process needs, how much water will be required, or whether the process is economically viable at today’s oil prices. While Shell stated in testimony to the U.S. Senate Energy and Natural Resources Committee in June 2006 that it would make a determination of the commercial viability of its experimental in-situ technology by 2010, it has subsequently changed its tune.105 In February 2007, Shell said for the first time that it would push back that timeline into the next decade.106

Driving It Home: Choosing the Right Path for Fueling North America's Transportation Future
12
Oil Shale Development Poses Serious Environmental and Social Risks
OIL SHALE ExTRACTION CLOGS AIR WITH TOxIC POLLUTANTSMining oil shale will release harmful pollutants into the air, including sulfur dioxide (SO2), particulates, carbon monoxide (CO), ozone (O3), lead, and nitrogen oxides (NOx), as well as pollutants such as silica, sulfur compounds, metals, carbon dioxide (CO2), ammonia (NH3), trace organics, and trace elements. These pollutants can increase asthma and emphysema, cause mercury poisoning, and even lead to premature death. The Bureau of Land Management’s own analysis concluded that oil shale research projects near the Flat Top Wilderness in Colorado would impair visibility there by more than 10 percent for several weeks each year, with significant effects on air quality.107
These wildlands near Parachute, Colorado, could be replaced with an enormous complex of huge pollution-spewing power plants unless Congress acts to protect the American West from risky oil shale development. ©Alamy.
ENERGy-HUNGRy OIL SHALE HAS DIRE GLOBAL WARMING IMPLICATIONSProducing oil from shale takes an enormous amount of energy and causes the emission of higher amounts of global warming pollution than conventional oil development. The RAND Corporation in 2005 found that the production of just 100,000 barrels of shale oil a day using Shell’s proposed in-situ process would require 1,200 megawatts of power.108 Development of this scale would call for construction of a power plant as large as any in Colorado history, large enough to serve a city of 500,000 people. Such a plant would consume 5 million tons of coal
each year, requiring construction of new coal mines that would devastate wildlife habitat and create huge scars on the landscape (see chapter 4 for more details). The power plant required for producing 100,000 barrels of shale oil a day—a very small industry—would also emit 10 million tons of global warming pollution.109 Oil shale boosters like to talk about producing 1 million barrels of shale oil a day, which would require construction of 10 new power plants that could generate up to 121 million tons of CO2 per year. This would represent a 90 percent increase in the CO2 emitted by all existing electric utility generating units in 2005 in Colorado, Wyoming, and Utah combined.110 Added to this horrific amount of global warming pollution is the CO2 that would result from actually burning the produced shale oil.
OIL SHALE DRAINS AND POLLUTES SCARCE WATER RESOURCES IN THE WESTWater resources of the western United States are already stressed as never before, likely in part due to increased demand from widespread population growth in western cities and reduced availability due to global warming. The scarcity of water in the American West makes it a valuable resource, and oil shale development threatens to cut into water availability even more. Each barrel of shale oil produced using the mine-and-retort process will likely use from 2.1 to 5.2 barrels of water.111 In 1996, the Bureau of Land Management (BLM) found that oil shale development would result in up to an 8.2 percent reduction in the annual flow of Colorado’s White River where it meets the Green River in northeastern Utah.112
Oil shale development is likely to harm not just the quantity of water in the West but also the quality. Mine drainage and discharge from the extraction process could seep into the water supply. Salinity is undoubtedly a looming issue, both because water withdrawals increase salinity concentrations and because the salt content of freshly processed shale is significantly higher than that of raw shale. Whether backfilled into a mine or stored in surface pits, runoff from spent shale waste will make its way into both underground and surface water flows. Concerns about salinity also exist for in-situ methods.113 Retort waters are likely to have high concentrations of soluble organic materials, along with very high concentrations of ammonia nitrogen, alkalinity, chlorides, and sulfates.114 Past studies have also found that in-situ production processes could leak contaminated water into adjacent aquifers and surface water.115

Driving It Home: Choosing the Right Path for Fueling North America's Transportation Future
13
Increases in salinity from oil shale would destroy habitat for native and endangered fish in the Lower Colorado and Green Rivers and cost agricultural, municipal, and industrial users millions of dollars by harming crops and corroding water infrastructure.116 According to the U.S. Bureau of Reclamation, the U.S. portion of the Colorado River Basin is already hit with damages between $500 million and $750 million annually from elevated salinity.117
FISH AND WILDLIFE HABITAT WILL BE DAMAGED OR LOSTOil shale leasing and development activities could have significant negative impacts on fish and wildlife. The wells, pipelines, roads, housing facilities, pump stations, refining facilities, and waste-disposal areas needed for extraction will displace an impressive array of wildlife, including long-eared owls, short-horned lizards, elk, and bald eagles. Other species recognized by the BLM as under threat from oil shale development include mule deer, blue grouse, and sage grouse.
The decreases in water flows from an oil shale industry would also significantly affect the fisheries of the Colorado River System—causing, among other things, “the permanent loss or severe degradation of nearly 50 percent of BLM stream fisheries.”118 Surface disturbance, water diversions, base flow reductions, and long-term aquifer disruption from oil shale are likely to result in the loss of 35 percent of Colorado River cutthroat trout fisheries.119
ExTRACTION WILL CHANGE HOW WE ENJOy OUR WESTERN LANDSAreas of the West containing oil shale are already seeing the effects of a boom in conventional oil and gas activities, as lands historically enjoyed for hunting or recreation fall prey to oil development. A large-scale oil shale operation will dramatically add to these impacts.
Surface mining and retorting generate huge quantities of waste: An industry producing just 100,000 barrels of shale oil a day would require disposal of up to 150,000 tons of waste rock each day, or about 55 million tons per year—resulting in large, permanent scars across the landscape.
While likely to avoid large material waste stockpiles, the drilling and support operations of in-situ mining will cause a decade-long displacement of all other land uses in these areas. Tourism accounts for about 10 percent of
the jobs in Rio Blanco County and the Piceance Basin, and elk hunting is the most lucrative recreation activity in northwestern Colorado.120 Wilderness hunting is simply not possible at in-situ areas. The landscape will be dotted with 15 to 25 heating holes per acre, in addition to the wells needed for recovery of the produced oil and natural gas and those necessary to construct and maintain the freeze wall.121
Significant new infrastructure would accompany any oil shale extraction operation. Surface facilities would be needed to upgrade, store, and transport produced shale oil or natural gas. Roads, power plants, power distribution systems, pipelines, water storage and supply facilities, construction staging areas, hazardous materials handling facilities, and myriad buildings (residential, commercial, and industrial) would impose additional serious demands on the local landscape. And the coal mining required to produce the coal that will run the power plants will have major additional impacts.122
Bush Administration Races to Tap Untested Oil Shale TechnologyThough local residents remember well the last time oil shale went bust in the 1980s, the federal government nonetheless set in motion a process that could lead to large-scale commercial leasing in the Energy Policy Act of 2005.123 The Act directed the BLM to analyze the regional environmental, economic, and social impacts of commercial oil shale, even though the technologies and their associated impacts cannot yet be known. It also directed the BLM to adopt regulations establishing a commercial leasing program for federal oil shale and tar sands resources. These regulations will address issues such as royalty rates, diligent-development requirements, and bonus bids for commercial leases. Finally, the Act gave the BLM the authority to hold a first-ever commercial lease sale for these vast resources, so long as such a sale is supported by state and local governments and other stakeholders.
The EPAct set an exceedingly ambitious timeline for these activities: The BLM has gone on record saying that it plans to be able to offer commercial oil shale leases in 2008. Activities on research and development (R&D) leases will have barely begun by then, however, and even the companies holding the R&D leases have acknowledged

Driving It Home: Choosing the Right Path for Fueling North America's Transportation Future
14
uncertainty as to the viability of their proposed processes—economically, environmentally, and socially.124
What we do not know about a modern oil shale industry far outweighs what we do know at this point. A wiser course for the BLM would be to let companies conduct research and development activities before it holds a commercial lease sale. The public must be assured that the technology works, that it is economically viable without taxpayer subsidies, that it will comply with all existing and necessary environmental protections, and that it will not result in unacceptable impacts on the environment or western communities.
What Needs to Be Done: Stop Risky Shale Development Before It Starts Because large-scale oil shale projects have not yet commenced in the United States, we can learn from the challenges being faced in Canada with regard to tar sands. Before commercial-scale oil shale development is even contemplated, exactingly thorough and transparent R&D based on the best available science must be completed. Based on what we do know now, however, it appears that the oil to be wrung from shale is simply not worth its high environmental and social costs.
Oil shale development is still so unproven that it makes little sense to move forward. However, with the potential oil payoff from oil shale so high, we accept that there will be those in government and industry who seek to make it happen. But at a minimum, before any further steps are taken that could lead to widespread commercial leasing, regulators and the public alike must know that development can take place safely, without fouling air quality or harming valuable water resources. If it is to occur, shale development must happen at a scale and grow at a rate that allows local communities to provide for the changing needs of their citizens. Once a viable technology exists, once all the costs of development, both intrinsic and extrinsic, are known, and once society has determined it is willing to bear those costs, only then might it be appropriate to open oil shale lands to a competitive bid process for commercial development. But not before.

15
Converting Coal Into Global Warming Pollution at the PumpThe primary way that coal can be converted into a petroleum-like product is by breaking it down into basic molecules that can be reassembled to form a liquid fuel. This process requires a lot of energy—energy that is likely to come mostly, if not entirely, from burning coal—and large amounts of water in regions with scarce water resources. The damaging impacts of liquid coal would be widespread, from the local community around the mine to the health of our global climate.
Coal is the highest-carbon fossil fuel, so making fuel from coal guarantees additional emissions of heat-trapping carbon dioxide (CO2) compared with traditional petroleum refining. Unlike making electricity with coal, liquid coal results in CO2 emissions not only at the production stage, but also at the end-use stage, as when used as fuel in cars. Liquid coal therefore results in a double-hit of carbon emissions, first from production
and then from the tailpipe. The additional coal burning required for such a liquid coal industry would result in more of the damaging impacts of mining and transport on our land, water, and air quality.125 Yet despite the pollution involved, the race to develop liquid coal has already begun.
Coal mining operations have devastating effects on communities and ecosystems stretching from Appalachia to the Rocky Mountains.
CHAPTER 4
Liquid Coal: A “Clean Fuel” Mirage
The coal industry is touting a plan to transform millions of tons of coal into
diesel and other liquid fuels using an expensive, inefficient process that
releases large quantities of heat-trapping carbon dioxide into our air. The
economic, social, and environmental drawbacks of liquid coal are significant: Relying
on liquid coal as an alternative fuel could nearly double global warming pollution
per gallon of transportation fuel and increase the harmful effects of coal mining on
communities and ecosystems from Appalachia to the Rocky Mountains. Liquid coal
is not the clean transportation fuel of the future but a dirty and costly industry of the
past. America has better options.

Driving It Home: Choosing the Right Path for Fueling North America's Transportation Future
16
Although no liquid coal fuel is sold in the United States today, the Department of Defense (DOD) is actively developing liquid coal fuels for military use. The DOD has plans to use liquid coal to supply 70 percent of its aviation fuel by 2025.126 To do so, liquid coal proponents have teamed up with the DOD in lobbying Congress to authorize 25-year long-term, fixed-price contracts that would guarantee a market for liquid coal fuels. At the same time, a number of coal states, including Pennsylvania, Montana, and West Virginia, are surging forward with proposals to build new plants to supply liquid coal fuels for commercial use. To finance these costly plants, an industry coalition is pushing Congress to provide a suite of taxpayer subsidies, including price floors, tax credits and research funds, to build some, if not all, of the nine liquid coal plants currently proposed in the United States. Building just a few publicly financed plants, however, would give way to a much larger liquid industry in the United States.
The Damaging Legacy of king Coal: Impacts on Our Health, Land, and WaterWhile coal is relatively cheap and abundant as a raw material compared with crude oil, the true costs of coal extraction and use are very dear: underground accidents; landscapes destroyed by mountaintop removal and scarred by strip mining; air emissions of acidic, toxic, and heat-trapping pollution from coal combustion; and water pollution from coal mining and combustion wastes, to name a few. These damaging impacts from the conventional coal fuel cycle would only increase if we allow large-scale production of liquid coal fuels.
COAL MINING HARMS MOUNTAINS AND FORESTSCoal mining—and particularly surface or strip mining—poses one of the most significant threats to terrestrial habitats in the United States. The Appalachian region, for example, which produces more than 35 percent of our nation’s coal, is one of the most biologically diverse forested regions in the country.127,128 But surface mining clearcuts trees and fragments habitat, destroying natural areas that were home to hundreds of unique species of plants, invertebrates, salamanders, mussels, and fishes. The destruction of forested habitat not only degrades the quality of the natural environment but also destroys the aesthetic values that make the Appalachian region such a popular tourist destination. An estimated 1 million acres of West Virginia mountains were subject to strip mining or mountaintop removal mining between 1939 and 2005.129 Many of these mines have yet to be reclaimed; where forested mountains once stood, there now stand mounds of sand and gravel.
The terrestrial impacts of coal mining in the Appalachian region are thus considerable. In the West, as in the east, surface mining activities severely damage the landscape as huge machines strip and scrape aside vegetation, soil, and wildlife habitat and adversely impact existing lands and the affected area’s ecology.130 Strip mining results in industrialization of once-quiet open space along with displacement of wildlife, increased soil erosion, loss of recreational opportunities, degradation of wilderness values, and destruction of scenic beauty.131 And reclamation can be problematic both because of climate and soil quality. Reclamation of surface mined areas, where it does happen, does not necessarily restore pre-mining wildlife habitat and may require scarce water resources be used for irrigation.132 Forty-six western national parks are located within 10 miles of an identified coal basin, and these parks could be significantly affected by future surface mining in the region.133
ABUSIvE MINING TECHNIqUES SCAR THE LAND AND DEGRADE HABITATS The most significant physical effect on water occurs from valley fills, the method of disposing of waste rock associated with mountaintop removal mining in Appalachia. Since the early 1970s, more than 700 miles of streams in the east have been buried by waste rock, and 1,200 additional miles have been directly harmed through sedimentation or chemical alteration.134 Valley fills also
Destructive mountaintop removal mining not only scars the landscape but also dumps mining waste into the headwaters of local streams. ©Photo by Vivian Stockman / www.ohvec.org. Flyover courtesy SouthWings.

Driving It Home: Choosing the Right Path for Fueling North America's Transportation Future
17
bury the headwaters of streams, which support diverse and unique habitats and regulate nutrients, water quality, and flow quantity. The elimination of headwaters therefore has long-reaching impacts many miles downstream.135 Together, the waterways harmed by valley fills are about 80 percent as long as the Mississippi River.
Acid mine drainage is the most significant form of chemical pollution that can be produced from coal mining operations. In both underground and surface mining, sulfur-bearing minerals common in coal mining areas are brought up to the surface in waste rock. When these minerals come in contact with precipitation and groundwater, an acidic leachate is formed. This leachate picks up heavy metals and carries these toxins into streams or groundwater. Waters affected by acid mine drainage often exhibit increased levels of sulfate, total dissolved solids, calcium, selenium, magnesium, manganese, conductivity, acidity, sodium, nitrate, and nitrite. This drastically changes stream and groundwater chemistry; the degraded water becomes less habitable, non-potable, and unfit for recreational purposes.136 The acidity and metals can also corrode structures such as culverts and bridges.137 In the eastern United States, an estimated 4,000 to 11,000 miles of streams have been polluted by acid mine drainage. In the West, estimates put the damage at 5,000 to 10,000 miles of streams.138
COAL MINING AND TRANSPORT INCREASE AIR POLLUTIONThe mining of coal also produces heat-trapping emissions and particulates. There are two main sources of air pollution during the coal production process. The first is methane, a powerful heat-trapping gas that is the most substantial contributor to global warming after carbon dioxide. Methane emissions from coal mines account for 10 percent to 15 percent of global warming pollution in the United States. According to the most recent official inventory of U.S. global warming emissions, coal mining results in the release of 3 million metric tons of methane per year, which is equivalent to 68 million metric tons of carbon dioxide.139 The second significant form of air pollution from coal mining is particulate matter (PM) emissions. PM can cause serious respiratory damage and even premature death.140
Finally, the transport of coal from where it is mined to where it will be burned also produces significant
quantities of air pollution and other environmental harms. Diesel-burning trucks, trains, and barges that transport coal release NOx, SOx, PM, VOCs (volatile organic compounds), CO, and CO2 into the earth’s atmosphere. Trucks and trains transporting coal release more than 600,000 tons of NOx and more than 50,000 tons of PM10 into the air annually.141, 142 In addition to causing serious health risks, black carbon from diesel combustion is another contributor to global warming.143
Liquid Coal: A “Clean Fuel” MirageReplacing oil with liquid coal would impact our carbon footprint for many decades to come. By industry’s own estimates, displacing just 10 percent of our total oil demand with liquid coal fuels would require a 42 percent increase of coal mining in the United States—an additional 475 million tons a year. Given the limited capacity of liquid coal plants being considered today, building a large-scale liquid coal industry would require the construction of hundreds of new emissions-spewing coal plants in communities across the country. These plants, like conventional coal plants, would have a lifetime of 50 to 60 years, adding substantially to the pollution burden of future generations.
The global warming pollution burden of a liquid coal industry would pose a serious threat to our ability to achieve the 80 percent reduction in heat-trapping emissions that scientists advise is necessary to prevent catastrophic global warming. Over the full well-to-wheels production cycle, liquid coal fuel results in about 50 pounds of CO2 emissions per gallon—nearly double the emissions from crude oil production—assuming the CO2 emissions are released into the atmosphere.144 A doubling of CO2 emissions in the fuel system compared with gasoline today means that running a hybrid vehicle on liquid coal fuels would result in as much pollution on a lifecycle basis as running a Hummer on gasoline.
This is a reasonable assumption, as there is currently no obligation for permanent carbon capture and disposal (see sidebar on page 18) at the production stage and it would
Running a hybrid vehicle on liquid coal fuels would result in as much pollution on a lifecycle basis as running a Hummer on gasoline.

Driving It Home: Choosing the Right Path for Fueling North America's Transportation Future
1�
require additional upfront capital investment that the liquid coal industry is unlikely to make in the absence of limits on global warming pollution. None of the legislation currently before Congress to subsidize liquid coal production includes any requirement to reduce emissions or perform carbon capture and disposal.
CARBON CAPTURE AND DISPOSAL
While energy efficiency and renewable energy are the best options for a clean energy future, there is still a push for fossil fuels. Carbon capture and disposal (CCD) is a technology that is emerging quickly as a feasible option for reducing global warming pollution even as coal continues to play a role in our energy system. The purpose of CCD is to sequester carbon dioxide in geological formations for hundreds or thousands of years, taking CO2 pollution released during production of electricity or fuels and disposing of it permanently underground instead of releasing it in the atmosphere. The feasibility of CCD is currently being explored and evaluated on international, federal, and regional levels, including in the United States. However, this technology is unlikely to be adopted absent policies and incentives that limit global warming pollution. In the case of liquid coal fuels, however, even this technology cannot make this an attractive alternative to the fuels we use today.
The U.S. EPA found that even if carbon capture and disposal technology is used to permanently capture and store 85 percent of the emissions at the production stage, liquid coal fuel would still result in 4 percent more well-to-wheels CO2 emissions compared with gasoline. And an additional analysis conducted by the Department of Energy has shown that well-to-wheel liquid coal emissions with 85 percent carbon capture and storage could be as much as 19 to 25 percent higher than conventional gasoline/diesel.145 That’s because some emissions will escape at the production end and additional CO2 will be emitted at the tailpipe that cannot be captured. No matter how you do the math, liquid coal does not add up to the sustainably made, low-carbon fuel that we will need in order to solve global warming and protect the health of our lands, air, and water. In fact, we can easily achieve the level of oil savings liquid coal proponents are promising, and more, by simply improving the fuel economy of our cars and trucks.
Given the large upfront costs of this industry, Wall Street has not moved quickly to embrace liquid coal. To sweeten the deal, industry is lobbying for substantial new tax breaks, loan-guarantees, grants, price floors, and long-term purchasing commitments to build a new generation of liquid coal plants to supply fuel for military and commercial use. Proposals are being floated in the U.S. Congress that would provide billions of dollars of public financing for liquid coal projects, with no strings attached that would make sure the industry does not worsen our global warming and other pollution problems.146
Liquid coal plants, like many coal-related infrastructure projects, are capital intensive. The Massachusetts Institute of Technology estimates the production costs of liquid coal to be approximately $50 dollars a barrel.147 It may be a bargain on paper, but these economics do not sufficiently capture the upfront capital costs of construction, the risks associated with long lead times, the enormous environmental costs of liquid coal production, or the industry’s competitiveness under future economy-wide limits on global warming pollution. It’s a bad deal for the environment and for taxpayers, and it would siphon off funding needed for efficiency, renewables, and other low-carbon technologies that can do both: reduce our dependence on oil and solve global warming.
What Needs To Be Done: Cease Development of Liquid CoalUsing liquid coal to produce a significant amount of transportation fuel would harm communities and the environment in coal-producing regions, as well as exacerbate global warming pollution nationwide. The considerable economic, social, and environmental drawbacks of liquid coal preclude it from being a sound alternative fuel option. Therefore, the United States should not launch a liquid coal industry, and private capital and public investment should not be wasted on a dirty technology of the past that is not compatible with solving global warming and creating a truly clean and secure energy future.

19
Many investors, banks, and insurance institutions are already concerned about the financial cost of environmental liabilities associated with dirty unconventional sources of liquid fuel, particularly the global warming pollution impacts. A growing number of investment institutions are evaluating companies’ competitiveness on the basis of their global warming pollution. With the United States moving toward a regulatory framework for capping these emissions, the investment community is increasingly recognizing that we are headed toward a carbon-constrained global economy. For business, this means that potential investors and purchasers should view global warming pollution emissions as a “carbon liability.” Likewise, taxpayers should not be asked to put money on the line for fuel industries that fail to deliver global warming solutions and environmental benefits.
High oil prices have piqued investor interest in unconventional fossil fuels. However, investors are looking for insurance against oil price volatility and market uncertainty before they sink investment into a capital-
intensive industry. To that end, proponents of tar sands, oil shale, and liquid coal fuels are lobbying Congress for a suite of financial incentives to make these unconventional fuels more attractive to investors. Investors and taxpayers should be wary of such a proposition, since it fails to take into account future obligations to reduce global warming pollution and other substantial environmental and social costs. Instead, investors and taxpayers should look toward technologies that can be viable in a market that will increasingly value low-carbon technologies and better environmental performance.
Taxpayers Are Footing the Bill for Unsavory Oil DealsThe tar sands, oil shale, and liquid coal industries all require significant long-term capital investments. In recent years, capital expenditures in tar sands projects have increased substantially, and expenditures to construct all announced projects between 2006 and 2015 are estimated at a total of about C$125 billion.148
CHAPTER 5
The Investment Landscape: Dirty Fuels Are Risky Business
Oil companies, coal producers, and influential members of the U.S. and
Canadian governments are active champions of tar sands, oil shale,
and liquid coal, trying to make them seem like good candidates for the
significant long-term capital investments they each require. But the first question that
investors and taxpayers should ask is: Would the money be better spent on fuels that
lead us away from our dependence on fossil fuels and global warming pollution? The
answer is yes.

Driving It Home: Choosing the Right Path for Fueling North America's Transportation Future
20
While reliable numbers for the cost of a contemporary oil shale plant have yet to be determined, past experience shows that such plants do not come cheap. For example, when Exxon shuttered its Colony Oil Shale project in 1982, the projected cost was about $6 billion, or about $12.8 billion in today’s dollars.149
While there are no commercial-scale liquid coal plants in the United States today, the U.S. Department of Energy estimates that building a liquid coal plant that could supply 100,000 barrels per day would cost $7 billion dollars.150 None of these estimates, however, include the cost of emissions-control technology, environmental mitigation, or the potential run-up in the price of coal and transport that would result from large-scale liquid coal production.
BLACk SUNDAy: OIL SHALE'S vULNERABILITy TO PRICE vOLATILITy
In the late 1970s, oil shale development was to be another Manhattan Project, a huge national effort to meet the country’s rising liquid fuel needs and help make the United States less dependent on crude oil. In reaction to the Arab oil embargoes and a national oil shortage, the federal government set up the Synfuels Corporation to offer up to $17.5 billion in loan, price, and purchase guarantees to firms developing oil shale plants.151 Despite the promise, the high costs of the new technology and plant design coupled with declining world oil prices led Exxon and the Tosco Corporation to close their half-built Colony Oil Shale plant and abandon the project on May 2, 1982—known to this day as “Black Sunday” throughout Colorado.
Common to tar sands, oil shale, and liquid coal is the need for subsidies and incentives to jump-start the capital-intensive industry. In many cases, these initial subsidies turn into entitlements for mature industries that cost taxpayers billions. The tar sands industry in Canada is one such example. Today, tar sands companies continue to receive significant incentives that were first put in place in the mid-1990s, including research and development support and favorable tax and royalty systems. These incentives have remained in place despite the fact that the industry has achieved economic viability. For example, under the existing royalty structure, tar sands companies in Alberta pay only 1 percent of revenues after operating costs until a project’s capital costs are paid out, after
which royalties increase to 25 percent of net revenue.152 Even though tar sands production has continuously risen since 1996, Alberta’s share of the total oil and gas royalties has fallen—shortchanging Albertans, the owners of this resource.153 Between 1996 and 2005, tar sands royalties as a share of total royalties to Alberta declined by 35 percent.154 Once production is well under way, as is the case with Canadian tar sands, investors and nearby communities face the revenue consequences of government royalty, tax, and subsidy systems put in place to get the industry started. A recent poll revealed growing public discontent with the royalty regime. In fact, 63 percent of Albertans feel they are not getting maximum revenue from tar sands developments, and 84 percent of Albertans support a public review of the royalty regime.155 The Alberta government is starting a review of its royalty regime, and the Canadian federal government is phasing out its tar sands tax break by 2015.
In the United States, while developers of conventional federal oil and gas resources typically pay a 12.5 percent royalty, it is uncertain whether the federal government will impose a similar levy on development of federal oil shale resources. Royalty rates are among the items to be addressed in commercial-leasing regulations called for in the Energy Policy Act and set to be completed in 2008.156 Industry has already advocated for economic terms that would be exceedingly favorable to development of oil shale, including substantial subsidies. In testimony to the Senate Energy and Natural Resources Committee in June 2006, the representative of a company involved in developing unconventional sources of liquid fuel asked for federal loan guarantees, a $100-million federal grant or non-recourse loan program, investment tax credits, an excise tax credit, and mandatory inclusion of unconventional sources of liquid fuel in the Strategic Petroleum Reserve storage facilities.157 Various legislative provisions that would have codified reduced royalties—or would have instructed the adoption of a royalty regime similar to the one in place for Canadian tar sands—were considered and rejected by Congress in 2006.158
With regard to liquid coal, investor analysts are questioning the economic sense of bankrolling a new start-up industry for liquid coal when large energy companies are best suited for such investments. In evaluating liquid coal, the Stanford Policy Research Group has noted that major oil companies such as Shell and Conoco-Phillips are most able, in terms of capital, experience, and

Driving It Home: Choosing the Right Path for Fueling North America's Transportation Future
21
technology, to finance liquid coal construction. However, these companies are not investing in liquid coal and have invested in only limited production of cleaner and cheaper natural gas-to-liquids. This is a telling sign. Proceeding with liquid coal plants now could leave investments stranded or impose unnecessarily high abatement costs on the economy when a regulatory framework for capping global warming pollution is put in place. Taxpayers should not be asked to foot the bill to help a mature coal industry to develop a questionable fuel that does not have a future in solving global warming, cannot provide a clean fuel alternative, and does not even attract oil industry investment.
Global Warming: Market Concern Is Heating UpThe critical question now facing investors is whether any of these high-carbon, high-capital-cost fossil fuels can be competitive in a carbon-constrained market. The United States is likely to adopt a regulatory framework that will cap global warming pollution in the near future; in fact, many states have moved forward with mandatory limits on emissions. In addition to an economy-wide cap on emissions, fuel providers may face additional standards on fuels that would require lower carbon content over time and more environmentally sustainable production practices. Canada, Europe, and other parts of the world are moving forward with capping global warming pollution.
Tar sands, oil shale, and liquid coal all result in higher global warming pollution than our conventional crude oil system does today. In Canada, tar sands production is the single largest contributor to global warming pollution growth and is expected to reach approximately 11 percent of Canada’s annual average Kyoto target emissions by 2012.159 Investors must take into consideration future global warming obligations and the competitiveness of alternatives under such obligations in evaluating the revenue and market share potential of unconventional sources of liquid fuel. Proponents of liquid coal, especially, have failed to provide an accurate account of the industry’s global warming pollution impacts and have yet to incorporate the cost of carbon emissions control strategies into their profit proposition.
There is already a growing concern in the marketplace, including the investment, banking, and insurance sectors, that global warming liabilities will outstrip investment
benefits. Evidence of investor interest can be seen in shareholder advocacy. For example, a 2003 shareholder resolution called on PetroCanada, a company active in developing tar sands, to detail the range of potential financial liability associated with global warming pollution and its strategy to reduce this liability, and a 2004 shareholder resolution called on PetroCanada to report on specific emission reduction initiatives undertaken by the company to address risks and liabilities arising from climate change.160 Socially responsible investment companies regularly provide information to investors about issues such as global warming—and some are going further by trying to set benchmarks for good industry practices, as seen in a 2007 Ethical Funds report analyzing Canadian tar sands companies.161
Banks are also starting to address the fiscal impacts of global warming, with JPMorgan Chase, Bank of America, HSBC, and others encouraging their clients to address global warming through mechanisms such as carbon mitigation plans and carbon reporting.162, 163, 164 These banks are also adopting climate policies aimed at reducing energy use and CO2 emissions. In December 2004, HSBC was the first major bank to make a commitment to become carbon neutral by 2006—a goal it achieved in September 2005.165 In November 2005, Goldman Sachs established an environmental policy framework that addresses how markets are an important player in responding to environmental challenges, including climate change.166 More recently, Citigroup announced a commitment to reduce global warming pollution emissions by 10 percent by 2011.167
Several insurance providers, including Swiss Re, Allianz, Lloyds, and AIG, have also made commitments to establish a framework for clean energy and climate change action. In February 2007, Allianz and Lloyd’s signed a statement from a range of sectors including insurance, investment, utilities, and car manufacturers, calling on governments to provide targets for global warming pollution and carbon dioxide emissions, a price on carbon emissions, and policies aimed at addressing energy efficiency and carbon reduction.168
Along with potential investors, markets for fuels are changing with growing concern about global warming pollution. While European countries are making commitments to reduce global warming pollution and increase dependence on renewable energy and

Driving It Home: Choosing the Right Path for Fueling North America's Transportation Future
22
environmentally sustainable fuels, the newest trend can be seen in California, which is committed to mandatory limits on global warming pollution and regulations that take into account the full lifecycle emissions of fuel extraction and production.169 On January 18, 2007, the California governor proposed the world’s first low-carbon fuel standard (LCFS), which will require fuel providers (defined as refiners, importers, and blends of motor fuels) to decrease the average carbon content of their fuel mix by 10 percent by 2020.170 This technology-neutral, long-term obligation is expected to provide a powerful market signal to investors and energy companies to transition away from high-carbon fuel alternatives, such as tar sands, oil shale, and liquid coal, and toward low-carbon sustainable fuels.
Liabilities of Unconventional Oil Make Investments a Losing PropositionInvestors betting on tar sands, oil shale, or liquid coal should evaluate viability and competitiveness in terms of potential energy, environment, and social liabilities—factors that are not fully accounted for or accurately disclosed by industry.
Uncertain energy costs. Tar sands, oil shale, and liquid coal are energy-hungry industries. An added economic uncertainty for investors is how and at what cost to the economy, environment, and society these industries will acquire the energy they need over the long term. The tar sands industry currently consumes approximately 0.6 billion cubic feet of natural gas per day—its main energy source. As natural gas prices have risen, the energy-intensive tar sands industry has started looking for alternative energy sources, including nuclear and coal. The high energy demands of processing oil shale create similar challenges. The Rand Corporation estimated that it will likely take as much as $3 billion to build the power plant that will be necessary just to produce 100,000 barrels of shale oil—literally a drop in the bucket of domestic energy demands. Whatever the energy demands, they will not come cheap, and potential future limits on global warming pollution will make these unconventional sources of liquid fuel yet more expensive to produce.
Environmental liabilities. Environmental constraints on tar sands oil, shale oil, and coal extraction and processing include availability and quality of water,
waste management, impacts on wildlife and habitat, and ecosystem remediation. Discussions in earlier sections of this report show that there are numerous uncertainties concerning future environmental liabilities linked to development of these unconventional sources of liquid fuel—and most of these uncertainties are not taken into account in the investment and investment return structure. And in cases where financial disclosure is required, environmental uncertainties such as land reclamation and long-term management of tailings can make reported figures inaccurate.171 For example, as of June 2006, many tar sands companies did not seem to take into account the significant environmental costs of extracting oil from the tar sands.172 This can mean unexpected additional costs and delays for companies, as was the case in May 2006 when the Alberta tar sand mining conglomerate Syncrude was forced to suspend its C$7.63 billion Stage 3 expansion due to an order by Alberta Environment to curb odorous emissions.173
Aboriginal community rights. Where coal, oil shale, or tar sands oil development overlap with traditional lands of Aboriginal communities, companies can find themselves at odds with community rights and needs. For example, in the Canadian tar sands, in November 2006, the Federal Court of Canada ruled in favor of a northern Alberta First Nation, agreeing that they had not been properly consulted on the multibillion-dollar Mackenzie Gas Pipeline Project that will help fuel Alberta’s tar sands oil development.174 The court held that the federal government had failed to consult the Dene Tha’ First Nation on the proposed project, which would have serious effects on their land. This decision caused the pipeline approval process to be delayed.
In the United States, Congress recognized the important role that Indian tribes and state and federal governments should play with regard to oil shale development. The Energy Policy Act of 2005 contained a unique provision calling on federal-agency consultation with these parties to “determine the level of support and interest in… the development of tar sands and oil shale resources.”175 The Energy Policy Act takes into account the legacy of past oil shale busts and the fact that tribal, state, and local governments should be entitled to opt out of commercial leasing if they deem the resulting development to be sufficiently inconsistent with public sentiment and local policies.

Driving It Home: Choosing the Right Path for Fueling North America's Transportation Future
23
Other community constraints. The rapid pace of development that tends to accompany new oil booms such as tar sands and oil shale brings with it many socio-economic demands on local communities, such as infrastructure and labor, which can derail investments. In the case of oil shale, some local community members are calling for the early establishment of a trust fund to provide financial support to communities affected by development.176 In 2006, the high cost of infrastructure, growing environmental concerns, and the high price of inputs in Alberta’s tar sands region led to several companies putting off their tar sands projects. For example, in August 2006, France’s Total SA pushed its proposed tar sands project back three years due to increasing costs for labor and materials.177 Similarly, in October 2006, PetroCanada announced that it was pushing back the decision to proceed with its tar sands mining project, which could cost as much as C$19 billion, based on industry trends.178 Energy analysts have found that capital costs for Canadian tar sands projects have increased by up to 55 percent since the beginning of 2005, due to, among other things, labor shortages and rising material costs.179
Recommendations for InvestorsThe investment community can play a critical role in steering the development of clean, sustainably made transportation fuels that will be competitive in a carbon-constrained marketplace. To that end, transparency about a company’s financial and market-share risk under foreseeable future environmental regulations, including limits on global warming pollution, is critical for investors to fully evaluate risks and make well-informed decisions. At present, the tar sands, oil shale, and liquid coal industries are failing to disclose such risks and relying on uncertain taxpayer subsidies as an essential element of their business value proposition. Therefore, investors should:(1) demand transparency regarding the full financial risks
associated with the environmental and social liabilities of unconventional sources of liquid fuel;
(2) cost-out and assign a financial value for the short- and long-term environmental risks of unconventional sources of liquid fuel, including the cost of emissions-control technology, and require companies to articulate strategies for mitigating these risks; and
(3) consider the competitiveness of unconventional sources of liquid fuel in a carbon-constrained market and actively evaluate fuel technologies based on their potential to meet low-carbon fuel obligations.

24
Set the Bar for Substitute FuelsThe first steps that must be taken establish policies that put us on a path of de-carbonization of our transportation fuels, effectively erecting a “Wrong Way” sign in front of ill-considered policies and practices while spurring commercialization of cleaner fuels.
Developing low-carbon fuels is essential as we move down the clean path toward a secure energy future. Several steps need to be taken to ensure that low-carbon fuels such as ethanol and electricity penetrate the transportation fuel market and replace petroleum-based fuels, assuming that these low-carbon choices are also environmentally sustainable in terms of air, water, lands, and health. Several policy and transportation-industry changes can drive this reform.
POLICyMAkERS SHOULD REFORM THE ExISTING RENEWABLE FUEL STANDARD AND ENACT A NEW LOW-CARBON FUEL STANDARDTo further encourage the use of biofuels, the federal government should enhance the renewable fuel standard, increasing production requirements as well as the production of next-generation biofuels, especially cellulosic ethanol.180 As described by the WorldWatch Institute as well as various NRDC publications, ethanol processed from the cellulose of plants is an emerging technology that in theory offers tremendous energy and environmental benefits over conventional corn ethanol.181
In early 2007, Governor Schwarzenegger and the state of California set the example by adopting a first-of-its-kind “low-carbon fuel standard”(LCFS).182 Transcending debates over which fuels should receive subsidies or be barred from the fuel mix, the standard is based on full-fuel-cycle emissions of heat-trapping carbon dioxide, the most voluminous of global warming pollutants.
CHAPTER 6
The Clean Path for Transportation
There is a better, cleaner path forward for transportation, one that does not
bind us to the many costs and consequences of dirty unconventional fuel
sources. We can get on that cleaner path by moderating demand, using our
energy resources more efficiently, and commercializing cleaner, more environmentally
responsible transportation fuels and technologies. We already know what needs to
be done. With swift action across multiple sectors—from oil companies to investors
to automobile manufacturers to government policymakers—we can move toward
a more secure energy future. The following recommendations, targeted to specific
participants, can help put North America on a clean energy path.

Driving It Home: Choosing the Right Path for Fueling North America's Transportation Future
25
From this starting point, the LCFS order applies a uniform standard to all refiners, producers, and importers of fuel: reducing overall carbon intensity by 10 percent by 2020. This ambitious yet achievable goal avoids picking specific winners (or losers) among fuels, opening the playing field to other potential fuel entrants like biobutanol, an alternative currently being piloted in the United Kingdom by a partnership between BP and DuPont.183
Other states and the federal government should move quickly to adopt similar standards. Doing so will ensure that we move beyond oil by de-carbonizing our transportation fuel sources, enhancing our energy security while also reducing heat-trapping pollution.
POLICyMAkERS SHOULD CREATE AND ENACT A REASONABLE SUSTAINABILITy STANDARD TO REDUCE UNINTENDED ENvIRONMENTAL EFFECTS FROM INCREASING BIOFUELS PRODUCTIONWhile biofuel technologies hold great promise in reducing heat-trapping pollution, it is equally important that the EPA ensure that the production and use of biofuels do not degrade our air, soil, and water quality; threaten sensitive wildlife habitat; or negatively affect public health. Realizing the benefits of biofuels will require close attention to details of crop cultivation and fuel production, as described by an NRDC expert in testimony before the Senate Energy and Natural Resources Committee:
[C]onsider a cellulosic ethanol plant. While such plants are often considered to be environmentally superior to corn ethanol plants, this is not necessarily the case, depending on how the cellulosic feedstock is produced. For example, if the biomass for the cellulosic ethanol plant is obtained by converting to biomass production land that had been enrolled in the conservation reserve program (CRP), then the forgone conservation benefits and carbon benefits must be accounted for. The CRP has enrolled more than 1 million acres in forest cover, including hardwoods, longleaf pine, and other softwoods. While these are secondary, rather than old growth forests, they nonetheless provide important ecological services and sequester a substantial amount of carbon. Converting such lands to biofuels production would not only rapidly return to the atmosphere the carbon sequestered since the trees were planted, but would also forgo future carbon sequestration on this land.184
Establishing standards to prevent or mitigate adverse effects on other natural resources is critical if these fuels are to deliver on their promise. If we support their deployment with the right mix of incentives and requirements to ensure that they are produced sustainably, biofuels will add a significant silver lining to high fuel price trends.
POLICyMAkERS SHOULD REqUIRE ALL vEHICLES TO BE FLExIBLE-FUELLawmakers must require that all new cars and trucks be capable of operating on biofuels or other non-petroleum-based fuels. Currently, unmodified vehicles can only use gasoline blended with 10 percent (by volume) ethanol. Higher blends of such alcohol fuels can be used only in vehicles that are designed to burn high-oxygen fuel. Such flex-fuel vehicles (FFVs) have special electronic sensors to gauge the fuel blend and hoses and pumps that resist corrosion. FFVs can run on almost any gasoline-alcohol blend, the most common being an 85 percent ethanol blend (E85). There is very little cost differential between an FFV and a regular vehicle.185
But few FFVs that are on the road today actually use high-blend ethanol fuel because E85 is available in only a few locations and is typically more expensive than gasoline. With dedicated funding and research, however, these costs are coming down. Cellulosic ethanol is on the horizon and promises to substantially reduce the cost and improve the environmental performance of ethanol fuel.186
POLICyMAkERS SHOULD REqUIRE, AND HELP FINANCE, THE TRANSFORMATION OF RETAIL FUEL DELIvERy TO PROvIDE MORE FUEL OPTIONSMaking sure that vehicles have the capacity to function using high-biofuel-blend energy will make little difference if there are no pumps available. Fewer than 1 percent of the approximately 170,000 fuel retailers in the United States currently have such pumps, and those that do don’t put the pumps directly under the canopy with other products.187
Policymakers should consider two recommendations put forth in February 2007 by the “25 by ’25” coalition, a nationwide network of advocates for renewable energy, one of whose goals is 25 percent biofuels use by 2025:n Expand the existing federal tax credit for installing E85 pumps, raising the $30,000 cap to $50,000, applying it to each station that installs an E85 pump, and increasing

Driving It Home: Choosing the Right Path for Fueling North America's Transportation Future
26
the percentage that can be claimed from 30 percent to 50 percent, but phasing this change in current law out over time to reduce the fiscal impacts. n Require owners or operators of more than 10 retail filling stations to make 10 percent of their stations E85 in any area in which Flexible Fuel Vehicle registration exceeds 8 percent. The EPA should report annually on the percentage of FFVs registered in each area of the country.188
AUTOMAkERS SHOULD PROMOTE TECHNOLOGIES THAT POWER vEHICLES WITH ELECTRICITy, NOT OILAdvanced technologies continue to gain popularity, including hybrid-electric cars and trucks fueled by electricity and/or gasoline. While the market has been dominated by the Toyota Prius, an increasing number of other hybrid options are now available as automakers respond to astounding sales increases since the turn of the millennium—sales have jumped from under 10,000 in 2000 to nearly 230,000 in 2006. 189
The next generation of hybrids could be the plug-in hybrid-electric vehicle (PHEV). These vehicles allow electricity from a grid to be used as a fuel, although they can also run on gasoline; some could also be flexible-fuel-capable and can run on a blend of alcohol fuel and gasoline. But significant challenges remain before these are market-ready, including battery technology. Batteries remain expensive and have limited ranges. Despite cost savings from a smaller internal combustion engine and electrification of other vehicle components, while a hybrid-electric vehicle might cost $2,500 to $4,000 more than a similar conventional vehicle, a PHEV with a range of 20 miles would cost $4,000 to $6,000 more, and one with a range of 60 miles would cost $7,400 to $10,000 more.190
However, technological development and economies of scale would cause these costs to drop over time.
Range itself may not be a troubling issue, since 31 percent to 39 percent of annual miles driven are the “first 20 miles” of daily driving, meaning that many Americans travel no more than 20 miles per day.191 Therefore, the daily needs of many drivers would be satisfied within the batteries’ range. PHEVs would also save a great deal of fuel. One estimate, illustrated in Figure 4, found that while a conventional vehicle uses 523 gallons per year and a hybrid-electric vehicle uses 378, a PHEV with a 20-mile range would use 219. A PHEV with a 60-mile range would use a minuscule 83 gallons annually.192
Figure 4
Conventional Hybrid Plug-in (20-mile range)
Plug-in (60-mile range)
0
100
200
300
400
500
600
There are other advantages to PHEVs. They suffer less from the chicken-and-egg problems that plague hydrogen, since an electrical grid already exists.193 If charged at homes at night, they would make use of surplus, off-peak generating capacity. And as long as the grid is powered by relatively low-emission resources—such as natural gas, hydroelectric, wind, or solar—air pollution would also be reduced.194
The challenge with this technology is that surplus capacity and power sources vary among regions. Another issue is that transportation could well promote stability and efficiency in power supply, since car batteries could theoretically feed surplus electricity into the grid on a daily basis. So the power could flow both ways, benefiting both the grid and the vehicles, and a growing fleet of plug-in hybrids would supply a substantial amount of electricity.195
Deploy More Fuel-Efficient Technologies and Manage Travel Demand The cleanest, fastest, and cheapest method of reducing global warming pollution and slowing the rush toward unconventional sources of liquid fuel is more efficient use of oil. Using this resource more efficiently will extend the lifespan of conventional oil reserves—in effect flattening the oft-mentioned peak—and thereby reduce the pressure to develop unconventional fossil fuels. Efficiency would allow policymakers and the private sector time to focus on, and steer toward, longer-term technology solutions to oil dependence and global warming pollution. We can begin to ease demand by deploying efficient technologies available today, driving investment toward low-carbon fuels, and developing travel alternatives that will help consumers and businesses change habits in the marketplace.

Driving It Home: Choosing the Right Path for Fueling North America's Transportation Future
27
Demand trends—poor fuel economy performance and ever-rising vehicle-miles of travel—pose a challenge to moderating demand for oil. However, there is a growing confluence of interests pushing in this direction. Perhaps the best evidence of this is the call for a 20 percent reduction in projected gasoline consumption in 10 years by President Bush in his 2007 State of the Union address.196 ConocoPhillips and ExxonMobil also recently endorsed an increase in vehicle fuel economy standards, with other business and national security leaders following suit.197
Putting the nation on such a trajectory would reduce price volatility and moderate increases in global oil price, given the influential role of the United States in the global marketplace.198 This would in turn cool interest in substitutes, including destructive tar sands development, oil shale exploration, and coal extraction. It would buy much-needed time for a rational transition to new transportation energy sources.
Transportation in particular offers substantial opportunities for reducing wasted fuel. Cars and light trucks are by far the single greatest consumer in the U.S. transportation sector, as shown in the pie chart below, with quantities shown in million barrels of oil.199
Figure 5
POLICyMAkERS SHOULD RAISE FUEL ECONOMy STANDARDS FOR CARS AND LIGHT TRUCkSNew public policy can help to reduce demand for oil sensibly and effectively. First, there is an established policy for boosting fuel economy performance of U.S. light-duty vehicles: the Corporate Average Fuel Economy (CAFE) program. CAFE was enacted in 1975 in response to the first oil shocks and set separate standards for passenger cars and light trucks, including sport utility vehicles (SUVs) and minivans. The standards, combined with significant fuel price increases, led to a near doubling of fuel economy for passenger cars and a 50 percent increase for light trucks.200 Without CAFE, the United States would have used about 2.8 million barrels a day more gasoline in 2000.201 Average fuel economy for the combined fleet peaked in 1988 at 22.1 mpg and has stagnated since then.202
But this doesn’t mean that efficiency has declined. It has just been trumped by other attributes, including size, weight, and horsepower. If these characteristics were held constant, historical fuel economy performance would have continued to improve.203
President Bush has advocated a boost to the standard that mirrors proposals offered by leaders across the aisle, in both the House and the Senate.204 As part of the “20 in 10” gasoline savings plan laid out in his 2007 State of the Union address, the president argued that reforming and strengthening the standard should account for about one-quarter of total savings by increasing the standards 4 percent per year.205 If put into place, the fuel and pollution reductions would be substantial: By 2017, 550,000 barrels of oil a day would be saved each year, and 95 million metric tons of heat-trapping carbon dioxide emissions would be prevented annually.206
Fortunately, automakers have the technical expertise to increase efficiency. In fact, a host of efficiency-enhancing, inexpensive technologies were identified in a 2002 study on CAFE by the National Research Council (NRC). They found that the cumulative effect could increase fuel economy by about one-third in a reasonable amount of time, without affecting safety: “It is technically feasible and potentially economical to improve fuel economy without reducing vehicle weight or size, and, therefore, without significantly affecting the safety of motor vehicle travel.”207
Driving It Home: Choosing the Right Path for Fueling North America's Transportation Future
2�
In spite of some market penetration by the technologies featured in the NRC report in reaction to high prices, many remain good candidates for further increasing fleetwide fuel economy.208 Off-the-shelf technologies include improvements such as turbochargers, continuously variable and six-speed transmissions, slicker materials, and low-rolling-resistance tires to reduce drag on vehicles. The Union of Concerned Scientists has calculated that the total effect of improvements like these on an average SUV would yield at least a 31 percent improvement in fuel-economy performance.209
POLICyMAkERS SHOULD ADOPT PERFORMANCE STANDARDS FOR HEAvy TRUCkS AND TIRESBeyond CAFE, other components of the transportation sector could be improved by the enactment of new performance standards. Specifically, NRDC has proposed requiring improvements in fuel economy performance of heavy trucks and replacement tires.210 A 2006 report by the American Council for an Energy-Efficient Economy (ACEEE) found dramatic potential for saving oil by adopting these policies.211
TRUCk AND AIRPLANE MANUFACTURERS SHOULD DEvELOP NEW, ADvANCED TECHNOLOGIESAs ACEEE notes, medium- to heavy-duty trucks account for 63 percent of energy used to transport freight, guzzling 2.4 million barrels of oil a day.212 By deploying a variety of technologies, including hybridization analogous to light-duty vehicles such as the Ford Escape hybrid and the Toyota Prius, ACEEE estimates that fuel economy could be increased nearly 40 percent in long-haul trucks and more than 50 percent in short-haul trucks.
In the summer of 2006, the EPA announced an exciting new invention, the outcome of a partnership with the United Parcel Service (UPS): the hydraulic hybrid. Different from battery-dependent hybrid-electric technologies, it uses a hydraulic drivetrain in medium-duty trucks. The advantages are similar to those of a Prius, since this drivetrain recovers braking energy, provides more efficient operating modes, and allows engine shutoff during prolonged stops. The cost differential is smaller than for a hybrid-electric vehicle and boosts fuel economy 60 to 70 percent, slashing heat-trapping carbon dioxide emissions by 40 percent.213
Substantial efficiency gains have also been made in aviation, a sector where high fuel prices have had a punishing effect on already-thin profit margins. NRDC estimates that additional gains could be achieved via improved air traffic management. Specifically, using new technology to take more direct routes, flying at lower altitudes, and reducing wait time for takeoff and landing strips could save 140,000 barrels of oil a day by 2025.214 The Pew Center on Global Climate Change found in a recent study that fuel efficiency could be improved by up to 50 percent in the long-term by using better engine technologies and improved aerodynamics through technologies such as winglets.215
Offer Consumers More Choices and Provide Incentives to Use ThemA complementary plan to save oil by moderating demand is to provide Americans with alternatives to driving such as public transit, often not an option in suburban neighborhoods built since World War II. Techniques for doing this necessarily have a longer time horizon for effectiveness, but the evidence is clear that such efforts do pay off. And many of them offer other benefits, such as increased economic development in blighted neighborhoods, improved quality of life, and increased opportunities for physical activity that leads to improved health.216
In 2005, Congress enacted a new law called SAFETEA-LU, providing directives and guidance for the investment of hundreds of billions of dollars of federal gas tax and general revenue.217 This law is due to be reauthorized in 2009. New funding should come with strings attached that require changes in planning and zoning for land surrounding transit nodes such that commercial and residential development is clustered within walking and biking distance.
POLICyMAkERS SHOULD INvEST IN TRANSIT AND PROvIDE INCENTIvES TO OPT OUT OF DRIvINGIn addition to enacting more robust planning requirements for transportation investments, the new transportation bill should include added funding for rail or bus transit lines in metropolitan areas. Building and clustering development around such lines—a technique known as “transit-oriented development”—would boost ridership and reduce oil use.

Driving It Home: Choosing the Right Path for Fueling North America's Transportation Future
29
In fact, the American Public Transportation Association (APTA) figures that the country would save almost 100,000 barrels of oil per day by doubling transit ridership.218
Policymakers must also provide new economic incentives that encourage citizens to take advantage of new transit infrastructure, and build public support for such projects. One example of such a policy, which would yield large societal and environmental benefits, is “pay-as-you-drive” auto insurance. Right now, driving comes with a variety of fixed costs: vehicle registration, licensing, and insurance. Tying insurance rates to miles of vehicle travel would link them more closely to risk, save oil, reduce pollution, and decrease congestion. One recent analysis found that the oil savings of pay-as-you-drive insurance would be more than 740,000 barrels per day due to a 9.1 percent reduction in driving.219
Cumulatively, policies that combine investments in new infrastructure located near town or city centers with incentives to opt out of driving for every trip could yield huge benefits. As a 2006 analysis commissioned by NRDC concluded:
Reasonably aggressive implementation of currently existing best-practice transportation measures can reduce VMT [vehicle miles traveled] by about 16 percent from baseline projections by 2020, 24 percent by 2030, and 32 percent by 2050. More aggressive implementation of transportation demand management (e.g., to a greater extent than current best practice) or the introduction of new or additional policy measures could make these reductions even greater.
Further, decreasing VMT significantly leverages fuel and energy savings from biofuels and fuel efficiency—combined, biofuels, vehicle efficiency, and improved transportation choices could reduce our transportation-related oil demand in 2050 by 90 percent, from more than 30 million barrels of oil per day to about 3 million barrels.220 This potent combination thus has a tremendous effect on energy requirements and climate change impacts. Further, improving transportation choices and decreasing VMT can greatly help a number of other environmental, economic, and social considerations.221
Driving It Home: Choosing the Right Path for Fueling North America's Transportation Future
30
As the world’s most oil-dependent region, North America faces few easy
choices about our energy future. America alone currently consumes a
quarter of the world’s oil supply.222 We must find a way to retain our mobility
and to accommodate the growing demand for transportation fuels, while at the same
time taking immediate steps to slow, stop, and reverse the emissions of heat-trapping
gases that cause global warming. The solutions lie in clean, renewable fuel sources
and energy-efficient technology—not the dirty, unconventional fuel substitutes of tar
sands, oil shale, and coal.
Conclusion
North America can substantially reduce its dependence on oil not by relying on these dirtier fossil fuels, but rather by employing technologies and clean fuels that can cut global warming pollution, grow our economy, and create jobs without sacrificing our health, our communities, or our precious landscapes.
The first step is to increase dramatically the efficiency of fuel use in our vehicles and transportation system. The good news is that we’ve boosted efficiency before—in the United States from 1975 to 1983, we doubled the fuel-economy performance of sedans and increased by half the performance of light trucks. If not for these changes, America would be consuming almost 3 million additional barrels of oil daily on top of the 21 million barrels we currently consume.223 Although progress in vehicle fuel economy stalled in the 1980s, new off-the-shelf technology, as well as advanced options such as hybrid cars, can help to jumpstart that progress once again.
More good news comes in the form of the current boom in production and use of cleaner fuels such as high-blend ethanol and biodiesel. Increasing interest in electricity as an alternative way of powering our vehicles, by plugging in instead of filling the tank, may also be a welcome development.
But in order to fully realize efficiency gains, we must push back against dirty fuel development, which will set back our forward momentum toward a cleaner fuel future. Driven by prices—and a lack of rational public policy to create safeguards within the marketplace—the oil industry is moving rapidly to “de-conventionalize” its reserves to meet booming liquid fuel demand. First in line, and already in production, are the tar sands. Next up could well be oil shale and liquid coal.
North America is at a historic crossroads, and our choice of path will have profound effects on climatic stability, water resources, habitat, and our economy. We have the technology and the knowledge to take the trajectory that yields big dividends for both ends of the pump. What we need to move down that road is political leadership.

Blank Page 31

32
1. “Catastrophic” is defined as a two-degree increase over today’s average global temperature; at that level worst-case scenarios may well unfold, threatening habitat (including human settlements) and other natural resources. Concentrations of 450 parts per million (ppm) would yield such an increase, and the world is already at nearly 400 ppm. In order to avoid the 450 ppm threshold, emission cuts of 80 percent by 2050 are required. Stern, Nicholas. The Economics of Climate Change, p. xv. New York:Cambridge University Press, 2007.
2. Grubb, Michael. “Who’s Afraid of Atmospheric Stabilization? Making the Link Between Energy Resources and Climate Change.” Energy Policy 29 (2001) 837-845, Elsevier Press; and Greene, et al., “Running Into and Out of Oil: Scenarios of Global Oil Use and Depletion to 2050.” Oak Ridge National Laboratory, June 23, 2002.
3. “Peaking” concerns a particular category of liquid fuels—those derived from conventional oil resources. Conventional oil is “obtained by traditional extraction methods (e.g., well drilling) rather than unconventional sources such as shale, tar sands, and so on.” Dictionary of Energy, Elsevier Press, 2005. Physical evidence of the vast amount of investment in exploitation of this resource can be found in the fact that the United States has more than 560,000 producing oil wells, versus a mere 1,500 in Saudi Arabia, a much larger producer. Maugeri, Leonardo. The Age of Oil: The Mythology, History, and Future of the World’s Most Controversial Resource. Westport, CT: Praeger, 2006.
4. Transportation Energy Data Book 25, Oak Ridge National Laboratory.
5. Roberts, Paul. The End of Oil: On the Edge of a Perilous New World, Houghton Mifflin Company, New York 2004.
6. Bruner, Jon. “Stock Focus/Sliding Back Into Oil.” Forbes, February 2, 2007.
7. Krauss, Clifford and Simon Romero. “In Venezuela, a Showdown Looms Over Oil.” New York Times, April 10, 2007.
8. Mouawad, Jad. “Oil Innovations Pump New Life Into Old Wells.” New York Times, March 5, 2007.
9. Ibid.
10. Based on the average spot price for all countries from the Energy Information Administration. EIA, Short Term Energy and Fuel Outlook, April 10, 2007. http://www.eia.doe.gov/emeu/steo/pub/ contents.html.
11. PowerPoint by Dammer, Anton, Department of Energy, 2005.
12. Goldman Sachs, “Super Spike Period May Be Upon Us: Sector Attractive,” March 30, 2005, Oil Shockwave Report, Securing America’s Future Energy, June 23, 2005.
13. Maugeri, Leonardo. The Age of Oil: The Mythology, History, and Future of the World’s Most Controversial Resource, p. 204. Westport, CT: Praeger, 2006.
14. Invested in liquid gas, but it is unclear whether this will lead to investment in liquid coal.
15. Farrell, A.E., and A.R. Brandt. “Risks of the Oil Transition.” Environmental Research Letters, October 30, 2006.
16. Ibid.
17. Ibid.
18. International Energy Agency. “World Energy Outlook 2006,” p. 103.
19. Blancher, Peter and Jeffrey Wells. “The Boreal Forest Region: North America’s Bird Nursery.” Commissioned by the Boreal Songbird Initiative
and the Canadian Boreal Initiative, April 2005. http://www.borealbirds.org/bsi-bscreport-april2005.pdf.
20. The area in Alberta proposed for tar sands oil exploitation measures roughly 54,363 square miles (more than 34 million acres). See Alberta Energy, “Oil Sands.” http://www.energy.gov.ab.ca/89.asp (accessed March 27, 2007). There are also some tar sands deposits in the United States, mostly in eastern Utah, but these are small compared to those in Canada (estimated at 12 to 20 billion barrels) and have not yet been developed on a significant commercial scale. See U.S. Department of Interior, Bureau of Land Management, “Oil Shale/Tar Sands Guide.” http://ostseis.anl.gov/guide/index.cfm (accessed March 27, 2007). The world’s other large deposit of tar sands is in Venezuela, which is also not yet under significant commercial development.
21. The U.S. Energy Information Administration formally recognized Canada’s tar sands as an economically viable resource in 2003.
22. National Oil Sands Task Force. “The Oil Sands: A New Energy Vision for Canada.” 1995.
23. National Energy Board. “Canada’s Oil Sands: Opportunities and Challenges to 2015: An Update.” June 2006.
24. See http://na.unep.net/digital_atlas2/webatlas.php?id=261. Also see http://www.unep.org/Documents.Multilingual/Default.asp?DocumentID=487&ArticleID=5350&l=en.
25. The Pembina Institute. “Albertans’ Perceptions of Oil Sands Development Poll, Part 2: Environmental Issues.” http://www.pembina.org/pdf/publications/OS_Survey_Enviro.pdf.
26. “High Illness Rate Near Oil Sands Worrisome, Says Alberta Health
Official,” CBC News, March 10, 2006.
27. Liepens, Larissa. “Fort McMurray Votes to Put the Brakes on Oil Sands.” Globe and Mail, June 14, 2006.
28. Crude bitumen is defined as a viscous (thick), heavy oil that will not flow to a well in its natural state. Bitumen is a tarlike mixture of petroleum hydrocarbons with a density greater than 960 kilograms per cubic meter; light crude oil, by comparison, has a density as low as 793 kilograms per cubic meter. Compared with conventional crude oil, bitumen requires some additional upgrading before it can be refined. It also requires dilution with lighter hydrocarbons to make it transportable via pipelines.
29. National Energy Board. “Canada’s Oil Sands: Opportunities and Challenges to 2015: An Update.” June 2006.
30. Timilsina, Govinda, et al. Economic Impacts of Alberta’s Oil Sands, p. 5. Canadian Energy Research Institute, 2005.
31. Surface mining uses approximately 250 cubic feet of natural gas per barrel recovered. In-situ energy demand with today’s technology requires 1,000 cubic feet of natural gas per barrel recovered. Alberta Chamber of Resources, Oil Sands Technology Roadmap— Unlocking the Potential, p. 14. 2004. http://www.acr-alberta.com/ostr/OSTR_report.pdf.
32. Suncor Energy “Our Business” webpage, “Refining, Commerce City” section, http://www.suncor.com/default.aspx?ID=2625
33. TD Securities, “Overview of Canada’s Oil Sands,” pp. 38-39, http://www.imperialinvestmentrealty.com/TD%20AlbertaOilSands.pdf
34. BP, “Whiting to get $3 Billion Investment,” Frontiers, Issue 17, December 2006, p. 4, http://www.bp.com/liveassets/bp_internet/globalbp/globalbp_uk_english/reports_and_publications/frontiers/STAGING/local_assets/pdf/bpf17_01-05_newspatsbriefs.pdf.
Endnotes
Driving it Home: Choosing the Right Path for Fueling North America's Transportation Future
33
35. TD Securities, “Overview of Canada’s Oil Sands,” pp. 38-39, http://www.imperialinvestmentrealty.com/TD%20AlbertaOilSands.pdf; Harold Brubaker “Emerging source of Oil, Not from Wells, But Sand,” Philadelphia Inquirer, December 1, 2004, http://energybulletin.net/3458.html.
36. Murphy Oil Corp Annual Report to Shareholders. 2003, pp. IFC1, 9. http://www.murphyoilcorp.com/ir/annualreport/2003/Murphy03AR.pdf
37. National Energy Board, “Canada’s Oil Sands: Opportunities and Challenges to 2015—An Update,” June 2006, Table 4.3, Announced Refinery Expansions, p. 22. http://www.neb-one.gc.ca/energy/EnergyReports/EMAOilSandsOpportunitiesChallenges2015_2006/EMAOilSandsOpportunities2015Canada2006_e.pdf
38. TD Securities, “Overview of Canada’s Oil Sands,” pp. 38-39, http://www.imperialinvestmentrealty.com/TD%20AlbertaOilSands.pdf.
39. ConocoPhillips Fact Book: Refining and Marketing, http://www.conocophillips.com/NR/rdonlyres/69822A69-D14A-46ED-854C-0CD2298141EE/0/RM.pdf
40. TD Securities, “Overview of Canada’s Oil Sands,” pp. 38-39, http://www.imperialinvestmentrealty.com/TD%20AlbertaOilSands.pdf.
41. ConocoPhillips 2005 Annual Report, p. 13 http://www.conocophillips.com/NR/rdonlyres/8D2ADABC-F6FC-48A2-8A4A-138A28439815/0/2005_CoP_AnlRprt.pdf.
42. Marathon says new connections could lead it to build a new coker at its 192,000 b/d refinery at Robinson, Illinois—along with the previously announced cokers at Detroit, Michigan, and Catlettsburg, Kentucky (APC, December 5, 2005, p. 8). Argus Media, Argus Petroleum Coke, “New Cokers to Process Heavy/ Medium Grades,” Report No. 06S-005 (May 9, 2006), p. 8, http://www.argusjapan.com/Sample/PETCO.pdf
43. National Energy Board, “Canada’s Oil Sands: Opportunities and Challenges to 2015—An Update,” June 2006, Table 4.3, Announced Refinery Expansions, p. 26. http://www.neb-one.gc.ca/energy/EnergyReports/EMAOilSandsOpportunitiesChallenges2015_2006/EMAOilSandsOpportunities2015Canada2006_e.pdf.
44. Ibid.
45. Marathon Oil News Center, Press Release 2006, http://www.marathon.com/News_Center/Press_Releases/2006_News_Releases/?releaseid=926873
46. National Energy Board, “Canada’s Oil Sands: Opportunities and Challenges to 2015—An Update,” June 2006, Table 4.3, Announced Refinery Expansions, p. 26. http://www.neb-one.gc.ca/energy/EnergyReports/EMAOilSandsOpportunitiesChallenges2015_2006/EMAOilSandsOpportunities2015Canada2006_e.pdf
47. Ibid.
48. Marathon Oil News Center, Press Release 2006, http://www.marathon.com/News_Center/Press_Releases/2006_News_Releases/?releaseid=926873
49. National Energy Board, “Canada’s Oil Sands: Opportunities and Challenges to 2015—An Update,” June 2006, Table 4.3, Announced Refinery Expansions, p. 26. http://www.neb-one.gc.ca/energy/EnergyReports/EMAOilSandsOpportunitiesChallenges2015_2006/EMAOilSandsOpportunities2015Canada2006_e.pdf; The Spearhead line has spurred plans by ConocoPhillips to build a 25,000 coker at its refinery in Borger, Texas, which will have access to the line (APC, December 7, 2004, p. 6), Argus Media, Argus Petroleum Coke Monthly, “New Cokers to Process Heavy/ Medium Grades,” Report No. 06S-005. May 9, 2006, p. 8, http://www.argusjapan.com/Sample/PETCO.pdf
50. National Energy Board, “Canada’s Oil Sands: Opportunities and Challenges to 2015—An Update,” June 2006, Table 4.3, Announced Refinery Expansions, p. 26. http://www.neb-one.gc.ca/energy/EnergyReports/EMAOilSandsOpportunitiesChallenges2015_2006/EMAOilSandsOpportunities2015Canada2006_e.pdf.
51. Ibid.
52. Ibid.
53. Ibid.
54. Mackenzie Gas Project. http://www.mackenziegasproject.com/.
55. Remarks by Rex W. Tillerson, president, ExxonMobil Corporation, Canadian-American Business Council 11th Annual Business Achievement Award Luncheon, Calgary, Alberta, November 8, 2004: “And because producing Canada’s oil sands is itself an energy-intensive process, investment in building infrastructure and in ways to more efficiently utilize the energy inputs required is also critical. In this regard, an important infrastructure project is the Mackenzie Valley Pipeline. This proposed 1,220 kilometer, $7 billion pipeline would carry natural gas from three discovered fields in the Mackenzie Delta across the Northwest Territories to join the existing gas pipeline system in northwestern Alberta.”
56. CBC News. “First Nation Pulls out of Oilsands Watchdog Group.” March 6, 2007. http://www.cbc.ca/canada/edmonton/story/2007/03/06/cema-pullout.html (accessed March 27, 2007).
57. Mikisew Cree First Nation Industry Relations letter to NRDC, June 28, 2006.
58. Woynillowicz, Dan. “Oil Sands Fever: The Environmental Implications of Canada’s Oil Sands Rush,” The Pembina Institute, November 2005, p. 19.
59. Ibid, p. 22. Information gathered from Canadian Association of Petroleum Producers on conventional oil and for oil sands mining and in situ drilling from Pembina research. Actual numbers are 28.6 conventional oil average GHG intensity/barrel of oil compared to 85.5 oil sands average GHG intensity/barrel of oil. It is just under three times as much.
60. Bramley, Matthew, Neabel, Derek, and Dan Woynillowicz. “The Climate Implications of Canada’s Oil Sands Development.” The Pembina Institute, November 29, 2005.
61. Maryland’s emissions from automobiles were 24 MT CO2 based on gasoline consumption. US Dept of Transportation, Highway Statistics 2003. CO2 was calculated as 20 lbs per gallon of gasoline consumed.
62. Bramley, Matthew, Neabel, Derek, and Dan Woynillowicz. “The Climate Implications of Canada’s Oil Sands Development,” The Pembina Institute, November 29, 2005, p. 5.
63. Dan Woynillowicz, Pembina Institute, email, May 31, 2006.
64. Canadian Parks and Wilderness Society. “A Response to the Mineable Oil Sands Strategy.” December 14, 2005.
65. Ibid.
66. Alberta Chamber of Resources. “Oil Sands Technology Roadmap—Unlocking the Potential,” 2004, p. 21. http://www.acr-alberta.com/ostr/OSTR_report.pdf.
67. Griffiths, Mary, et al. “Troubled Waters, Troubling Trends,” Pembina Institute, May 2006, p. 69.
68. Woynillowicz, Dan. “Oil Sands Fever: The Environmental Implications of Canada’s Oil Sands Rush,” The Pembina Institute, November 2005, p. 35.

Driving it Home: Choosing the Right Path for Fueling North America's Transportation Future
34
69. Ibid, p. 71.
70. Griffiths, Mary, et al. “Troubled Waters, Troubling Trends,” Pembina Institute, May 2006, p. 69.
71. Woynillowicz, Dan. “Oil Sands Fever: The Environmental Implications of Canada’s Oil Sands Rush,” The Pembina Institute, November 2005, p. 30.
72. Naphthenic acids are a class of organic acids found within crude oils. They are known to be toxic to a range of aquatic organisms. Naphthenic acids are relatively poorly studied (primarily because of their complex nature and their location in hard-to-reach oilfields and tailings) and as a group they co-occur with a diverse range of petroleum hydrocarbons present in tar sands deposits. Barrow, Mark. “Napthenic Acids.” http://www2.warwick.ac.uk/fac/sci/chemistry/research/mass-spectrometry/projects/naphthenicacids/ (accessed March 27, 2007). University of Warwick. “Dr. Mark Barrow.” http://www.warwick.ac.uk/staff/M.P.Barrow/environmental.html.
73. Naturally occurring naphthenic acids in rivers in this region are generally below 1 mg/L, but those concentrations may be as high as 110 mg/L in the tailings ponds. Woynillowicz, Dan. “Oil Sands Fever: The Environmental Implications of Canada’s Oil Sands Rush,” p. 31. The Pembina Institute, November 2005.
74. Woynillowicz, Dan. “Oil Sands Fever: The Environmental Implications of Canada’s Oil Sands Rush,” p. 32. The Pembina Institute, November 2005.
75. Alberta Chamber of Resources. “Oil Sands Technology Roadmap—Unlocking the Potential,” p. 36. 2004. http://www.acr-alberta.com/ostr/OSTR_report.pdf.
76. National Energy Board. “Canada’s Oil Sands: Opportunities and Challenges to 2015: An Update,” p. 22. June 2006. http://www.neb.gc.ca/energy/EnergyReports/EMAOilSandsOpportunitiesChallenges2015_2006/EMAOilSandsOpportunities2015Canada2006_e.pdf.
77. Rowat, Myles. “Boom Times: Canada’s Crude Petroleum Industry,” Statistics Canada, p. 7, September 2006.
78. Ibid.
79. Canadian Association of Petroleum Producers. “Industry Facts and Information: Oil Sands 2005 Statistics.” http://www.capp.ca/default.asp?V_DOC_ID=688.
80. National Energy Board. “Canada’s Oil Sands—Opportunities and Challenges to 2015: An Update,” p. 11. June 2006. http://www.neb.gc.ca/energy/EnergyReports/EMAOilSandsOpportunitiesChallenges2015_2006/EMAOilSandsOpportunities2015Canada2006_e.pdf.
81. National Energy Board. “Canada’s Oil Sands—Opportunities and Challenges to 2015: An Update,” pp. 12-13. June 2006.
82. Ibid, p. 21.
83. Criteria: Companies that send their tar sands oil to the United States for refining, and companies that own refining capacity in the United States and accept or are planning to accept tar sands oil.
84. Twenty percent non-operated interest in Athabasca Oil Sands Project.
85. Joslyn lease is mostly mining. Total in 2005. http://www.total.com/total-in-2005/en/index.htm
86. Interest in Surmont in-situ project (along with ConocoPhillips). Total. “Extra Heavy Oils and Bitumen Reserves for the Future: Total Exploration and Production 2004.” http://www.total.com/static/en/medias/topic1618/Bruts_bitumes_GB1.pdf (accessed March 27, 2007).
87. “U.S. Urges ‘Five-fold Expansion’ in Alberta Oilsands Production.” CBC News, January 18, 2007. http://www.cbc.ca/canada/story/2007/01/17/oil-sands.html (accessed March 27, 2007).
88. Ibid.
89. Department of Finance. The Budget Plan 2007, March 19, 2007, p. 175.
90. Ibid.
91. Ibid, p. 185.
92. Petroleum Administration for Defense Districts II and IV. http://www.eia.doe.gov/pub/oil_gas/petroleum/analysis_publications/oil_market_basics/paddmap.htm.
93. Suncor. “About Suncor: A Summary of Suncor Energy’s Operations and Strategies.” June 2006. http://www.suncor.com/data/1/rec_docs/911_about%20suncor%202006%20final.pdf (accessed March 27, 2007).
94. BP. “Whiting to Get $3 Billion Investment.” Frontiers, Issue 17, December 2006, p. 4. http://www.bp.com/liveassets/bp_internet/globalbp/globalbp_uk_english/reports_and_publications/frontiers/STAGING/local_assets/pdf/bpf17_01-05_newspatsbriefs.pdf.
95. Marathon Oil Corporation. “Marathon to Issue Request for ProposalsAimed at Canadian Oil Sands Venture.” November 6, 2006. http://www.marathon.com/News_Center/Press_Releases/2006_News_Releases/?releaseid=926873 (accessed March 27, 2007).
96. Canada-US Transboundary Pipeline proposal and environmental impact assessment process. U.S. Department of State. “Keystone Pipeline Project Map.” http://www.keystonepipeline.state.gov/keystone.nsf/e327883380befe0b862571f60062011e/befe7db2d106429f86257205006a47e6?OpenDocument (accessed March 27, 2007).
97. U.S. Department of State. “Keystone Pipeline Project Overview.” www.keystonepipeline.state.gov (accessed March 27, 2007).
98. See, for example, “Blueprint for Responsible Oil Sands Development.” Pembina Institute, 2007.
99. For a detailed analysis of global warming pollution solutions, see McCulloch, Matthew, Marlo Raynolds, and Rich Wong. “Carbon Neutral 2020: A Leadership Opportunity in Canada’s Oil Sands.” The Pembina Institute, October 2006. http://www.pembina.org/pdf/publications/CarbonNeutral2020_Final.pdf (accessed March 27, 2007).
100. Ibid.
101. Ibid, pp. 8-9.
102. Ibid, p. 6.
103. See H.R. 6, Pub. L. 109-58, 119 Stat. 728 (enacted August 8, 2005), at Title III, Sec. 369 (largely codified at 42 U.S.C. § 15927).
104. This sentence refers to proposals by Shell, Chevron, and EGL, respectively. See Bureau of Land Management, “Environmental Assessments for Oil Shale Research, Development, and Demonstration,” November 2006. http://www.co.blm.gov/wrra/wrfo_os_eas.htm.
105. Testimony of Stephen Mut, CEO of Unconventional Resources, Shell Exploration and Production Company, before Senate Energy and Natural Resources Committee, Full Committee Hearing in Grand Junction, CO, on June 1, 2006. http://energy.senate.gov/public/index.cfm?FuseAction=Hearings.Hearing&Hearing_ID=1561.
106. McKibben, Mike. “Shell’s Oil Shale Project Requires More Test Time.” Grand Junction Daily Sentinel, February 23, 2007.

Driving it Home: Choosing the Right Path for Fueling North America's Transportation Future
35
107. The Bureau of Land Management prepared an air quality dispersion model to evaluate the cumulative impacts that these leases, along with increased oil and gas activities proposed for the area, would have on the nearby Flat Tops Wilderness Area, in the White River National Forest. See, for example, Bureau of Land Management, Environmental Assessment CO-110-2006-117-EA, “Oil Shale Research, Development, and Demonstration,” November 2006, p. 151. http://www.co.blm.gov/wrra/wrfo_os_eas.htm.
108. Bartis, James T., Tom LaTourrette, Lloyd Dixon, D.J. Peterson, and Gary Cecchine. “Oil Shale Development in the United States: Prospects and Policy Issues,” p. 21. RAND Corporation, 2005. http://www.rand.org/pubs/monographs/MG414/.
109. Randy Udall, “The Illusive Bonanza: Oil Shale in Colorado,” p. 4 (2005). http://www.aspencore.org/images/pdf/OilShale.pdf.
110. 2005 Emissions from all Electrical Generating Units (EGUs) in Colorado, Wyoming, and Utah that are required to report to EPA under the acid rain regulations. See http://cfpub.epa.gov/gdm/index.cfm.
111. Bartis, et al., supra note 101, at p. 50.
112. Bureau of Land Management. “White River Resource Area Resource Management Plan Final Environmental Impact Statement,” June 1996, p. 4-4.
113. Bartis, et al., supra note 101, at pp. 41-42. RAND concluded that “a full understanding of risks and appropriate mitigation and control measures will probably not be available within six to eight years after a research program commences.” Id.
114. Harding, B.L., K.D. Linstedt, E.R. Bennet, and R.E. Poulson, “Study Evaluates Treatments for Oil Shale Retort Waters.” Industrial Wastes, Vol. 24, No. 5 (1978).
115. Amy, Gary, and Jerome Thomas, “Factors That Influence the Leaching of Organic Material From In-situ Spent Shale,” Proceedings of the Second Pacific Chemical Engineering Congress, Denver, CO (August 1977); Parker, H.W., R.M. Bethea, N. Guven, M.N. Gazdar, and J.C. Watts, “Interactions Between Ground Water and In-situ Retorted Oil Shale,” Proceedings of the Second Pacific Chemical Engineering Congress, Denver CO (August 1977); Bureau of Land Management, “White River Resource Area Resource Management Plan Final Environmental Impact Statement,” 1996, pp. 4-5.
116. The Office of Technology Assessment estimated that a 2.44-million-barrel-a-day industry would result in economic losses of $5.4 million each year from damages to agricultural, municipal, and industrial users in the Lower Basin. See Congress of the United States, Office of Technology Assessment, “An Assessment of Oil Shale Technologies,” June 1980, at p. 402. www.wws.princeton.edu/ota/disk3/1980/8004/8004.PDF.
117. Bartis, et al., supra note 101, at p. 41.
118. Bureau of Land Management, “White River Resource Area Resource Management Plan Final Environmental Impact Statement,” June 1996, p. 4-41.
119. Ibid, pp. 1-13, 4-41, 4-45.
120. See Bureau of Land Management, Environmental Assessment CO-110-2006-117 EA, “Oil Shale Research, Development, and Demonstration,” November 2006, p. 132. http://www.co.blm.gov/wrra/wrfo_os_eas.htm.
121. Ibid.
122. See discussion in chapter 4 of this report.
123. See H.R. 6, Pub. L. 109-58, 119 Stat. 728 (enacted August 8, 2005). Oil shale provisions are contained in Title III, Sec. 369 (largely codified at 42 U.S.C. § 15927).
124. See, for example, “Shell Delays Decision Until After 2010.” Rocky Mountain News, February 24, 2007. http://www.rockymountainnews.com/drmn/other_business/article/0,2777,DRMN_23916_5374621,00.html.
125. Natural Resources Defense Council. “Coal in a Changing Climate.” February 2007. http://www.nrdc.org/globalWarming/coal/contents.asp.
126. “Rentech Sees Expanded Role for Coal-to-Liquids Through Air Force Testing.” Los Angeles Times, September 18, 2006. http://www.rentechinc.com/pdfs/09-18- 06-RTK-Sees-Expanded-Role-for-CTL.pdf.
127. Alabama, Georgia, eastern Kentucky, Maryland, North Carolina,Ohio, Pennsylvania, Tennessee, Virginia, and West Virginia.
128. Energy Information Administration. Annual Coal Report, 2004.
129. Martin, Julian, West Virginia Highlands Conservancy, Personal Communication, February 2, 2006.
130. Alaska, Arizona, Colorado, Montana, New Mexico, North Dakota, Utah, Washington, and Wyoming.
131. See, for example, U.S. Department of the Interior, Bureau of Land Management, “1985 Federal Coal Management Program/Final Environmental Impact Statement,” pp. 210-211, 230-231, 241-242, 282 (water quality and quantity), 241, 251, 257.
132. Bureau of Land Management. “3809 Surface Management Regulations, Draft Environmental Impact Statement.” October 2000.
133. Department of Interior, National Park Service. “Coal Development Overview.” 2003.
134. Environmental Protection Agency. “Mountaintop Mining/Valley Fills in Appalachia: Draft Programmatic Environmental Impact Statement.” 2006.
135. Ibid.
136. Environmental Protection Agency, Office of Solid Waste. “Acid Mine Drainage Prediction Technical Document.” December 1994.
137. Environmental Protection Agency. “Mountaintop Mining/Valley Fills in Appalachia: Draft Programmatic Environmental Impact Statement.” 2006.
138. Environmental Protection Agency. “Mid-Atlantic Integrated Assessment: Coal Mining.” 2006.
139. Department of Energy and the Environmental Protection Agency. “Emissions of Greenhouse Gases in the United States 2004.” December 2005.
140. Environmental Protection Agency. “Particulate Matter Health Effects.” 2005. www.epa.gov/oar/urbanair/pm/.
141. Department of Transportation, Federal Highway Administration. “Assessing the Effects of Freight Movement on Air Quality, Final Report.” April 2005.
142. Energy Information Administration. “Coal Transportation Statistics.” 1993. http://tonto.eia.doe.gov/FTPROOT/coal/006493.pdf
143. Hill, Bruce. “An Analysis of Diesel Air Pollution and Public Health in America.” Boston: Clean Air Task Force, February 2005.
Driving it Home: Choosing the Right Path for Fueling North America's Transportation Future
36
144. According to the Department of Energy, www.fueleconomy.gov, a Honda Civic produces 5.5 tons of CO2 per year and a Hummer H3 produces 10.6 tons of CO2 per year. According to Williams et. al., Princeton University, coal-to-liquids produces 50 lbs. CO2/gal gasoline equivalent, while conventional gasoline produces 25 lbs. CO2/gal according to Argonne National Laboratory GREET model. Calculated well-to-wheel CO2 emissions for coal-based “Fischer-Tropsch” are about 1.8 times greater than producing and consuming gasoline or diesel fuel from crude oil. If the liquid coal plant makes electricity as well, the relative emissions from the liquid fuels depends on the amount of electricity produced and what is assumed about the emissions of from an alternative source of electricity.
145. U.S. EPA. “Greenhouse Gas Impacts of Expanded Renewable and Alternative Fuels Use.” USEPA Office of Transportation and Air Quality, EPA420-F-07-035, April 2007, and Wang et. al. Life-Cycle Energy and Greenhouse Gas Results of Fischer-Tropsch Diesel Produced from Natural Gas, Coal, and Biomass. Department of Energy, Center for Transportation Research, Argonne National Laboratory, 2007 SAE Government/Industry Meeting, Washington, D.C., May 14-16, 2007.
146. See, for instance, S. 154, the Coal-to-Liquid Fuel Energy Act of 2007, sponsored by Senator Jim Bunning of Kentucky, unveiled at the beginning of the 110th Congress (1/4/07).
147. Massachusetts Institute of Technology, The Future of Coal: Options for a Carbon-Constrained World, 2007, Appendix 3F.
148. National Energy Board. “Canada’s Oil Sands: Opportunities and Challenges to 2015: An Update,” p. 11. June 2006. Tezak, Christine, and K. Whitney Stanco. “Stanford Policy Research Energy Bulletin,” December 13, 2006.
149. Demott, John S. “Setback for Synfuel.” Time Magazine, May 17, 1982. Conversion to today’s value using http://www.westegg.com/inflation/.
150. Energy Information Administration. “Annual Energy Outlook,” p. 54. 2006.
151. DeMott, John S. “Setback for Synfuel,” Time Magazine, May 17, 1982.http://www.time.com/time/magazine/article/0,9171,921222-1,00.html.
152. Woynillowicz, Dan. “Oil Sands Fever: The Environmental Implications of Canada’s Oil Sands Rush,” pp. 61-2. The Pembina Institute, November 2005.
153. Taylor, Amy, and Marlo Raynolds. “Thinking Like an Owner: Full Report.” The Pembina Institute, November 29, 2006. http://www.pembina.org/pdf/publications/Owner_FullRpt_Web.pdf.
154. In 1996, oil sands royalties were 16 percent of total oil and gas royalties: C$549 million out of C$3.4 billion. But in 2005, tar sands royalties were only 9 percent of the total: C$828 million out of C$9.4 billion. Taylor, Amy, and Marlo Raynolds. “Thinking Like an Owner: Full Report,” p. 15. November 29, 2006. http://www.pembina.org/pdf/publications/Owner_FullRpt_Web.pdf.
155. Pembina Institute. Backgrounder to “Albertans’ Perceptions of Oil Sands Development Poll,” p. 4-5. http://www.pembina.org/pdf/publications/OS_Survey_Econ.pdf.
156. See H.R. 6, Pub. L. 109-58, 119 Stat. 728 (enacted August. 8, 2005), Sec. 369(d)(2) (codified at 42 U.S.C. § 15927(d)(2)).
157. See testimony of John A. Baardson, CEO of Baard Energy LLC, before the U.S. Senate Committee on Energy and Natural Resources, June 1, 2006, in Grand Junction, CO. http://energy.senate.gov/public/index.cfm?FuseAction=Hearings.Hearing&Hearing_ID=1561.
158. See S. 1932, Sec. 6301(c) (engrossed amendment as agreed to by House); see H.R. 4761, Sec. 27(b) (engrossed as agreed to or passed by House).
159. McCulloch, Matthew, Marlo Raynolds, and Rich Wong. “Carbon Neutral by 2020: A Leadership Opportunity in Canada’s Oil Sands,” p. 5. Pembina Institute, October 2006.
160. Petro-Canada. “2003 Shareholder Resolution.” http://www.ethicalfunds.com/do_the_right_thing/sri/shareholder_action/shareholder_resolutions_2003/04_petro_canada.htm (accessed March 27, 2007).
161. The Ethical Funds Company. “Head in the Oil Sands? Climate Change Risks in Canada’s Oil and Gas Sector.” March 2007. http://www.ethicalfunds.com/pdf2/newsroom/Head_in_the_Oil_Sands_Final.pdf.
162. JPMorgan Chase. “Climate Change Policy and Commitments.” http://www.jpmorganchase.com/cm/cs?pagename=Chase/Href&urlname=jpmc/community/env/policy/clim (accessed March 27, 2007).
163. Bank of America. “Climate Change Position.” http://www.bankofamerica.com/environment/index.cfm?template=env_clichangepos (accessed March 27, 2007).
164. HSBC. “HSBC’s Carbon Neutral Pilot Project.” http://www.hsbc.com/hsbc/csr/environment/hsbc-and-climate-change (accessed March 27, 2007).
165. Ibid.
166. Goldman Sachs. “Environmental Initiative: 2006 Year-End Report.” http://www2.goldmansachs.com/our_firm/our_culture/corporate_
citizenship/environmental_policy_framework/docs/Environmental_Initiative_Report_-_Final.pdf (accessed March 27, 2007); Goldman Sachs. “Environmental Policy.” http://www2.goldmansachs.com/our_firm/our_culture/social_responsibility/environmental_policy_framework/index.html (accessed March 27, 2007).
167. Citigroup. “Citi Position on Climate Change.” http://www.citigroup.com/citigroup/environment/climateposition.htm (accessed March 27, 2007).
168. The Earth Institute. “The Path to Climate Sustainability: A Joint Statement by the Global Roundtable on Climate Change.” February 20, 2007. http://www.earth.columbia.edu/grocc/grocc4_statement.html (accessed March 27, 2007); Allianz Group. “Allianz Supports Framework to Fight Climate Change.” http://www.allianz.com/en/allianz_group/press_center/news_dossiers/climate_und_energy/news_2007-02-20.html (accessed March 27, 2007).
169. The European Union has agreed to a reduction of at least 20 percent in greenhouse gas emissions by 2020 (relative to 1990 levels). Council of the European Union, “Presidency Conclusions,” 7224/07 (March 9, 2007), p. 12. http://www.consilium.europa.eu/ueDocs/cms_Data/docs pressData/en/ec/93135.pdf. The EU also has committed to a mandatory, legally binding target for 20 percent energy use from renewable sources and 10 percent of petrol and diesel consumption from biofuels by 2020. Council of the European Union, “Presidency Conclusions,” 7224/07 (March 9, 2007), p. 21. http://www.consilium.europa.eu/ueDocs/cms_Data/docs/pressData/en/ec/93135.pdf.
170. Executive Order S-01-07 by the Governor of the State of California.http://gov.ca/executive-order/5172/.
171. The Sarbanes-Oxley Act of 2002 and Securities and Exchange Commission rules have resulted in regulations requiring quantifying and disclosing potential environmental liabilities.

Driving it Home: Choosing the Right Path for Fueling North America's Transportation Future
37
172. Conrad, Roger. “Sticky Profits and Perils.” Canadian Eagle, June 20, 2006.
173. Ibid.
174. Dene Tha’ First Nation v. Canada (Minister of Environment), 2006, FC 1354.
175. See H.R. 6, Pub. L. 109-58, 119 Stat. 728 (enacted August 8, 2005), Sec. 369(e) (codified at 42 U.S.C. § 15927(e)).
176. Argonne National Laboratory. “Summary of Public Scoping Comments for the Oil Shale and Tar Sands Resources Leasing Programmatic Environmental Impact Statement.” March 2006.
177. Ebner, Dave, and Roma Luciw. “Total Forced to Delay Oil Sands Plans: High Costs Blamed for Three-year Bump.” Globe and Mail, August 4, 2006.
178. David Ebner. “Petrocan Delays Oil Sands Project Decision: Won’t Decide on Fort Hills Until 2008.” Globe and Mail, October 4, 2006.
179. Wood Mackenzie. “Canadian Oil Sands Developments: Will Cost Hyper-inflation Curb Attractiveness?” Press release. http://www.woodmacresearch.com/cgi-bin/corp/portal/corp/corpPressDetail.jsp?oid=826190 (accessed March 27, 2007).
180. The renewable fuel standard or RFS is a set of regulations, promulgated pursuant to energy policy enacted by Congress (most recently the Energy Policy Act of 2005, P.L. 109-58), that ensure increases in volume of renewable fuel production.
181. For the advantages of cellulosic biofuel, see Greene, N., et al., Growing Energy: How Biofuels Can Help End America’s Oil Dependence, December 2004.
182. On January 18, 2007, Governor Schwarzenegger signed Executive Order S-01-07, www.energy.ca.gov/low_carbon_fuel_standard.
183. For more on this partnership, see www2.dupont.com/Biofuels/en_US.
184. Statement of Daniel Lashof, Ph.D., Climate Center science director, before the Committee on Energy and Natural Resources, U.S. Senate, April 12, 2007.
185. O’Brien, Chris, et al. “Responsible Purchasing Guide: Light-Duty Fleet Vehicles.” Responsible Purchasing Network 2007.
186. By 2015, this technology could make ethanol competitive with gasoline. See “Move Over Gasoline, Here Come Biofuels,” www.nrdc.org/air/transportation/biofuels.asp.
187. Number of pumps is listed at http://e85vehicles.com/ and according to the National Petroleum News (May 2005) as quoted by EIA there are 168,987 gas stations in the United States.
188. “Summary of 25 by ’25 Action Plan: Charting America’s Energy Future,” February 2007.
189. Data from Automotive News Data Cente at www.autonews.com.
190. EPRI, Comparing the Benefits and Impacts of Hybrid-Electric Vehicle Options, Technical Report 1000349, July 2001.
191. 1997 Nationwide Personal Transportation Survey, U.S. Department of Transportation, as quoted in Plotkin, Steven, “Grid-Connected Hybrids: Another Option in the Search to Replace Gasoline.” TRB 2006 annual meeting.
192. Plotkin, Steven. “Grid-Connected Hybrids: Another Option in the Search to Replace Gasoline,” TRB 2006 annual meeting.
193. Luft, Gal. “Plug In for America: California Should Encourage Electric Cars.” San Francisco Chronicle, May 26, 2006. Specifically, there is no retail delivery infrastructure or affordable onboard vehicle storage for hydrogen.
194. Plotkin, Steven. “Grid-Connected Hybrids: Another Option in the Search to Replace Gasoline,” TRB 2006 annual meeting.
195. To gauge the variation and the consequent utility of this technology for addressing the climate threat, NRDC is performing a joint study with the Electric Power Research Institute, and the state of Minnesota recently completed its own evaluation available at www.state.mn.us/mn/externalDocs/Commerce/PHEV_Task_Force_final_report_050707091959_PHEVTaskForceFinalReport.pdf
196. http://www.whitehouse.gov/stateoftheunion/2007/initiatives/sotu2007.pdf.
197. ExxonMobil CEO Rex Tillerson, “Understanding Our Shared Energy Future,” remarks to the Chief Executives Club of Boston, November 30, 2006. Brownstein, Ronald. “Oilman Calls for More Fuel Efficiency,” Los Angeles Times, June 19, 2006. “Letter to the President, the Congress, and the American People,” www.secureenergy.org/news/index.php?article=recommendations_letter.
198. In fact, assuming no change in supply, one estimate finds that the effect of cutting U.S. oil consumption 10 percent in the context of markets as tight as they’ve been in recent years “could be a temporary decline in global prices (about 12 to 25 percent) and a lowering of anticipated rate of future increases.” “National Security Consequences of U.S. Oil Dependency,” Council on Foreign Relations Independent Task Force Report No. 58.
199. 2005 data Annual Energy Outlook 2007, Energy Information Administration.
200. National Research Council, “Effectiveness and Impact of Corporate Average Fuel Economy (CAFE) Standards.” 2002.
201. Ibid.
202. “Light-Duty Automotive Technology and Fuel Economy Trends: 1975 Through 2005—Executive Summary.” EPA420-S-05-0001, July 2005.
203. Lutsey and Sperling, “Energy Efficiency, Fuel Economy and Policy Implications.” Institute for Transportation Studies, U.C. Davis, Transportation Research Board, 2005.
204. These Democratic leaders introduced fuel economy legislation—S. 678 and H.R. 1506—in the 110th Congress.
205. http://www.whitehouse.gov/stateoftheunion/2007/initiatives/sotu2007.pdf.
206. According to analysis by the Union of Concerned Scientists. www.ucsusa.org/news/press_release/presidents-and-Congress-0003.html.
207. National Research Council. “Effectiveness and Impact of Corporate Average Fuel Economy (CAFE) Standards.” 2002.
208. Truett, Richard. “Bush’s Shocker: How to Meet a Higher CAFE.” Automotive News, January 29, 2007.
209. Union of Concerned Scientists. “Building a Better SUV.” http://www.ucsusa.org/clean_vehicles/cars_pickups_suvs/building-a-better-suv.Html.
210. “Securing America: Solving America’s Oil Dependence Through Innovation.” NRDC issue paper, February 2005.
Driving it Home: Choosing the Right Path for Fueling North America's Transportation Future
3�
211. Elliot, Langer, and Nadel, “Reducing Oil Use Through Efficiency: Opportunities Beyond Cars ad Light Trucks,” ACEEE, January 2006.
212. Ibid.
213. “Hydraulic Hybrids: The Most Efficient Lowest Cost Hybrids.” www.epa.gov/OMS/technology/420f06043.pdf.
214. “Securing America: Solving America’s Oil Dependence Through Innovation.” NRDC issue paper, February 2005.
215. Greene, David L. and Andrea Schafer, Reducing Greenhouse Gas Emissions from U.S. Transportation, Pew Center on Global Climate Change, May 2003.
216. See www.smartgrowthamerica.org for examples of the many benefits of such “smart growth” techniques.
217. Safe, Affordable, Flexible, Efficient, Transportation Equity Act, a Legacy for Users, P.L. 109-59.
218. Bailey, Linda. “Public Transportation and Petroleum Savings in the U.S.: Reducing Dependence on Oil.” ICF International, January 2007. The doubling would be relative to a baseline of 46 billion miles per annum (2004).
219. Parry, Ian. “Is Pay-As-You-Drive Insurance a Better Way to Reduce Gasoline Than Gasoline Taxes?” Resources for the Future, April 2005.
220. A 30 percent reduction in VMT would reduce gasoline use to 70 percent of the baseline. Doubling fuel economy would then cut fuel use in half to 35 percent of baseline. Then, production of biofuels equivalent to 25 percent of baseline gasoline demand would directly displace gasoline use, reducing consumption to 10 percent of baseline gasoline consumption.
221. Cowart, Bill. “Improving Transportation Choices.” NRDC-commissioned study, December 2006.
222. BP Statistical Review Year-End 2005.
223. National Research Council. “Effectiveness and Impact of Corporate Average Fuel Economy (CAFE) Standards.” 2002.