driving high-value care via clinical...
TRANSCRIPT

1
Andrew Buchert, MD
Gabriella Butler, MSN, RN
Driving High-Value Care via Clinical Pathways

2
Gabriella Butler, MSN, RNManager, Clinical Resource Management,
Clinical Analytics, and Data ScienceChildren’s Hospital of Pittsburgh of UPMC
Andrew Buchert, MDMedical Director, Clinical Resource Management
Children’s Hospital of Pittsburgh of UPMC
Assistant Professor of PediatricsUniversity of Pittsburgh School of Medicine

3
Disclosures
• We have no financial conflicts of interest to disclose.
• UPMC utilizes Cerner, Epic, and Qlik software.

4
Goals of this session: • Implement clinical pathways that will lead to critical process
improvement as well as advance the strategic mission of the organization
• Identify measurement tools that integrate outcomes, practice patterns, and cost data to achieve maximum impact of pathways of care
• Develop clinical pathways that span and link the entire continuum of care, including PCP offices and community resources

5
Children’s Hospital of Pittsburgh of UPMC• 315-bed free-standing quaternary care pediatric
hospital - 41 bed ED and Trauma Center- 36 Bed PICU- 12 Bed Cardiac ICU- 55 Bed NICU
• 21,800 Admissions- Inpatient- Observation- Same-Day Surgery Extended Recovery
• 80,000 ED visits
• 23,500 Surgical procedures
• >1 million outpatient visits

6
Primary Care and Referral Network• Children’s Community Pediatrics (CHP)
- 40 locations- More than 150 pediatricians- Primary care- Same-day sick appointments- Embedded behavioral health services
• Children’s Express Care (CHP)- 7 locations- Walk-in, after-hours care- Pediatricians from CCP- Evenings and weekends
• Other pediatric primary care groups- Pediatric Alliance, Kids Plus Pediatrics

7
• More than 30 academic, community, and specialty hospitals in Pennsylvania and New York State
• Hospitals and partnerships in more than 9 countries• Integrated health care delivery and finance system, with a health plan covering
more than 3.2 million members

8

9
High-variability between episodes of care and
across the continuum of care
Limited measurement of reliability to guidelines
Minimal outcomes data
Opportunities to improve patient and family
satisfaction due to perceived care discordance
Quality outcomes, patient safety, satisfaction, and
cost are driven by standardized delivery of care
across the continuum
Delivery of consistent, high-value, evidence-based
care
Meaningful and actionable data available in real-time to frontline caregivers

10

11
Evidenced-based and technology-enabled Clinical Pathways
Pre, during, and post-admission
High-cost and high-volume pediatric conditions
High-Value Care at CHP

12
Desired OutcomesReduce
• Unnecessary variation in care• Unplanned Readmissions• Acute care Length of Stay (LOS)
Improve • Outcomes (Quality, Safety & Financial
metrics)• Continuity of care (pre and post
admission)• Patient, Family & Provider satisfaction
Eliminate • Non-value added testing• Waste

13
DataWarehouse & Clinical Applications
Team
Nursing Informatics
FinanceClinical Champions
Analytics TeamPresident
CMIO/CIO
Manager, Clinical Resource
Management, Analytics, Data
Science
VPMAMedical Director, Clinical Resource
Management

14

15
Clinical Effectiveness Guideline Clinical Pathway
Evidence-Based Evidence and consensus-based
Limited Education Formal education and rollout
Variable interdisciplinary collaboration Inter- and Multi-disciplinary
Focused settings of Care Across the Continuum
Real-time measurement & feedback loop
Strategic Alignment

16
Impact
Health of Patients
Individual Patients
i.e. Reducing readmissions, LOS, infection rates, central
line utilization
Population
i.e. Reduce exposure to unnecessary care, focus on
health promotion & wellness
Organizational Systems of
Care
Processes, workflow, patient flow
i.e. Improving throughput, decrease bed utilization,
enhance medication delivery
Hospital and Health System
Economics
i.e. Improve revenue and decrease at-risk revenue,
reduce variability of controllable costs
Strategy
i.e. Create buy-in for additional pathways, promote and support
service-lines, grow market

17
Evaluation and Selection Process
Decision: Clinical
Pathway or Guideline
Internal Analysis
Peer Benchmarking
Hospital-Peer ALOS
Expected LOS/Observed
Hospital-peer CH CMI (LOS
Based)
Hospital-peer CH CMA LOS
Hospital-Peer LOS
LOS
COST
Volume
Predicting potential impact through the analysis of actual clinical & financial data,
per CHP DataWarehouse, Cost Management System, & PHIS

18
Is this potential pathway practical at this time?• Do we have the capacity?• Would all of the stakeholders have buy-in?
Do we have the resources to support this potential pathway?• To perform an analysis of the current state/weigh pros and cons• To develop and support the pathway - includes data analysis, PowerPlan development &
QlikView dashboard
What evidence is available? • Is this an existing (In-house) clinical effectiveness guideline?• Is there peer-reviewed, published evidence?• Do any of our peer institutions have a clinical pathway or guideline?
Additional Considerations…

19
1 • Idea Generation
2 • Identify Team
3 • Gather Evidence
4 • Design & Development
5 • IT Build
6 • Education & Rollout
7 • Measurement & Feedback
8 • Disseminate Knowledge

20
Process1.
• Idea Generation• What is the projected Impact
• Is it practical?
• Is it the right time?
2.
• Identify Team• Pathway Champions
• Nursing, Physician & Ancillary Stakeholders
3.
• Gather Evidence• Literature Research
• Benchmarking
• Market Survey
4.
• Design & Development• Define Patient Population – Inclusion & Exclusion Criteria
• Define “On” vs “Off Pathway”
• Select KPIs, outcome, and balancing measures

21
Process5.
• IT Build• PowerPlan (Order set)
• Dashboard
• Clinical decision support
6.
• Education and Rollout• Pathway Champions and key stakeholders
• Coordinators and Educators
7.
• Measurement and Feedback• Pathway champions and key stakeholders
• Leaders
• Frontline staff, including nurses, residents, fellows
8.
• Dissemination of Knowledge• Internal and external sharing of process and impact
• Publication
• Patient and family materials

22

23
Physician APhysician BPhysician CPhysician D

24
Physician APhysician BPhysician CPhysician D

25
Physician BPhysician CPhysician DPhysician EPhysician FPhysician GPhysician H
Physician APhysician B
Physician CPhysician DPhysician EPhysician FPhysician GPhysician H
Physician A
Physician B
Physician APhysician B
Physician A
Physician B

26
Complicated Appendicitis
Consensus for Management
Obtained
153155
97
42
0
50
100
150
200
250
300
LOS
(ho
urs
)
Median LOS/month (hours)
Median LOS UCL Average LCL
Consensus for Management Obtained
PowerPlan Available

27
Uncomplicated Appendicitis
3836
28
1817
22
27
32
37
42
47
LOS
(ho
urs
)
Median LOS/Month (hours)
Median LOS UCL Average LCL
Consensus for Management Obtained
PowerPlan Available

28

29
Planned Cholecystectomy
23
27
12
6
11
16
21
26
31
36
LOS
(ho
urs
)
Median LOS/month (hours)
Median LOS/month (hours) UCL Average LCL
Consensus for Management Obtained
PowerPlan Available

30
All Peer Hospitals Select Peer Hospitals CHP
1020 patients out of 3865 (26%) spent at least 1 day in a NICU
171 patients out of 625 (27%) spent at least 1 day in a NICU
41 patients out of 87
(47%) spent at least 1 day in the
NICU
Patients with Principal Dx Hyperbilirubinemia 7/1/14-6/30/15
Isolated Neonatal Hyperbilirubinemia

31
*Represents 78 IHB Patients admitted to the Neonatal Service between
Jan15-April16
**Represents 42 IHB Patients admitted to a General Pediatrics Service between
Jan15-April16
Internal Comparison
54
3733
13
5
15
25
35
45
55
65
Jan
-15
Feb
-15
Mar
-15
Ap
r-1
5
May
-15
Jun
-15
Jul-
15
Au
g-1
5
Sep
-15
Oct
-15
No
v-1
5
De
c-1
5
Jan
-16
Feb
-16
Mar
-16
Ap
r-1
6
LOS
(ho
urs
)
LOS for IHB patients admitted to Neonatal Service*
(includes ED LOS)
32
23
15
5
15
25
35
45
55
65
LOS
(ho
urs
)
LOS for IHB Patients Admitted to General Pediatrics**
(includes ED LOS)

32 *American Academy of Pediatrics, Clinical Practice Guideline, Management of Hyperbilirubinemia in the Newborn
Infant 35 or More Weeks of Gestation, PEDIATRICS Vol. 114 No. 1 July 2004
Maybe the patients we admit to the NICU are sicker?

33
Isolated Neonatal Hyperbilirubinemia
UCL
2723
20
LCL 14
10
15
20
25
30
35
40
45
50A
pr-
15
May
-15
Jun
-15
Jul-
15
Au
g-1
5
Sep
-15
Oct
-15
No
v-1
5
Dec
-15
Jan
-16
Feb
-16
Mar
-16
Ap
r-1
6
May
-16
Jun
-16
Jul-
16
Au
g-1
6
Sep
-16
Oct
-16
No
v-1
6
Dec
-16
Jan
-17
Feb
-17
Mar
-17
Ap
r-1
7
May
-17
Jun
-17
Jul-
17
Au
g-1
7
Sep
-17
Oct
-17
No
v-1
7
LOS
(ho
urs
)Median LOS/Month (hours)
Data1 UCL Average LCL
Consensus for Management Obtained
PowerPlan Available

34
Dissemination of Data
Frontline Staff (Nurses, APPs, Residents, Fellows, Attending Physicians)Clinical ChampionsPhysician Leadership (Division Chiefs, Clinical Directors)Nursing Leadership (Unit Directors, Senior Nurse Leaders)Residency Program LeadershipHospital Leadership

35
Summary Stats
Surgical Pathway Metric FY15 FY16 FY17 FYTD18(July17-Nov17)
Complicated Appendicitis
Pathway
Number of Encounters 125 106 111 62
Percentage of Patients that went to IR Post-Op 23 (18%) 16 (15%) 12 (10%) 6 (9%)
Percentage of Patients "On Pathway" Pre-Op 66% 75% 80% 82%
Percentage of Patients "On Pathway" Post-Op 47% 50% 60% 66%
LOS (hours) 130 hours 101 hours 99 hours 89 hours
Readmissions within 30 days not available not available 15.52% 12.9%
Uncomplicated Appendicitis
Pathway
Number of Encounters 312 338 325 144
Percentage of Patients that went to IR Post-Op 0 0 0 0
Percentage of Patients "On Pathway" Pre-Op 76% 79% 84% 81%
Percentage of Patients "On Pathway" Post-Op 10% 36% 46% 44%
LOS (hours) 33 hours 30 hours 27 hours 28 hours
Readmissions within 30 days not available not available 8.97% 0.7%
Planned Cholecystectomy
Pathway
Number of Encoutners 66 101 90 27
Percentage of Patients "On Pathway" Pre/Intra-Op NA NA 71% 55%
Percentage of Patients "On Pathway" Post-Op NA NA 92% 94%
LOS (hours) 27 hours 26 hours 9.5 hours 9 hours
Readmissions within 30 days not available 6 (6%) 0 0

36
Clinical Condition MetricPre-
PathwayPost-
Pathway Pre vs Post
Complicated Appendicitis
Median Length Of Stay (hours) 117 92 -25 hours 21% decrease
% Patients Requiring Interventional Radiology Procedures Post-Op
17% 11% -6% 35% decrease
Uncomplicated Appendicitis
Median Length of Stay (hours) 32 28 -4 hours 12% decrease
% Patients receiving post-op Antibiotics 13% 9% -4% 31% decrease
Planned Cholecystectomy
Median Length of Stay (hours) 26 9 -17 hours 65% decrease
30-day Readmissions 6% 0% -6%100%
decrease
Isolated Hyperbilirubinemia
Median Length of Stay (Admitted Patients; hours)
32 25 -7 hours 22% decrease
Median Length of Stay (Pts discharged from the ED; minutes)
206 180 -26 min 13% decrease
Cellulitis/Simple Abscess
Admission percentage (based on ED visits) 31% 25% -6% 19% decrease
Imaging Utilization (beyond X-Rays & US) 12% 7% -5% 42% decrease

37
Controllable Cost* Savings
Patient PopulationFY17 Savings per
EncounterNumber of Encounters
Complicated Appendicitis 7.30% 111
Uncomplicated Appendicitis no change 325
Planned Cholecystectomy 15% 90
Cellulitis/Simple Abscess 18% 525
*Actual cost of medications, supplies, lab/radiology studies, nursing care hours, blood products

38
Post-Op Pathway Adherence Nov 17:1 patient did not have a clear liquid diet ordered before they arrived to the inpatient unit
Pre-op Pathway Adherence Nov 17:100% patients had all pre-op elements met
Target: 80%
0%
20%
40%
60%
80%
100%
Jul-
14
Sep
-14
No
v-1
4
Jan
-15
Mar
-15
May
-15
Jul-
15
Sep
-15
No
v-1
5
Jan
-16
Mar
-16
May
-16
Jul-
16
Sep
-16
No
v-1
6
Jan
-17
Mar
-17
May
-17
Jul-
17
Sep
-17
No
v-1
7
Ad
he
ren
ce (
%)
Percentage Adherence to Complicated Appendicitis Pathway (Pre-Op & Post-Op)

39
8
1
0 2 4 6 8 10
Did not receive appropriate*antibiotics within 60 min prior to
surgical incision
NPO not ordered pre-op
Reasons Patients "fell off" Pre-Op PathwayNov17
Target: 80%
0%20%40%60%80%
100%
Ad
her
ence
Pathway Adherence: Uncomplicated Appendicitis Pathway (Pre-Op & Post-Op)
1
4
7
1
1
0
0 5 10
No Order for "Out of Bed" before transferring toacute care
No order for Saline Lock
No Order for Regular or Advanced Diet beforetransferring to Acute Care
Pt did not have PO Narcotics ordered beforetransferring to acute care
Antibiotics were ordered post-operatively
Additional Labs were Collected Post-op
Reasons Patients "fell off" Post-Op PathwayNov 17

40
Cellulitis/Simple Abscess - Nov 2017
Patients "Off Pathway"
Disposition
Imaging Lab
Clindamycin
Route
Appropriate*
Yes = US/X-Ray
only or none
Yes = CBC,
BMP, or none
No = any other
imaging
No = ESR, CRP,
and/or blood
cultures
Patient 1 Discharged from ED Yes No No
Patient 2 Discharged from ED Yes No Yes
Patient 3 Discharged from ED Yes No No

41
Cellulitis/Simple Abscess
173 min
288 min
0
50
100
150
200
250
300
350
400
450
LOS
(min
)
ED Median LOS/month (minutes) n=582
On Pathway Centerline "On Pathway" Off Pathway Centerline "Off Pathway"

42
Cellulitis/Simple Abscess7 Patients with C & A admitted to Pediatrics Service (1 direct, 6 from the ED) in Nov
• 2 (29%) “On pathway”
• 5 (71%) “Off pathway”
1
5
0
0 2 4 6
Imaging: Pt had imaging beyondUS/Xray
Lab: Pt had lab work beyond CBC/BMP,including ESR, CRP and/or Blood…
Clindamycin Route*: IV was giveninstead of PO
Reasons Patients "fell off" Pathway
*Clindamycin • PO is preferred• IV only if:
• NPO • GI symptoms/unable to tolerate PO
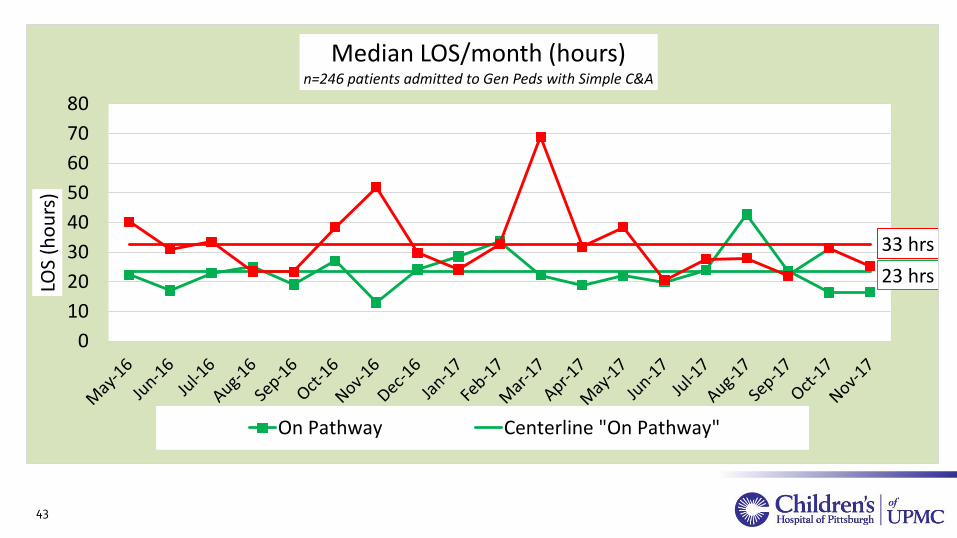
43
Cellulitis/Simple AbscessPatients admitted to the General Pediatrics Service
23 hrs
33 hrs
0
10
20
30
40
50
60
70
80
LOS
(ho
urs
)Median LOS/month (hours)
n=246 patients admitted to Gen Peds with Simple C&A
On Pathway Centerline "On Pathway"

44
Bronchiolitis85 Patients with Bronchiolitis treated and released from the ED
• 53 (62%) “On pathway”
• 32 (38%) “Off pathway”
0
0
20
7
2
2
8
0 5 10 15 20 25
RVP was collected and sent
RSV was Collected and Sent
Patient had Imaging (CXR)
Patient Received Antibiotics
Patient Received Steroids
Deep Nasal Suctioning was Performed
Pt Received Respiratory Treatment
Reasons Patients "fell off" Pathway

45
Bronchiolitis
45
126
162
0
50
100
150
200
250
LOS
(min
)Median ED LOS/month (minutes)
n=1,124 patients with Bronchiolitis
On Pathway Centerline "On Pathway" Off Pathway Centerline "Off Pathway"

46
Bronchiolitis13 Patients with Bronchiolitis admitted to Pediatrics Service from the ED (no direct admissions)
• 3 (23%) “On pathway”
• 10 (77%) “Off pathway”
00
52
32
57
0 1 2 3 4 5 6 7 8
Respiratory Viral Panel Collected
RSV Collected
Patient Had Imaging (CXR)
Patient Received Antibiotics
Patient received Steroids (PO or IV)
Pateint was placed on Continuous Pulse Oximetry on the inpt Unit
Deep Nasal Suctioning was Performed
Patient received Respiratory treatments
Reasons Patients "fell off" Pathway

47
BronchiolitisPatients admitted to the General Pediatrics Service
47
23
20
0
10
20
30
40
50
60
70
LOS
(ho
urs
)Median LOS/month (hours)
n=208 admitted to Gen Peds with Bronchiolitis
On Pathway Centerline "On Pathway" Off Pathway Centerline "Off Pathway"

48
FY 18 Pathways• Cellulitis/Abscess – completed (Aug 1)
• Bronchiolitis – completed (Oct 1)
• Asthma – completed (Nov 1)
• Constipation – Go-live Jan-18
• Diabetes Mellitus – Go-live Feb-18
• Migraine
• Sepsis
• Pyloric Stenosis
• Inpatient brain MRI
• Vascular Access

49
Improving Asthma Care Across the Continuum

50
Improving Asthma Care Across the Continuum
• Create consistency in definitions, workflows, management– When to Step-Up / Step-Down therapy– When to refer
• Improve the patient/family experience– Common educational materials and Action Plan– Appropriate expectation setting
• Enhance communication• Mitigate barriers to optimal health

51

52 Thank you!