driving efficiencies: 6 steps to improving … 6 steps to improving... · driving efficiencies: 6...
TRANSCRIPT
DRIVING EFFICIENCIES:
6 STEPS TO IMPROVING ASSET PERFORMANCE IN MANUFACTURING

INTRODUCTIONThe manufacturing industry is under immense pressure. Globalisation and increased competition, coupled with a more demanding consumer base, force manufacturers to seek new ways to boost the bottom line.
To improve ROI and respond to customer demands for faster supply at a lower cost, many companies are required to run their manufacturing plants 24 hours a day, 7 days a week. They are squeezing every last drop of availability and capacity from their assets.
Given this growing pressure on manufacturing assets, it is crucial for companies to reassess their long term asset management strategies to ensure that they can meet demand both in the short and long term.
He who stops being better, stops being good.
Oliver Cromwell
6So where do you start? What is the journey towards best practice and improved asset performance?
This eBook reveals six key steps you can take to improve asset performance in your organisation.
Step 1: Identify barriers
Step 2: Create a business case for analysis
Step 3: Manage and track against KPIs
Step 4: Collect key data
Step 5: Form an asset performance project team
Step 6: Identify success factors
These key steps typically fall under the responsibility of the Reliability or Plant Engineer. Companies are increasingly recognising the importance of the Reliability Engineer, who is seen as the partner of both Maintenance and Production and helps guide the improvement teams on the journey.

Below are some of the common scenarios found in manufacturing organisations that are struggling to improve asset performance.
BARRIER 1 – Reactive maintenance
Reactive maintenance is characterised by poor equipment performance, unpredicted breakdowns and ongoing minor plant stoppages. The poor condition of the equipment results in quality defects and stoppages, which in turn leads to unexpected production losses and overspend of the maintenance budget. Together, these can cause deficits that run into millions.
BARRIER 2 – No proactive maintenance
When very little or no proactive maintenance exists, a “fire fighting” maintenance regime results, whereby temporary repairs or “band-aid” solutions are regularly applied to keep the equipment running.
BARRIER 3 – Disorganised workshops and stores
The condition of maintenance workshops and stores can pose a real barrier to efficient maintenance practices. Too often, these facilities are untidy and disorganised, which leads to multiple uncontrolled “satellite” stores located around the plant. Ensuring the right spares are readily available and in fit condition becomes nearly impossible under these circumstances.
IDENTIFY BARRIERS
Before you implement strategies to improve the short and long term performance of your most critical assets, you need to identify potential barriers to success.
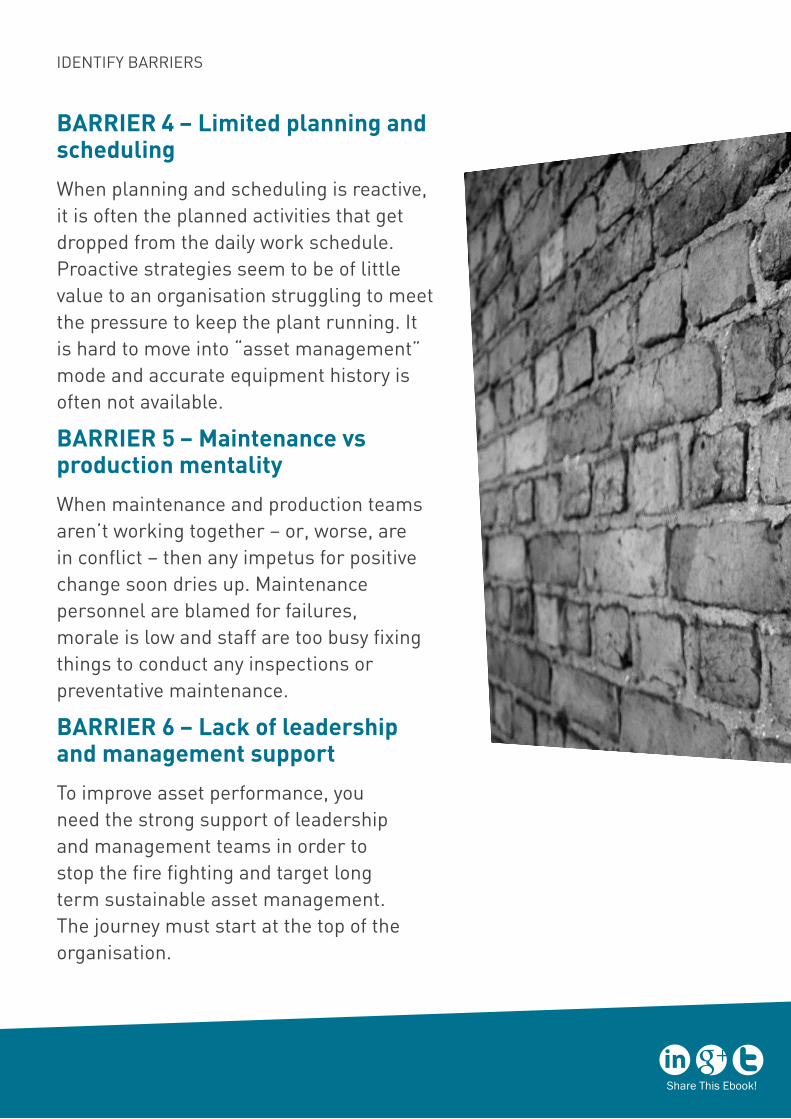
BARRIER 4 – Limited planning and scheduling
When planning and scheduling is reactive, it is often the planned activities that get dropped from the daily work schedule. Proactive strategies seem to be of little value to an organisation struggling to meet the pressure to keep the plant running. It is hard to move into “asset management” mode and accurate equipment history is often not available.
BARRIER 5 – Maintenance vs production mentality
When maintenance and production teams aren’t working together – or, worse, are in conflict – then any impetus for positive change soon dries up. Maintenance personnel are blamed for failures, morale is low and staff are too busy fixing things to conduct any inspections or preventative maintenance.
BARRIER 6 – Lack of leadership and management support
To improve asset performance, you need the strong support of leadership and management teams in order to stop the fire fighting and target long term sustainable asset management. The journey must start at the top of the organisation.
IDENTIFY BARRIERS

CREATE A BUSINESS CASE FOR ANALYSIS
2
This is one of the most common phrases cited by maintenance and reliability professionals.
The adage holds true when it comes to asset performance. If you don’t know your current performance measures – or you don’t know if they are good or bad – then you have no way of knowing how or what to improve.
Industry benchmarking is a useful method for assessing your company’s performance.
This basically compares your company to your competitors, or those with similar performance measures. Benchmarking is a great starting point on the road to asset improvement, as it helps you identify best practices – and the gap gives you something to work towards.
EXERCISE: Calculate your maintenance budget savings
Estimate what percentage of maintenance work is performed in a reactive manner. That is, the condition of equipment has unexpectedly deteriorated and needs work to restore it to a fit condition for continued service.
Apply that percentage to the total maintenance spend to calculate the annual spend on reactive maintenance. Now multiply this by two thirds to find out how much of the maintenance budget can be saved or spent on improvement activities.
CREATE A BUSINESS CASE FOR ANALYSIS
“If we don’t measure it, how can we improve it?”
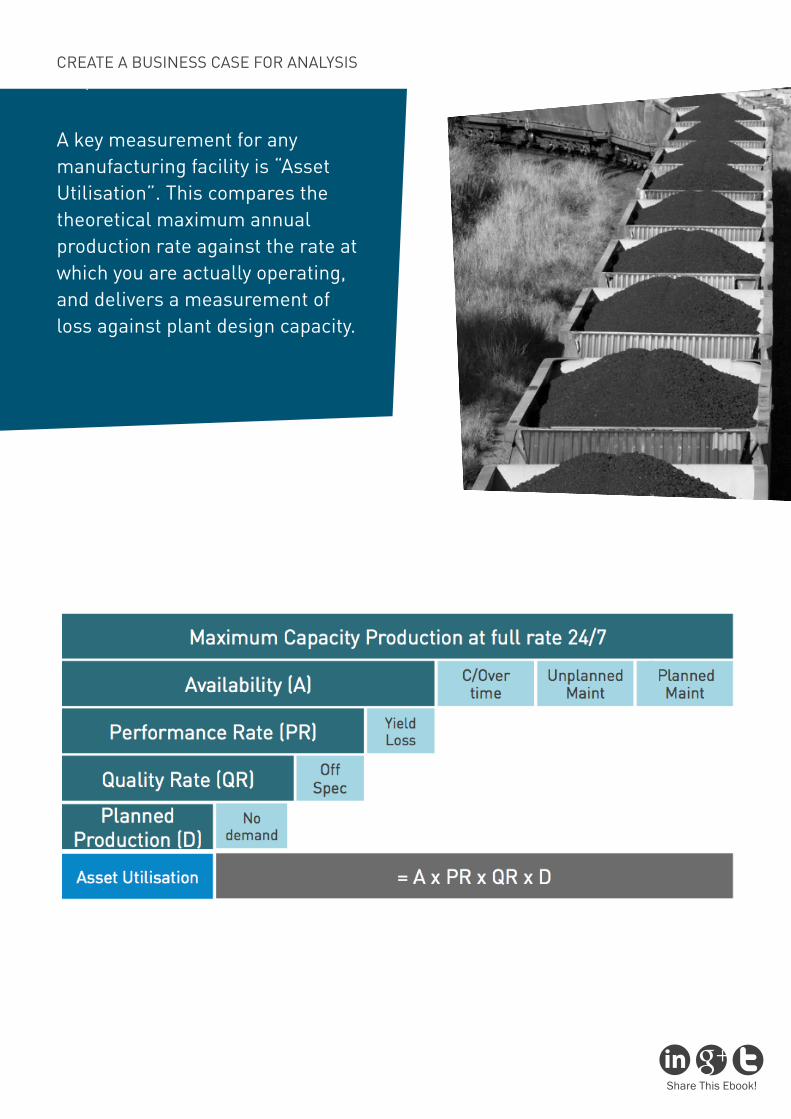
A key measurement for any manufacturing facility is “Asset Utilisation”. This compares the theoretical maximum annual production rate against the rate at which you are actually operating, and delivers a measurement of loss against plant design capacity.
CREATE A BUSINESS CASE FOR ANALYSIS
CREATE A BUSINESS CASE FOR ANALYSIS
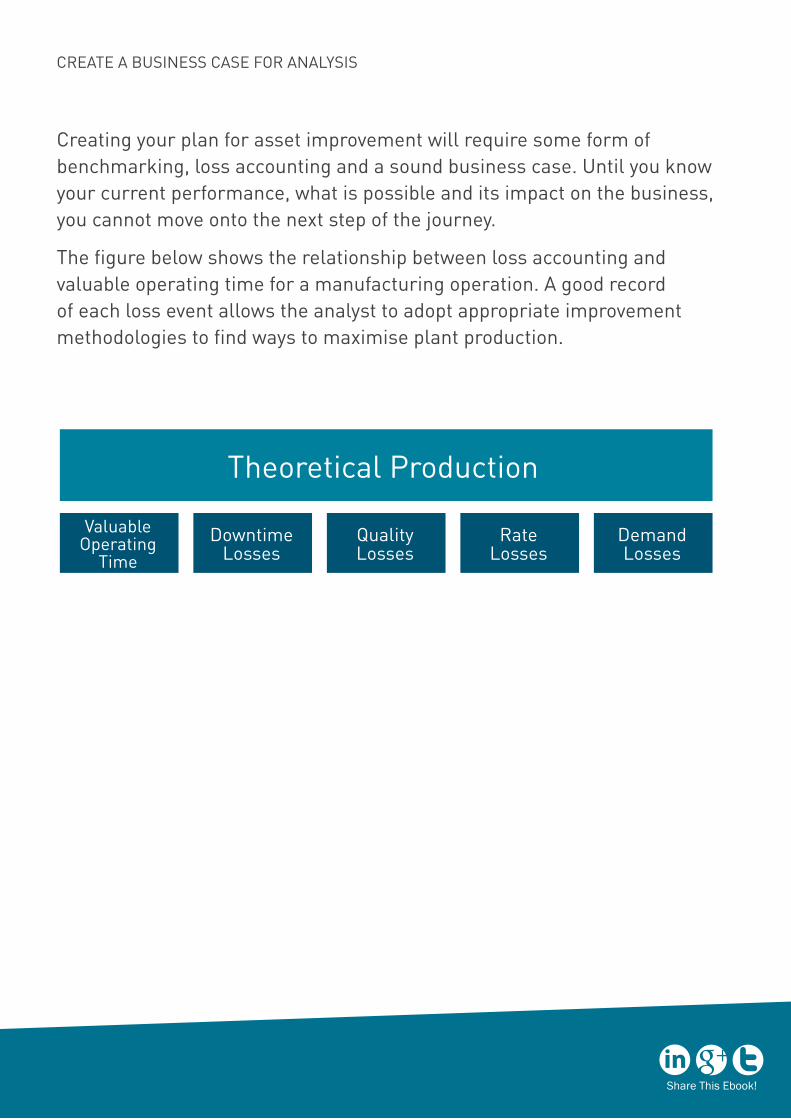
Creating your plan for asset improvement will require some form of benchmarking, loss accounting and a sound business case. Until you know your current performance, what is possible and its impact on the business, you cannot move onto the next step of the journey.
The figure below shows the relationship between loss accounting and valuable operating time for a manufacturing operation. A good record of each loss event allows the analyst to adopt appropriate improvement methodologies to find ways to maximise plant production.
Theoretical Production
Valuable Operating
TimeDowntime
LossesQualityLosses
Rate Losses
Demand Losses
CREATE A BUSINESS CASE FOR ANALYSIS
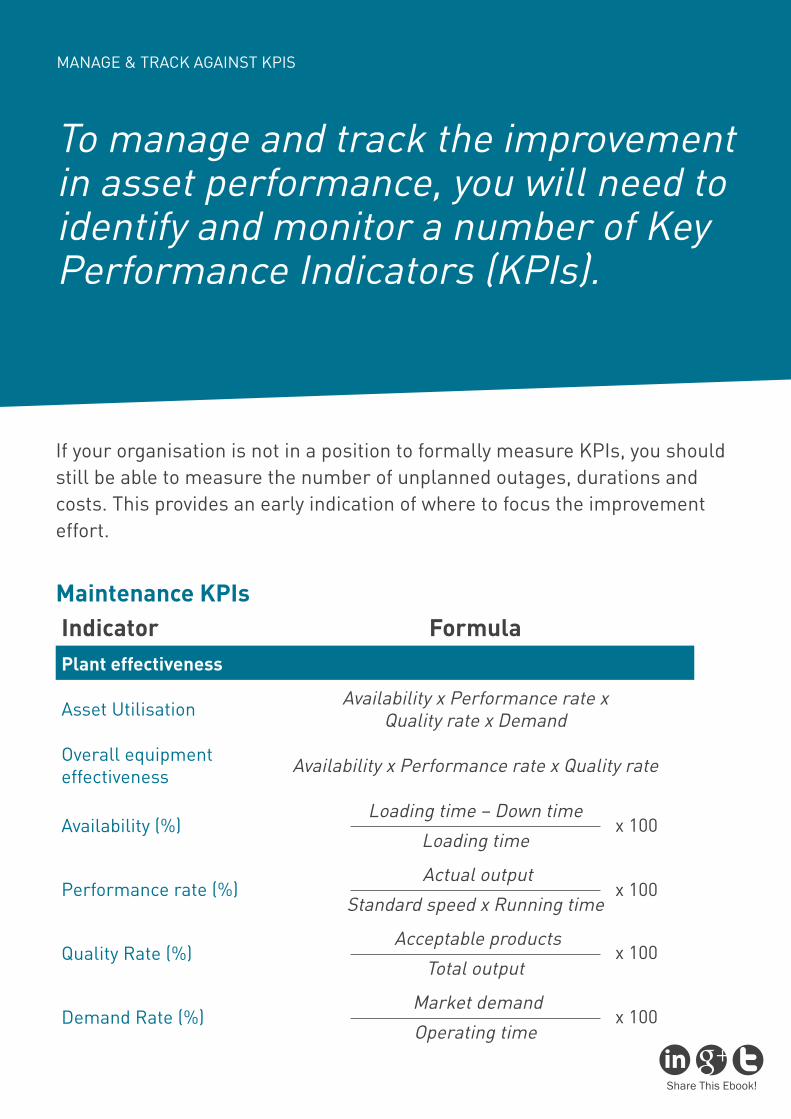
If your organisation is not in a position to formally measure KPIs, you should still be able to measure the number of unplanned outages, durations and costs. This provides an early indication of where to focus the improvement effort.
Maintenance KPIsIndicator FormulaPlant effectiveness
Asset Utilisation Availability x Performance rate x Quality rate x Demand
Overall equipment effectiveness Availability x Performance rate x Quality rate
Availability (%)Loading time – Down time
Loading time
Performance rate (%) Actual output
Standard speed x Running time
Quality Rate (%) Acceptable products
Total output
Demand Rate (%) Market demand
Operating time
To manage and track the improvement in asset performance, you will need to identify and monitor a number of Key Performance Indicators (KPIs).
MANAGE & TRACK AGAINST KPIS
x 100
x 100
x 100
x 100
MANAGE & TRACK AGAINST KPIS
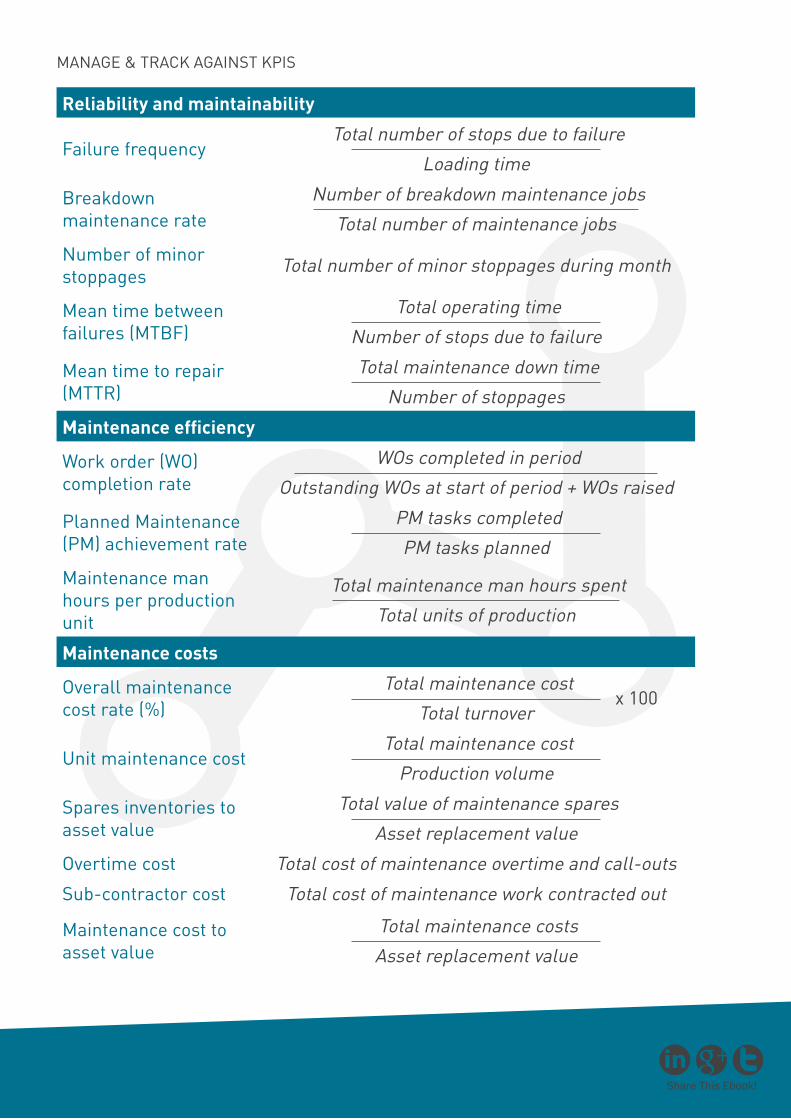
Reliability and maintainability
Failure frequency Total number of stops due to failure
Loading time
Breakdown maintenance rate
Number of breakdown maintenance jobs
Total number of maintenance jobs
Number of minor stoppages Total number of minor stoppages during month
Mean time between failures (MTBF)
Total operating time
Number of stops due to failure
Mean time to repair (MTTR)
Total maintenance down time
Number of stoppages
Maintenance efficiency
Work order (WO) completion rate
WOs completed in period
Outstanding WOs at start of period + WOs raised
Planned Maintenance (PM) achievement rate
PM tasks completed
PM tasks planned
Maintenance man hours per production unit
Total maintenance man hours spent
Total units of production
Maintenance costs
Overall maintenance cost rate (%)
Total maintenance cost
Total turnover
Unit maintenance cost Total maintenance cost
Production volume
Spares inventories to asset value
Total value of maintenance spares
Asset replacement value
Overtime cost Total cost of maintenance overtime and call-outs
Sub-contractor cost Total cost of maintenance work contracted out
Maintenance cost to asset value
Total maintenance costs
Asset replacement value
x 100
CREATE A BUSINESS CASE FOR ANALYSIS
Most organisations find that the collection of data centres on two fundamental resources – log sheets and the work order history.
Operator log sheets or e-logs
The main source of production-related information is the production log sheet or e-log.
Use this to collect data on:
• Daily production
• Downtime (type and duration)
• Problems experienced (functional failures)
• Rejected product
It is important from a reliability perspective that the categories of downtime are captured in enough detail so that the Reliability Engineer can make informed decisions in regards to asset performance.
Once the maintenance KPIs have been identified, plan and develop your key data collection mechanisms so you’ve got something to measure your KPIs against.
COLLECT KEY DATA
COLLECT KEY DATA
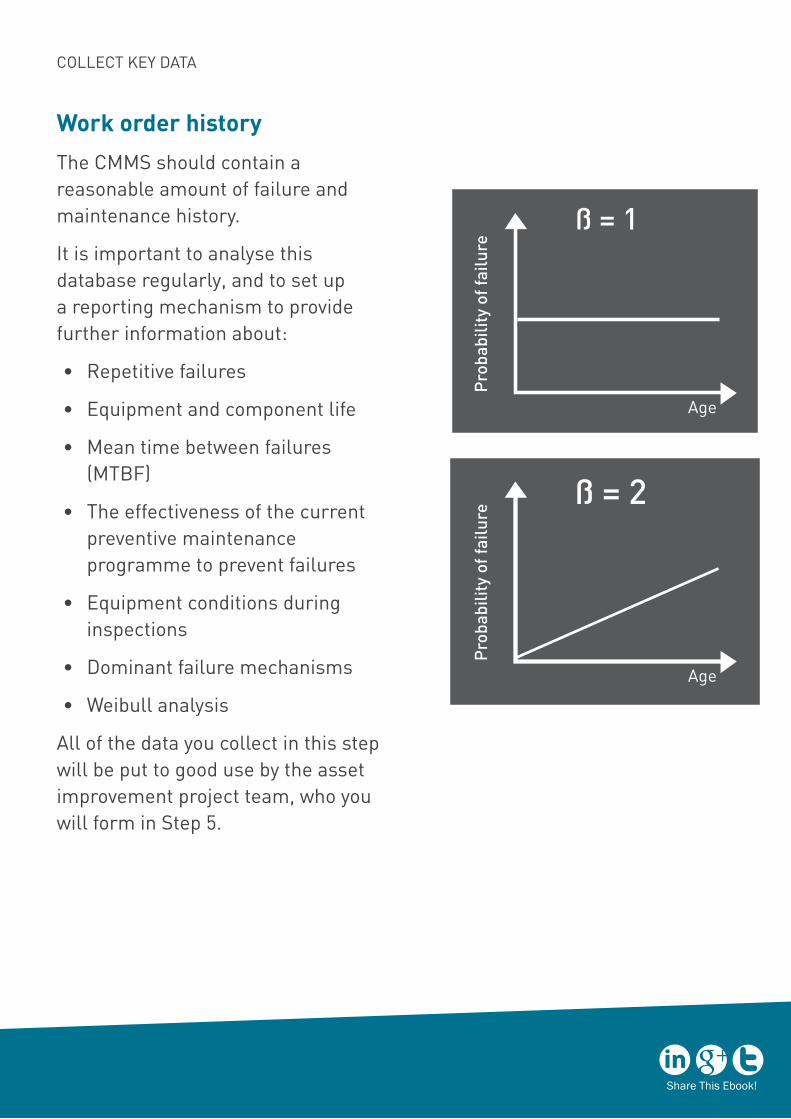
Work order history
The CMMS should contain a reasonable amount of failure and maintenance history.
It is important to analyse this database regularly, and to set up a reporting mechanism to provide further information about:
• Repetitive failures
• Equipment and component life
• Mean time between failures (MTBF)
• The effectiveness of the current preventive maintenance programme to prevent failures
• Equipment conditions during inspections
• Dominant failure mechanisms
• Weibull analysis
All of the data you collect in this step will be put to good use by the asset improvement project team, who you will form in Step 5.
ß = 1
Pro
babi
lity
of fa
ilure
Age
ß = 2P
roba
bilit
y of
failu
re
Age
FORM AN ASSET PERFORMANCE PROJECT TEAM
5
CREATE A BUSINESS CASE FOR ANALYSIS
Asset performance project teams are made up of production, maintenance, reliability, procurement and design personnel. Some members will be full time, some part time.
Whatever the make-up of your team, ensure that the entire team adheres to the following:
• Strong leader
• Full understanding of roles and responsibilities
• Work to a detailed asset improvement plan (the journey)
• Measures for success
• Team mission statement
• Regular, clear communication with all site employees
Appoint a strong leader, bring in people from key areas within your organisation, and provide solid support for all team members.
FORM AN ASSET PERFORMANCE PROJECT TEAM
FORM AN ASSET PERFORMANCE PROJECT TEAM
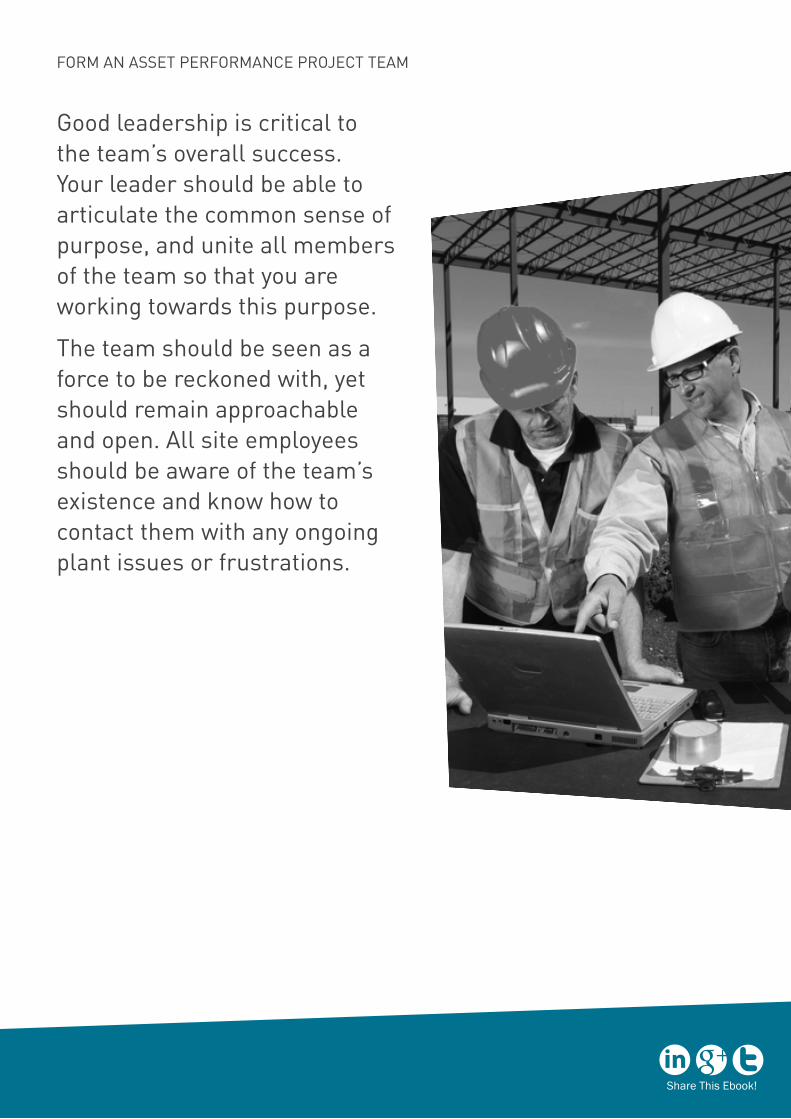
Good leadership is critical to the team’s overall success.Your leader should be able to articulate the common sense of purpose, and unite all members of the team so that you are working towards this purpose.
The team should be seen as a force to be reckoned with, yet should remain approachable and open. All site employees should be aware of the team’s existence and know how to contact them with any ongoing plant issues or frustrations.

CREATE A BUSINESS CASE FOR ANALYSIS
More specifically, there are three key success factors for any asset improvement program:
• Loss elimination
• Risk management
• Life cycle asset management
These success factors are typically the responsibility of the Reliability Engineer.
Loss elimination
This involves tracking production losses and assets with high maintenance costs, and then finding ways to reduce those losses or high costs. Efforts should be focused on the largest and most critical opportunities. Once these have been identified, develop an action plan to eliminate or reduce the losses through root cause analysis, seek approval, and implement the solutions. Most importantly, track the implementation and report on its status regularly.
The goal in improving asset performance is simple. To enhance the overall operations of the plant or facility and improve business performance.
IDENTIFY SUCCESS FACTORS
IDENTIFY SUCCESS FACTORS
Risk management
Better manage the risk of your strategic objectives in the areas of Health, Safety and Environment (HSE), quality, production and reputation.
Common tools to identify and reduce risk include:
• FMEA – Failure modes and effects analysis
• FMECA – Failure modes, effects and criticality analysis
• VAA – Vulnerability assessment and analysis
• RCM – Reliability centred maintenance
• RBD – Reliability block diagram
• LCC – Life cycle cost
• FTA – Fault tree analysis
Life cycle asset management
Studies show that as much as 95% of the total life cycle cost (LCC) of an asset is determined before it is put into use. With this in mind, the Reliability Engineer should be involved in the design and installation stages for new assets and modification of existing assets.
SUMMARY
For manufacturing companies to rise above the growing pressures from customers and shareholders, they must begin the journey towards improved asset performance.
Remember, the road to world-class asset performance is a never-ending process of continuous improvement. As this eBook reiterates, it is a journey – one that benefits from a clear roadmap so that you know the direction in which you are travelling, and you can measure success along the way.
To be sure, problems will be encountered along the way. This is to be expected. How you overcome these problems, and how you encourage innovation and excellence, is the true measure of how far you have come.
About ARMS ReliabilitySince 1995, ARMS Reliability has been at the forefront of proactive asset management strategies for a range of blue chip companies throughout the world. These companies have entrusted us with delivering business goals through effective asset management and improvements in operational productivity.
ARMS Reliability is a service, software, and training organisation providing a “one stop shop” for Reliability Engineering, RAMS, and Maintenance Optimisation for both new and existing projects.
If you would like to discuss your situation and what the essential elements are to achieving best practice Asset Management in your organisation, then give ARMS Reliability a call or
ENQUIRE NOW
DOWNLOAD
Free Whitepaper: Towards Best Practice Asset ManagementLearn what methods will ensure effective maintenance of your assets and maximise bottom line delivery.
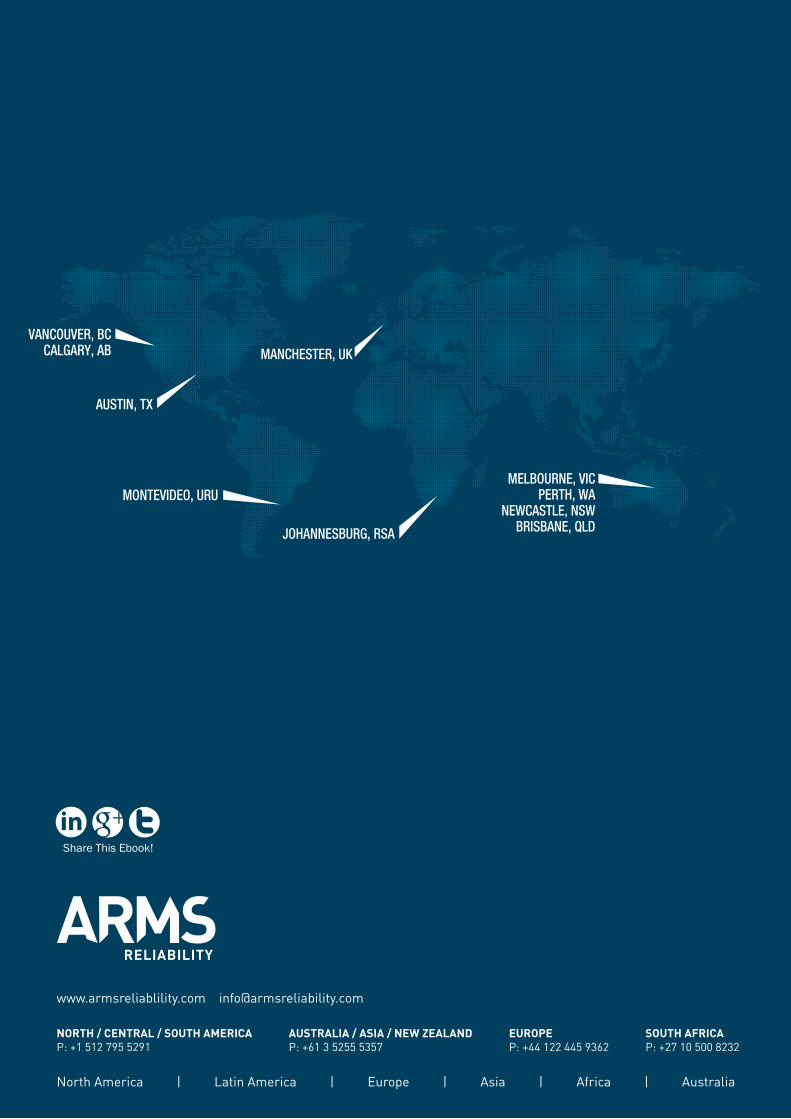
North America | Latin America | Europe | Asia | Africa | Australia
www.armsreliablility.com [email protected]
NORTH / CENTRAL / SOUTH AMERICAP: +1 512 795 5291
AUSTRALIA / ASIA / NEW ZEALANDP: +61 3 5255 5357
EUROPEP: +44 122 445 9362
SOUTH AFRICAP: +27 10 500 8232
JOHANNESBURG, RSA
MONTEVIDEO, URU
MANCHESTER, UK
MELBOURNE, VICPERTH, WA
NEWCASTLE, NSWBRISBANE, QLD
AUSTIN, TX
VANCOUVER, BCCALGARY, AB