driving down lane-departure crashes - aashto
TRANSCRIPT


page
�
8 Ways You Can Save Lives1. Ensure that your Strategic Highway Safety Plan (SHSP) is a living
document
2. Develop action strategies to implement your SHSP and provide
appropriate resources for safety, including staff, dollars, and policies
3. Assign a multidisciplinary champion for safety
4. Conduct weekly/monthly safety program meetings with your
safety staff/team
5. Share safety expectations with key management staff
6. Establish safety as a leadership performance measure
7. Provide safety program assistance to local governments
8. Fully utilize all funding resources available for safety
© 2008 by the American Association of State Highway and Transportation Officials. All rights reserved. Duplication is a violation of applicable law.

page
�
Dear Friends,
As you turn the pages of Driving Down Lane Departure Crashes—A National Priority, think
of this. By the time you have finished reading this report, one more person will have died as a result
of a run-off-the-road crash. Every 21 minutes a highway death occurs from lane departure.
All of us within the state Departments of Transportation have a responsibility for improving
the safety of people on our roads, but some states have emerged, through top level leadership, as true
champions. As shown throughout this report, they have implemented systematic, low-cost improve-
ments that have resulted in dramatic reductions in crashes and fatalities. It is something you can do
in your own state beginning right now.
A key concept here is a systematic approach. Oftentimes we act to improve a high-incident
location, when there may be another identical situation elsewhere on our system. The improvements
described in this report are most effective when they are applied throughout the highway system, as a
means to prevent future crashes from occurring.
While this report highlights a number of remedies for keeping drivers on the road, the es-
sential ingredient in improving our safety record is your commitment as the leader of a state depart-
ment of transportation. Through AASHTO we have set an aggressive goal to reduce the nation’s cur-
rent level of highway fatalities by 1,000 every year for the next two decades. That will reduce highway
deaths by half, on our way to the ultimate goal of eliminating them entirely.
We have many partners in this campaign—law enforcement, emergency services, educators,
and safety advocates. You can be the catalyst that, working with them, sets in motion a highway safety
program that delivers more than promises, it delivers a son, a daughter, a family to their home at the
end of a journey alive and well. Make that commitment today.
Pete K. Rahn, President
© 2008 by the American Association of State Highway and Transportation Officials. All rights reserved. Duplication is a violation of applicable law.
page
�
Illinois has continued to see a downward trend in traffic-related
fatal crashes, in particular for roadway departure crashes. Key to this
success has been Illinois’ multi-disciplined approach to implement
corridor and systematic improvements. This has entailed retrofitting of
milled rumble strips, upgrading guardrail, and installing median cable
rail on Illinois freeways. Also, IDOT has funded an Illinois State Police
Motorcycle Patrol program to implement strict speed enforcement on
Illinois freeways to further reduce roadway departure crashes related
to speed. On rural two-lane roads, increased use of chevron signs
to mark sharp curves and widening of paved shoulders at selected
locations, especially curves have been cost-effective safety measures.
Milton R. Sees, SecretaryIllinois Department of Transportation
“
”© 2008 by the American Association of State Highway and Transportation Officials. All rights reserved. Duplication is a violation of applicable law.
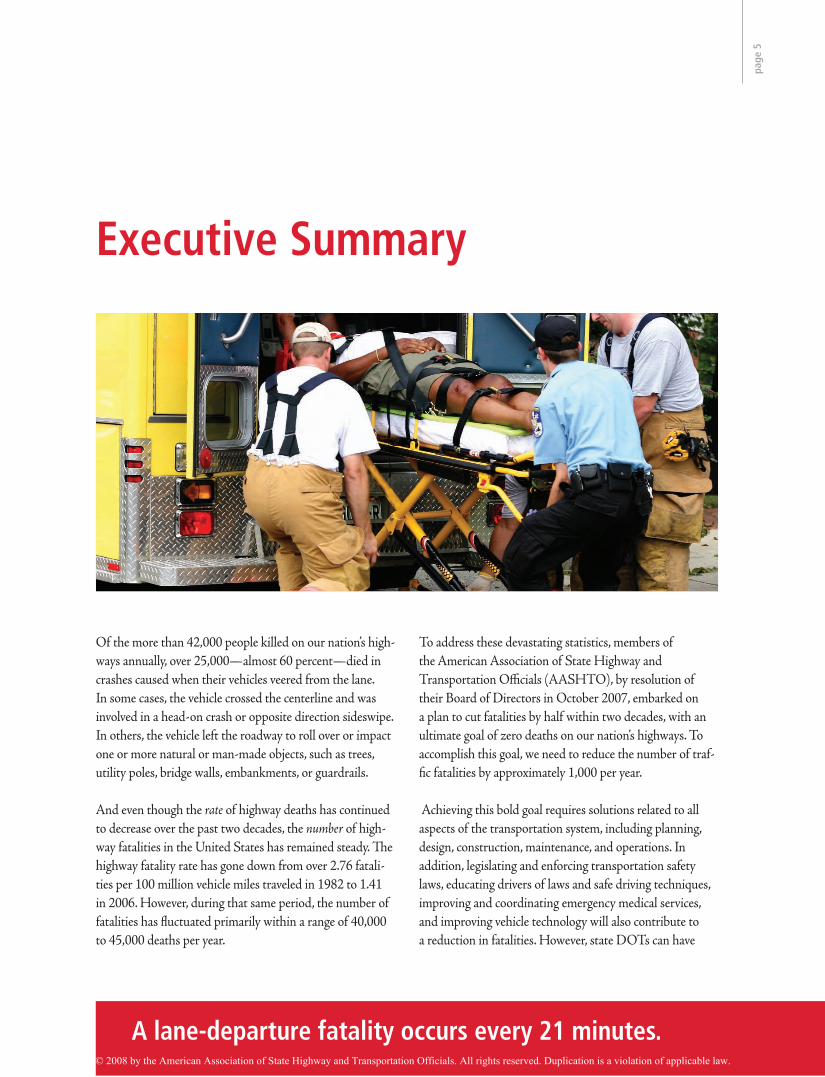
Of the more than 42,000 people killed on our nation’s high-ways annually, over 25,000—almost 60 percent—died in crashes caused when their vehicles veered from the lane. In some cases, the vehicle crossed the centerline and was involved in a head-on crash or opposite direction sideswipe. In others, the vehicle left the roadway to roll over or impact one or more natural or man-made objects, such as trees, utility poles, bridge walls, embankments, or guardrails.
And even though the rate of highway deaths has continued to decrease over the past two decades, the number of high-way fatalities in the United States has remained steady. The highway fatality rate has gone down from over 2.76 fatali-ties per 100 million vehicle miles traveled in 1982 to 1.41 in 2006. However, during that same period, the number of fatalities has fluctuated primarily within a range of 40,000 to 45,000 deaths per year.
To address these devastating statistics, members of the American Association of State Highway and Transportation Officials (AASHTO), by resolution of their Board of Directors in October 2007, embarked on a plan to cut fatalities by half within two decades, with an ultimate goal of zero deaths on our nation’s highways. To accomplish this goal, we need to reduce the number of traf-fic fatalities by approximately 1,000 per year.
Achieving this bold goal requires solutions related to all aspects of the transportation system, including planning, design, construction, maintenance, and operations. In addition, legislating and enforcing transportation safety laws, educating drivers of laws and safe driving techniques, improving and coordinating emergency medical services, and improving vehicle technology will also contribute to a reduction in fatalities. However, state DOTs can have
Executive Summary
page
�
A lane-departure fatality occurs every �1 minutes.© 2008 by the American Association of State Highway and Transportation Officials. All rights reserved. Duplication is a violation of applicable law.

page
�
an immediate impact on fatal and injury crash reduction through low-cost, quick implementation, highway infra-structure improvements—and further still, by focusing a concerted effort on lane-departure crashes, which are such a substantial portion of all fatal crashes. Our highway system must be engineered, operated, and maintained to help pre-vent crashes and to minimize the consequences and severity of those that do occur.
Several states have already recognized the benefits of spe-cifically addressing lane-departure crashes and have taken countermeasures to prevent them. This report focuses on how these state DOTs have made simple safety improve-ments to prevent lane and roadway departures, minimize the likelihood of a crash when a departure occurs, and reduce the severity of crashes.
0
5,000
10,000
15,000
20,000
25,000
30,000
35,000
40,000
45,000
50,000
0
0.5
1.0
1.5
2.0
2.5
3.0
3.5
4.0
4.5
Num
bero
fFat
aliti
es
1982 1986 1990 1994 1998 2002 2006Year
Motor Vehicle Fatalities
Fatalities Fatality Rate
Fatality Rate per 100 M
illion Vehicle Miles
Motor Vehicle Fatalities
© 2008 by the American Association of State Highway and Transportation Officials. All rights reserved. Duplication is a violation of applicable law.
page
�
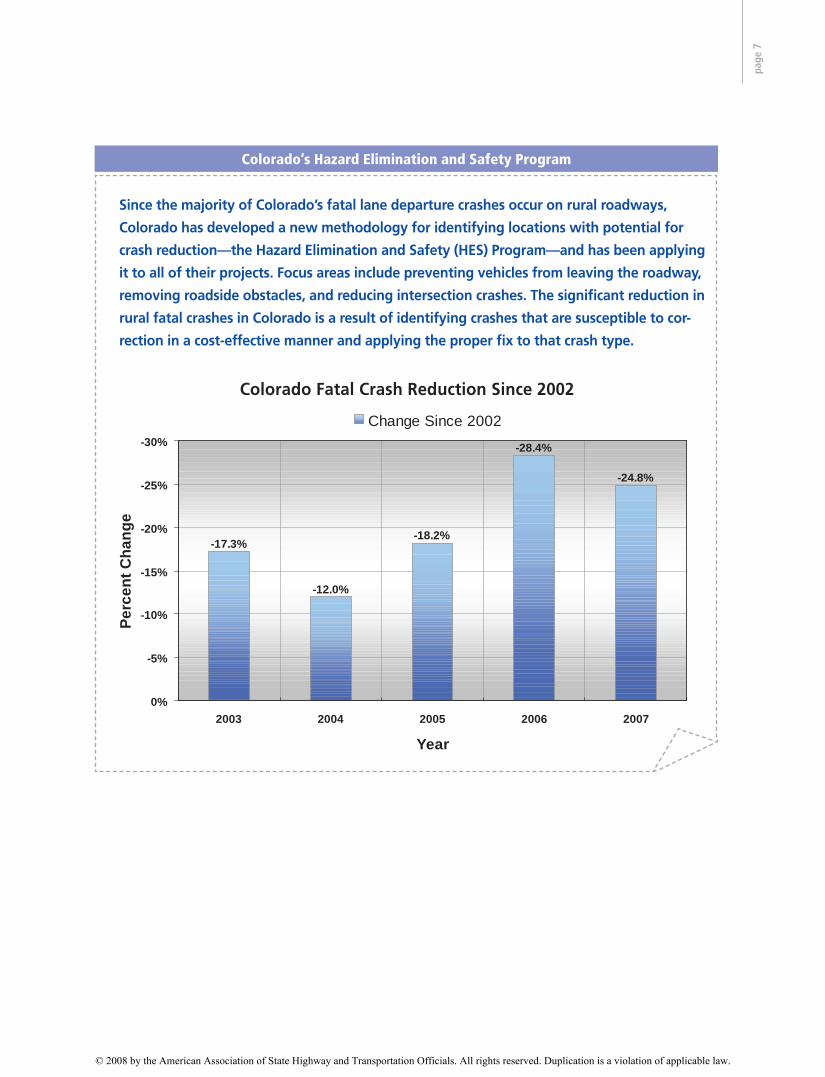
Colorado Fatal Crash Reduction Since 2002
-12.0%
-18.2%
-24.8%
-28.4%
-17.3%
-30%
-25%
-20%
-15%
-10%
-5%
0%2003 2004 2005 2006 2007
Year
Perc
entC
hang
e
Change Since 2002
Since the majority of Colorado’s fatal lane departure crashes occur on rural roadways,
Colorado has developed a new methodology for identifying locations with potential for
crash reduction—the Hazard Elimination and Safety (HES) Program—and has been applying
it to all of their projects. Focus areas include preventing vehicles from leaving the roadway,
removing roadside obstacles, and reducing intersection crashes. The significant reduction in
rural fatal crashes in Colorado is a result of identifying crashes that are susceptible to cor-
rection in a cost-effective manner and applying the proper fix to that crash type.
Colorado Fatal Crash Reduction Since 2002
Colorado’s Hazard Elimination and Safety Program
© 2008 by the American Association of State Highway and Transportation Officials. All rights reserved. Duplication is a violation of applicable law.

page
�
Progress has been made over the past 25 years to reduce the highway fatality rate from 2.76 fatalities per 100 million vehicle miles traveled in 1982 to 1.41 in 2006. However, while this improvement is substantial, there are still some 42,000 deaths every year in the United States due to motor vehicle crashes. Almost 60 percent of these fatalities involve vehicles leaving their lane
and crashing and, of these, more than half result from vehicles leaving the road and overturning or hitting fixed objects, such as trees or utility poles.
Recognizing the need to address this challenge, national safety leaders gathered in 1996 to develop a strategic plan for preventing injuries and saving lives.
Introduction
In South Dakota, vehicle roadway departures result in more fatalities than all other crash
types. As a contributing cause to fatal crashes, it is second only to drinking drivers. The
vast majority of the roadway departures are single-vehicle events.
Source: South Dakota Strategic Highway Safety Plan.
South Dakota Statistics
© 2008 by the American Association of State Highway and Transportation Officials. All rights reserved. Duplication is a violation of applicable law.

page
�
AASHTO, along with the Federal Highway Administration (FHWA), the National Highway Traffic Safety Administration (NHTSA), and the Transportation Research Board, convened a meeting of national safety experts representing driver, vehicle, and highway issues. Together, they produced the AASHTO Strategic Highway Safety Plan (SHSP), which identifies 22 goals to pursue to achieve a significant reduction in highway crash fatalities. One of the hallmarks of the plan is to approach safety problems in a comprehensive manner.
The SHSP provides guidance and direction for the national deployment of effective countermeasures in areas where they can have the greatest im-pact. To advance its implementation, the National Cooperative Highway Research Program (NCHRP) developed a series of Implementation Guides published collectively as NCHRP Report 500. Each guide provides definitive information—data, strategies, countermeasures, and supporting documentation—for each emphasis area in the broad arenas of
Missouri has not solved
the problem of highway
fatalities, but we are
taking major steps and
producing tremendous
results in driving down
the number of people
dying on our roadways. Pete Rahn, Director,
Missouri DOT
“
”
Missouri DOT has focused on lane departure coun-
termeasures over the past three years, resulting in a
25 percent reduction in lane departure related fatali-
ties from 2005 to 2007. System-wide safety solutions
they incorporated include:
• Requiring a minimum four-foot paved shoulder
on major roads
• Providing edge line and centerline rumble stripes
for all major roads, as well as for minor roads
with a history of crashes
• Using six-inch stripes for all edge line and multi-
lane skips on all major roads
• Using curve speed plaques for every curve/turn
sign to indicate appropriate speeds
• Providing guardrail and median guard cable de-
lineation on major roads
• Installing emergency reference markers every
0.2 miles on Interstates
• Upgrading signs for better visibility
Missouri’s System-Wide Safety Solutions
AASHTO’s Goal: Cut fatalities by half within two decades.© 2008 by the American Association of State Highway and Transportation Officials. All rights reserved. Duplication is a violation of applicable law.

page
10
drivers, special highway users, vehicles, highways, emer-gency management services, and management.
In 2003, AASHTO launched a “Lead States” initia-tive to help identify proven, cost-effective strategies for national deployment. States volunteered to develop comprehensive highway safety plans addressing one or more emphasis areas identified in the SHSP. Their plans establish specific statewide goals for reducing fatalities in one or more emphasis areas—by a certain number and within a specific time frame—using strategies that are cost-effective and acceptable to the public. From the results achieved in these states, all states will gain a bet-ter understanding of strategies effective for addressing specific highway safety challenges.
Further, at the AASHTO Annual Meeting in October 2007, the Board of Directors passed a resolution with
a goal to cut in half the number of highway fatalities within two decades. In order to achieve the newly ad-opted goal, DOTs are adapting and implementing their SHSPs with this goal in mind. Using the NCHRP 500 Series reports and other innovative improvements, states have made significant reductions in crashes and fatalities, in many cases with relatively low costs.
The purpose of this report is to highlight low-cost, quick-implementation strategies transportation agencies can use to reduce lane-departure collisions and result-ing injuries and fatalities. Based on examples from states that have successfully implemented these efforts, states can evaluate effective countermeasures and be proactive in achieving the goal of halving fatalities in two decades and moving toward zero fatalities.
In 2005, lane-departure-related crashes in Tennessee accounted for over 833 fatalities,
approximately 66 percent of all the fatalities statewide.
Source: Tennessee Strategic Highway Safety Plan
Traffic Fatalities in Lane Departure Crashes950
900
850
800
750
700
70%
68%
66%
64%
62%
60%
Lane Departure Fatalities % Lane Departure Fatalities
2001 2002 2003 2004 2005
Tennessee Statistics
© 2008 by the American Association of State Highway and Transportation Officials. All rights reserved. Duplication is a violation of applicable law.

page
11
OVERVIEW
Nearly 4 out of every 10 fatal motor vehicle crashes—over 16,000 a year—involve a single vehicle leaving its lane and/or the roadway, and there are more than twice
as many fatal lane-departure crashes on rural roads than on urban roads. Some 42 percent of fatal lane departure crashes occur on curves (50 percent in rural areas), and the life-threatening events most likely to occur are roll-overs (42 percent) and collisions with trees (25 percent).
Keeping Drivers on the Road
MA 279
778583
331
38
146
302
160
144762
533 628
693
763
281
1,911
378
286
608267 NJ 276
CT 191
NH 93
1,099
940
Lane Departure Fatalities – 2006Source: FARS/NHTSA
DC 7
DE 102
RI 49
PR 276585256
296150
214
2,158
165
195
141
64
706
450
429
498
641
762
859
608
1,047
MD 403
1,383
94
VT 74
0 – 250 251 – 500 501 – 1,0001,001+
Number of Lane Departure
Fatalities:
Total Lane Departure Fatalities: 25,082
Lane-Departure Fatalities—2006Total Nationwide: 25,082
Reducing lane-departure fatalities by just five percent in one year will save 1,��0 lives,
AASHTO’s first-year goal toward cutting fatalities by half in �0 years.© 2008 by the American Association of State Highway and Transportation Officials. All rights reserved. Duplication is a violation of applicable law.

page
1�
Reducing the likelihood that a vehicle will leave the roadway through such roadway design strategies as flattening curves and installing shoulder rumble strips can prevent deaths and injuries resulting from roadway departure crashes. In addition, when a vehicle does encroach on the roadside, fatalities and injuries can be reduced if the agency minimizes the likelihood of the vehicle overturning or crashing into an object, or can reduce the severity of the crash.
Thus, the three key objectives in reducing the number of fatalities attributable to roadway departure crashes are:
1. Keep vehicles in their lanes and on the road.2. Minimize the likelihood of crashing into an object
or overturning if the vehicle travels off the shoulder.3. Reduce the severity of the crash.
The first objective—keeping the vehicle in its lane and on the road—includes ways to communicate with the driver, but also includes strategies that target specific highway design features, such as shoulder drop-offs and pavements with low skid resistance.
The second objective—minimizing the likelihood of a crash when the vehicle leaves the roadway—includes strategies that focus on the roadside, especially that of higher-speed rural roads. Crash data analyses show that two-lane rural roadways are particularly vulnerable to roadway departure crashes because they do not have paved shoulders and wider, more forgiving clear zones.
Finally, the third objective–reducing the severity of the crash–includes vehicle design, restraint features, and the design of roadside features and geometry. While increased use of in-vehicle restraints would likely provide the greatest benefit, our emphasis is on roadway-related improvements.
MA 65%
64% 59%
69%
51%
78%
74%
59%
74%52%
70% 61%
76%
61%
60%
55%
60%
58%
56%61% NJ 36%
CT 63%
NH 73%
70%
56%
Lane Departure Fatalities – 2006Source: FARS/NHTSA
DC 19%
DE 69%
PR 54%
RI 60%
45% 53%
55%52%
50%
51%
62%
74%
74%
58%
64%
68%
59%
55%
70%
62%
67%
63%
69%
MD 62%
58%
VT 85%
0% – 50%51% – 60% 61% – 70%71%+
Lane Departure Fatalities as a Percent
of Total Fatalities:
25,082 Lane Departure Fatalities= 58% of Total Fatalities
41%
Lane-Departure Fatalities—200625,082 Lane-Departure Fatalities = 58 percent of Total Fatalities
© 2008 by the American Association of State Highway and Transportation Officials. All rights reserved. Duplication is a violation of applicable law.

page
1�
REDUCINg LANE DEPARTURES
Preventing a vehicle from leaving its lane, or leaving the roadway entirely, is the first goal of highway safety engi-neers. While this may not eliminate crashes with other vehicles or pedestrians, it can eliminate many fatalities that result when a vehicle strays from the lane onto the roadside or into oncoming traffic.
Quick-Implementation Strategies for Reducing Lane and Roadway Departures• Provide shoulder and/or centerline rumble strips• Enhance delineation of sharp curves• Remove or relocate objects • Eliminate shoulder drop-offs• Provide skid-resistant pavements
There are several low-cost, quick-implementation strategies that can help keep vehicles on the road and in their lanes:
Rumble StripsRumble strips add sound and vibration to the visual benefits of painted markings when traversed by vehicle tires. Rumble strips consist of either raised or grooved patterns that are installed perpendicular to the direction of travel.
Rumble strips can provide a drowsy, inattentive, or distracted driver with a clear warning that the vehicle has left the travel lane, and can allow increased reaction time before the vehicle leaves the road. They can be provided along the edge of the travelway, in the middle of the travel lane, or along the centerline of a two-way roadway.
© 2008 by the American Association of State Highway and Transportation Officials. All rights reserved. Duplication is a violation of applicable law.

page
1�
Curve Delineation Providing enhanced delineation of sharp curves, includ-ing markings, signing, and other high-visibility delin-eators, can also contribute to reduced lane-departure crashes. Delineation can provide drivers with a clear picture of the sharpness of the curve prior to entry and cause them to decrease their speed prior to entering the curve. Curve delineation can include shoulder treat-ments, such as chevrons, large arrow signs, or delineators on guardrails; improved curve warning signs, such as signs with flashing beacons; or innovative markings such as warning arrows on the pavement prior to the curve.
Enhanced Pavement MarkingsEnhanced pavement markings can provide better “guid-ance” to drivers at locations where they might leave the roadway. These enhancements might include wider or higher contrast markings or raised pavement markers in spot locations, as compared with the standard pavement markings that would be used at other locations where the crash risk is lower.
Skid ResistanceProviding skid-resistant pavements will help with wheel traction, especially during wet weather events when friction forces are greatly reduced. In fact, a water film thickness of 0.002 inches reduces the tire pavement friction by 20 to 30 percent of the dry surface friction. Countermeasures to improve skid resistance include asphalt mixture (type and gradation of aggregate as well as asphalt content), pavement overlays on both concrete
or asphalt pavements, and pavement grooving. Timely maintenance should also be conducted to reduce water build-up due to tire rutting, an inadequate crown, or poor shoulder maintenance.
In addition to general lane- and roadway-departure crashes, there are two potential situations that warrant special consideration: horizontal curves and head-on collisions.
On a 20-mile stretch of I-59 around Hattiesburg, Mississippi DOT evaluated edge striping
placed within various sizes of rumble strips. Delineation of the edge line was increased
significantly due to the near vertical facing of the rumble strip, particularly during rain
and inclement weather, producing visual results similar to raised pavement markers, in
addition to the sound and vibration effects of the rumble strip. From the success of the
I-59 project, MDOT is now testing the rumble stripes on
MS 589, a rural two-lane highway.
Mississippi’s Rumble “Stripes”
© 2008 by the American Association of State Highway and Transportation Officials. All rights reserved. Duplication is a violation of applicable law.

page
1�
Horizontal CurvesThe average crash rate for horizontal curves is about three times that for straight segments. Statistical analy-ses show that 76 percent of curve-related fatal crashes involve single vehicles leaving the roadway and either striking fixed objects or overturning. Another 11 percent result in head-on crashes.
In addition to curve delineation strategies mentioned previously, other low-cost, quick-implementation strate-gies for reducing crashes in horizontal curves include the following:
Advance Warning of Changes in Horizontal AlignmentAdvance warning lets a driver know that the horizontal alignment of the roadway is about to change and that the driver must alter the path, and possibly his or her speed, to negotiate the curve safely. Traditionally, advance warning is accomplished through the use of roadway signing, such as a “curve” sign and an advisory speed sign. Flashing beacons are often used to draw more attention to these signs.
Methods used on a more limited basis include warning messages placed on the pavement and rumble strips in advance of the very sharp curves. Additional non-tra-ditional methods of advance warning involve pavement markings that attempt to cause a driver to reduce his/her speed. These markings include transverse lines with decreasing spacing or edge lines that give the appearance of a narrowing lane width.
Sight DistanceIn horizontal curves, obstructions that limit the driver’s sight distance come in many shapes and forms. Physical
Quick-Implementation Strategies for Reducing Crashes in Horizontal Curves
• Provide advance warning of unexpected changes in horizontal alignment
• Enhance delineation along curves• Provide adequate sight distance
In February 2008, Delaware DOT installed 11.5 miles of bicycle-friendly rumble strips
throughout a 17-mile corridor between Dewey Beach and Fenwick Island in response to
a high rate of run-off-the-road crashes. The SR 1 corridor has a unique mix of vehicle,
cyclist, and pedestrian traffic. These bicycle-friendly rumble strips are narrower and
shallower than typical rumble strips, providing more room for cyclists along the
shoulders while not sacrificing vehicular safety.
Delaware’s Bicycle-Friendly Rumble Strips
The average crash rate in curves is about three times that for straight segments.
© 2008 by the American Association of State Highway and Transportation Officials. All rights reserved. Duplication is a violation of applicable law.

page
1�
features outside the traveled way, such as trees or bushes, guardrail or concrete barriers, and embankments, can limit the driver’s sight distance. As trees and other road-side vegetation mature, the sight distance at a horizontal curve may change. Efforts should be made to ensure that obstructions do not reduce the sight distance to less than the minimum stopping sight distance.
Additional, longer-term strategies for reducing crashes inhorizontal curves include the following:• Providing skid-resistant pavement surfaces• Providing grooved pavement• Providing lighting of the curve• Providing a dynamic curve warning system
• Prohibiting/restricting trucks with very long semi-trailers on roads with horizontal curves that cannot accommodate truck off-tracking
• Widening the roadway• Improving or restoring superelevation• Installing automated anti-icing systems• Designing safer slopes and ditches to prevent roll-
overs• Modifying the horizontal alignment
Head-On CrashesMost head-on crashes result from a motorist making an “unintentional” maneuver—the driver falls asleep, is dis-tracted, or travels too fast in a curve. In fact, most head-
North Carolina DOT’s “Ride Safe Corridors” effort emphasizes day and night route inspec-
tions—including inspections in wet weather—by teams of experienced transportation
engineers to uncover safety needs. The focus of the inspections is on a wide cross-section of
safety issues, including lane-departure countermeasures such as positive guidance (visibility,
markings, signing, and lighting), surface issues, safety appurtenances, roadside
recovery areas, adequacy of shoulders, presence and placement of rumble strips.
North Carolina’s “Ride Safe Corridors”
We expect to save lives and reduce the
number of serious lane departure crashes
(by adding centerline rumble strips on
5,700 miles of rural, non-freeway roads
across the state). Prior experience shows us
that rumble strips are effective in reducing
crashes by 50 percent and cable barriers
are 95 percent effective in preventing
cross-median crashes. This safety initiative
supports Michigan’s strategic objective to
increase safety for the traveling public.
Kirk T. Steudle,Michigan DOT Director
“
”© 2008 by the American Association of State Highway and Transportation Officials. All rights reserved. Duplication is a violation of applicable law.
page
1�
on crashes are similar to roadway departure crashes—in both cases, the vehicle strays from its travel lane. About one in five non-intersection fatal crashes involves two vehicles crashing head-on. Of these, 75 percent occur on rural roads and 75 percent on undivided two-lane roads. For all roads, one-third of head-on crashes involve vehicles “negotiating a curve,” while two-thirds occur on tangent sections.
Quick-Implementation Strategies for Reducing Head-OnCrashes • Install centerline rumble strips on two-lane roads• Install raised delineation (e.g., profiled thermoplastic
strips) for centerlines• Reallocate two-lane roadway width to include a narrow
“buffer median”
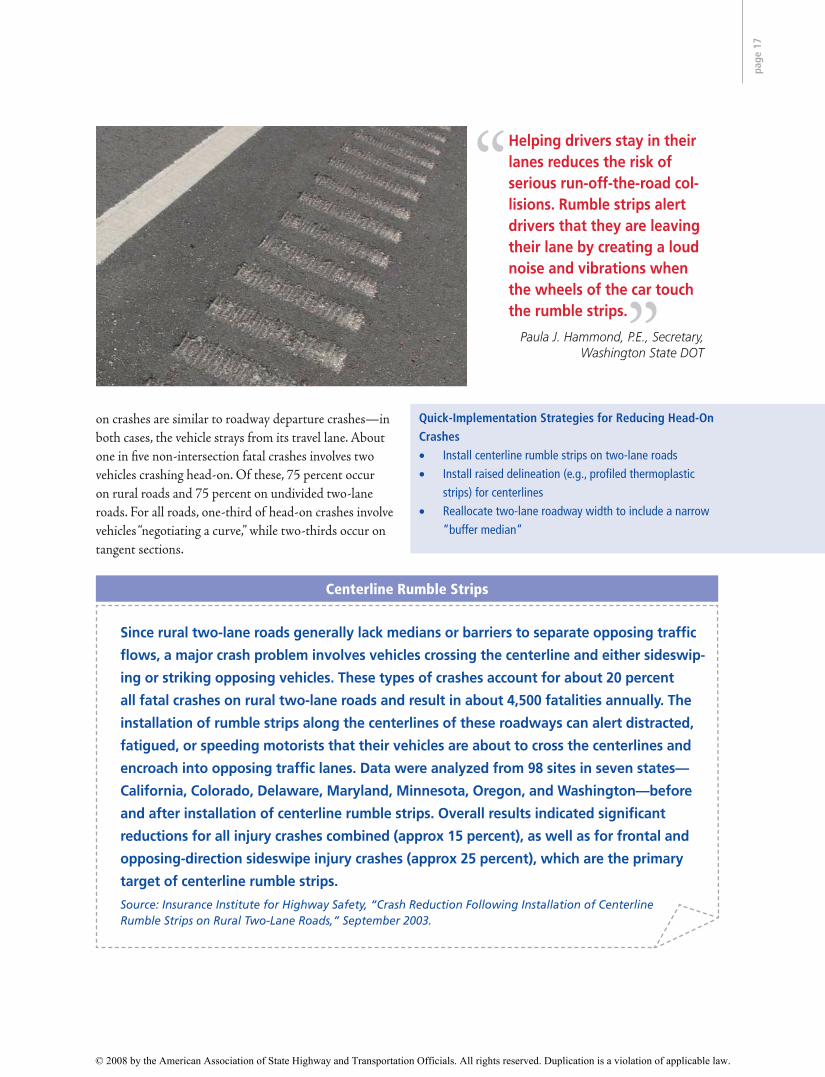
“Helping drivers stay in their lanes reduces the risk of serious run-off-the-road col-lisions. Rumble strips alert drivers that they are leaving their lane by creating a loud noise and vibrations when the wheels of the car touch the rumble strips.
Paula J. Hammond, P.E., Secretary,Washington State DOT”
Since rural two-lane roads generally lack medians or barriers to separate opposing traffic
flows, a major crash problem involves vehicles crossing the centerline and either sideswip-
ing or striking opposing vehicles. These types of crashes account for about 20 percent
all fatal crashes on rural two-lane roads and result in about 4,500 fatalities annually. The
installation of rumble strips along the centerlines of these roadways can alert distracted,
fatigued, or speeding motorists that their vehicles are about to cross the centerlines and
encroach into opposing traffic lanes. Data were analyzed from 98 sites in seven states—
California, Colorado, Delaware, Maryland, Minnesota, Oregon, and Washington—before
and after installation of centerline rumble strips. Overall results indicated significant
reductions for all injury crashes combined (approx 15 percent), as well as for frontal and
opposing-direction sideswipe injury crashes (approx 25 percent), which are the primary
target of centerline rumble strips.
Source: Insurance Institute for Highway Safety, “Crash Reduction Following Installation of Centerline Rumble Strips on Rural Two-Lane Roads,” September 2003.
Centerline Rumble Strips
© 2008 by the American Association of State Highway and Transportation Officials. All rights reserved. Duplication is a violation of applicable law.

page
1�
As the miles of divided highway protected by cable median barrier has increased in
Washington State, safety performance relative to median crossovers on those same
highways has dramatically improved. “Before-and-after” data for the highway segments
where cable median barrier has been installed shows:
• Crossover median collisions decreased 74 percent after cable median barrier was in-
stalled, from about 42 per year to about 11 per year.
• Disabling and deadly median collisions dropped 71 percent, from about 18 per year
to about 5 per year.
Source: Washington State DOT, July 2007 report, Cable Median Barrier: Reassessment and Recommendations.
Washington State’s Experience with Cable Median Barrier
Low-cost, quick-implementation strategies for reducing head-on crashes include:
Centerline Rumble StripsCenterline rumble strips are similar to shoulder rumble strips in that they alert drivers who inad-vertently stray or encroach into opposing lanes.
While this is a relatively new treatment, it has been implemented by several states, including Minnesota, Pennsylvania, Colorado, Delaware, Maryland, California, Washington, and Virginia.
Although there is no standard design, the rumble strip is generally wider than the center markings, extending
© 2008 by the American Association of State Highway and Transportation Officials. All rights reserved. Duplication is a violation of applicable law.

page
1�
into the travel lane by 5 inches to as much as 1½ feet. In some states, the strips are continuous along the center-line; in others, they alternate with a smooth gap. Since centerline rumble strips do not require changes in the overall cross section of the roadway, they are compatible with other strategies such as shoulder rumble strips and horizontal curve improvements.
Raised Centerline Delineation Profiled Thermoplastic Stripes have been used for centerlines on two-lane roads by at least two states—California and Texas. Both states use this treatment for sections where passing is not permitted. While the treatment provides an audible/tactile effect, its principal
benefit is the longer visibility distance provided at night, especially during wet conditions, when compared with standard pavement markings. However, as with stan-dard raised pavement markers, this treatment should be limited to areas where there is little or no snow, as snow plow blades will easily scrape off the stripe.
“Buffer” MediansAn experimental strategy involves reallocating the existing two-lane cross section—narrowing lanes to encourage slower speeds while incorporating a narrow buffer median between opposing flows. For example, a high-speed rural two-lane roadway with a cross section of 12-foot lanes and 10-foot paved shoulders could be
I-44 Cross-Median Fatalities
0
5
10
15
20
25
30
1999 2000 2001 2002 2003 2004 2005 2006 2007*
Cro
ss-M
edia
nFa
talit
ies
0
30
60
90
120
150
180
210
240
270
Gua
rdC
able
Inst
alla
tion
(mile
s)
Interstate Cross-Median Fatalities
4852
40
50
26
9
0
20
40
60
2002 2003 2004 2005 2006 2007
Fata
litie
s
Interstate Cross-Median Fatalities
I-44 Cross Median Fatalities
Missouri DOT has
had a very positive
experience with
median guard cable.
System-wide instal-
lation began in 2003,
and now close to
500 miles of me-
dian cable guardrail
have been installed.
Approximately 95
percent of vehicles
hitting the guard
cable are stopped by
the device, and cross-
median fatalities on
both I-70 and I-44
have been reduced
by nearly 96 percent.
Missouri ‘s Experience with Guard Cable
Cutting highway fatalities in half by �0��—i.e., by approximately 1,000 per year—will save �10,000 lives over the next two decades, which is the same as saving a city the size of:• Orlando, Florida • Reno, Nevada • Akron, Ohio• Laredo, Texas • Rochester, New York • Spokane, Washington
© 2008 by the American Association of State Highway and Transportation Officials. All rights reserved. Duplication is a violation of applicable law.

page
�0
re-striped to provide narrower, 8-foot shoulders and slightly narrower, 11-foot lanes, with the difference forming a 6-foot flush median divider. The median could include milled-in centerline rumble strips to help prevent inadvertent crossings.
Additional, longer-term strategies for reducing head-on crashes include:
• Providing center two-way left-turn lanes for four- and two-lane roads
• Providing wider cross-sections on two-lane roads• Using alternating passing lanes or four-lane cross-
sections at key locations• Installing median barriers for narrow-width medi-
ans on multi-lane roads
© 2008 by the American Association of State Highway and Transportation Officials. All rights reserved. Duplication is a violation of applicable law.

page
�1
Once a driver has left the roadway, the goal of the high-way safety engineer becomes two-fold:• Minimize the likelihood of crashing into an object
or overturning if the vehicle travels beyond the edge of the shoulder.
• Reduce the severity of the crash if an impact occurs.
Regardless of the reason that a vehicle leaves the road-way, a roadside free of fixed objects with stable, flattened slopes helps reduce crash severity. The “forgiving road-side” concept allows for the recovery of errant vehicles leaving the roadway and reduces the serious consequenc-es of such an incident. Through decades of experience and research, the application of the forgiving roadside concept has been refined to the point where roadside de-sign is an integral part of transportation design criteria. The basic design options for reducing roadside obstacles, in order of preference, are as follows:
1. Remove the obstacle.2. Redesign the obstacle so it can be safely traversed.
3. Relocate the obstacle where it is less likely to be struck.
4. Reduce impact severity by using an appropriate breakaway device.
5. Shield the obstacle with a longitudinal traffic barrier designed for redirection or use a crash cushion.
6. Delineate the obstacle if the above alternatives are not appropriate.
The following are the most commonly encountered road-side features that should be addressed to minimize the likelihood of crashes.
ShouldersRoadway departure crashes can be reduced if a vehicle that enters the shoulder area is allowed to safely recover. Shoulder treatments that promote safe recovery include shoulder widening, shoulder paving, and the reduction of pavement edge drops—i.e., differences in lane pave-ment and shoulder surface heights, whether paved or not.
Protecting Drivers Who Leave the Road
Shoulder drop-offs can cause vehicles to overturn or lose control. One solution to this
problem is to form a tapered transition at the edge of the paved surface called the “safe-
ty edge,” which helps errant vehicles maintain stability particularly on roadway re-entry.
Based on the successful performance of a pilot project after one year in service,
georgia DOT implemented the safety edge design on a statewide basis in 2005.
Georgia‘s Pavement “Safety Edge”
© 2008 by the American Association of State Highway and Transportation Officials. All rights reserved. Duplication is a violation of applicable law.
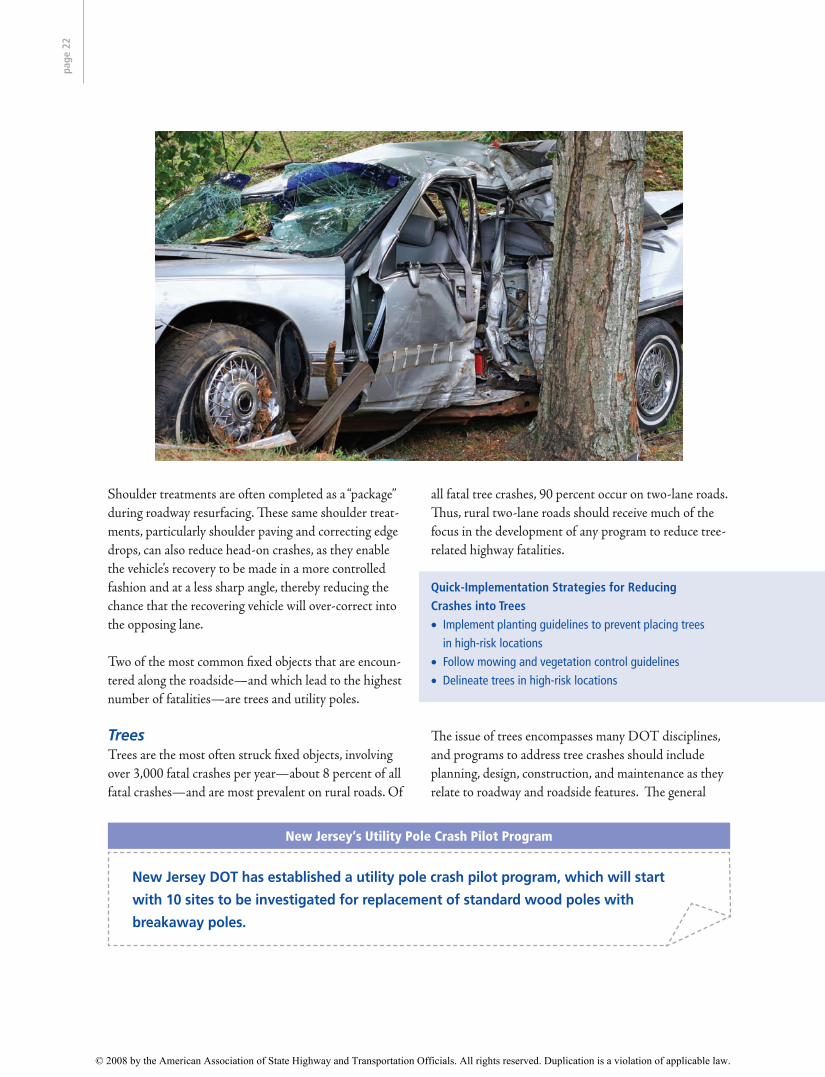
Shoulder treatments are often completed as a “package” during roadway resurfacing. These same shoulder treat-ments, particularly shoulder paving and correcting edge drops, can also reduce head-on crashes, as they enable the vehicle’s recovery to be made in a more controlled fashion and at a less sharp angle, thereby reducing the chance that the recovering vehicle will over-correct into the opposing lane.
Two of the most common fixed objects that are encoun-tered along the roadside—and which lead to the highest number of fatalities—are trees and utility poles.
TreesTrees are the most often struck fixed objects, involving over 3,000 fatal crashes per year—about 8 percent of all fatal crashes—and are most prevalent on rural roads. Of
all fatal tree crashes, 90 percent occur on two-lane roads. Thus, rural two-lane roads should receive much of the focus in the development of any program to reduce tree-related highway fatalities.
Quick-Implementation Strategies for Reducing Crashes into Trees• Implement planting guidelines to prevent placing trees
in high-risk locations• Follow mowing and vegetation control guidelines• Delineate trees in high-risk locations
The issue of trees encompasses many DOT disciplines, and programs to address tree crashes should include planning, design, construction, and maintenance as they relate to roadway and roadside features. The general
page
��
New Jersey DOT has established a utility pole crash pilot program, which will start
with 10 sites to be investigated for replacement of standard wood poles with
breakaway poles.
New Jersey‘s Utility Pole Crash Pilot Program
© 2008 by the American Association of State Highway and Transportation Officials. All rights reserved. Duplication is a violation of applicable law.

page
��
strategy for addressing trees includes preventing trees from growing in hazardous locations, and eliminating or reducing the severity of the potential obstacle.
Low-cost, quick-implementation strategies for reducing crashes into trees include:• Developing and implementing planting guidelines to
prevent placing trees in hazardous locations• Developing and implementing mowing and vegeta-
tion control guidelines• Delineating trees in high-risk locations
Other longer-term strategies include:• Removing trees in high-risk locations• Shielding motorists from striking trees• Modifying the roadside clear zone in the vicinity
of trees
Utility PolesEach year, more than 1,000 fatal crashes are associated with utility poles. Because of the structural strength and small impact area of utility poles, these crashes tend to be severe.
Quick-Implementation Strategies for Reducing Crashes into Utility Poles• Remove poles in high-crash locations• Relocate poles in high-crash locations farther from the
roadway and/or to less vulnerable locations• Shield drivers from poles in high-crash locations• Improve the drivers' ability to see poles in high-crash loca-
tions• Revise policies to prevent placing or replacing poles within
the recovery area
Utility poles should be addressed with a three-pronged attack:1. Treat specific utility poles in high-crash and
high-risk spot locations.2. Prevent placing utility poles in high-risk loca-
tions.3. Treat multiple utility poles along a corridor to
minimize the likelihood of crashing into a util-ity pole if a vehicle runs off the road.
Low-cost, quick-implementation strategies for reducing utility pole crashes include:
On an average day, 11� people die in highway crashes; �0 percent of which are under the age of ��.
© 2008 by the American Association of State Highway and Transportation Officials. All rights reserved. Duplication is a violation of applicable law.

page
��
Removing poles in high-crash locations. Relocating poles in high-crash locations farther from
the roadway and/or to less vulnerable locations. Shielding drivers from poles in high-crash locations. Improving the drivers' ability to see poles in high-
crash locations. Developing, revising, and implementing policies to
prevent placing or replacing poles within the recov-ery area.
Other longer-term strategies include: Placing utilities underground. Relocating poles along the corridor farther from the
roadway and/or to less vulnerable locations. Decreasing the number of poles along the corridor. Using breakaway devices. Applying traffic calming measures to reduce speeds
on high-risk sections.
When a crash does occur, the final objective of the transportation agency is to help reduce its severity. This can be accomplished both by making roadside hardware more forgiving and by modifying side slopes to prevent rollovers.
Shoulder TreatmentsStatistics indicate that the most harmful event in a non-intersection roadway departure crash is most likely to be an overturn. However, the rollover issue is complex in that roadway/roadside design is only one of many fac-tors affecting rollovers. Additional factors include driver control, including speed and steering, and vehicle factors, such as the rollover propensity of SUVs and pickups.
Roadside design features most likely to affect rollover in-clude the side slope, ditch design, the nature of the soil on the slope, and the design of roadside hardware that might lead to rollovers such as poorly designed guardrail ends. The best rollover prevention program is related to flatten-ing and widening side slopes, particularly fill slopes.
Roadside Safety HardwareSome objects must be located near the traveled way, such as signs, lighting supports, culverts, and mail boxes. If an object cannot be removed from the clear zone or relocated farther from traffic, an alternative strategy is to shield the object or replace more substantial objects with breakaway devices or crash cushions. The AASHTO Roadside Design Guide includes design specifications, placement information, and crash test results for a large number of roadside hardware devices. The guide also includes criteria for use in determining which of the many alternative hardware types should be chosen for a specific application.
An evaluation of safety measures in
Iowa clearly shows that lane departure
countermeasures provide the greatest
return on investment of our limited safety
funds. As a result, in addition to installing
lane-departure countermeasures on
reconstruction or new construction projects,
we are also installing them on many of our
resurfacing projects using 3R funds.
Nancy Richardson, Director,Iowa DOT
“
”
Delaware DOT is partnering with the state utility companies to delineate all utility poles
within the clear zone of the state highways. As part of their “remove, shield, delineate”
program, all existing utility poles will be delineated by DelDOT forces, and all new
poles will be delineated by the utility companies.
Delaware‘s “Remove, Shield, Delineate” Program
© 2008 by the American Association of State Highway and Transportation Officials. All rights reserved. Duplication is a violation of applicable law.

page
��
While state DOTs work to improve the infrastructure that exists today, the future will bring tremendous inno-vation in the areas of Intelligent Transportation Systems (ITS) and Vehicle Infrastructure Integration (VII) that will change the way we drive.
AASHTO, U.S. DOT, and the automobile industry have been working cooperatively to advance promising technologies in both the public and private sectors to help prevent crashes as well as to mitigate the conse-quences of crashes that do occur. In addition, coopera-tive efforts between automobile manufacturers and the public operational agencies are seeking ways to prevent intersection collisions and warn drivers of potentially hazardous conditions.
Efforts in the automobile industry are bringing 360-de-gree awareness to motor vehicles. This awareness will deliver information to the driver regarding vehicles in
blind spot locations for lane changing. Vehicles ap-proaching intersections will be made aware of vehicles approaching from other directions and estimates of vehicles’ trajectories will be made available as warnings when appropriate.
Nissan has laid out a zone-of-safety approach called the “Safety Shield,” which seeks to maintain safe driving, re-turn vehicles to safe driving when necessary, and reduce injuries in crashes. Other manufacturers are following similar practices. Some of the technologies being made available in each of these areas include the following:
• Maintain safe driving through such technologies as lane-departure warnings, blind spot warnings, and adaptive cruise control. Providing information on road conditions ahead such as icy roads will also contribute to safer driving.
What Does the Future Hold?
Nissan’s “Safety Shield” Concept applies a zone-of-safety approach for driver protection.Source: Nissan.
© 2008 by the American Association of State Highway and Transportation Officials. All rights reserved. Duplication is a violation of applicable law.

page
��
• Return vehicle to safe driving through lane-departure warnings and electronic vehicle stability control.
• Reduce injuries in crashes through seat belt tightening and automatic braking, as well as post-crash auto-mated collision notification to emergency responders.
At the 2005 ITS World Congress in San Francisco, General Motors and BMW demonstrated vehicle-to-vehicle communications for both warnings and auto-
mated braking. BMW demonstrated a vehicle-to-vehicle warning of a slippery road ahead, allowing the following vehicle to prepare for these conditions. General Motors demonstrated vehicle-to-vehicle communications regarding the position of other vehicles in the driver’s blind spot for lane-changing alerts, as well as automated braking when a vehicle approached another in a collision trajectory. These applications have been enhanced and refined over the past three years and will be demonstrat-ed at the 2008 ITS World Congress in New York.
Driver using vehicle stability control over icy roadway and broadcasting message to nearby vehicles demonstrates the safety potential of ITS applications.Source: BMW.
© 2008 by the American Association of State Highway and Transportation Officials. All rights reserved. Duplication is a violation of applicable law.

page
��
BMW is also actively developing safety applications, including night vision, to enhance driver awareness of pedestrians and animals on the road that are outside the range of normal vision.
Cooperative efforts between the U.S. DOT, the au-tomobile manufacturers, and the state transportation agencies include exploring a group of safety applications that prepare to reduce or even eliminate crashes. These applications include the following:
• Traffic Signal Violation Warning: This application calls for VII-equipped traffic signals to broadcast their phase status (i.e., red, yellow, or green) to all VII-equipped vehicles approaching the intersec-tion. Processors within the vehicle can use the signal information, combined with the vehicle speed and location, and the location and speed of nearby ve-hicles, to warn the driver of a potentially dangerous situation.
• Stop Sign Violation Warning: In this application, a high-speed roadside communication device broad-casts the precise location of stop signs to surround-ing vehicles. Like the traffic signal violation warning application, processors on the vehicle can use this information, combined with the vehicle speed and location, to warn the driver of a potential stop sign violation.
• Driver Assistance at Intersections: The VII system has the potential to assist drivers with dangerous maneuvers at intersections, such as making turns onto a busy roadway. The system can help drivers find an adequate “gap” between vehicles traveling on the crossing facility to make a turn or cross the roadway. This type of assistance is particularly beneficial at high-speed rural intersections without signals, and for drivers making left turns at signals without a protected left-turn phase.
Lane-departure warning system showing camera tracking lane markings is an ITS safety application.Source: Nissan.
© 2008 by the American Association of State Highway and Transportation Officials. All rights reserved. Duplication is a violation of applicable law.

page
��
• Curve Speed Warning: This application would broadcast precise roadway geometry and road condition information to vehicles approaching a curve. The vehicle could then use this information, combined with an awareness of its own speed and location, to warn the driver if he or she is approach-ing the curve too fast.
• Electronic Brake Warning: This application calls for VII-equipped vehicles to immediately broadcast a “hard braking” message whenever the vehicle’s decel-eration rate exceeds a pre-set limit. Other vehicles in the vicinity receive this anonymous message and, if appropriate, warn the driver that a vehicle ahead is stopped or is decelerating quickly. This application will help prevent vehicle pile-ups that sometimes occur when a vehicle in fast-moving traffic suddenly makes a panic stop.
• In-Vehicle Signage: This application is focused on broadcasting various warnings and signing informa-tion to motorists at appropriate times and locations. A VII-equipped vehicle can use this information, combined with an awareness of its own location, speed and heading, to display messages to the driver. Examples of in-vehicle signage include: work zone warnings, speed limit warnings, vehicle size or weight warnings, one-way street or “no entrance” warnings, and numerous other infrastructure signage.
In both California and Michigan, ITS Test Beds are testing the operation of intersection collision avoidance technologies in cooperation with the automobile indus-try and the U.S. DOT.
“Night Visions” dashboard feature illuminates potential hazards.Source: BMW.
© 2008 by the American Association of State Highway and Transportation Officials. All rights reserved. Duplication is a violation of applicable law.

page
��
In California, this Test Bed demonstrates In-Vehicle Signal Information.Source: CalTrans and the PATH Program at the University of California at Berkeley.
Proof of Concept Test Bed in Michigan.Source: Michigan DOT.
© 2008 by the American Association of State Highway and Transportation Officials. All rights reserved. Duplication is a violation of applicable law.

Continuing the cooperative investments by the U.S. DOT and the independent investments by the au-tomobile manufacturers will produce a far safer road environment in the future. The Volpe Institute estimates that over $40 billion in net benefits from intersection
collision and curve speed warnings applications could be realized over a forty-year time period. AASHTO’s con-tinued partnership in these efforts with the automobile industry and U.S. DOT will help to ensure that these promises become reality.
page
�0
Vehicle-to-vehicle communication can improve intersection safety, in-vehicle signing, and electronic payments.Source: BMW.
© 2008 by the American Association of State Highway and Transportation Officials. All rights reserved. Duplication is a violation of applicable law.

page
�1
While the nation as a whole struggles to attain a reduc-tion in the traffic fatalities, this report highlights suc-cesses of some states that find themselves in the enviable position of not only meeting, but exceeding, their goals.
These examples can assist transportation professionals as they initiate steps to address lane-departure crashes systematically. Many lives can be saved by establishing a short-term goal to develop a program to systematically upgrade safety appurtenances and design features.
Here are some strategies to use in fostering a change:
1. Ensure that your Strategic Highway Safety Plan (SHSP) is a Living Document—Address safety prob-lems in a comprehensive way, including engineers, law enforcement personnel, educators, judges, and other highway safety specialists in a cooperative effort. Make your support of the SHSP the guiding implementing document, known throughout your agency.
Putting It into Practice What Can You Do Each Day to Save a Life?
Crash locations are variable, crash type is predictable.© 2008 by the American Association of State Highway and Transportation Officials. All rights reserved. Duplication is a violation of applicable law.
page
��
2. Develop Action Strategies to Implement Your SHSP and Provide Resources for Safety, Including Staff, Dollars, and Policies—Strongly encourage your staff to adapt or create systemic implementing actions/programs for your SHSP. Many of the strategies described above can assist you in achieving your goals.
3. Assign a Multidisciplinary Champion for Safety—Tap someone with enthusiasm for safety and give him/her the authority, time, and resources necessary to lead your program’s implementation. Engineering improvements along with enforcement, education, and emergency medical services have proven to reduce fatalities.
4. Conduct Weekly/Monthly Safety Program Meetings with Your Safety Staff/Team—A separate meeting or dedicated time during an established executive staff meeting where you assess your program’s safety progress and reaffirm your safety expectations.
5. Share Safety Expectations with Key Management Staff—Share your safety expectations/goals with each member of your executive staff and have them identify what actions they will take in addressing safety. Hold your staff accountable for these actions.
6. Establish Safety as a Leadership Performance Measure—Include a safety performance measure in each of your executive staff ’s performance reviews. Remember two old management adages: 1) what’s measured gets done; and 2) a perfect plan, absent implementation, yields nothing.
7. Provide Safety Program Assistance to Local Governments—Nationally, the overwhelming major-ity of fatalities and serious injuries occur on local roadways. The strategies described previously will assist local agencies as well as they aid your agency. Direct your agency to develop roadway safety programs that provide training, funding, and/or resources to your locals.
8. Fully Utilize All Funding Resources Available for Safety—Use the funding flexibility and obligation authority associated with your state’s safety fund-ing to spend/obligate all of your dollars during the allotted eligibility periods.
“If you wait until you
have consensus in your
organization,
you’ll never begin.Kevin Keith, Chief Engineer,
Missouri DOT”
© 2008 by the American Association of State Highway and Transportation Officials. All rights reserved. Duplication is a violation of applicable law.

page
��
• AASHTO Strategic Highway Safety Plan, http://safety.transportation.org
• AASHTO Roadside Design Guide, 2006, https://bookstore.transportation.org/item_details.aspx?ID=148
• AASHTO Technology Implementation Group, http://tig.transportation.org
• American Traffic Safety Services Association (ATSSA), http://www.atssa.com
• FHWA Resource Center, Safety and Design Technical Service Team, http://www.fhwa.dot.gov/resourcecenter/teams/safety
• FHWA Road Departure Safety, http://safety.fhwa.dot.gov/roadway_dept
• NCHRP Report 500 Series, http://safety.transportation.org/guides.aspx • Volume 3: A Guide for Addressing Collisions with Trees in Hazardous Locations • Volume 4: A Guide for Addressing Head-On Collisions • Volume 6: A Guide for Addressing Run-Off-Road Collisions • Volume 7: A Guide for Reducing Collisions on Horizontal Curves • Volume 8: A Guide for Reducing Collisions Involving Utility Poles • Additional guides available related to aggressive driving, alcohol, seat belt use, collecting and analyzing safety
data, and other safety topics
• Roadway Safety Foundation, http://www.roadwaysafety.org
• U.S. DOT Rural Safety Initiative, http://www.dot.gov/affairs/ruralsafety/ruralsafetyinitiativeplan.htm
Appendix: Resources
© 2008 by the American Association of State Highway and Transportation Officials. All rights reserved. Duplication is a violation of applicable law.

444 North Capitol Street, NWSuite 249
Washington, DC 20001
www.t ranspor tat ion .org
ISBN: 978-1-56051-418-3 | Publication Code: PLD-1