driving behaviour clustering for realistic traffic micro ...€¦ · driving behaviour clustering...
TRANSCRIPT

DRIVING BEHAVIOURCLUSTERING FOR REALISTICTRAFFIC MICRO-SIMULATORS
Alessandro Petraro, Federico Caselli, Michela MilanoDepartment of Computer Science and Engineering
University of Bolognaviale Risorgimento 2, Bologna, Italy
[email protected], [email protected],
Marco LippiDepartment of Sciences and Methods for Engineering
University of Modena and Reggio Emiliavia Amendola 2, Reggio Emilia, Italy
KEYWORDS
Agent-based modelling; Traffic Micro Simulators;Clustering Algorithms
ABSTRACT
Traffic simulators are effective tools to support de-cisions in urban planning systems, to identify criticali-ties, to observe emerging behaviours in road networksand to configure road infrastructures, such as road sideunits and traffic lights. Clearly the more realistic thesimulator the more precise the insight provided to de-cision makers. This paper provides a first step towardthe design and calibration of traffic micro-simulator toproduce realistic behaviour. The long term idea is tocollect and analyse real traffic traces collecting vehic-ular information, to cluster them in groups represent-ing similar driving behaviours and then to extract fromthese clusters relevant parameters to tune the micro-simulator. In this paper we have run controlled ex-periments where traffic traces have been synthetized toobtain different driving styles, so that the effectivenessof the clustering algorithm could be checked on knownlabels. We describe the overall methodology and theresults already achieved on the controlled experiment,showing the clusters obtained and reporting guidelinesfor future experiments.
INTRODUCTION
Vehicular mobility is a complex man-made socio-technical system involving the road and communica-tion infrastructures, road side units and drivers. Ve-hicular mobility affects many aspects of our everydaylife, shaping the environment around us, underpinningeconomic growth and affecting our health and qualityof life. If we restrict ourselves to urban mobility, it ac-counts for more than 40% of CO2 emissions and more
than 70% of other pollutants from transport1. Under-standing mobility patterns, identifying criticalities insuch a complex system, assessing the performance ofthe road network in specific areas is essential for deci-sion makers that have to manage the system and planinterventions to improve the infrastructure.
Important tools that support such decision makingprocess are traffic simulators, namely mathematical oragent-based models mimicking the traffic dynamics on aroad network. They are classified in macro- and micro-simulators (Helbing et al., 2002). Macro-simulators areoften based on traffic flows and describe the collec-tive behaviour of vehicle dynamics in terms of vehicledensity and average speed in time. Micro-simulators,instead, model the single vehicle and account for thedriver behaviour that influences the speed and positionof the vehicle in time. Thus, in micro-simulators, trafficpatterns emerge by the interaction of each vehicle dy-namics. It is extremely difficult to model single driversand obtain a realistic emerging behaviour.
To provide useful support to decision makers, trafficsimulators should be realistic and model real traffic pat-terns. It is clear that if the drivers are modelled in anunrealistic way, many emerging and realistic patternsare lost, while unrealistic patterns arise.
In this paper we propose a method for configuringrealistic micro-simulators and we introduce the first re-sults achieved in this direction. The idea is to use realtraffic traces, to cluster them in groups sharing simi-lar driving behaviour and then use the cluster featuresto configure the agents in the traffic simulator. To as-sess the feasibility of this methodology, we have startedwith a controlled experiment and generated synthetictraffic traces to understand which parameters are dis-criminant for the clustering algorithm and how to ex-
1https://ec.europa.eu/transport/themes/urban/urban mobility en
Proceedings 31st European Conference on Modelling and Simulation ©ECMS Zita Zoltay Paprika, Péter Horák, Kata Váradi, Péter Tamás Zwierczyk, Ágnes Vidovics-Dancs, János Péter Rádics (Editors) ISBN: 978-0-9932440-4-9/ ISBN: 978-0-9932440-5-6 (CD)
tract and manipulate them. We have compared tracesthat are ordered and not ordered, long and short andwe have come out with some guidelines for conductingexperiments on real traces.
The paper is organized as follows. In the nextsection, we first propose the concept underlying ourmethod, then we introduce SUMO (Krajzewicz et al.,2012), the micro-simulator used, and we show how weapplied the clustering algorithm. Finally, we presentan experimental evaluation on a set of synthetic tracesproviding results and guidelines for future tests.
CONCEPT
We have designed a process aimed at configuring amicro-simulator to obtain realistic behaviour. The sys-tem pipeline is depicted in Figure 1. The starting pointconcerns the collection of real traffic traces from vehi-cles. The main parameters we have to collect are speed,position and acceleration at any point in time. Thesetime series should be processed in real-time, stored ina data base and then manipulated to extract a mean-ingful training set for the clustering algorithm.
One important aspect of this processing phase isthat, often, time series have different lengths, or con-tain many values that refer to stops (either at trafficlights or in congestions) that do not provide any mean-ingful insight on the driving styles. Therefore we havebasically three possibilities: (1) either cut the time se-ries to obtain feature data of the same length, (2) orderthe time series and cut them after the sorting or (3) useaggregate values (average speed/acceleration, standarddeviation, maximum speed/acceleration). In the ex-perimental result section, we will consider these aspectsand test each alternative to understand its effectivenessin extracting driving styles.
The clustering algorithm then creates clusters on thefeature space and obtains groups of traces that hope-fully share some driving style characteristics. The clus-ter dimension (namely the number of vehicle tracesin the cluster), and other aggregate parameters (maxspeed, max acceleration, standard deviations of speedand acceleration) are extracted from clusters and fedinto the simulators to generate vehicles with the samecharacteristics. In the future, self-driving cars couldalso take advantage of these clustered driving styles, soas to learn typical human behaviors.
This paper is a first but significant step toward theprocess described above. Here we focus on a controlledexperiment, where traffic traces are synthetic and aregenerated to have specific features. In this way we arti-ficially create traffic traces exposing a controlled num-ber of driving styles, to double check if the clusteringalgorithm finds homogeneous clusters with respect tothe driving style.
Clearly, the experimental setup should cover scenar-ios where driving styles are very different one anotherand scenarios where driving styles are somehow moresimilar. We will show in the experimental result sectionthe generated scenarios and the corresponding results.
THE SUMO SIMULATOR
SUMO (Simulation of Urban MObility) (Krajzewiczet al., 2012) is a microscopic, time-discrete traffic flowsimulation platform used in this paper to collect thetraffic information for the controlled experiments.
In SUMO each vehicle is uniquely simulated: it hasan unique identifier, a departure time and a route (de-fined as a list of streets) that it will follow through theroad network. Furthermore, each vehicle can be char-acterized by a set of features (called type) describinghow it will behave in the simulation, including physicalinformation (ie its maximum speed and acceleration)and other more specific parameters that regulate ad-vanced aspects of the simulation, such as the driver’swillingness to respect the speed limits.
Since our goal is to assess the feasibility of our con-cept with SUMO, to create the different driver be-haviours we focused on values that can be easily col-lected from the observation of real traffic. In partic-ular, to characterize the different types we used themaximum acceleration and deceleration and the will-ingness of the driver to follow the speed limit. Thislast parameter can be controlled in SUMO via a Gaus-sian distribution where speedFactor is the mean andspeedDeviation is the standard deviation. When a ve-hicle enters the simulation SUMO computes its speedfactor, using the Gaussian defined by its type. Thismeans that the real maximum speed of a vehicle on alane is vehicleSpeedFactor × laneSpeedLimit.
SUMO allows many kinds of data outputs for eachsimulation, and also offers an API that can be lever-aged to control the simulation online through anotherprogram. When used in this mode, SUMO allows theclient to access many aspects of the simulation under-going at every time step and also to change the values.This makes collecting custom information very efficient,without the need to parse large output files.
We used the software platform to generate customtraffic demands and interacted directly with the sim-ulator online. We used these features to create thesynthetic scenarios that were used to validate our ap-proach, and to extract the traffic traces to perform theanalysis of the simulations.
CLUSTERING
Given a collection of traffic traces, our goal is to lookfor drivers that share similar characteristics. From amachine learning point of view, this is an unsupervisedlearning task, since we do not know in advance the cat-egories into which the examples should be partitioned.Differently from a supervised learning setting, when oneis given a collection of object-target pairs with the aimof learning a function that associates the objects totheir targets, in an unsupervised setting we are onlygiven unlabeled observations, with the goal of automat-ically detecting relevant, common patterns among theexamples (Hastie et al., 2001). This setting is partic-ularly appropriate for our scenario, since it is unlikelyto pretend to know in advance a precise set of drivercategories, but it is much more reasonable to search for

© COLOMBO consortium, 2012
Self-organizing traffic light control: the concept
Control"system"• Sensing"• Policy"selecCon"• Policy"execuCon"
We"developed"the"Swarm"controller7based"on"swarm"intelligence"concepts"
9
© COLOMBO consortium, 2012
Self-organizing traffic light control: the concept
Control"system"• Sensing"• Policy"selecCon"• Policy"execuCon"
We"developed"the"Swarm"controller7based"on"swarm"intelligence"concepts"
9
TrafficTracesDB
Trainingset
Clusteringalgorithm
Clusterfeatureextrac7on
Simulator
Manipula(onTraining Results
Feeding
Analysis
RealTrafficFig. 1: Process flow for configuring realistic micro-simulators
emerging behaviors directly from data observations.To this aim, we employ one of the most used and
studied clustering algorithms, namely k-means (Harti-gan and Wong, 1979). We hereby remark that othermore sophisticated algorithms could indeed be appliedto the same problem: yet, our goal in this paper is toprovide a proof-of-concept of the whole system, thuswe selected such a simple yet effective algorithm, leav-ing for future work the analysis of alternatives. Givenn data points and an integer k, k-means partitions thedata into a set of k clusters. This is done by finding thek cluster centers with an iterative procedure: startingwith k initial centers (e.g., randomly chosen), the re-maining points are associated each to the closest center.Then, the centers of mass of the so-obtained clusters arecomputed, which produces a new set of k cluster cen-ters. Such steps are repeated until convergence. Thealgorithm is guaranteed to converge to a local optmi-mum, but it greatly depends on the initialization ofthe cluster centers. In this paper we employ two stan-dard techniques that typically improve clustering re-sults: (i) a smart initialization of the centers, namedk-means++ (Arthur and Vassilvitskii, 2007), that triesto have an initial set of spatially distant points; (ii) mul-tiple re-starts of the algorithm, finally choosing the bestsolution according to a certain criterion. More detailson the metrics used to assess the goodness of cluster-ing will be given in the experimental section. Here wejust anticipate that, since we operate in a controlled(simulated) environment, clearly we also know the truelabels of the vehicles (since we generate them). This al-lows us to use clustering evaluation metrics that exploitknowledge of the labels.
With respect to our specific problem, the main issuethat has to be solved when feeding data to the clus-tering algorithm is how to represent each traffic trace.In fact, clustering algorithms (including k-means) typ-ically assume all data samples to have the same di-
mensionality, that is they are represented by the samenumber of features. In the case of traffic traces, instead,this is clearly not true, since the length of the trace ofeach vehicle depends on how long the vehicle has beenobserved (in the controlled experiment, how much timeit spends within the simulation). Moreover, the tracemay possibly contain information about both the speedand the acceleration of the vehicle. Several solutionscan be designed to address these issues. In this workwe considered four different possibilities: (i) computeaggregated statistics (e.g., mean, variance, etc.) of eachtrace, to be used as feature vectors; (ii) choose the mlargest values of the trace (in decreasing order); (iii)choose the m smallest values of the trace (in increasingorder); (iv) choose the first m timestamps of the trace.
EXPERIMENTS
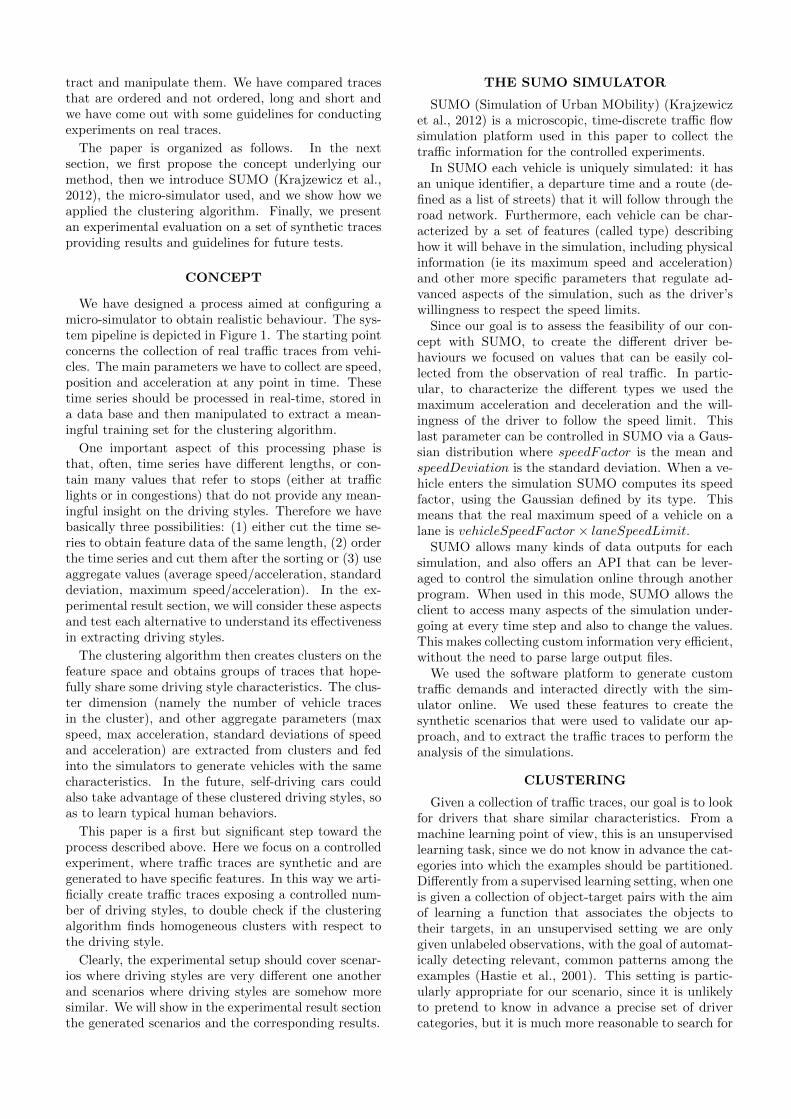
We now present the experimental evaluation that weconducted in a controlled setting implemented withinSUMO, version 0.27.1. We considered three differentscenarios of increasing difficulty for the clustering al-gorithm, to study the performance of our approachwith respect to the heterogeneity in the generated traf-fic traces. Each simulation has run for a period of 4hours, with about 14,000 vehicles. Then, we extractedthe 25% of vehicles with the longest traces in the sim-ulation, so that several lengths for the feature vectorscould be tested in the experiments. Therefore, eachscenario contains about 3,600 vehicles. As for the roadnetwork, we used a portion of the Bologna metropolitanarea, depicted in Figure 2. In all the simulations, wekept SUMO parameter speedDev = 0.1 (representingthe speed standard deviation).
For each scenario, we have applied the clustering al-gorithm on (i) aggregated data (ii) time series contain-ing only speed values in time, (iii) time series contain-ing acceleration values in time, and (iv) combined time
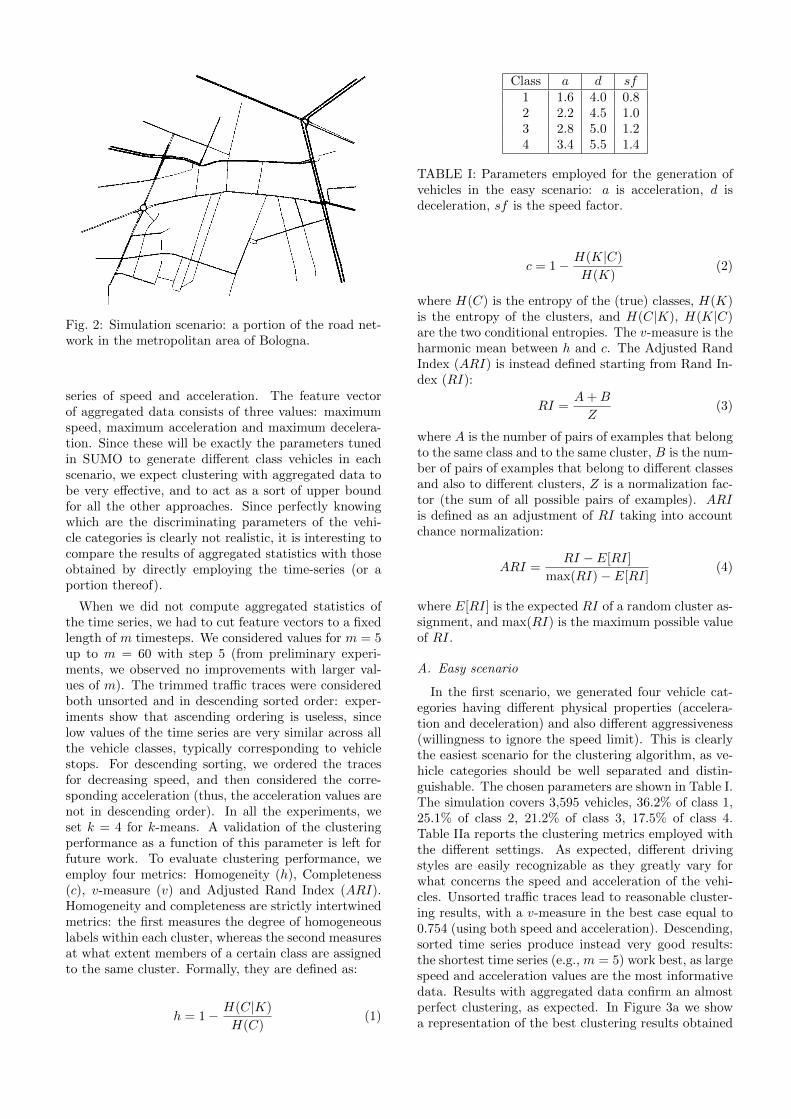
Fig. 2: Simulation scenario: a portion of the road net-work in the metropolitan area of Bologna.
series of speed and acceleration. The feature vectorof aggregated data consists of three values: maximumspeed, maximum acceleration and maximum decelera-tion. Since these will be exactly the parameters tunedin SUMO to generate different class vehicles in eachscenario, we expect clustering with aggregated data tobe very effective, and to act as a sort of upper boundfor all the other approaches. Since perfectly knowingwhich are the discriminating parameters of the vehi-cle categories is clearly not realistic, it is interesting tocompare the results of aggregated statistics with thoseobtained by directly employing the time-series (or aportion thereof).
When we did not compute aggregated statistics ofthe time series, we had to cut feature vectors to a fixedlength of m timesteps. We considered values for m = 5up to m = 60 with step 5 (from preliminary experi-ments, we observed no improvements with larger val-ues of m). The trimmed traffic traces were consideredboth unsorted and in descending sorted order: exper-iments show that ascending ordering is useless, sincelow values of the time series are very similar across allthe vehicle classes, typically corresponding to vehiclestops. For descending sorting, we ordered the tracesfor decreasing speed, and then considered the corre-sponding acceleration (thus, the acceleration values arenot in descending order). In all the experiments, weset k = 4 for k-means. A validation of the clusteringperformance as a function of this parameter is left forfuture work. To evaluate clustering performance, weemploy four metrics: Homogeneity (h), Completeness(c), v-measure (v) and Adjusted Rand Index (ARI).Homogeneity and completeness are strictly intertwinedmetrics: the first measures the degree of homogeneouslabels within each cluster, whereas the second measuresat what extent members of a certain class are assignedto the same cluster. Formally, they are defined as:
h = 1− H(C|K)
H(C)(1)
Class a d sf1 1.6 4.0 0.82 2.2 4.5 1.03 2.8 5.0 1.24 3.4 5.5 1.4
TABLE I: Parameters employed for the generation ofvehicles in the easy scenario: a is acceleration, d isdeceleration, sf is the speed factor.
c = 1− H(K|C)
H(K)(2)
where H(C) is the entropy of the (true) classes, H(K)is the entropy of the clusters, and H(C|K), H(K|C)are the two conditional entropies. The v-measure is theharmonic mean between h and c. The Adjusted RandIndex (ARI) is instead defined starting from Rand In-dex (RI):
RI =A + B
Z(3)
where A is the number of pairs of examples that belongto the same class and to the same cluster, B is the num-ber of pairs of examples that belong to different classesand also to different clusters, Z is a normalization fac-tor (the sum of all possible pairs of examples). ARIis defined as an adjustment of RI taking into accountchance normalization:
ARI =RI − E[RI]
max(RI)− E[RI](4)
where E[RI] is the expected RI of a random cluster as-signment, and max(RI) is the maximum possible valueof RI.
A. Easy scenario
In the first scenario, we generated four vehicle cat-egories having different physical properties (accelera-tion and deceleration) and also different aggressiveness(willingness to ignore the speed limit). This is clearlythe easiest scenario for the clustering algorithm, as ve-hicle categories should be well separated and distin-guishable. The chosen parameters are shown in Table I.The simulation covers 3,595 vehicles, 36.2% of class 1,25.1% of class 2, 21.2% of class 3, 17.5% of class 4.Table IIa reports the clustering metrics employed withthe different settings. As expected, different drivingstyles are easily recognizable as they greatly vary forwhat concerns the speed and acceleration of the vehi-cles. Unsorted traffic traces lead to reasonable cluster-ing results, with a v-measure in the best case equal to0.754 (using both speed and acceleration). Descending,sorted time series produce instead very good results:the shortest time series (e.g., m = 5) work best, as largespeed and acceleration values are the most informativedata. Results with aggregated data confirm an almostperfect clustering, as expected. In Figure 3a we showa representation of the best clustering results obtained
Trace Sorting m h c v ARIS None 10 0.745 0.772 0.758 0.788A None 15 0.635 0.671 0.652 0.693SA None 20 0.741 0.768 0.754 0.786S Dec. 5 0.977 0.979 0.978 0.989A Dec. 5 0.979 0.980 0.979 0.989SA Dec. 5 0.872 0.882 0.877 0.915Agg – – 0.985 0.985 0.985 0.993
(a)
Trace Sorting m h c v ARIS None 15 0.656 0.685 0.670 0.697A None 15 0.572 0.570 0.571 0.602SA None 25 0.716 0.739 0.727 0.755S Dec. 5 0.987 0.988 0.988 0.994A Dec. 50 0.318 0.326 0.322 0.233SA Dec. 5 0.884 0.889 0.887 0.914Agg – – 0.993 0.993 0.993 0.997
(b)
Trace Sorting m h c v ARIS None 10 0.723 0.737 0.730 0.741A None 15 0.712 0.723 0.718 0.748SA None 20 0.727 0.740 0.733 0.747S Dec. 30 0.485 0.843 0.616 0.476A Dec. 25 0.590 0.661 0.623 0.509SA Dec. 15 0.474 0.740 0.578 0.459Agg – – 0.989 0.988 0.989 0.994
(c)
TABLE II: Best clustering results obtained in each sce-nario: (a) easy, (b) intermediate, (c) hard. h is clusterhomogeneity, c is completeness, v is the v-measure, andARI is Adjusted Rand Index. For traces, S stays forspeed, A for acceleration and SA for a combination ofthe two. Agg indicates aggregated features.
for this scenario (m = 5, descending ordering, negligi-ble differences if using acceleration or speed). Exam-ples have been projected to a two-dimensional featurespace via Principal Component Analysis (PCA) (Jol-liffe, 2002), where colors represent the cluster assign-ment by k-means, and digits indicate the true vehiclelabel.
B. Intermediate scenario
The second scenario we consider has an intermediatelevel of complexity, since only the aggressiveness of thevehicles changes. Again, we generated four traffic cate-gories corresponding to four different values for SUMOparameter speedFactor: {0.8, 1.0, 1.2, 1.4}, which arethe same employed in the easy scenario (but this timewithout differentiating also the physical properties).The simulation covers 3,643 vehicles, 32.6% of class 1,26.1% of class 2, 21.5% of class 3, 19.8% of class 4. Ta-ble IIb reports the clustering metrics employed with thedifferent settings. Similarly to the previous scenario,the clustering of unordered traffic still achieves metrics
k m h c v ARI4 20 0.727 0.740 0.733 0.7476 25 0.793 0.683 0.734 0.7428 25 0.806 0.585 0.678 0.59210 25 0.821 0.521 0.638 0.489
TABLE III: Performance measurements with differentnumbers of clusters k in the hard scenario. In thissetting we employ unsorted traces with both speed andacceleration. We report h as cluster homogeneity, c ascompleteness, v as the v-measure, and ARI as AdjustedRand Index.
Class a d sf1 2.2 4.5 0.82 2.8 4.5 0.83 2.2 4.5 1.24 2.8 4.5 1.2
TABLE IV: Parameters employed for the generationof vehicles in the hard scenario: a is acceleration, d isdeceleration, sf is the speed factor.
above 0.7, with slightly larger values of m with respectto the easy scenario. As in the easy scenario, switchingto a descending ordering of the traces has lead to thebest overall performance, and again m = 5 providedthe best results. Differently from the previous setting,the acceleration in this case is ineffective in identifyingthe driving styles (since it is the speed factor that ac-tually differentiates vehicles), whereas using speed orpairs speed/acceleration results in effective clustering.Interestingly, unsorted time series suffer somehow lessof this problem, probably indicating that the trend inthe variation of the acceleration contains informationthat can be exploited to characterize the driver’s be-haviour. Results with aggregate data again indicatean almost perfect clustering. The best results obtainedfor this scenario (m = 5, descending ordering, speedtraces) are shown in Figure 3b.
C. Hard scenario
The third scenario is the hardest for the cluster-ing algorithm. Here, some vehicles have the samephysical properties but different aggressiveness, whilstother have the same aggressiveness but different physi-cal properties. Therefore, driving styles will be similareven among different categories, which makes the clus-tering more challenging. The chosen parameters forSUMO are shown in Table IV. The simulation covers3,604 vehicles, 29.4% of class 1, 31.0% of class 2, 19.8%of class 3, 19.8% of class 4.
As shown in Table IV, this scenario is much morechallenging than the previous ones, and results are verydifferent. In this case, in fact, the best overall resultswere obtained when the data is left unsorted. The bestv-measure achieved is 0.733 for m = 20 and time-seriesthat combine speed and acceleration. These results canbe explained with the observation that, in a complex
(a) (b) (c)
Fig. 3: Results on the three scenarios: easy (a), intermediate (b) and hard (c). Colors indicate the cluster assignmentby k-means, whereas digits represent the true vehicle label. Black crosses indicate cluster centroids.
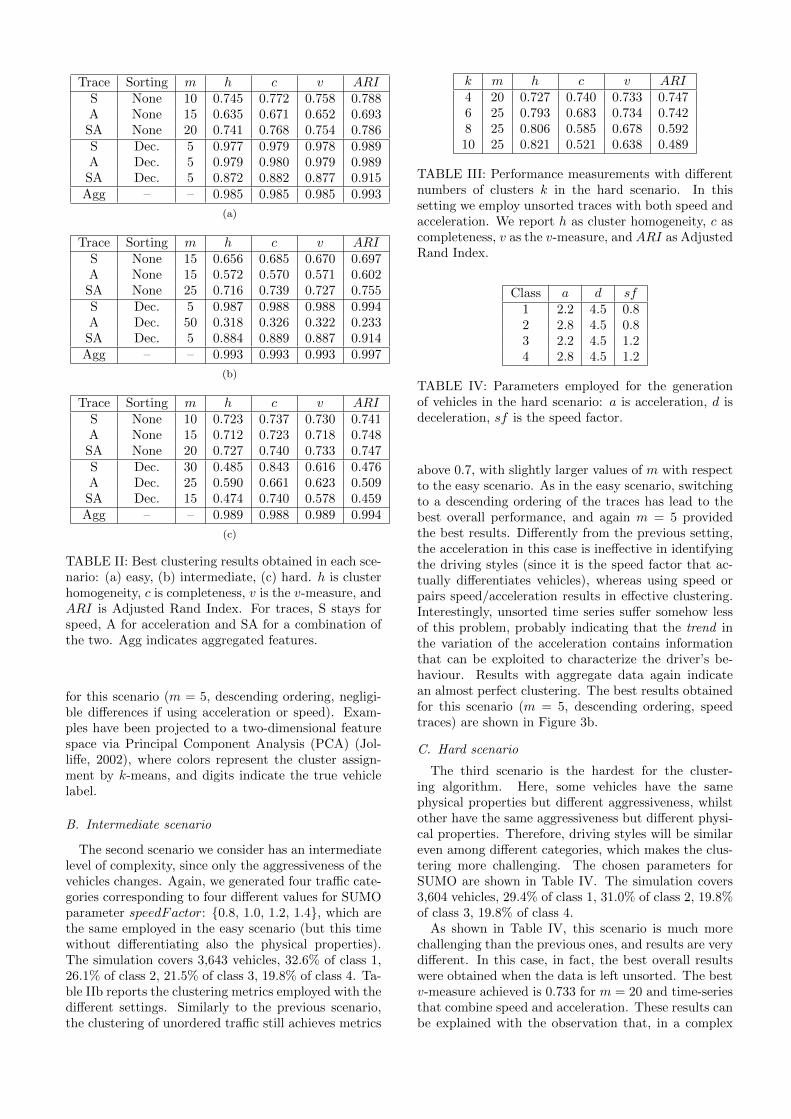
Fig. 4: Results on the hard scenarios obtained with 8clusters. Colors indicate the cluster assignment by k-means, whereas digits represent the true vehicle label.Black crosses indicate cluster centroids.
scenario, the largest speed and the corresponding accel-eration values are not sufficient to identify the drivingstyle. It is instead much more informative to observethe trend in the time-series, which allows to consider,for example, how long it takes, for a driver, to acceler-ate and decelerate up to a certain speed. This informa-tion is clearly encoded in the unsorted time-series, butnot in the ordered case. Table IIc reports the cluster-ing metrics employed with the different settings, andFigure 3c shows the clustering after PCA projection.
For this scenario, in Table III we also report resultsfor different numbers of clusters, obtained with un-sorted traces with both speed and acceleration infor-mation. As the number of clusters grows, homogeneityincreases, which means that the algorithms finds moreclusters, but with stronger intra-cluster similarities: asa trade-off, not surprisingly, completeness decreases, asvehicles of the same class are sometimes split across dif-ferent clusters. For example, Figure 4 shows that thebottom blue, brown and green clusters cover almostcompletely the fourth class of vehicles.
D. Discussion
The controlled experiments conducted with theSUMO simulator confirm that the proposed clusteringapproach could be effectively used to extract commondriving behaviors from traffic traces. Clearly, aggre-gated statistics work extremely well, but this can hap-pen only when there is a strong correlation betweenmaximum values of speed and acceleration and drivingstyle. Although such features are certainly crucial todetect common relevant patterns, they are not neces-sarily the only significant information in all real sce-narios. Using decreasing ordering for time-series, andexploiting short feature vectors, typically leads to verygood performance when the driving styles to be recog-nized are well distinguishable. On the other hand, itis very interesting to notice that unsorted traffic traceslead to very similar performance, in terms of clusteringmetrics, in all the three scenarios, thus showing to berobust across different, heterogeneous settings.
RELATED WORK
The problem of identifying common driving styleshas been the subject of several studies, althoughwithout considering its integration within the contextof micro-simulation tuning and optimization. Datamining techniques, including clustering, are employedin (Constantinescu et al., 2010) to identify commondriving behaviors, by constructing aggregated statis-tics from a collection of GPS data. Supervised learningtechniques for the classification of data coming frominertial sensors are presented in (Van Ly et al., 2013).In (Wang and Lukic, 2011) a review of the most widelyemployed features for driver characterization is pre-sented, with the aim to build support systems for hy-brid electric vehicle control strategy. Typical and ag-gressive driving style behaviors are classified in (John-son and Trivedi, 2011), by exploiting smartphones assensor platforms, and by employing a simple nearestneighbor classifier.

CONCLUSIONS
In this paper we presented a methodology for driv-ing style characterization, that could be exploited fora more realistic design and calibration of micro-trafficsimulators. The experimental results that we con-ducted in a controlled environment suggest that drivingstyles are best identified from the extreme behavioursof a driver, namely from the top-m largest values inthe speed and acceleration time-series, but only whenthe vehicle categories are characterized by marked dif-ferences. Within this setting, we observed that speedvalues are typically more informative for the character-ization of a driver. On the other hand, in more complexscenarios, it results to be more useful to consider a por-tion of the unsorted traffic trace, which allows to ob-serve also the trend in the speed and acceleration time-series. Among future research directions, we are cur-rently exploring the use of unsupervised deep networks,namely Stacked Denoising Autoencoders (Vincent etal., 2010), to perform automatic feature extraction fromtraffic time-series. More clustering algorithms will alsobe tested, and their performance will be evaluated asa function of the parameter representing the expectednumber of clusters, as we already started investigat-ing in the reported experiments. Dynamic time warp-ing (Berndt and Clifford, 1994) could also be an alter-native for the comparison of time series with differentlengths. It would be interesting also to assess the per-formance of the approach when vehicle categories areextremely imbalanced (i.e., few vehicles for some of thecategories). Finally, our ultimate goal would be to useour system with real traffic traces.
REFERENCES
Arthur, D. and S. Vassilvitskii (2007). “k-means++:The advantages of careful seeding”. In: Proceedingsof the eighteenth annual ACM-SIAM symposium onDiscrete algorithms. Society for Industrial and Ap-plied Mathematics, pp. 1027–1035.
Berndt, D. J. and J. Clifford (1994). “Using dynamictime warping to find patterns in time series.” In: KDDworkshop. Vol. 10. 16. Seattle, WA, pp. 359–370.
Constantinescu, Z., C. Marinoiu, and M. Vladoiu(2010). “Driving style analysis using data miningtechniques”. In: International Journal of ComputersCommunications & Control 5.5, pp. 654–663.
Hartigan, J. A. and M. A. Wong (1979). “AlgorithmAS 136: A k-means clustering algorithm”. In: Jour-nal of the Royal Statistical Society. Series C (AppliedStatistics) 28.1, pp. 100–108.
Hastie, T., R. Tibshirani, and J. Friedman (2001). TheElements of Statistical Learning. Springer Series inStatistics. Springer New York Inc.
Helbing, D. et al. (2002). “Micro-and macro-simulationof freeway traffic”. In: Mathematical and computermodelling 35.5-6, pp. 517–547.
Johnson, D. A. and M. M. Trivedi (2011). “Driv-ing style recognition using a smartphone as a sen-sor platform”. In: Intelligent Transportation Systems(ITSC), 2011 14th International IEEE Conferenceon. IEEE, pp. 1609–1615.
Jolliffe, I. (2002). Principal component analysis. WileyOnline Library.
Krajzewicz, D. et al. (2012). “Recent Development andApplications of SUMO - Simulation of Urban MObil-ity”. In: International Journal On Advances in Sys-tems and Measurements 5.3&4, pp. 128–138.
Van Ly, M., S. Martin, and M. M. Trivedi (2013).“Driver classification and driving style recognition us-ing inertial sensors”. In: Intelligent Vehicles Sympo-sium (IV), 2013 IEEE. IEEE, pp. 1040–1045.
Vincent, P. et al. (2010). “Stacked denoising autoen-coders: Learning useful representations in a deep net-work with a local denoising criterion”. In: Journal ofMachine Learning Research 11.Dec, pp. 3371–3408.
Wang, R. and S. M. Lukic (2011). “Review of driv-ing conditions prediction and driving style recogni-tion based control algorithms for hybrid electric ve-hicles”. In: Vehicle Power and Propulsion Conference(VPPC), 2011 IEEE. IEEE, pp. 1–7.
ALESSANDRO PETRARO is a software engineer atCubbit, a digital startup accelerated by the investmentfund Barcamper Ventures (PrimoMiglio SGR). His main in-terests are in the fields of artificial intelligence, machinelearning and distributed networks. His e-mail address is:[email protected] and his complete profile canbe found at https://www.linkedin.com/in/alessandro- petraro-b9aa308b
FEDERICO CASELLI is research associate at Depart-ment of Computer Science and Engineering at the Universityof Bologna. His main research interest are in the fields of trans-portation systems, simulations, distributed networks and deci-sion support systems.
MARCO LIPPI is assistant professor in Computer Engi-neering at the University of Modena and Reggio Emilia. Hismain research interests are in the fields of artificial intelligenceand machine learning, with applications to bioinformatics, argu-mentation mining, transportation systems and computer vision.His e-mail address is: [email protected] and his webpagecan be found at http://www.agentgroup.unimore.it/Lippi.
MICHELA MILANO is full professor of Artificial Intelli-gence at the Department of Computer Science and Engineering atthe University of Bologna. Her main research interest cover deci-sion support systems and their integration with machine learningalgorithms. She is Editor in Chief of the International JournalConstraints, member of the EurAI board, Executive Counsilor ofAAAI, author of more than 130 papers on peer reviewed journalsand conferences and coordinator of EU projects and industrialcollaborations.