driver behavior analysis using vehicular data - dilum...
TRANSCRIPT

i
UNIVERSITY OF MORATUWA
Department of Computer Science and Engineering
CS 4202 – Research and Development Project
Final Year Project Report
Driver Behavior Analysis using Vehicular Data
Project Group 15
K.A.De Zoysa Karunathilaka 120089X
P.U.Jayaweera 120273G
K.G. Kalani 120281E
R.W.P.M. Meththananda 120394D
Supervised by
Dr. H.M.N. Dilum Bandara
Coordinated By
Dr. Charith Chithraranjan
THIS REPORT IS SUBMITTED IN PARTIAL FULFILMENT OF THE REQUIREMENTS
FOR THE AWARD OF THE DEGREE OF BACHELOR OF SCIENCE OF ENGINEERING
AT UNIVERSITY OF MORATUWA, SRI LANKA.
27rd
of February, 2017

i
Declaration
We, the project group 15 (K.A.De Zoysa Karunathilaka, P.U. Jayaweera, K.G. Kalani, R.W.P.M.
Meththananda under the supervision of Dr. H.M.N. Dilum Bandara) hereby declare that except
where specified reference is made to the work of others, the project “Driver Behavior Analysis
using Vehicular Data” is our own work and contains nothing which is the outcome of work done
in collaboration with others, except as specified in the text and Acknowledgement.
Signatures of the candidates:
1. ................................................. K.A.De Zoysa Karunathilaka 120089X
2. ................................................. P.U.Jayaweera 120273G
3. ................................................. K.G. Kalani 120281E
4. ................................................. R.W.P.M. Meththananda 120394D
Supervisor:
..................................................
(Signature and Date)
Dr. H.M.N. Dilum Bandara
Project Coordinator:
..................................................
(Signature and Date)
Dr. Charith Chithraranjan

ii
Abstract
Usage Based Insurance (UBI) is one of the emerging trends in the insurance industry,
where the premium for the vehicle is calculated based on the driver‟s driving performance.
However, driver profiling techniques typically used in UBI rely on simple attributes such as
number of rapid breakings and are based on a small sample of driving within a week to a month.
This neither produces a detailed profile of the driver nor ensures that the driver continues to drive
safely after the sampling period. It could be more effective, if the driver can be monitored across
several key attributes throughout the driving and feedback could be send to the driver to improve
his/her driving habits. Expanded wireless broadband network access, emergence of Internet of
Things (IoT), and data analytics provide the right combination for rich monitoring and driver
feedback. Motivated by these concerns and emerging technologies, we focused on developing a
driver profiling system for UBI by retrieving real-time vehicular data. Driver and location related
data are collected through a Bluetooth-based On Board Diagnostic (OBD) dongle and
smartphone. The collected data are then transferred to the backend using a Representational State
Transfer (REST) API. Collected data are analyzed in both real-time and batch mode using WSO2
Data Analytics Server (DAS). The proposed system detects six types of abnormal driving
behaviors in real-time and notify the driver. The persisted data is used to conduct historical
analysis such as driver categorization (e.g., below normal, normal, abnormal, and risky),
calculation of relative skill and aggression scores, as well as comfort and safety factors. Results
of the analysis are then displayed on a dashboard using another REST API. Insurers may also use
the same API to pull the driver profile data to other systems.

iii
Acknowledgement First and foremost we would like to express our sincere gratitude to our project
supervisor, Dr. H.M.N. Dilum Bandara for the valuable guidance and dedicated involvement at
every step throughout the process.
In addition, we would like to thank Mr.Shashika Muramudalige, Mr. Malintha
Amarsinghe, Mr. Asiri Liyana Arachchi for the support, encouragement, and insightful
comments based on their knowledge on this field.
We would like to express our warm gratitude to Dr. Charith Chitraranjan for coordinating
the final year projects and also we would like to give our warm gratitude to Dr. Malaka Walpola
and Dr. Charith Chithraranjan who were in our project evaluation panel.
Last but not least, we would like to express our greatest gratitude to the Department of
Computer Science and Engineering, University of Moratuwa for providing the support for us to
successfully finish the project.

iv
Tables of Contents
List of Figures vi
List of Tables viii
List of Abbreviations ix
1. Introduction 1
1.1. Background 1
1.2. Motivation 1
1.3. Problem Statement 1
1.4 Objectives 2
1.5 Outline 2
2. Literature Survey 3
2.1 Driver Behavior Analysis 3
2.1.1 Driving Behavior Analysis Based on OBD Data and AdaBoost Algorithm 3
2.1.2. Abnormal Driving Detection using Real-Time GPS Data 5
2.1.3. Acceleration-Based Safety Evaluation Procedure for Smartphones 6
2.1.4. Driving Style Recognition Using Fuzzy Logic 8
2.1.5. Cloud-Based Driver Monitoring and Vehicle Diagnostic with OBD2 Telematics9
2.1.6. MyDrive: Drive Behavior Analytics Method and Platform 9
2.1.7. Predicting Driving Behavior Concerning with Driver‟s Past Movements 10
2.1.8. Driving Styles Recognition Using Decomposed Fuzzy Logic System 12
2.1.9. Reliable Method for Driving Events Recognition 13
2.1.10. Driver Behavior Recognition Based on a Driver Model Framework 14
2.2. Unsafe Driving Behaviors 15
2.3. OBDII 16
2.3.1. OBD-II Modes 17
2.3.2. OBD-II signaling protocols 17
2.3.3.How to access the OBD-II system 17
2.3.5.Diagnostic Trouble Code (DTC) 18
2.3.6.Control Panel of OBD-II Signal Generator 19
2.3.7. Decoding OBD Signals 19
2.4. WSO2 Data Analytic Server (DAS) 20
2.4.1 Collecting Data 21
2.4.2. Analyzing Data 21
2.4.3. Communicating results 22
3. Design 23
3.1. Mobile Application 24
3.2. Driver Profiling Platform 25

v
3.2.1. Authentication 28
3.2.2. Vehicular Data Publisher 28
3.2.3. Driving Behavior Analysis Results 29
3.2.4. DAS Stream Publisher 30
3.2.5. Profile Summary 30
3.3. Real-Time Analytics 31
3.4. Historical Analysis 33
3.4.1. Driving Score Calculation 33
4. Implementation 40
4.1. Languages, Tools, and Technologies 40
4.2. Mobile Application 40
4.2.1.Retrieving OBDII data 40
4.2.2. Generating payload 40
4.2.3. Transmitting Payload to Central Server 41
4.3. REST API 42
4.3.1. Authentication 42
4.4. Driver Profiling Platform 43
4.4.1. Real-Time Analysis 43
4.4.2. Historical Analysis 45
4.5. Implementation of Dashboard 45
4.6 Database 48
5 Results 49
5.1 Historical Analysis 49
5.2 Performance and Accuracy 51
5.2.1 Real-time Analysis 51
5.2.2 Historical Analysis 54
6. Summary 56
6.1 Conclusions 56
6.2 Challenges 56
6.3 Future work 56
7. References 58

vi
List of Figures
Figure 2.1: The flowchart of the proposed driving behavior analysis method. 03
Figure 2.2: User‟s driving style; (a) Friction circle edge and (b) g-g diagram for
driving experience
07
Figure 2.3: Driving safe diagram; (a) Construction of new “safe area” and (b)
Driving Style Diagram (DSD [ax – ay])
07
Figure 2.4: Distribution of points in the DSD for an aggressive driver(left) and a safe
driver (right)
08
Figure 2.5:Platform description scenario. 10
Figure 2.6: Basic architecture for predicting driving behavior using past movements 11
Figure 2.7: System Architecture Layout. 13
Figure 2.8: Process flow diagram 14
Figure 2.9: Abnormal Driving Behaviors; (a) Weaving, (b) Swerving, (c)
Sideslipping, (d) Turning with a wide radius, (e) Sudden braking, (f) Fast U-turn
16
Figure 2.10: Malfunction indicator light / Check engine light. 17
Figure 2.11: DLC connector; (a) Type A connector and (b) Type B connector 18
Figure 2.12: Diagnostic Trouble Code (DTC). 18
Figure 2.13: Control panel of OBDII 20
Figure 2.14: DAS architecture 21
Figure 3.1: Overview of the proposed system 24
Figure 3.2: High-level architecture of the proposed system 25
Figure 3.3: High-level architecture of the mobile application 26
Figure 3.4: High-level architecture of Driver Profiling Platform 27
Figure 3.5: REST API architecture diagram. 28
Figure 3.6: Authentication service flow diagram 29
Figure 3.7: Vehicular data publisher service flow diagram 30
Figure 3.8: Flow diagram for obtaining historical driving behavior analysis results 30

vii
Figure 3.9: Flow diagram for obtaining real-time driving behavior analysis results 31
Figure 3.10: DAS publisher service flow diagram 31
Figure 3.11: Profile summary service flow diagram 32
Figure 3.12 : Real time data analysation process 34
Figure 3.13: Event flow of detecting abnormal driving behaviors 34
Figure 3.14: Overall process of the driving score calculation. 36
Figure 3.15: Membership function for averaged norm. 39
Figure 3.16: Membership function for averaged speed. 40
Figure 3.17: Defuzzification of function of driving behavior 40
Figure 4.1: Main screen of the Mobile App 42
Figure 4.2: Execution plan of detecting hard acceleration and hard deceleration 44
Figure 4.3 : Abnormal driving behaviors detection data 45
Figure 4.4: Speed variation graph 45
Figure 4.5: Acceleration variation graph 46
Figure 4.6: User login page 47
Figure 4.7: Edit profile details 48
Figure 5.1 : Individual Category History 50
Figure 5.2: Current category of all users 50
Figure 5.3: Driving cycle. 51
Figure 5.4: RAS vs RSS 52
Figure 5.5: Result comparison between MyDrive vs Fuzzy logic 53

viii
List of Tables
Table 2.1: Threshold values for each feature 04
Table 3.2: Brief description of app modules. 25
Table 3.2: Description of profile summary service retrieve information 30
Table 3.3: Set of symbols 36
Table 4.1: Indicators in Mobile App 42
Table 5.1: Performance table 52

ix
List of Abbreviations
API Application Programming Interface
ASA Aggression Score Absolute
DAO Data Access Object
DAS Data Analytic Server
DPP Driver Profiling Platform
GPS Global Position System
HTTP Hyper Text Transfer Protocol
HTTPS Hyper Text Transfer Protocol Secure
JWT JSON Web Token
ODM Object Data Modeling
OSRM Open Source Routing Machine
RAS Relative Aggression Score
REST Representational State Transfer
RPM Revolution Per Minutes
RSS Relative Skill Score
SDK Software Development Kit
SSA Skill Score Absolute
UBI HTUser Based Insurance
UDF User Defined Function

1
1. Introduction
1.1. Background
Though vehicles are becoming safer, risky driving behavior is on the rise. This is due to
several factors such as fast-paced life where everyone is in a hurry, competition among drivers
(e.g., buses completing to collect more passengers), insufficient road signs, deteriorating road
conditions, negligence of law, higher number of novice drivers, and driving under influence.
Risky driving is detrimental, as not only it leads to accidents, but also leads to increased
insurance premiums for all drivers and low fuel efficiency. With ever increasing insurance
premiums and the advancement of technology, insurance companies are now starting to offer
Usage Based Insurance (UBI) [1]. UBI is based on the driver behavior, where a driver is ranked
from low risk to high risk based on his/her driving style, time of day, and location. However,
most UBI schemes are based on a multi-week, one time sample of driving behaviour such as hard
braking and rapid lateral movements [2]. Hence, the drivers may follow a safer driving pattern
during the sampling period, while they may adopt their natural behaviour once the sample is
taken and discount is obtained for the insurance premium.
1.2. Motivation
With the current demand, UBI concept could be raised up, if an accurate driver rating
method can be introduced. The drivers will not be able to fake the insurance companies by acting
safer during the sampling period, as the insurance company can observe the driver behavior in
real-time with the proposed solution. Moreover, when an unsafe driving behavior is detected, the
driver could be immediately alerted reminding the driver to drive safe. Whereas long-term
driving data analysis can also be used to educate on better driving habits that lead to safe and
efficient driving. Furthermore, the accuracy of driver profiling and driver feedback could be
improved by considering related factors such as current weather and road conditions. It is high-
time to develop such a solution given the recent technological advancements in mobile
computing, Internet of Things (IoT), wireless broadband, and data analytics. Such a solution
could reduce road accidents while improving driver behavior and reducing costs.
1.3. Problem Statement
If a driver can be made aware about his/her abnormal driving behaviors, it will be helpful
to reduce accidents and increase fuel efficiency. Moreover, insurance companies are now trying
to adopt UBI, which calculates the premium based on the driver‟s driving behavior and time of
driving because reckless driving badly affect the profitability of insurance companies. Therefore,
it is essential to have a system that can accurately profile a driver based on his/her driving
behavior using both real time and long term data, as well as other related vehicular and
environmental data. Thus, the problem this project tries to address can be defined as follows:

2
How to profile a driver based on his/her driving behavior using both real-time and long-
term data, as well as other related vehicular and environmental data?
1.4 Objectives
Develop a system for driver profiling and altering that is:
1. real time, where the process is based on live data rather than a data bundle collected
during a sampling period. The system should be capable of identifying abnormal
behaviors straight away.
2. accurate, where the system reveals the true nature of the driver. There should be no room
for a driver to intentionally change the evaluation of the system other than changing his
driving behaviors.
3. computationally efficient, where the system is capable of providing the service while
maintaining the above two qualities with the minimum usage of the computational and
bandwidth resources.
1.5 Outline
Rest of the report is organized as follows. Chapter 2 presents the literature review. The
architecture of the proposed system with the key components is discussed in the Chapter 3.
Implementation details are presented in chapter 4. Results are presented in chapter 5. Chapter 6
presents the performance and accuracy of the system. Conclusions and future work are presented
in Chapter 7.

3
2. Literature Survey
Various literatures have introduced several driving behavior analysis methods based on
the vehicular data and several implementations to analyze the driving behavior using vehicular
data. Section 2.1 discusses a selected set of driver behavior analysis methods and
implementations. When considering driving behaviors, certain driving behaviors are not very
safe. Such unsafe driving behaviors are discussed in the Section 2.2. While implementing a
driving behavior analysis system, vehicular and location data needs to be collected to analyze
driving behavior. These data can be collected using smartphones or OBDII port in the vehicle.
OBDII and GPS based area collection is discussed in Section 2.3. Section 2.4 present WSO2
Data Analytic Server (DAS) which can be used to conduct both real-time and batch data analysis.
2.1 Driver Behavior Analysis
2.1.1 Driving Behavior Analysis Based on OBD Data and AdaBoost Algorithm
Chen et al. [5] proposed a novel driving behavior analysis method based on the vehicle
On Board Diagnostic (OBD) data and AdaBoost algorithms. Via OBD interface authors collect
vehicle operational data, including vehicle speed, engine RPM, throttle position, and calculated
engine load. The proposed method consists of driving operation acquisition module, data
preprocessing module, and AdaBoost classification modules which can determine whether the
current driving behavior belongs to safe driving or not. Driving behavior analysis data will be
divided into training set and test set. Preprocessing and feature extraction are simultaneously
applied to both sets. Classification makes the test samples into the driving model based on
AdaBoost algorithms to classify and determine the test sample category.
Authors used three characteristics, i.e., the relative ratio of vehicle speed and engine
speed, relative ratio of throttle position and engine speed, and the engine load to analyze whether
the current state of the driving behavior is safe or dangerous. First, the proposed method
computes the change rate of vehicle speed, engine speed, and throttle position as follows:
D(t) = (data(t2) – data(t1)) / (t2 – t1) (2.1)
where t2 – t1 = 1.

4
Figure 2.1: Flowchart of the driving behavior analysis method [5].
Then it computes the relative ratio of the vehicle speed and engine speed, the relative
ratio of throttle position, and engine speed because there is lager difference between the values of
vehicle speed, engine speed, and the throttle opening. Calculation is shown in Equation 2.2 and
2.3.
Rcz(t) = ( cs(t) / 220 ) / ( zs(t) / 8000) (2.2)
Rjz(t) = (jq‟(t) / max (jq‟)) / (zs‟(t) / max (zs‟)) (2.3)
where Rcz(t) is the relative ratio of the vehicle speed and engine speed, cs(t) is the vehicle speed
at time t with maximum speed of 220, and zs(t) is the engine speed at time t with maximum
engine speed of 8000. Rjz(t) is the relative ratio of throttle position and engine speed, jq‟(t) is the
change rate of throttle position at time t, zs‟(t) is the change rate of engine speed at time t,
max(jq‟) and max(zs‟) are the maximum change rate values of throttle position and engine speed,
respectively.
Finally, the proposed method combines these three feature values which are the relative
ratio of the vehicle speed and engine speed, the relative ratio of throttle position and engine
speed, and engine load to determine whether the vehicle data is normal or bad driving condition.
Here authors have defined threshold values for each of these three features for normal and bad
conditions.

5
Table 2.1: Threshold values for each feature.
Features Normal Vehicle Condition Data Bad Vehicle Condition Data
Relative ratio of the vehicle
speed and engine speed
0.9 – 1.3 > 1.3 or < 0.9
Relative ratio of the engine
speed and throttle valve
0.9 – 1.3 > 1.3 or < 0.9
Engine load 20% - 50% > 50% or < 20%
Experimental results have shown the correctness of the proposed driving behavior
analysis method can achieve an average accuracy rate of 99.8%under various driving condition
simulations. In addition, they had said that using the real AdaBoost algorithm, the proposed
method could obtain 100% accuracy rate under 15 iterations. This proposed method does not
consider about the traffic condition, weather condition and the time in which the driver drives the
vehicle. These factors also affect to the driving pattern; hence, important to be considered.
2.1.2. Abnormal Driving Detection using Real-Time GPS Data
An abnormal driving detection method based on real time GPS data is presented in [6].
Authors used vehicle speed, direction, and acceleration details to detect the abnormal behavior
using GPS data. Authors collected a training data sample, analyzed those data and defined
threshold values for vehicle speed, acceleration and the vehicle direction. To get the threshold
value for vehicle direction, they had used steering wheel movement (SWM). SWM can be
distinguished between small movement (1-5 degree) and large movement (6-10 degree). As 5
degrees and below is considered small movement, 6 degrees and above will be used as a
threshold direction angle. According to the data of direction changing, the result shows for
normal condition, some movement from right to left and then to right (RLR) and from left to
right and then to left (LRL) movements were detected with a speed between above 0 km/h and
above 50 km/h but no LRLR or RLRL movement detected above 30 km/h. So they had come up
with a conclusion that abnormal driving will be detected if the driver turns left or right four times
continuously with speed more than 30 km/h. While collecting the training data sample authors
had considered about all traffic conditions and weather, day and night. After analyzing data, the
abnormal driving detection algorithm was created using two parameters; position and velocity.
Vehicle position or location determined by latitude, longitude and altitude while velocity is in
speed (km/h) and direction degree. The algorithm had been developed generally by three
behaviors which could contribute to abnormal behavior. Those three behaviors are sudden speed
drop with high deceleration, speed increase with high acceleration, and unsmooth vehicle
direction movements. They are calculated as follows:
Speed suddenly drop with high deceleration,

6
Vn < V n-1 and V n-1 – Vn > d
where Vn is current speed, V n-1 is previous speed, d is deceleration threshold value.
Speed increase with high acceleration,
Vn > V n-1 and Vn – V n-1 > a
where a is acceleration threshold f.
Unsmooth vehicle direction movements,
D1 > 0 and D2 < 0 and D3 > 0 and D4 < 0 and s > 30
or
D1 < 0 and D2 > 0 and D3 < 0 and D4 > 0 and s > 30
where D1 is Dn – D n-1, D2 is Dn-1 – D n-2, D3 is Dn-2 – D n-3, D4 is Dn-3 – D n-4, are all
directions and s is speed.
All abnormal driving is detected in algorithm by considering current, previous, and
historical data. Using this algorithm, abnormal driving behavior can be detected in real time.
However, the proposed algorithm can be applied to detect driving above speed limit that they
have proposed. In addition, this algorithm only considers about the vehicle movement of left or
right four times. But there may be abnormal driving with the movement of left or right three
times. This algorithm does not capture those scenarios.
2.1.3. Acceleration-Based Safety Evaluation Procedure for Smartphones
Rosolino et al. [7] proposed a prototype mobile application that can evaluate the grade of
safety that drivers are maintaining on the road. Authors measure both the longitudinal and lateral
acceleration and send a real-time warning to the user, if the driving behavior is not safe. This will
help drivers to correct their driving style to be more safe and less aggressive. The user‟s driving
style analyzation was based on both longitudinal and lateral acceleration values that are derived
from GPS position data. Here they have evaluated the aggressiveness by plotting vehicle‟s
acceleration on a g-g diagram where lateral acceleration displays on the horizontal axis and
longitudinal acceleration displays on vertical axis (friction circle). In addition, they have plotted
a g-g diagram for driving experiences too.

7
Figure 2.2: User‟s driving style; (a) Friction circle edge and (b) g-g diagram for driving
experience [7].
By overlapping the diagrams of driving experience and the friction circle, a new area of
safe driving has been identified. This new diagram has been named as Driving Safe Diagram
(DSD).
Figure 2.3: Driving safe diagram; (a) Construction of new “safe area” and (b) Driving Style
Diagram (DSD [ax – ay]) [7].
Here authors have considered about the road conditions whether the road is dry, wet, or
icy. According to their research, the new safe area has a limit of 2.5 ms-2
for both longitudinal
and lateral accelerations and 3.0 ms-2
for deceleration. In the experiment, to identify the
aggressive behavior, many potential dangerous events have been taken into account. Some of
them include excessive speeds, higher than the law limits, sudden, intense and repeated braking
and accelerations, aggressive left and right turns, aggressive U-turns and round about crossing,
aggressive lane changes, etc. The behavior of each driver has been evaluated by calculating the

8
percentage of points that are characterized by values of accelerations higher than the limiting
edges of the DSD area. This proposed method has allowed to establish a specific threshold for
this percentage. This threshold value has been used to develop a mobile application for a
systematic control of vehicle acceleration during a specific period of time with the possible with
the possibility of giving a continuous feedback to drivers. Experimental results showed that the
best threshold value for distinguishing between aggressive and non-aggressive driving behavior
can be set to 9% of external points.
Figure 2.4: Distribution of points in the DSD for an aggressive driver (left) and a safe driver
(right) [7].
While the proposed system considers about the road conditions (dry, wet, or icy), it does
not consider about the traffic conditions. However, aggressive behavior could be impacted by
traffic conditions because high traffic flows affect driver behavior in the passing maneuver, and
induce the driver to adopt highly risky behavior. Hence, traffic conditions should be considered.
2.1.4. Driving Style Recognition Using Fuzzy Logic
A driving style recognition approach using Fuzzy Logic is presented in [8]. Authors
proposed method recognize the driving styles: below normal, normal, aggressive and very
aggressive based on the readings of 2-axis accelerometer and the speed that is integrated in most
of the vehicle GPS trackers. All processing has been done on a web server. Here they have
calculated Euclidean norm of the longitudinal and lateral acceleration and average of the norm
has been combined with the speed of the vehicle to a fuzzy inference system to classify the
driving style to below normal, normal, aggressive and very aggressive. Fuzzy inference system
can be considered as an inference system that maps, by means of combination rules, input to
output using fuzzy logic. Here as first input of the inference system, norm of the acceleration on
longitudinal (forward and backward) and lateral (side to side) directions of the vehicle have been
used and corresponding fuzzy values have been defined to be Low, Medium and High, the
membership functions have been inferred Then as the second input, speed of the vehicle has been
used and corresponding fuzzy values has been defined to be Very Low, Low, Medium, High and
Very High, and corresponding membership functions have been inferred. Finally, the output of
the system is the driving behavior, which is defined by four fuzzy values Below Normal, Normal,
Aggressive and Very Aggressive. Then membership functions for that also have been inferred

9
The inputs and outputs membership functions and the fuzzy rules were tuned manually based the
real test data and three expert drivers. Membership functions have been inferred from the
analysis of a real data that recorded for normal and aggressive driving. This method has
considered only about the longitudinal and lateral accelerations and the vehicle speed. It has not
focus on the driving direction of the vehicle. Sometimes some drivers drive their vehicles in
normal pattern but change the vehicle directions aggressive way. This method has not focused on
that area.
2.1.5. Cloud-Based Driver Monitoring and Vehicle Diagnostic with OBD2 Telematics
Malintha et al. [9] proposed a cloud based vehicular data acquisition and analytic system
for monitoring real-time driver behavior, trip analysis and vehicle diagnostics. This system
consists of an On Board Diagnostics (OBD) port to Bluetooth dongle, an app running on a
smartphone and a cloud-based backend. In addition, there is a Complex Event Processors (CEP)
at both the smartphone and backend based on OBD data. This has been used to detect and notify
unsafe and anomalous events in real time. The CEP at the smartphone alerts drivers about the
rising coolant temperature and rapid drop of the fuel, provides trip logs and filter out messages to
be sent to the backend, saving both the bandwidth and power. Backend CEP detects reckless
driving in real time. In addition, backend uses historical data to detect driving anomalies and
predict impending sensor failures. So the proposed system is capable of collecting, storing and
analyzing vehicle data in real time as well as over a long period of time. The system has provided
a set of data analysis tools for reckless driving and driving anomaly detection, vehicle sensor
failure prediction, high fuel consumption and high coolant temperature alert generation and trip
detail summarization. The proposed method monitors drivers to detect two driving pattern. One
is reckless driving and other one is driving anomaly. The main deliverables to end users are the
mobile app for Android devices and the web interface which displays monitored data and
analyzed results. So the results of long-term analyses are displayed via a web interface and real
time results like alerts are displayed in the mobile app.
2.1.6. MyDrive: Drive Behavior Analytics Method and Platform
Drive Behavior Analytics Method and Platform has been proposed a top quality system to
monitor the driving style using a Skill Aggression Quantifier algorithm [9]. Here they are going
to do the analyzing part according to the following three parts. Peer group analysis, Individual
analysis and trip level analysis.

10
Figure 2.5: Platform description scenario [9].
In peer group analysis, they are going to analyze a particular driver based on a particular whole
group data. After collecting those data, they compute some requested value from their proposed
algorithm, Skill Aggression Quantifier and they categorize drivers based on following Rival,
Cautious, Novice, Risky types.
Individual analysis part is going to be compared with two phases. Training phase and
current phase are the labeled phase of the proposal. In training phase, authors consider first six or
seven trips as initial model and further collected trip data would be compared with previously
introduced model. Current phase is the phase that is going to be created a model with all trip data
and then they are going to analyze particular driver based on that current trip level model. Here
they are used some assumed threshold values. They are going to categorize driving patterns with
above mentioned threshold values as follows:
● Hard acceleration > 2.74 ms-2
,
● Hard deceleration < 2.74 ms-2
,
● 0.1 ms-2
< Normal acceleration < 2.74 ms-2
,
● -0.1 ms-2
< Normal deceleration < -2.74 ms-2
In trip level analysis is going to manage all trip data and compare with current trip data.
In all step they are going to collect data using their proposed mobile system, named My
Drive. Collected data is stored in cloud based network, analyze at the back end and display the
statistically analyzed results on the dashboard as per request by the user of the platform.
2.1.7. Predicting Driving Behavior Concerning with Driver’s Past Movements

11
Figure 2.6: Basic architecture for predicting driving behavior using past movements [10].
Another method for predicting driving behavior has been introduced [10] as a modeling
method for predicting driving behavior concerning with drivers past movements. Here they have
mainly considered about the past driving patterns of the drivers since they highly think that
human‟s behavior is strongly related to the past details. They mainly focused how to prevent
accident by stopping vehicle before happening the accident. According to the proposed system,
they need to monitor not only the moving speed and following details of the system using vehicle
but also the vehicles that are closely driven for that particular vehicle. They are going to use
radar sensor system to track following vehicle and leading vehicle moving patterns. To analysis
this part, they are collecting velocity and pedal strokes as deriving data using driving simulator.
They introduced Current Driving Trigger to consider the chain in dynamic flow of the past
actions.
Because they only focused on stopping probability of the vehicle, there may some erroneous
predictions since there are so many normally aggressive drivers, who are driving very close to
other vehicle with some related high speed. But they are very accurate. But time passed, their
model is getting improved and system would be accurate. Until that happen their proposed
system is not an advanced one.
In addition to predict the happening an accident, they are going to monitor the drivers‟
pattern and simulate the details and predict their next behavior. For that particular task, they are
using Dynamic Bayesian Network which is structured on Auto Regressive Hidden Markov
Model. These driving styles are going to recognize using decomposed fuzzy logic system as
decision making process, used fuzzy logic model.
There are two parts in proposed system which are in vehicle embedded system and web
based system while our system doesn‟t have such vehicle embedded system and need only a
OBD2 dongle to retrieve data from the vehicle engine and our system also has a web based
analysis system with cloud storage to store collected data and store analyzed data. In-vehicle
system contains GPS receiver to track the speed and locations, two axis accelerometer to track
lateral movements. Such acceleration details are used to identify the sudden movements.

12
2.1.8. Driving Styles Recognition Using Decomposed Fuzzy Logic System
An advanced driving styles recognition system has been proposed here [11] which is
enforced with fuzzy logic by enhancing the fuzzy logic concept. There are so many reasoning
applications that are predicting the future happenings by using fuzzy logic. But, according to this
proposed system, they have showed us, accuracy of the system with real scenarios than the
traditional fuzzy logic system since this proposed system is used the decomposed fuzzy logic
algorithm.
Dimension of this system can be considered as multidimensional system, since this
system is considered so many conditions when reasoning an incident. They consider speed,
acceleration and distance between leading and following vehicle. To obtain above data from the
monitoring vehicle, they use some few gadgets while we are using only OBD2 dongle in our
proposed system. They are using two radar sensor to get data about distance with leading vehicle
and following vehicle. To obtain the acceleration details, they are using two dimensional
accelerometers. We are also proposed 2D accelerometer which is embedded with OBD2 dongle
to get sense about lateral movements. In addition to that they are using GPS module to get data
related to the position and the speed while we are also using GPS tracker embedded with our
OBD2 dongle. This system is manipulated by a microcontroller which is embedded to the
vehicle. The consequences of the proposed system they need to add those gadgets separately for
the system. But in our proposed system is only using OBD2 dongle which is really easy to apply
for the system. they also using GPRS to communicate with cloud while we use little bit of GPRS
as communication method as we are sending analyzed summary for the mobile application. This
system can be considered as very close approach to our system but our system is little bit
enhance since we are using weather conditions, road conditions and we are pitching the analyzed
data to get Usage Based Insurance approach. Since they are using decomposed fuzzy logic
system, they are using three separated model to analyze the speed, acceleration, distance.
According to the analyzing part they are using following categories to categorize the monitored
drivers‟ styles.
Further that, following rules will be based to the values of Membership function of fuzzy
logic.
● Speed = low and acceleration = low and distance far – driving style = below normal.
● Speed = normal and acceleration = normal and distance = normal – driving style =
normal.
● Speed – high and acceleration = high and distance = close – driving style = aggressive
Speed – very high and acceleration = very high and distance = very close – driving style = very
aggressive.

13
Figure 2.7: System Architecture Layout [11].
2.1.9. Reliable Method for Driving Events Recognition
This proposed system is really not a system that is going to analyze risky driving patterns.
They are predicting next driving patterns based on GPS locations and previous data collections
[12]. This can be really used as a model for comparing presenting behavior.
Here they are using Hidden Markov Model to recognize driving event. As well as they
are using some embedded system which is contained Gyroscope, GPS tracker, 2D accelerometer.
In this system data processing system is embedded with vehicle and no need to send to cloud.
This concept is not reliable since storage capacity is limited and applying system is very
expensive since customer must have to buy the computer parts also and need to attach it into the
vehicle.
However, they are collecting data and processing to recognize the event. For that analyze
part they are using Hidden Markov model. Here they are using some model such as previous data
set, situation model and current building model. Using those models, they predict the next event
of the driver and then they assess the prediction. According to the result their model is to be
enhanced.
Some vehicles are routing their path in similar way. By tracking GPS location, system
can predict the next driving event based on previous data. By comparing the result, we are able to
recognize who is the driver since driving pattern is very unique from driver to driver. Otherwise
we can predict they are not under the normal behavior at the moment by comparing the result and
predictions.
Moreover, they are proposing to normalize collected data. This would be really helpful
since data storage should be efficient in this system because they are not going to use cloud
based method. But our proposed system is used as cloud based system. We are not going to face
limited storage problem.

14
Figure 2.8: Process flow diagram [12].
2.1.10. Driver Behavior Recognition Based on a Driver Model Framework
A driver behavior recognition method based on a driver model framework is presented in
[13]. Authors characterized and detect driving pattern and make the framework of a cognitive
model of human behavior [5]. HMM-based steering behavior models for emergency and normal
lane changes as well as for lane keeping were developed using a moving base driving simulator.
Authors did not represent specific driver behaviors classification like Neutral, Assertive, and
Aggressive. In this research construct drive behaviors model using drive behaviors recognition
methods. This model explains and reproduces drivers‟ behavioral characteristics. In this study
mainly focused on lane change maneuvers among various driving actions. Previously developed
some method estimate a driver‟s lane change intention, but these models data get from vehicle,
so this method based on vehicle.
Here they are used driver behavior recognition method based on Hidden Markov Model
(HMM). Authors used three different maneuvers to recognize driver behavior. They are
emergency lane change, normal lane change, and lane keeping. They used motion based driving
simulator to measure driving behavior data and they measure steering angle as data for driver
behavior recognition method. This simulation did on a motorway traffic environment was used to
measure driver behavior data.

15
They measured data categorized to three categories. They are emergency lane change,
normal lane change, and lane keeping. Three types of lane change event data were extracted
according to the period and the first peak of the steering angle. For another category, data were
extracted for a five-second interval from the original data measured with the driving simulator.
2.2. Unsafe Driving Behaviors
Real-time abnormal driving behaviors monitoring is very important to improve driving
safety. There are so many abnormal driving behaviors and Chen et al. has discussed about six
types of abnormal driving behaviors [14]. They are,
a. Weaving - Driving alternately toward one side of the lane and then the other, i.e.
serpentine driving or driving in S- shape.
b. Swerving - making an abrupt redirection when driving along a generally straight
course.
c. Side-slipping - when driving in a generally straight line, but deviating from the normal
driving direction.
d. Turning with a wide radius - Turning cross an intersection at such an extremely high
speed that the car would drive along a curve with a big radius, and the vehicle sometimes
appears to drift outside of the lane, or into another line.
e. Sudden Braking - when the driver slams on the brake and the vehicle‟s speed falls
down sharply in a very short period of time
f. Fast U-turn - a fast turning in U-shape, i.e., turning round (180 degrees) quickly and
then driving along the opposite direction.
(a) (b) (c) (d) (e) (f)
Figure 2.9 : Abnormal Driving Behaviors; (a) Weaving, (b) Swerving, (c) Sideslipping,
(d) Turning with a wide radius, (e) Sudden braking, (f) Fast U-turn
All these driving behaviors have an unique pattern on acceleration. When considering
weaving pattern, it has a drastic fluctuation on acceleration on x-axis and this fluctuation
continues for a period of time. But acceleration on y-axis keeps smooth. Both standard deviation
and the range of acceleration on x-axis are very large and time duration is long. The mean value
of acceleration on x-axis is around zero. Since swerving is an abrupt, instant behavior, the time

16
duration is very short. When swerving occurs, there is a great peak on acceleration on x-axis.
Thus, the range and standard deviation of acceleration on x-axis are large, and the mean value is
not near zero. In addition, acceleration on y axis is flat during swerving. When sideslipping
occurs, acceleration on y-axis falls down sharply. Thus, the minimum value and mean value of
acceleration on y-axis are negative, and the range of acceleration on y-axis is large. In addition,
acceleration on x-axis in sideslipping is not near zero. If the vehicle slips toward the right side,
acceleration on x-axis would be around a positive value, while if left, then negative. The mean
value of acceleration on x-axis thus is not near zero. Since sideslipping is an abrupt driving
behavior, the time duration is short. When a driver turns right or left fast in U-shape, acceleration
on x-axis rises quickly to a very high value or drops fast to a very low value, respectively.
Moreover, the value would last for a period of time. The standard deviation of acceleration on x-
axis thus is large on the beginning and ending of a fast U-turn, the mean value of acceleration on
x-axis is far from zero and the range of acceleration on x-axis is large. When it comes to
acceleration on y-axis, there are no obvious changes. It may take a period of time to finish a fast
U-turn; hence, the time duration is long. When turning at an extremely high speed, acceleration
on x-axis sees a high magnitude for a period of time, while the acceleration on y-axis is around
zero. Thus, the mean value of acceleration on x-axis is far from zero and the standard deviation is
large. It may take a period of time to finish a turning with a wide radius, so the time duration is
long. When a vehicle brakes suddenly, acceleration on x-axis remains flat while acceleration on
y-axis sharply downs and keeps negative for some time. Thus, the standard deviation and value
range of acceleration on x-axis are small. On acceleration on y-axis, the standard deviation is
large at the beginning and ending of a sudden braking and the range of accy is acceleration on y-
axis. Since sudden braking is an abrupt driving behavior, the time duration is short.
Likewise, each of these abnormal driving behaviors have an unique pattern on
acceleration on x-axis and y-axis. By analyzing the acceleration data in a certain time period,
there abnormal driving pattern can be detected
2.3. OBDII
To collect the driving data, smartphone or OBDII system can be used. But when we
consider the accuracy of the data coming from the smartphone and the OBDII system, accuracy
of the data collecting from the OBDII is higher than the data collecting from the smartphone. So
we used OBDII system to collect vehicular data.
OBDII is a computer-based system that is designed to reduce emissions by monitoring
the performance of major engine components. OBD implementations use a standardized digital
communications port to provide real-time data in addition to a standardized series of diagnostic
trouble codes, or DTCs, which allow one to rapidly identify and remedy malfunctions within the
vehicle. OBD system monitors different parameters of vehicle and store information in memory
but does not have any interface for users. Whenever a fault arises in the vehicle, the system
senses that fault and notifies it to the user using a Malfunction Indicator Light (MIL). This is not
an effective way of warning indication because the user cannot tell which part has the fault, what
the fault is and when it occurs [15].

17
Figure 2.10: Malfunction indicator light / Check engine light.
2.3.1. OBD-II Modes
OBD has defined 10 modes of diagnostics. These modes do not depend on the protocol
that is used. Not each mode is necessarily supported by the Engine Control Unit (ECU). Each
mode supports for different Parameter Identifications (PIDs) that are used to obtain the vehicular
data.
2.3.2. OBD-II signaling protocols
There are five signaling protocols that are permitted with the OBD-II interface. Most
vehicles support for only one of the protocols. Those protocols are,
1. SAE J1850 PWM (Pulse with Modulation)
2. SAE J1850 VPW (Variable Pulse Width)
3. ISO 9141-2
4. ISO 14230 KWP2000 (Keyword Protocol 2000)
5. ISO 15765 CAN
Generally, the protocol that is used for the vehicle can be determined by looking at the pinout of
the OBD-II connector.
2.3.3. How to access the OBD-II system
The system can be accessed through the Data Link Connector (DLC). This connector has
16 pins and it can tell us which protocol the car communicates with, depending on which pins are
populated in it. Officially this connector is called as an SAE J1962 Diagnostic Connector. This is
located at the bottom of the dashboard.
OBD-II Diagnostic Connector/ Data Link Connector (DLC)
There are two types of connectors called Type A and Type B. Both are female, 16-pin, D-
shape connectors.
● Type A connector – This is used for vehicles that use 12V supply voltage

18
● Type B connector – This is used for 24V vehicles.
(a) (b)
Figure 2.11: DLC connector; (a) Type A connector and (b) Type B connector.
In the DLC connector, 9 pins have fixed functions and rest pins have been left to the
discretion of the vehicle manufacturer. To communicate with the OBD system, various
diagnostic tools can be used. These tools can be connected to the DLC and can be used to
retrieve Diagnostic Trouble Codes that is generated by OBD-II system, to display the OBD-II
vehicle data.
2.3.5. Diagnostic Trouble Code (DTC)
This code is used to describe what/where and when the failure occurred. OBD system
stores this code in the memory inside the Engine Control Unit (ECU). This code can either be
generic or unique to vehicle manufacture.
Figure 2.12 :Diagnostic Trouble Code (DTC).

19
2.3.6.Control Panel of OBD-II Signal Generator
Figure 2.13: Control panel of OBDII [5].
The left side of the control panel is OBD data input control terminal and the right side is
output control terminal. Middle of the control panel contains interlocking switches and OBD-II
data link connector.
● Input control terminal - This has knob input and jack input method. The knob input is
manual adjustment mode. The jack input is external analog signal input.
● Output control terminal - This has indicator lights and jack output method. Indicator
lights show the operation status of engine components. The jack output can achieve data
output displayed on other devices.
● Middle of the control panel - Interlocking switches that are located in the middle of the
control panel are designed to control the synchronization between the throttle value and
the engine RPM.
When it is in the,
Open state - Acceleration pedal is available to control the throttle and engine RPM at the
same time
Close state - One can control throttle and engine RPM individually.
Data link connector achieves the OBD data output.
2.3.7. Decoding OBD Signals
OBD-II provides access to data from the Engine Control Unit (ECU) and provides the

20
valuable information when troubleshooting problems occur inside a vehicle. Here the OBD
signal can be decoded via OBD Mode operation with appropriate Parameter Identifications
(PIDs) which are defined in J1979. These PIDs are used to request data from a vehicle. That
means each PID describes the meaningful vehicle data.
Not all PIDs are supported on all protocols. There are unique, custom PIDs for each
manufacturer. These are not generally published. Hence, it needs to do a lot of hunting or reverse
engineering to determine to which system each PID relates.
An automotive technician uses PIDs with a scan tool which is connected to the OBD-II
connector.
● The technician enters the PID.
● The scan tool sends it to the vehicle‟s controller-are network (CAN)-bus, VPW, PWM,
ISO, KWP.
● A device on the bus recognizes the PID as one it is responsible for, and reports the
value for that PID to the bus.
● The scan tool reads the response and displays it to the technician.
2.4. WSO2 Data Analytic Server (DAS)
DAS is a fully open source solution for aggregating and analyzing data and presenting
information about the business activities. It provides real-time, batch, interactive and predictive
(via machine learning) analysis of data into one integrated platform.
DAS has a ability to build systems and applications that collect and analyze both real-
time and persisted data and communicate the results. The workflow of the DAS consists of three
main phases. They are [16],
● Collecting Data
● Analyzing Data
● Communicating Results

21
Figure 2.14: DAS architecture [16].
2.4.1 Collecting Data
DAS provides a single API for external data sources to publish data events to it. In
addition, it provides configurable options either to process the data event stream inflow for real
time analysis, to persist data for batch analysis and to index for interactive analysis.
● Data Agents - Data Agents are external sources which publishes data to DAS. Agent
components reside in external systems and pushes data as events to the DAS.
● Event Receivers - Data published by the data agents are received by the event receiver
and each event receiver is associated with an event stream which data are persisted or
process using Event Processors.
2.4.2. Analyzing Data
DAS provides facilities for real time analysis as well as batch analysis as follows:
● Batch Analysis - Batch analysis can be performed for persist event streams. DAS batch
analytics engine is powered by Apache Spark which accesses the underlying data storage
and executes programs to process the event data. Spark SQL is used to create analysis
plan to be executed
● Real-time analytics - In the DAS, there is a real time analytics engine called as Siddhi
Event Processor. This real time analytic engine can process multiple event streams in
real-time. All the analysis rules are implemented in an execution plan using Siddhi Query
Language. Execution plan is the editor for the event processing logic. An execution plan
consists of a set of queries and import and export streams. When an new event occurs this
execution plan is executed in the real time analytics engine and produces an output event.
● Interactive analytics - This is used to get fast result through adhoc querying of a data set.
Interactive analytics in DAS is possible when selecting to index event stream attributes.
● Predictive Analytics - Predictive analytics for data in DAS is integrated with WSO2 ML.

22
This integration allows WSO2 ML to use an Analytics table in DAS as a dataset and
make predictions/recommendations using that data by applying Machine Learning
algorithms.
2.4.3. Communicating results
WSO2 DAS uses several presentation mechanism to present the event notifications and
processing results.
● Event Publishers - Output data either from Spark script or Siddhi CEP engine are
published from DAS using event publishers.
● Analytic Dashboard - Analytic Dashboard has been created for visualization of analytic
data. Dashboard creation is wizard driven, where widgets/gadgets such as line, bar, and
arc charts can be used to get data from analytical tables and add them on a structured grid
layout to provide an overall view
● Analytics REST API - DAS facilitates REST API based data publishing and REST API
can be used with Web applications and Web services.

23
3. Design
Figure 3.1 illustrates an overview of the proposed system, which consists of five parts as
follows:
● Mobile App
● REST API
● Driver Profiling Platform
○ Real-time analysis
○ Batch analysis
● Dashboard
● Database
The mobile app works as a data collector. It collects data from the dongle and sends them to the
Driver Profiling Platform (DPP) through a REST API. DPP implements all real time and
historical data analysis techniques. Results of the real time and historical analysis are then
displayed on the dashboard, as well as send to the mobile app in the suitable form of a feedback
to the driver. High-level architecture of the proposed system is illustrated in Figure 3.2. Next, we
discuss each of the layers in detail.
Figure 3.1: Overview of the proposed system.

24
Figure 3.2: High-level Architecture of the proposed system.
3.1. Mobile Application
The mobile application provides three main requirements of the system, namely:
1. Retrieve vehicular data from the dongle via bluetooth.
2. Send data to the server.
3. Generate alerts to the driver on his/her abnormal behaviors.
Figure 3.3: High-level architecture of the mobile application.

25
As seen on Figure 3.3 app consists of five modules, and their functionalities are described
in Table 3.1.
Table 3.1: Description of app modules.
Module Description Tasks I/O
Monitor Stream that is received from
OBDII dongle is processed and
payloads is generated based on the
given configuration.
1. Retrieve specified
data from data stream
as defined by
application. 2. Run simple queries
and filter out
important records.
Input: OBDII Data
stream
Output: Predefined
data (as a series of
events)
Http
Handler Responsible for communication
between server and app using
HTTP.
1. Maintain connection
between application
and the server. 2. Send data to server. 3. Retrieve alerts from
server.
Input: Payloads and
URL to be sent Output: Payloads
received from server
Location
Tracker Once the user grants access to GPS
on smartphone, module requests
location data from smartphone and
update the location variable.
1. Maintain current
location coordinates. 2. Send coordinates
when requested by
other modules.
Input: GPS data (from
mobile sensor) Output: Longitude and
latitude at requested
time
Data
Logger All the payloads that is received
from the dongle is logged as a
CSV (Comma-Separated Values)
file in smartphone‟s internal
storage.
1. Writer data records
to the log file. Input: Data records (as
payloads) Output: Output stream
to be written to a log
file.
Alert
Generator When current category of the
driver is changed into an abnormal
category, an alert is generated to
notify driver.
1. Generate alerts to
driver on change of
category.
Input: Alert
information (Type,
Title, etc.) Output: Android Alert
3.2. Driver Profiling Platform
In this system the main component is Driver Profiling Platform (DPP). Following three
clients communicates with the DDP using a REST API
1. Mobile application
2. Dashboard
3. Third-party users

26
Figure 3.4 shows the high-level architectural diagram of the DPP. DPP includes three
components, namely RESTful API, backend database, and data analytics server. Routing engine,
mobile app, dashboard, and third-party client API are connected as external components. DPP
provides a RESTful API (REST API) which exposes DPP‟s functionalities to the clients to get
analytic detail, ingest vehicular data, persist data in backend database, and manage user
authentication.
Figure 3.4: High-level architecture of Driver Profiling Platform.

27
Figure 3.5: REST API architecture diagram.
Figure 3.5 shows the architectural diagram of the REST API. It illustrates how a client‟s
HTTP request executes via REST API. A client (Web portal) sends request (HTTP/HTTPS) to
the REST API and the app (Front Controller) which is inside the REST API receives all of those
requests and sends them either to the Authentication Filter or Route (Controller). If the client
calls a user login request or a user registration (Sign up) request, then app redirects request to the
Route (Controller) otherwise app redirects request to the Authentication Filter. Authentication
filter checks whether the user is valid or not and if it is, sends the filtered URL to the Route
(Controller). If the user is not valid, authentication filter sends a response to the client informing
that the user authentication is invalid. When the request reaches to the controller, the controller
calls for the services according to the client‟s request and then services access the database via
repository (Data Access Object) and the application via HTTP/HTTPS requests according to the

28
need of the client. These applications are web servers which provide following services related to
the system:
1. Data Analytic Server (DAS) - This service is with DPP and analyzes o driving
data. In this scenario REST services publish vehicular data as driving data which are
published by mobile app in the REST services and request result of driving behavior
analysis according to the client request.
2. Routing Engine for Road Network - This is a third-party application outside the
DPP. Routing engine use to get route information according GPS data(longitude, latitude)
in vehicular data. The routing engine provides diffrence services to get road network
information. When the DPP REST services call only trip services to get information
about trip using GPS data. Using this service the DPP get trip distance and route type like
road network information.
Next, we discuss services supported by the DPP REST API.
3.2.1. Authentication
DPP uses a shared-key authentication mechanism to maintain under the authorization of
DPP. As seen in Figure 3.6, client applications send login request to the REST API before calling
the other services of the REST API. If the login request is successful, then REST API sends
shared key to the client as response to the login request. Client must attach this shared key with
all future API calls after the login request. Because client calls all request exclude login, signup
and data analytics server publisher request go through authentication filter. When this filter
checks whether the shared key attaches with a request is valid or not. If the shared key is valid,
then request is forwarded to the route to access service. Otherwise, forwards request to the app
indicating authentication failed response.
Figure 3.6: Authentication service flow diagram.
3.2.2. Vehicular Data Publisher
Vehicular data publisher service forwards vehicular data which are sent by mobile app
into data analytics server‟s input stream (see Figure 3.7). When mobile app publish data via the
REST API, then the API generates and attaches trip ID and vehicle registration number to the
payload of vehicular data and forward (i.e., publish) modified payload in the DAS input stream.

29
Figure 3.7: Vehicular data publisher service flow diagram.
3.2.3. Driving Behavior Analysis Results
Driving behavior analysis service produces both historical and real time analysis results.
As seen in Figure 3.8 analysis data are directly retrieved from DAS according to the client
application request. When the client application requests historical driving behavior data through
the REST API, it is routed to the DAS. After retrieving historical analysis data from DAS,
response is send back to the relevant client. A response typically consists of following attributes:
● Relative Skill Score value (RSS)
● Relative Aggression Score value (RAS)
● Driver category history
● Current category of all users
● Driving cycle data (e.g., acceleration count details)
● Safety factor
● Comfort factor
Figure 3.8: Flow diagram for obtaining historical driving behavior analysis results.
Figure 3.9 illustrates the process of retrieving real-time analysis data from the backend
database based on the client application request. When client application requests real-time
driving behavior data via the REST API, request is routed to the persist data in backend database.
The response is then send back to the relevant client.
30
Figure 3.9: Flow diagram for obtaining real-time driving behavior analysis results.
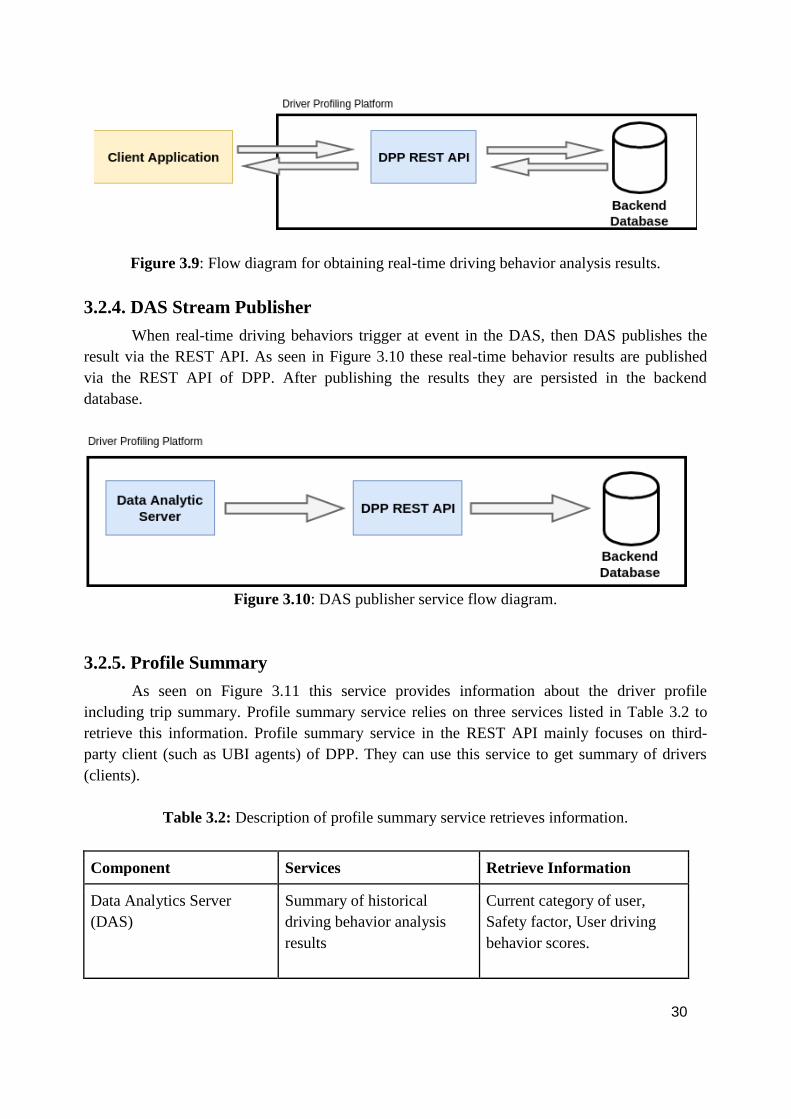
3.2.4. DAS Stream Publisher
When real-time driving behaviors trigger at event in the DAS, then DAS publishes the
result via the REST API. As seen in Figure 3.10 these real-time behavior results are published
via the REST API of DPP. After publishing the results they are persisted in the backend
database.
Figure 3.10: DAS publisher service flow diagram.
3.2.5. Profile Summary
As seen on Figure 3.11 this service provides information about the driver profile
including trip summary. Profile summary service relies on three services listed in Table 3.2 to
retrieve this information. Profile summary service in the REST API mainly focuses on third-
party client (such as UBI agents) of DPP. They can use this service to get summary of drivers
(clients).
Table 3.2: Description of profile summary service retrieves information.
Component Services Retrieve Information
Data Analytics Server
(DAS)
Summary of historical
driving behavior analysis
results
Current category of user,
Safety factor, User driving
behavior scores.

31
Routing engine Trip detail (using GPS points
(longitude, latitude) detail)
Distance, Route type
Backend database Summary of real-time
driving behavior Analysis
results
Hard acceleration, hard
deceleration, weaving, and
slide slipping count
Figure 3.11: Profile summary service flow diagram.
3.3. Real-Time Analytics
The main objective of real-time driving data analysis is to evaluate a driver‟s real-time
behavior detects abnormal driving behaviors, and then make drivers aware about those behaviors.
Following attributes are calculated to detect driver behavior and then shown on the dashboard:
● Average speed
● Acceleration
● Hard acceleration count
● Hard deceleration count
On the dashboard, average speed variation and acceleration variation are displayed as time series
graphs. Hard acceleration and deceleration counts are displayed as numbers over a given period
of time.
The system can detect five types of abnormal driving behaviors. They are weaving,
swerving, sideslipping, turn with wide radius, and sudden braking [14]. Abnormal driving

32
behaviors have their unique pattern on acceleration. Because of that, acceleration along x and y
axis and time can be used to detect these abnormal driving behaviors. Normal driving behavior is
smooth and safe driving with a few fluctuations. In addition, acceleration along and y axis are not
very large. Moreover, mean, standard deviation, minimum and maximum values in acceleration
along both axis are near zero. Whereas abnormal driving behaviors are risky driving with high
fluctuations in mean, standard deviation, minimum, and maximum values along box axis.
Due to these variations on acceleration data, statistics such as average, standard deviation,
minimum, maximum and range of acceleration data on x-axis and y-axis are calculated to
analyze driving data to detect abnormal driving behaviors. Here threshold values for each of
these statistics were defined according to the abnormal driving behaviors and driving data are
compared with these pre-defined threshold values to detect abnormal driving patterns. These
rules have been implemented on the DAS. DAS has been set up in the DPP in the backend. DAS
provides both real time and long-term data analysis facilities with high performance. Because of
that, we used DAS to implement these set of rules.
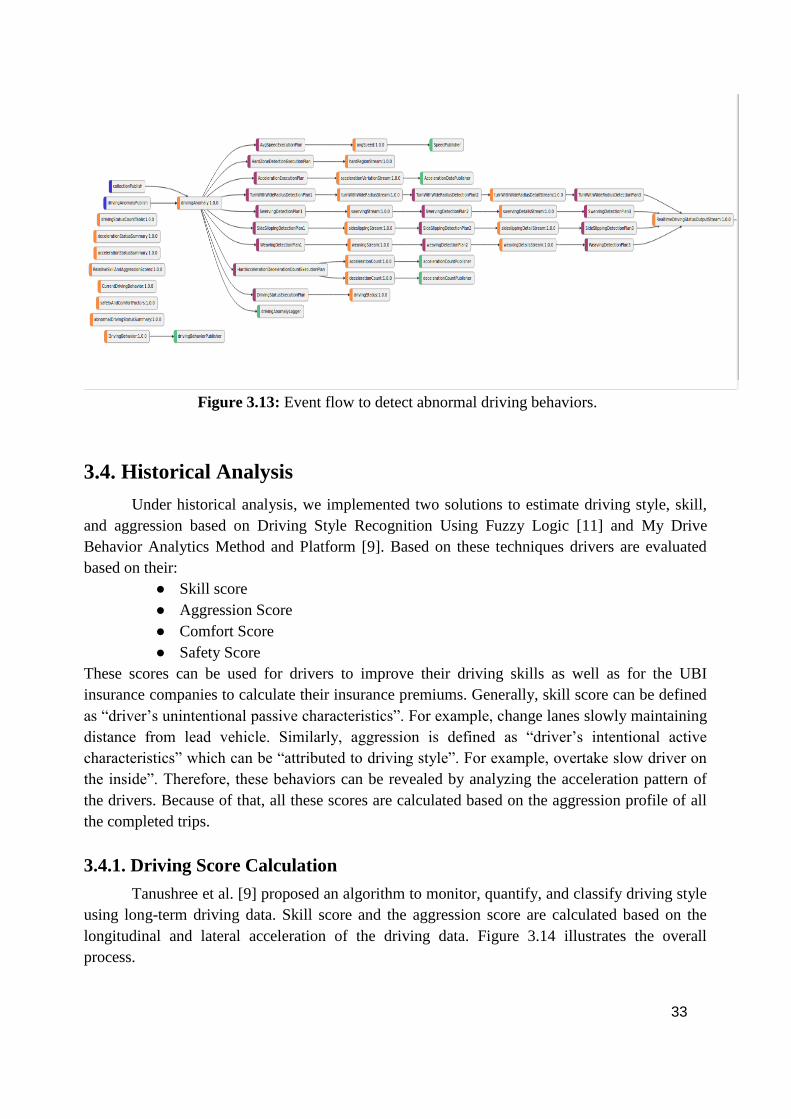
The mobile app sends data as events to the backend through the REST API, which is then
forwarded to the DAS (see Figure 3.13). Event receiver is associated with an event stream and it
persists incoming data for batch analysis. Moreover, it directs the stream to the Siddhi Complex
Event Processor (CEP) inside DAS for real-time processing. All the rules have been
implemented on this Siddhi event processor using Siddhi queries. If Siddhi detects abnormal
driving behaviors, it is sent to the output stream and output stream directs it to the event
publisher. Event publisher publishes those data to the dashboard through the REST API.
Dashboard shows those data as a count (number of times each abnormal driving behavior occurs
during the corresponding trip). In addition, those data are persisted in output stream for batch
analysis. Moreover, average speed, acceleration, and hard acceleration and deceleration data also
published to the dashboard by DAS. Figure 3.14 shows the event flow in the DAS.
Figure 3.12: Real-time data analysation process.
33
Figure 3.13: Event flow to detect abnormal driving behaviors.
3.4. Historical Analysis
Under historical analysis, we implemented two solutions to estimate driving style, skill,
and aggression based on Driving Style Recognition Using Fuzzy Logic [11] and My Drive
Behavior Analytics Method and Platform [9]. Based on these techniques drivers are evaluated
based on their:
● Skill score
● Aggression Score
● Comfort Score
● Safety Score
These scores can be used for drivers to improve their driving skills as well as for the UBI
insurance companies to calculate their insurance premiums. Generally, skill score can be defined
as “driver‟s unintentional passive characteristics”. For example, change lanes slowly maintaining
distance from lead vehicle. Similarly, aggression is defined as “driver‟s intentional active
characteristics” which can be “attributed to driving style”. For example, overtake slow driver on
the inside”. Therefore, these behaviors can be revealed by analyzing the acceleration pattern of
the drivers. Because of that, all these scores are calculated based on the aggression profile of all
the completed trips.
3.4.1. Driving Score Calculation
Tanushree et al. [9] proposed an algorithm to monitor, quantify, and classify driving style
using long-term driving data. Skill score and the aggression score are calculated based on the
longitudinal and lateral acceleration of the driving data. Figure 3.14 illustrates the overall
process.

34
Calculating Skill Score and Aggression Score
A set of kurtosis values (normalized fourth order moment about mean) of lateral and
longitudinal acceleration from each trip of each drivers are computed. Typically, an experienced
or skilled driver is expected to maintain the same driving style for all his trips. Because of that,
this idea can be validated through the probability distribution of the kurtosis values. Kurtosis
value is an indicator of peakedness and heavy tail of probability distribution. Higher kurtosis
means a greater variance is the result of infrequent extreme deviation and the lower variance is
frequent modestly sized deviations. Therefore, the probability distribution of the kurtosis values
of the skillful drivers tends to follow normal distribution with a few outliers. Kurtosis values are
obtained as follows:
(3.1)
Next, for each driver, mean (µ) and standard deviation ( ) for the set of kurtosis values of
longitudinal and lateral accelerations are calculated (Table 3.1 list the set of symbols).

35
Figure 3.14: Overall process of driving score calculation.

36
Then Skill Score Absolute (SSA) and the Aggression Score Absolute (ASA) are
calculated for each driver as follows:
(3.2)
Table 3.3: Set of symbols.
Symbol Description
Standard deviation of the kurtosis values of longitudinal accelerations
Standard deviation of the kurtosis values of lateral accelerations
Mean value of the kurtosis values of longitudinal accelerations
Mean value of the kurtosis values of longitudinal accelerations
Standard deviation of SSA‟s of all drivers
Standard deviation of ASA‟s of all drivers
Mean value of SSA‟s of all drivers
Mean value of ASA‟s of all drivers
After calculating absolute scores, relative scores with respect to entire driver group is obtained as
follows:
Relative Skill Score (RSS) =

37
Relative Aggression Score (RAS) =
(3.3)
Higher skill score (RSS) means that the driver is skilled driver and the higher aggressive
score (RAS) means the driver is more aggressive. According to these scores, driving styles can
be categorized as follows (see Figure 5.4).
● Novice : low skill score and low aggression score
● Cautious : high skill score and low aggression score
● Risky : low skill score and high aggression score
● Rival : high skill score and high aggression score
Calculating Safety Score and Comfort Score
This algorithm is also based on acceleration data of all the completed trips and the total
number of trips of the drivers. First, acceleration data are categorized into following groups
based on [9]:
● Hard acceleration ( > 3 ms-2
)
● Hard deceleration ( < -3 ms-2
)
● Normal acceleration (0.1 ms-2
to 3 ms-2
)
● Normal deceleration (-0.1 ms-2
to -3 ms-2
)
● Cruise (-0.1 ms-2
to 0.1 ms-2
)
Here the analysis results are presented as a pi-chart which shows relative percentage of
accelerations in normal vs. risky zone. Therefore, percentages of the trips which are in each
acceleration zone are calculated to get the safety factor and the comfort factor. Safety factor for
each driver is calculated from the percentage of overall trip is in harsh zone (hard
acceleration/deceleration). Comfort factor is computed from the percentage of overall trip spent
in cruise model.
3.4.2. Driving Style Estimation
For the historical analysis, we also focused on how to recognize the driving events of a
particular driver and characterize it as below normal, normaL, abnormal, and very abnormal
driving based on the readings of 2-axis accelerometer and speedometer.
Using 2 axis accelerometer and speedometer, we calculate g-force and average speed. As
we use 2-axis accelerometer embedded OBD-II dongle, we are directly received longitudinal and
lateral accelerations and speed per period of unit time. Then we calculate following “Norm” and
“Speed Average” of that particular vehicle according to the request of dashboard.
Norm(n) = √ (3.4)
Averaged Norm(i) =
Σ (3.5)
Averaged Speed = Total Speed / N (3.6)

38
Degree
Ave.Norm 1 2 3
Degree
Ave.Speed
20 40
60 80 100
VS S M H VH
Where N is depend on the time period that is requested from dashboard user. After the
calculation of these parameters, we use a fuzzy logic inference system to determine whether the
considered driver is risky or not using following membership functions. According to the Figure
3.15, get the related degree of membership value with respect to the calculated Norm value. Then
ge the related degree of membership value with respect to the given average speed value Figure
3.16. Based on these two degree values, we get the related category number using the
membership function of category Figure 3.17
Figure 3.15: Membership function for averaged norm.
Figure 3.16 Membership function for averaged speed.

39
Behavior
Degree
BN N A VA
0.2 0.4 0.6 0.8
Figure 3.17: Defuzzification function for driving behavior.

40
4. Implementation
4.1. Languages, Tools, and Technologies
Linux was used as our main development platform. In the system, WSO2 Data Analytic
Server (DAS) version 3.1.0 is used to perform real-time and batch analysis tasks. In addition to
the DAS, following IDEs and languages were used to continue our rest of project tasks:
● Mobile App
Languages - Android
IDE - Android Studio
● REST API
Language - Node.js
IDE - Intellij IDEA
According to the way of calculating trip distance of particular driver, we have to
use third party service named Open source Routing Machine (OSRM)
● Real time Analysis
Languages - Siddhi
● Batch Analysis
Languages- SPARK, JAVA(UDF)
● Dashboard
Languages - HTML, JS, AngularJS, Jquery, D3 - V3, D3-V4.
IDE - Webstorm
● Database
Languages - NoSQL
Database Engine - MongoDB
4.2. Mobile Application
The Mobile Application is implemented using Android SDK and the SDK that provided
with the selected ODBII dongle. The minimum SDK-version needs to run the app is Android
API-level 21. The mobile which runs this app must have a Bluetooth, GPS, and Internet
connection to execute the tasks.
4.2.1. Retrieving OBDII data
The SDK of the relevant dongle is responsible to maintain the connectivity with the
dongle. The Monitor module in the Android app is subscribed to RPM, speed, x-axis
acceleration, and y-axis acceleration data from the SDK of the dongle so that it receives the data
as they come from the dongle.
4.2.2. Generating payload
Android provides an object called LocationManager. Using that, the application retrieves

41
current GPS coordinates to the Location Tracker module. The application requests OBDII data
from Monitor module and GPS data from Location Tracker module and they are wrapped as a
JSON payload and given to the HTTP Handler module.
4.2.3. Transmitting Payload to Central Server
HTTP Handler (see Figure 3.3) is responsible to maintain the connectivity with the REST
API of the central server. When a payload is given to the module, it transmits it to the REST API.
After each transmits, it waits for the response. If the module receives a status code other than
SUCCESS (200), the module will stop sending further payloads and the error code received will
be displayed to the user as well.
At the time of initiation, before sending the payloads to the central server, the user has to
sign into the server through the application. Once the signing is successful, the server sends a
JWT Token to the application which expires after 15 minutes. When sending the payloads, the
HTTP Handler include the token in each payloads header to authenticate the user. “java.net*”
packages were used to implement this module.
Figure 4.1 : Main screen of the Mobile App.
As seen in Figure 4.1, the app shows real time speed and RPM data which is received
from the dongle. The current category is pulled from the backend and shown to the driver based
on the category which he belongs to (as very abnormal, abnormal, normal, and below normal).

42
Three icons on top left indicate app states as described in Table 4.1.
Table 4.1: Indicators on mobile app.
Success Fail Meaning
Status of connectivity with the dongle.
Status whether live data is receiving from the dongle or not.
Status of connectivity with the REST API of central server.
4.3. REST API
The REST API presented in Section 3.2 is implemented using Node.js and Express web
application framework. REST API is called via HTTP and acceed allow methods are PUT,
POST, GET, DELETE, and OPTIONS. Payloads are transferred as JSON objects. The REST
services communicate with WSO2 DAS, backend database, and Open Source Routing Machine
(OSRM) which routes API calls.
DPP implementation supports three type of communication between the REST services
and WSO2 DAS. These are,
● WSO2 DAS publish result data to the REST API.
● WSO2 DAS persist result data in their backend database. Then WSO2 DAS
expose Analytic data service as REST API access this persist data. DPP services
call this Analytic REST API for get these result.
● DPP REST services publish data to the DAS.
DPP implementation use MongoDB as NoSQL database. DPP REST services
communicate with MongoDB using Mongoose. Mongoose is MongoDB Object Data modeling
(ODM) for Node.js.
HTTPS is used for communication between DPP REST services and OSRM. While
OSRM provide six types of services, our REST services uses only of those services. These are
trip service and route service. Using this services of OSRM DPP REST services get information
as explained in Section 3.2 .
4.3.1. Authentication
The REST API implemented authentication mechanism is shared key authentication. This
authentication mechanism implemented using JSON Web Token (JWT). The JSON web token
generate JSON based token using payload and secret key. In DPP, JWT payload includes user
username and password. Using JWT algorithm is HMAC SHA256 to encrypt or generate JSON

43
Web Token. The JWT used as a shared key.
Login request of the REST API generate the JWT and this token is send to the client for
future API call validation. After the login request, client is expected to attach this token in all
future request headers‟ user authorization tag. Then the REST API verify this JWT before it
passes to route (controller).
4.4. Driver Profiling Platform
4.4.1. Real-Time Analysis
As described in Section 3.3, real-time analysis has been implemented on WSO2 DAS.
WSO2 DAS has its own real-time event processing engine called Siddhi. All the rules have been
implemented using Siddhi queries. Figure 4.2 shows an example rule that is specified as a siddhi
query to detect hard acceleration and hard deceleration.
Figure 4.2: Execution plan of detecting hard acceleration and hard deceleration.
These rules can detect five types of abnormal driving behaviors and when it detects an
abnormal driving pattern, it publishes it to dashboard through REST API. Dashboard displays
those abnormal driving data as a count, i.e., number of times that each of abnormal driving
pattern is detected. Figure 4.3 shows the relevant screenshot. In addition, Siddhi event processor
published average speed, acceleration, as well as hard acceleration count and deceleration count
to the dashboard. Moreover, these data are persisted in the DAS to display total count of each
driving pattern occurred as a summary. Figure 4.3, 4.4 and 4.5 shows a set
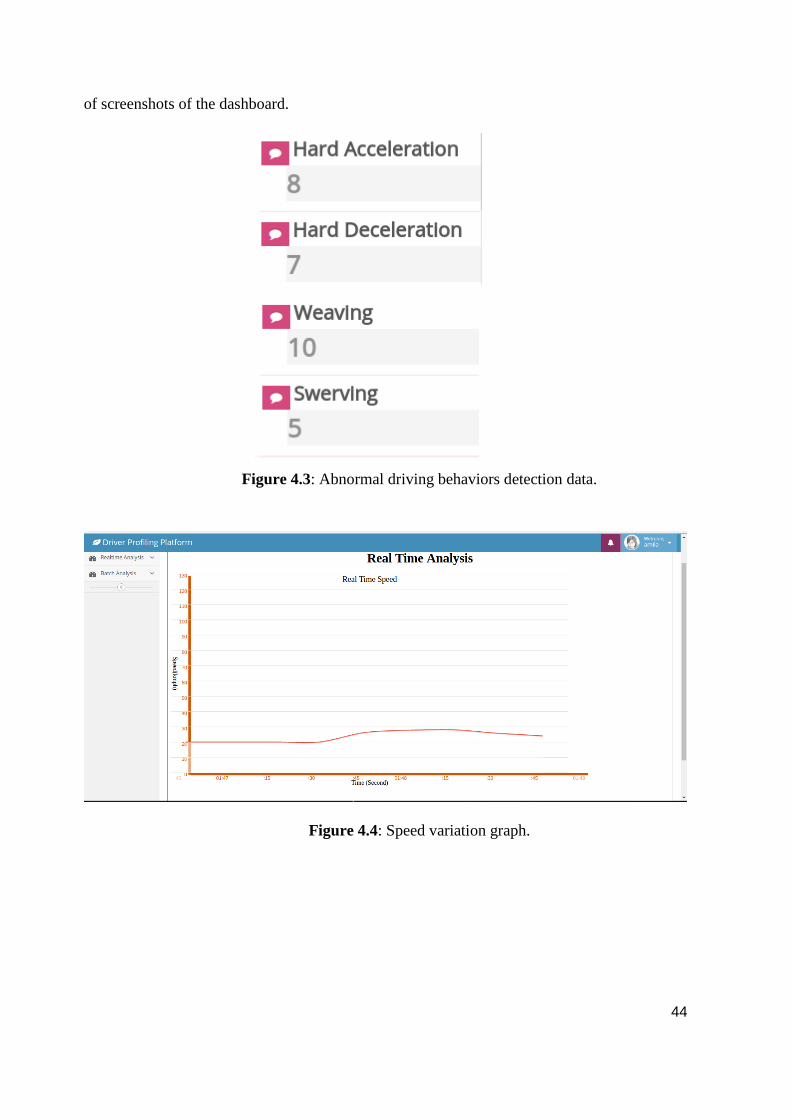
44
of screenshots of the dashboard.
Figure 4.3: Abnormal driving behaviors detection data.
Figure 4.4: Speed variation graph.

45
Figure 4.5: Acceleration variation graph.
4.4.2. Historical Analysis
Under historical analysis, we are categorizing drivers according to their long-term driving
behaviors using data which were persisted through the real-time analysis phase. As discussed in
Sections 3.4.1 and 3.4.2 we provide two solutions under historical analysis. During the
implementation of fuzzy logic and skill aggression score methods, we used two separated Spark
SQL [18] script which is provided inside WSO2 DAS.
In real-time analysis phase, we persist average speed, x-axis acceleration, y-axis
acceleration, and engine RPM. We request those data from the database when the fuzzy logic
[11] based solution is performed. Then we calculate the norm of the acceleration according to the
way of equation 3.4. Then we calculate the average speed according to the equation 3.5 of the
considered time period and send these calculated norm value and average speed to the User
Defined Function which is a plugin to the DAS using Java. Based on the given threshold values
according to [1], UDF return the category number. Based on the number we classified the given
drivers‟ driving behavior according to the following categories. Such as Below Normal, Normal,
Abnormal and Risky.
In the second method, we used MyDrive method [9] to calculate some score values with
respect to the driving behavior of particular drivers. We used longitudinal and lateral
accelerations, trip ID and speed. Using those details calculate Relative Aggression Score and
Relative Skill Score with respect to the Equation 3.2 and 3.3.
We used Spark SQL to perform these calculation parts. Since we want to perform these
analysis parts in periodic time, we used cron expressions. Using those cron expression, each
script is run once a month and update the above mentioned category details and score values.
4.5. Implementation of Dashboard
Dashboard presents results from both real time and historical analysis via a web
application. Main three parts of the dashboard are registering, profiling, and data presenting.

46
When user request to login, user credentials are sent to the backend through the REST
API, then validates the credentials and sends a token. Similar to mobile app, Every request from
dashboard to the REST API should provide a valid token. We use such security features to
enhance the privacy of the users. To accomplish this, we use browser cookies to store the token
details. , For the initial registering phase, user has to send his login authentication details and
user type. According to the selected user type, page accessing privileges are added inside of the
dashboard. In the first step of the user, after login, he has to complete his profile details and
vehicle profile details according to the Figure 4.6 and 4.7.
Angularjs is used to implement the front end functionalities. For the convenience, jquery
library also used to enhance the user interactions. Front end User Interfaces are implemented
using HTML5. To implement such graph visualizations, we have used D3 which is a powerful
javascript library specialized for graph visualization.
Figure 4.6: User login page.
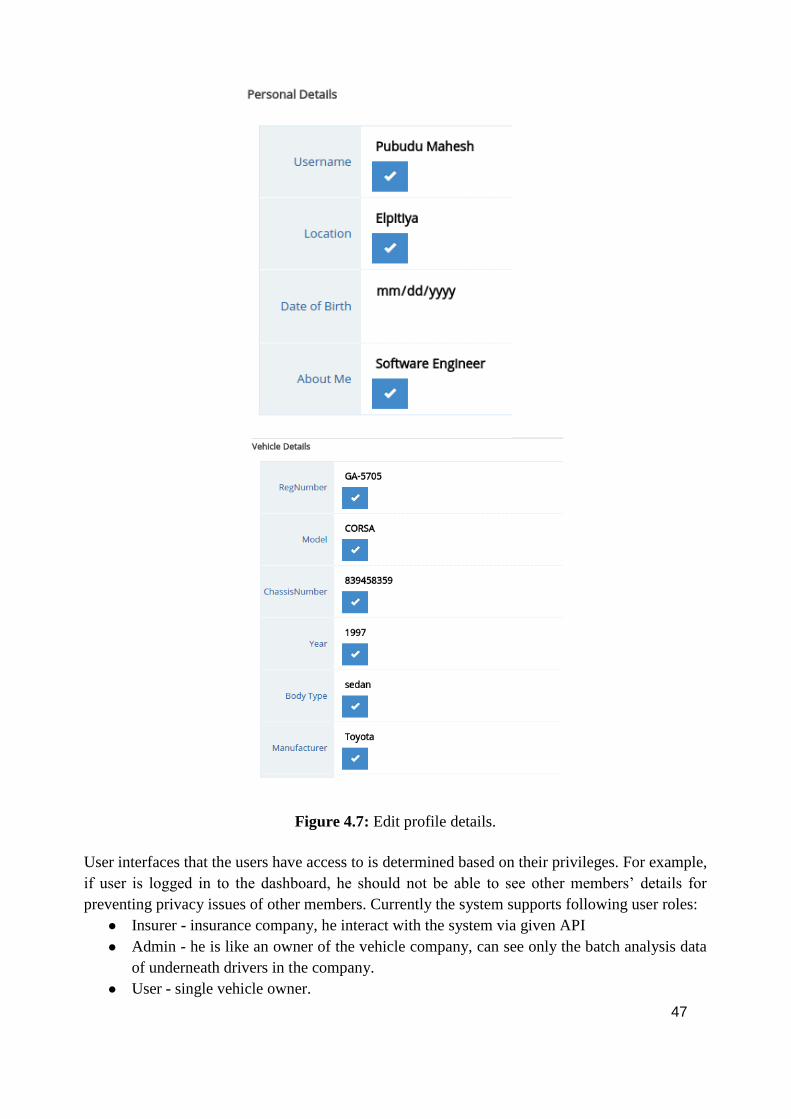
47
Figure 4.7: Edit profile details.
User interfaces that the users have access to is determined based on their privileges. For example,
if user is logged in to the dashboard, he should not be able to see other members‟ details for
preventing privacy issues of other members. Currently the system supports following user roles:
● Insurer - insurance company, he interact with the system via given API
● Admin - he is like an owner of the vehicle company, can see only the batch analysis data
of underneath drivers in the company.
● User - single vehicle owner.

48
According to the above mentioned privileges, we provided real-time vehicle details only for the
Users as well as Admin can check the historical analytical data of all drivers who have registered
in the system. For example, Admin can check current category of all drivers, RSS-RAS scores
based classifications of all users.
4.6 Database
For the purpose of analyzing historical data, we need to persist real-time analyzed data
and other related data. As we are received data stream every second, we have to persist lot of
data instant time and database size growing speed is really high. Therefore, we were not suitable
to use a relational database like MySQL. As the solution, we figure out most appropriate solution
for the problem is MongoDB engine. In our database it is not required to handle inter
dependencies among the database tables. Moreover, latency is really a considerable factor for
live data analyzing and visualization part. As the comparison between MongoDB and MySQL,
necessity of such MongoDB database engine is really high. MongoDB is an Object Oriented
based database engine. Because of these reasons, implementation and handling is very easy with
respect to other relational database engines.

49
5 Results
5.1 Historical Analysis
Figure 5.1 : Individual category history.
Figure 5.1 illustrates how the category of a driver changed with time based on his/her
driving behavior. This enables driver can check his behavior within last 12 months. Specially,
such visualization would be help to the UBI third party users, who are willing to offer insurance
premium for the drivers.
As we mentioned the privileges for the admin and users of the system in previous chapter,
only administrators are given the checking all details of registered all drivers in the system.
Figure 5.2 illustrates the current driving details of all registered drivers in the system.
Figure 5.2: Current category of all users.
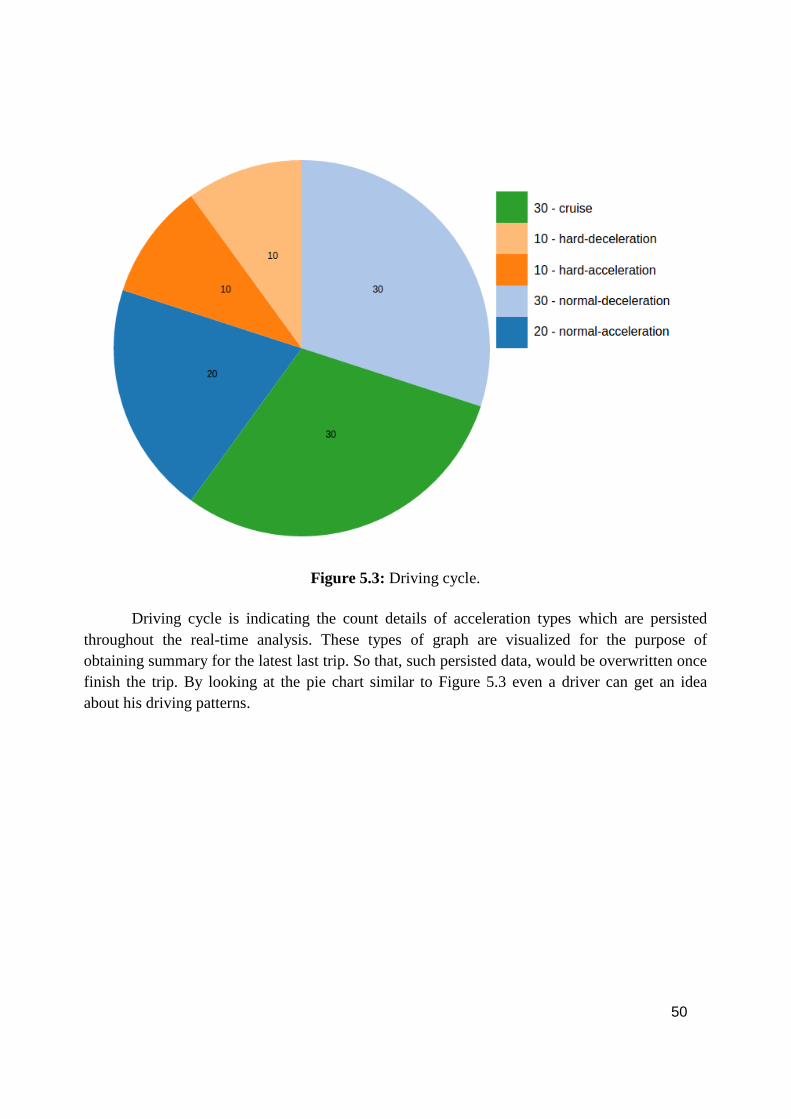
50
Figure 5.3: Driving cycle.
Driving cycle is indicating the count details of acceleration types which are persisted
throughout the real-time analysis. These types of graph are visualized for the purpose of
obtaining summary for the latest last trip. So that, such persisted data, would be overwritten once
finish the trip. By looking at the pie chart similar to Figure 5.3 even a driver can get an idea
about his driving patterns.

51
Figure 5.4: RAS vs RSS.
RSS and RAS value are calculated and visualized as in Figure 5.4. With this we were able
to identified four categories which are used to classify users which are Risky, Novice, Cautious,
and Rival.
5.2 Performance and Accuracy
5.2.1 Real-time Analysis
To evaluate the accuracy of five rules that are used to detect real-time driving anomaly
behaviors, we collected real data from a vehicle and obtained the data through the OBDII dongle
and persisted all records in the mobile phone as CSV files. While we were collecting data, we
also used dashboard camera to get synchronous video streams with respect to the collecting data.
Based on both OBDII and video data we calculated the accuracy of detection. For this we
labeled the video through visual inspection for anomalous driving. In evaluation stage, when we
run the result set, system was able to identify the anomaly driving behaviors.
Since there are no existing labeled data, we had to drive a vehicle and obtained the data
through the OBDII dongle and persisted all records in the mobile phone as CSV files. While we
were collecting data, we also used dashboard camera to get synchronous video streams with
respect to the collecting data. Based on both OBDII and video data we calculate the accuracy of

52
detection. In our driving session, it was not practicable to intentionally act abnormal behaviors
other than sudden acceleration and sudden deceleration. Therefore the amount of other abnormal
behaviors was low compared to them.
Table 5.1: Performance tables
Driver: Amila
CSV Sudden
Accelerations
Sudden
deceleration
Weaving Swearing Slide
Slipping
Wide
Turns
0 Actual 4 2 - - - -
Detected 1 2 - - - -
1 Actual 2 2 - - - -
Detected 3 5 - - - -
2 Actual 5 3 1 - - -
Detected 4 3 - - - -
3 Actual 4 6 - - - -
Detected 7 3 - - - -
4 Actual 3 6 - - - -
Detected 4 5 - - - -
5 Actual 4 9 - - - -
Detected 4 5 - - - -
6 Actual 5 7 - - - -
Detected 3 4 - - - -
7 Actual 3 5 - - - -
Detected 2 4 - - - -
8 Actual 3 2 - - - -

53
Detected 5 7 - - - -
9 Actual 6 4 - - - -
Detected 7 9 - - - -
Sum Actual 39 46 1 - - -
Detected 61 59 - - - -
Driver: Dr. Dilum
CSV Sudden
Accelerations
Sudden
deceleration
Weaving Swearing Slide
Slipping
Wide
Turns
0 Actual 6 5 - - - -
Detected 5 4 - - - -
1 Actual 8 3 - - - -
Detected 7 6 - - - -
Sum Actual 13 8 - - - -
Detected 7 9 - - - -
Driver: Nadun
CSV Sudden
Accelerations
Sudden
deceleration
Weaving Swearing Slide
Slipping
Wide
Turns
0 Actual 9 7 - - - -
Detected 3 3 - - - -
1 Actual 3 7 - - - -
Detected 5 4 - - - -
2 Actual 8 5 - - - -
Detected 3 2 - - - -

54
Sum Actual 20 19 - - - -
Detected 16 8 - - - -
Driver: Pubudu
CSV Sudden
Accelerations
Sudden
deceleration
Weaving Swearing Slide
Slipping
Wide
Turns
0 Actual 8 5 - - - -
Detected 9 7 - - - -
1 Actual 4 3 - - - -
Detected 3 9 - - - -
Sum Actual 12 8 - - - -
Detected 16 16 - - - -
According to the video streams, that we have used to detect driving behaviors, we
encountered some abnormal driving behaviors. Most of cases, we were able to guessed sudden
acceleration and sudden decelerations as the abnormal driving behaviors. But, in some cases, we
guessed, weaving as the abnormal driving behavior according to the prior knowledge of driving
anomaly behavior.
But in most of cases, the implemented system was unable to detect such weaving and
other related anomaly behaviors, other than, hard accelerations and hard deceleration
Overall: Acceleration (A/D): 84 / 100 = 84%
Deceleration (A/D): 81 / 92 = 88.04

55
5.2.2 Historical Analysis
Figure 5.5: Result comparison between MyDrive vs. Fuzzy logic.
We are performing historical analysis of drivers using two techniques. As can be seen in
Figure 5.5 both techniques produced consistent results. For example, after performing the fuzzy
logic implementation, category of user “amila‟ is “risky” and MyDrive method also categorizes
“amila” as a Risky driver.

56
6. Summary
6.1 Conclusions
With the emergence of IoT, developing a system to retrieve vehicular data and provide
analysis on drivers based on them could effectively address the current issues in Usage Based
Insurance (UBI) field and in return it could lead to increase the number of disciplined drivers.
As the outcome features of the project, we are providing live and historical data analysis part for
each registered drivers and historical data analysis results of all drivers are given to the
administrative users. In addition to that we are sending alert notification to the driver when he is
categorized as risky driver.
Because of the proposed solution, effective social outcome can be achieved by
identifying risky behaviors of drivers promptly notifying the drivers. As further, thinking about
the financial return, effective driving behavior directly lead to lower premium for effective
drivers. So both social outcome and financial return exists with regarding such systems can be
called social investment.
6.2 Challenges
We used DAS Spark terminal to implement the historical data analysis. However, we
faced limitations with DAS Spark terminal. For example, we were not able to handle variables
inside the terminal. As a solution, we have implemented a plugin for the DAS. It was a Java-
based User Defined Function (UDF). Even in this case we were unable to handle double values
between UDF and the Spark. We have to convert all double values to float inside the SPARK
manually and need to convert again those things again inside the UDF.
When we were in the implementing the dashboard, we have to communicate with REST
API. However, we experienced „cross domain issue‟, where dashboard and REST are published
on separated domain. Because of that, we were not able to use HTTP request between these
domains.
6.3 Future work
Currently the mobile application supports only the Android platform. In future, it can be
upgraded to support other operating systems such as iOS and Windows or perhaps go with a
cross-platform version. The alerts given to the driver can be converted to audible alerts.
Generating alerts as Android notifications in the mobile screen could be changed as to be
speaking alerts where driver will not have to look into the mobile screen. When the driver enters
to a dead-zone where there is no network coverage, currently the application stops sending
payloads as it receives no response from the central server. After the dead-zone, the driver has to
manually switch-ON server connectivity. This can be developed further such that when a dead-
zone is reached, the application buffers the payloads till the dead-zone ends and then sends them
notifying that payloads were delayed due to the dead-zone.

57
Running the mobile app and having both bluetooth and mobile network connections may
significantly affect power consumption. The alternative for this is that the application can be
modified to be added for the vehicles which have Android-based car multimedia players and
digital rearview mirrors. Although the number of vehicles with Android multimedia players are
low at the moment, with the introduction of Android Auto [17], most of the vehicle
manufacturers are likely to be adding Android-enabled multimedia players. Therefore,
researching on how to integrate the mobile application with it will be a good investment as well.
The current system can detect only five types of abnormal driving behaviors. It can be
extended by adding more abnormal driving behavior detection rules. One of such abnormal
driving behavior is taking fast u-turn. Currently, driving time, driving areas, traffic condition, and
weather conditions are not considered when analyzing the driving data. These things can be
considered when doing real-time analyzation to get high accuracy results because these thing
also affect for the driving behaviors. In addition, only time and acceleration data have been used
for real-time analyzation. We can use more vehicular data such as engine RPM, GPS data,
steering wheel movements, etc., to monitor abnormal driving behaviors.
The implemented system of batch analysis part, we are using few models. At the moment,
models are not updating with respect to the user. Which means, each and every users are
categorized under one model. As further improvement of the historical analysis, we can
implement the model to update dynamically with respect to the drivers.
In MyDrive method, we have already implemented two ways of generating scores for the
driver‟s driving behaviors. Such as peer group analysis and individual analysis part. As an
improvement, we can suggest a method to implement, regarding the driver‟s trip levels.
When we are categorizing and calculating scores for the drivers, considered only a few
inputs. Such as x-axis acceleration, y-axis acceleration, and average speed as further
improvement for the analysis models, we can manipulate extra vehicular data. Such as throttle
position and engine RPM. In addition to the vehicular data, we are using GPS data to calculate
the total distance which particular driver has driven through the considered time period. As
further improvement, we can feed some other data such as road conditions, road type details, and
whether condition of the vehicle driven area to the model to categorizing and calculating scores
for the driver, as those details also would be critical for his driving pattern. Because the driving
behaviors of other closed vehicle when we are in the road, are affect to our driving patterns, it
would be more optimizing solution, if we are able to use their driving patterns through sensors
like ultrasonic sensors and dashboard cam video.

58
7. References
[1]“What is Usage Based Insurance(UBI)?”, We Love Save Drivers|TrueMotion
Blog,2015[Online]. Available: http://gotruemotion.com/what-is-usage-based-insurance-ubi/.
[Accessed: 30-November-2016].
[2] M. Amarasinghe, S. Kottegoda, A.L. Arachchi, S. Muramudalige, H.M.N.D. Bandara and A.
Azeez, “Cloud-based driver monitoring and vehicle diagnostic with OBD2 telematics,” in Proc.
2015 IEEE Intl. Conf. on Electro/Information Technology (EIT), Dekalb, IL, 2015, pp. 505-510.
doi: 10.1109/EIT.2015.7293433
[3] “What is Usage Based Insurance (UBI)? | TrueMotion – The App to End Distracted Driving,”
Gotruemotion.com, 2017. [Online]. Available: http://gotruemotion.com/what-is-usage-based-
insurance-ubi/. [Accessed: 2- Feb- 2017].
[4] A. Insurance and H. Save, “Snapshot From Progressive | Big Discounts For Good Drivers,”
Progressive, 2017. [Online]. Available: https://www.progressive.com/auto/snapshot/. [Accessed:
16- Jan- 2017].
[5] S. Chen, J. Pan, and K. Lu, “Driving Behavior Analysis Based on Vehicle OBD Information
and AdaBoost Algorithms,” in Proc. Intl. MultiConference of Engineers and Computer
Scientists, Vol I 2015, Mar 2015, Hong Kong.
[6] I. Mohamad, M. Ali, and M. Ismail, “Abnormal driving detection using real time Global
Positioning System data,” In Proc. IEEE Intl. Conf. on Space Science and Communication
(IconSpace), Penang, Malaysia, July 2011.
[7] R.Vaiana, T. Iuele, V. Astarita, M.V. Caruso, A. Tassitani, C. Zaffino, and V.P. Giofrè,
“Driving Behavior and Traffic Safety: An Acceleration-Based Safety Evaluation Procedure for
Smartphones,” Mod. Appl. Sci., 2014.
[8] A. Aljaafreh, N. Alshabatat, and M.N. Al-Din,“Driving style recognition using fuzzy logic”.
In Proc. IEEE Intl. Conf. on Vehicular Electronics and Safety (ICVES), Istanbul, Turkey, July
2012
[9] T. Banerjee, A. Chowdhury, and T. Chakravarty, “MyDrive: Drive Behavior Analytics
Method And Platform,” TCS Innovation Labs, Bangalore.
[10] Y. Kishimoto and K. Oguri, “A Modeling Method for Predicting Driving Behavior
Concerning with driver's Past Movements,” in Proc. 2008 IEEE Int. Conference, Sep. 2008,
Columbus, OH, USA.
[11] M. Najim, A. Alijaafresh, N. Albdour, and M. Saleh, “Driving Styles Recognition Using
Decomposed Fuzzy Logic System,” International Journal of Electrical, Electronics and Computer

59
Systems, vol. 16, no. 01, pp. 1-5, 2013.
[12] D. Mitrovic, “Reliable Method for Driving Events Recognition,” IEEE Transaction on
Intelligent Transportation Systems, vol. 6, no. 2 pp.198-206, 2005.
[13] N. Kuge, T. Yamamura, O. Shimoyama, and A. Liu, "A Driver Behavior Recognition
Method Based on a Driver Model Framework," SAE Technical Paper 2000-01-0349, 2000,
doi:10.4271/2000-01-0349
[14] Z. Chen, J. Yu, Y. Zhu, Y. Cheny, and M. Li, “D3: Abnormal Driving Behaviors Detection
and Identification using Smartphone Sensors,” in Proc. 12th
Annual IEEE Intl. Conf. on Sensing,
Communication and Networking (SECON), IEEE, 2016
[15] “On-board diagnostics” in Wikipedia. Wikimedia Foundation, 2017. [Online]. Available:
https://en.wikipedia.org/wiki/On-board_diagnostics. [Accessed: Feb. 21, 2017]
[15] “On-board diagnostics,” En.wikipedia.org, 2017. [Online]. Available:
https://en.wikipedia.org/wiki/On-board_diagnostics. [Accessed: 6- Feb- 2017].
[16] “WSO2 Data Analytics Server Documentation - Data Analytics Server 3.0.0 - WSO2
Documentation,” Docs.wso2.com, 2017. [Online]. Available:
https://docs.wso2.com/display/DAS300/WSO2+Data+Analytics+Server+Documentation.
[Accessed: 26- Feb- 2017].
[17] “Android Auto,” Android, 2017. [Online]. Available: https://www.android.com/auto/.
[Accessed: 26- Feb- 2017].
[18] “Apache Spark™ - Lightning-Fast Cluster Computing,” Spark.apache.org, 2017. [Online].
Available: http://spark.apache.org/. [Accessed: 26- Feb- 2017].