drinking water quality report - fort worth, texas
TRANSCRIPT

Drinking Water Quality ReportYear 2016 Data
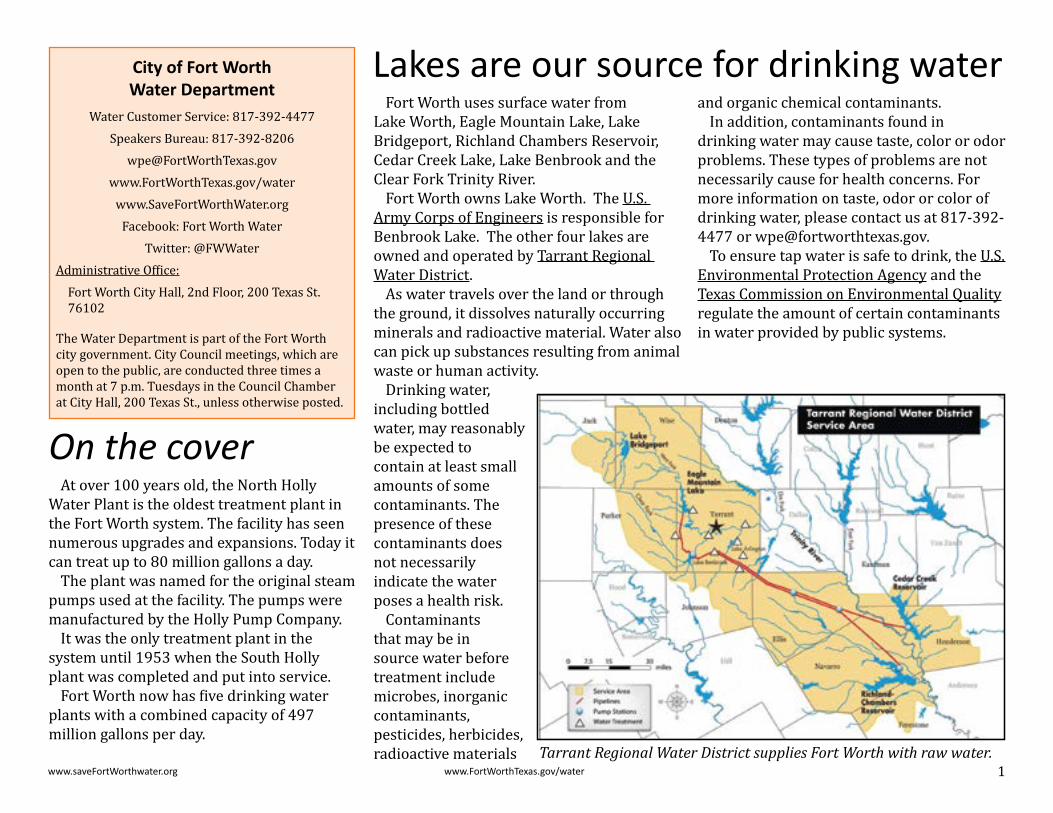
Fort Worth uses surface water from Lake Worth, Eagle Mountain Lake, Lake Bridgeport, Richland Chambers Reservoir, Cedar Creek Lake, Lake Benbrook and the Clear Fork Trinity River.
Fort Worth owns Lake Worth. The U.S. Army Corps of Engineers is responsible for Benbrook Lake. The other four lakes are owned and operated by Tarrant Regional Water District.
As water travels over the land or through the ground, it dissolves naturally occurring minerals and radioactive material. Water also can pick up substances resulting from animal waste or human activity.
Drinking water, including bottled water, may reasonably be expected to contain at least small amounts of some contaminants. The presence of these contaminants does not necessarily indicate the water poses a health risk.
Contaminants that may be in source water before treatment include microbes, inorganic contaminants, pesticides, herbicides, radioactive materials
and organic chemical contaminants.In addition, contaminants found in
drinking water may cause taste, color or odor problems. These types of problems are not necessarily cause for health concerns. For more information on taste, odor or color of drinking water, please contact us at 817-392-4477 or [email protected].
To ensure tap water is safe to drink, the U.S. Environmental Protection Agency and the Texas Commission on Environmental Quality regulate the amount of certain contaminants in water provided by public systems.
City of Fort Worth Water Department
Water Customer Service: 817-392-4477Speakers Bureau: 817-392-8206
[email protected]/water
www.SaveFortWorthWater.orgFacebook: Fort Worth Water
Twitter: @FWWaterAdministrative Office:
Fort Worth City Hall, 2nd Floor, 200 Texas St. 76102
The Water Department is part of the Fort Worth city government. City Council meetings, which are open to the public, are conducted three times a month at 7 p.m. Tuesdays in the Council Chamber at City Hall, 200 Texas St., unless otherwise posted.
On the coverAt over 100 years old, the North Holly
Water Plant is the oldest treatment plant in the Fort Worth system. The facility has seen numerous upgrades and expansions. Today it can treat up to 80 million gallons a day.
The plant was named for the original steam pumps used at the facility. The pumps were manufactured by the Holly Pump Company.
It was the only treatment plant in the system until 1953 when the South Holly plant was completed and put into service.
Fort Worth now has five drinking water plants with a combined capacity of 497 million gallons per day.
Lakes are our source for drinking water
Tarrant Regional Water District supplies Fort Worth with raw water.1www.saveFortWorthwater.org www.FortWorthTexas.gov/water

The exact wording shown below is required by state regulations. The information is not meant to alarm or scare you. It is meant to make you aware.
You may be more vulnerable than the general population to certain microbial contaminants, such as Cryptosporidium, in drinking water. Infants, some elderly or immunocompromised persons, such as those undergoing chemotherapy for cancer, those who have undergone organ transplants, those who are undergoing treatment with steroids and people
with HIV/AIDS or other immune system disorders can be particularly at risk from infections.
You should seek advice about drinking water from your physician or health care provider.
Additional guidelines on appropriate means to lessen the risk of infection by Cryptosporidium are available from the Environmental Protection Agency’s Safe Drinking Water Hotline at 1-800-426-4791.
Information for people with weak immune systems
Raw water quality monitored regularly
Tarrant Regional Water District monitors the raw water at all lake intake sites for Cryptosporidium, Giardia Lamblia and viruses. The source is human and animal fecal waste in the watershed.
The 2016 sampling detected in some of our raw water sources Cryptosporidium, Giardia Lamblia and viruses.
Cryptosporidium and Giardia Lamblia monitoring is done monthly. Virus monitoring is performed four times a year in January, March, July and September.
Treatment processes are designed to kill or remove these contaminants. Viruses are treated through disinfection processes. Cryptosporidium and Giardia Lamblia are removed through disinfection and filtration.
Intake location Giardia Lamblia Cryptosporidium Adenovirus Enterovirsus Astrovirus Rotavirus
Richland-Chambers Reservoir Not detected Not detected Not detected Not detected Not detected Not detected
Cedar Creek Lake Not detected Not detected Not detected Not detected Not detected Not detected
Lake Benbrook August Not detected January Not detected Not detected Not detected
Eagle Mountain Lake Not detected Not detected Not detected Not detected Not detected Not detected
Lake Worth June Not detected January & September Not detected Not detected Not detected
Clearfork of Trinity River May, June, August, September, November June & August January & March Not detected Not detected Not detected
TCEQ assesses risks to raw water supplies The Texas Commission on Environmental
Quality assessed the lakes and rivers that are the sources of Fort Worth’s drinking water. TCEQ classified the risk to our source water as high for most contaminants.
High susceptibility means there are activities near the source water and/or watersheds that make it very likely that chemical constituents come into contact with the source water. It does not mean that there are any health risks present.
Tarrant Regional Water District, from which Fort Worth purchases its raw water, received the assessment reports.
For more information on source water assessments and protection efforts at our system, contact Stacy Walters at 817-392-8203 or [email protected].
More information about the source-water assessments is available online www.tceq.texas.gov/drinkingwater/SWAP/index_swa.html.
2www.saveFortWorthwater.org www.FortWorthTexas.gov/water

A multi-barrier approach is used in treating drinking water. The treatment process may vary between utilities based on source water quality.
In Fort Worth, the process starts with adding ozone to kill bacteria and viruses. Adding ammonia prior to ozonation decreases bromate formation. Bromate is a regulated contaminate formed when ozone combines with bromide in the source water, which can be a health concern.
Chemicals, called coagulants and polymers,
are added to the water to cause small particles to adhere to each other, forming clumps. This process is called flocculation.
In the sedimentation basins, the particles, called floc, settle to the bottom of the basin and are removed. A small amount of fluoride is added to the amount naturally present for dental health.
Water is filtered through four feet of biologically active charcoal filters. At the Westside Water Treatment Plant, the water then passes through membrane filters, too.
Monochloramine is added to provide disinfection all the way to your faucet. The chlorine kills bacteria and viruses. Ammonia is added to increase how long the chlorine lasts, reduce the chlorine odor and reduce the amount of chlorine byproducts created, another health concern.
Water is stored at the plants in clear wells, before it is pumped to the public.
Water treatment process protects public health
3www.saveFortWorthwater.org www.FortWorthTexas.gov/water
...public health protection...fire protection
...support for the economy...the overall quality of life we enjoy
Please help us improve by taking our brief survey
This is the 20th year for Fort Worth’s annual water quality report. It is a state and federal requirement for water utilities to produce and distribute a water quality report every year.
While much of the information is required and some of the language is mandatory, Fort Worth has always tried to add other important information. The water department adds content to let customers know what it is doing to protect public health and the environment and be a good steward of resources.
We created a very short online survey to get your feedback. Please use the link below to take the survey.www.surveymonkey.com/r/fwwqr2017
Follow us on twitter @fwwater
Like us on Facebook Fort Worth Water
Fort Worth water is on social media
4www.saveFortWorthwater.org www.FortWorthTexas.gov/water
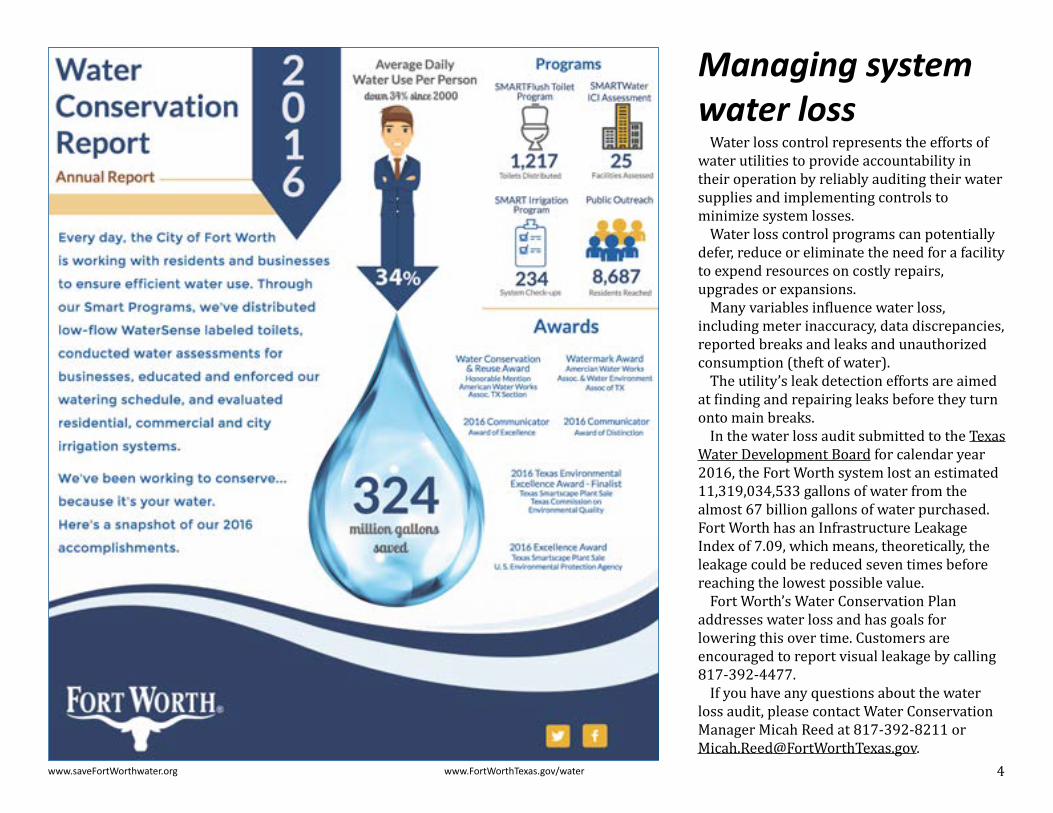
Managing system water loss
Water loss control represents the efforts of water utilities to provide accountability in their operation by reliably auditing their water supplies and implementing controls to minimize system losses.
Water loss control programs can potentially defer, reduce or eliminate the need for a facility to expend resources on costly repairs, upgrades or expansions.
Many variables influence water loss, including meter inaccuracy, data discrepancies, reported breaks and leaks and unauthorized consumption (theft of water).
The utility’s leak detection efforts are aimed at finding and repairing leaks before they turn onto main breaks.
In the water loss audit submitted to the Texas Water Development Board for calendar year 2016, the Fort Worth system lost an estimated 11,319,034,533 gallons of water from the almost 67 billion gallons of water purchased. Fort Worth has an Infrastructure Leakage Index of 7.09, which means, theoretically, the leakage could be reduced seven times before reaching the lowest possible value.
Fort Worth’s Water Conservation Plan addresses water loss and has goals for lowering this over time. Customers are encouraged to report visual leakage by calling 817-392-4477.
If you have any questions about the water loss audit, please contact Water Conservation Manager Micah Reed at 817-392-8211 or [email protected].

Drinking Water Quality Test Results
Contaminant Measure MCL 2016Highest single result
Lowest monthly % of samples ≤ 0.3 NTU MCLG Common Sources of Substance
Turbidity NTU TT 0.36 99.7% N/A Soil runoff (Turbidity is a measure of the cloudiness of water. It is monitored because it is a good indicator of the effectiveness of the filtration system.)
Contaminant Measure MCL 2016 Level Range MCLG Common Sources of Substance
Total Coliforms ( including fecal coliform & E. coli)
% positive samples
Presence in 5% or less of monthly
samples
Presence in 2.3% of monthly samples 0.4 to 2.3% 0 Coliforms are naturally present in the environment as well as feces; fecal
coliforms and E. coli only come from human and animal fecal waste.
Contaminant Measure MRDL 2016 Level Range MCLG Common Sources of Substance
Chloramines ppm 4 4.40 0.63-4.40 4 Water additive used to control microbes
Contaminant High Low Averafge MCL MCLG Common Sources of Substance
Total Organic Carbon 1 1 1 TT= % removal N/A Naturally occurring
It is used to determine disinfection by-product precursors. Fort Worth was in compliance with all monitoring and treatment technique requirements for disinfection by-product precursors.
5www.saveFortWorthwater.org www.FortWorthTexas.gov/water
Contaminant Measure MCL 2016 Level Range MCLG Common Sources of Substance
Alpha particles1 pCi/L 15 2 2 to 2 N/A Erosion of natural deposits of certain minerals that are radioactive and may emit forms of radiation known as alpha radiation
Beta particles & photon emitters1 pCi/L 50 5.6 4 to 5.6 N/A Decay of natural and man-made deposits of certain minerals that are radioactive and may emit forms of
radiation known as photons and beta radiation
Arsenic ppb 10 1.40 0 to 1.40 0 Erosion of natural deposits; runoff from orchards; runoff from glass and electronics production wastes
Barium ppm 2 0.06 0.05 to 0.06 2 Discharge of drilling wastes; discharge from metal refineries; erosion of natural deposits
Chromium (Total) ppb 100 0.73 0 to 0.73 100 Discharge from steel and pulp mills, erosion of natural deposits
Cyanide ppb 200 80.3 0 to 80.3 200 Discharge from plastic and fertilizer factories; discharge from steel and metal factories
Fluoride ppm 4 0.50 0.23 to 0.50 4 Water additive which promotes strong teeth; erosion of natural deposits; discharge from fertilizer and aluminum factories
Nitrate (measured as Nitrogen) ppm 10 0.66 0.26 to 0.66 10 Runoff from fertilizer use; leaching from septic tanks, sewage; erosion of natural deposits
Nitrite (measured as Nitrogen) ppm 1 0.03 0.01 to 0.03 1 Runoff from fertilizer use; leaching from septic tanks, sewage; erosion of natural deposits
Bromate ppb 10 5.50 0 to 10.4 0 By-product of drinking water disinfection
Haloacetic Acids ppb 60 8.35 0 to 15.9 N/A By-product of drinking water disinfection
Total Trihalomethanes ppb 80 17.5 2.19 to 25 N/A By-product of drinking water disinfection
The tables list only those contaminants detected in Fort Worth’s water. For a complete list of what is tested for in drinking water, visit
www.epa.gov/dwstandardsregulations.
1 Because of historically low levels of radionuclides in its water, TCEQ has Fort Worth on a reduced monitoring schedule. The test results shown are from 2013 and 2014.

MCL: Maximum Contaminant Level – the highest level of a contaminant that is allowed in drinking water. MCLs are set as close to the MCLGs as feasible using the best available treatment technology.
MCLG: Maximum Contaminant Level Goal – the level of a contaminant in drinking water below which there is no known or expected risk to health. MCLGs allow for a margin of safety.
MRDL: Maximum Residual Disinfectant Level – the highest level of a disinfectant allowed in drinking water. There is convincing evidence that addition of a disinfectant is necessary for control of microbial contaminants.
MRDLG: Maximum Residual Disinfectant Level Goal – the level of a drinking water disinfectant below which there is no known or expected risk to health. MRDLGs do not reflect the benefits of the use of disinfectants to control microbial contaminants.
NTU – Nephelometric Turbidity Unit; a measure of water turbidity or clarity
pCi/L – Picocuries per liter; a measure of radioactivity
ppb – Parts per billion or micrograms per liter (µg/L)
ppm – Parts per million or milligrams per liter (mg/L)
TT: Treatment Technique – a required process intended to reduce the level of a contaminant in drinking water
Other explanationsLevel 1 assessment: A study of the water system to identify potential problems and determine (if possible) why total coliform bacteria were found.
Level 2 assessment: A very detailed study of the water system to identify potential problems and determine (if possible) why an Escherichia coli (E. coli) maximum contaminant level (MCL) violation has occurred and/or why total coliform bacteria were found on multiple occasions.
Unregulated Contaminants 4 Unregulated contaminants are those for which EPA has not established drinking water standards. The purpose of unregulated contaminant monitoring is to assist EPA in determining the occurrence of unregulated contaminants in drinking water and whether future regulation is warranted.
Contaminant Measure Range of Detects
2016 Level MCL MCLG Common Sources
of Substance
Chloral Hydrate ppb 0 to 0.93 0.55 Not regulated None By-product of drinking water disinfection
Bromoform ppb 0 to 4.16 4.16 Not regulated NoneBy-products of drinking water disinfection; not regulated individually; included in Total Trihalomethanes
Bromodichloromethane ppb 0 to 7.26 7.26 Not regulated None
Chloroform ppb 0 to 13 13.0 Not regulated None
Dibromochloromethane ppb 0 to 10.2 10.2 Not regulated None
Monochloroacetic Acid ppb 0 to 3.0 3.0 Not regulated None
By-products of drinking water disinfection; not r egulated individually; included in Haloacetic Acids
Dichloroacetic Acid ppb 2.3 to 11.8 11.8 Not regulated None
Trichloroacetic Acid ppb 0 to 1.5 1.5 Not regulated None
Monobromoacetic Acid ppb 0 to 2.2 2.2 Not regulated None
Dibromoacetic Acid ppb 0 to 5.1 5.1 Not regulated None
6www.saveFortWorthwater.org www.FortWorthTexas.gov/water
Coliforms are bacteria that are naturally present in the environment and are used as an indicator that other, potentially harmful, waterborne pathogens may be present or that a potential pathway exists through which contamination may enter the drinking water distribution system. We found coliforms indicating the need to look for potential problems in water treatment or distribution. When this occurs, we are required to conduct an assessment to identify problems and to correct any problems that were found during these assessments.
During the past year we were required to conduct one Level 1 assessment. One was completed. There was not a required corrective action, but the assessment revealed the need for a convenience store to install a backflow prevention device, which was done.
Level 1 Assessment conducted
Secondary ConstituentsThese items do not relate to public health but rather to the aesthetic qualities of water. These items are often important to industries.
Item Measure 2016 Range
Bicarbonate ppm 112 to 145
Calcium ppm 41.1 to 58
Chloride ppm 15.8 to 20.2
Conductivity µmhos/cm 322 to 396
pH units 8.1 to 8.4
Magnesium ppm 4.63 to 5.86
Sodium ppm 15.1 to 17.8
Sulfate ppm 15.8 to 29.9
Total Alkalinity as CaCO3 ppm 112 to 145
Total Dissolved Solids ppm 180 to 227
Total Hardness as CaCO3 ppm 126 to 164
Total Hardness in Grains grains/gallon 7 to 10
Abbreviations used in tables

If present, elevated lead levels can cause serious health problems, especially for pregnant women and young children. Fort Worth’s drinking water does not contain lead when it leaves the treatment plant.
Lead in drinking water is primarily from materials and components associated with service lines and home plumbing.
Fort Worth is responsible for providing high quality drinking water, but cannot control the variety of materials used in plumbing components.
When your water has been sitting for several hours, you can minimize the potential for lead exposure by running or flushing your tap for 30 seconds to two minutes before using the tap water for drinking or cooking.
If you are concerned about lead in your water, the Fort Worth Water Department Laboratory offers testing to our customers. The cost is $15 per sample. Call 817-392-4477 to make the arrangements.
Information on lead in drinking water, testing methods and steps
you can take to minimize your exposure is available from the Safe Drinking Water Hotline at 800-426-4791 or at www.epa.gov/safewater/lead.
Fort Worth has been on reduced monitoring for lead and copper, meaning we sample 50 homes every three years. In 2009, we were asked by the regulatory agency to add one apartment complex, one day care and one school to the sampling.
Compliance sampling was performed in 2016 and will be conducted again in 2019.
What you should know about lead in drinking waterContaminant Year of
testing Measure 90th percentile
# of sites exceeding action level
Action Level
Common Sources of Substance
Lead 2016 ppb 3.2 0 15 Corrosion of household plumbing systems; erosion of natural depositsCopper 2016 ppm 0.6 0 1.3
90th Percentile Value: 90 percent of the samples were at or below this value. EPA considers the 90th percentile value the same as an “average” value for other contaminants. Lead and copper are regulated by a treatment technique that requires systems to control the corrosiveness of their water. If more than 10% of tap water samples exceed the action level, water systems must take additional steps.
Action Level: The concentration of a contaminant which, if exceeded, triggers treatment or other requirements that a water system must follow.
Eliminating lead plumbing is a shared responsibility
EPA defines the service line as from the main to the point it enters the home. There is a shared ownership.
The utility owns the portion from the main to the meter, including the meter.
The property owner is responsible for the line exiting the meter and all plumbing and fixtures inside the home.
7www.saveFortWorthwater.org www.FortWorthTexas.gov/water

8www.saveFortWorthwater.org www.FortWorthTexas.gov/water
The Fort Worth Water Department’s goal is to eliminate all city-owned lead service lines, but it will take many years to achieve.
In April 2016, the water department began obtaining GPS coordinates for every water meter and recording the service line material on both sides of the meter.
About one-third of the meters have been checked so far. The water department is systematically using billing cycles and routes to ensure every meter is touched.
The priority is to complete the meters within Loop 820 first because these older areas are where lead service lines are more likely to be found. Homes built after 1988 would not have lead service lines. As of May 16, about 26 percent of the meters in the entire city and 35 percent inside Loop 820 have been checked.
So far 435 lead service lines have been found on the city side of the meter and eight on the customer side. Lead has not been found in any location on both sides of the meter.
Property owners and tenants, where applicable, are being notified by letter when a lead service line is found.
The Water Department is striving to have 50 percent of the meters inventoried by Sept. 30, 2017.
In addition, field crews are replacing lead service lines found in the course of maintenance work. If customers are home, contact is made and a packet of information is provided. The crew also works with the customer to remove faucet aerators and run the taps for a few minutes.
If the customer is not home, information that a lead service line was replaced is left along with instructions on how to run fresh water through their taps.
All customers with known lead service lines are offered a free test. The packet contains
instructions for requesting the free test.
Fort Worth working to eliminate city-owned lead service lines
Learn more at: www.FortWorthTexas.gov/water/lead
Green: Areas completed
Blue: Areas in progress
Brown: Areas not completed

Unfortunately, there are people who pose as utility employees to gain access to your home. These imposters are usually checking to see if someone is home or studying the home for valuables to steal at a later date.
Here are things you need to know to protect yourself from imposters.
• A water department employee rarely needs to enter your home. Usually we only show up in response to a customer request. If you filed a water quality complaint, water samples are taken from an outside faucet.
• Water department employees never collect money in the field. Payments can be made online, by phone or in person at an approved payment location. Employees do not take your credit card information over the phone. You must use the automated system (817-392-4477) and enter your credit card or bank account information yourself.
• Ask for identification. All Fort Worth employees have badges with their
photo, city logo and ID number. Additionally, most field staff wear uniforms with the city logo.
• Look for a vehicle with the city logo and department name. There is also a vehicle ID number on the rear of the vehicle. Usually you will see one on the street when employees are in the area.
• Call the police immediately if you think the person is an imposter. Then tell your neighbors and family.
• Call the water department at 817-392-4477 to report any concerns.
Other resourcesLearn more about water by visiting the following websites. Many of these sites offer resources for teachers and children.
Environmental Protection Agency
www.epa.gov
Texas Commissionon Environmental Quality
www.tceq.texas.gov
Texas Water Development Boardwww.twdb.texas.gov
American Water WorksAssociation
www.awwa.orgwww.drinktap.org
Water Environment Federationwww.wef.org
National Sanitation Foundationwww.nsf.org
Texas WaterConservation Association
www.twca.org
9www.saveFortWorthwater.org www.FortWorthTexas.gov/water
Beware of scams: How to identify Fort Worth water employees

Water Ice
Water Liquid
Water Vapor
THE WATER CYCLE
Water vapor is invisible in the air
Water freezes into ice and snow on mountains
Water liquid can be found in rivers, oceans, and lakes
Use this coloring sheet to teach a child in your life about water.
10www.saveFortWorthwater.org www.FortWorthTexas.gov/water
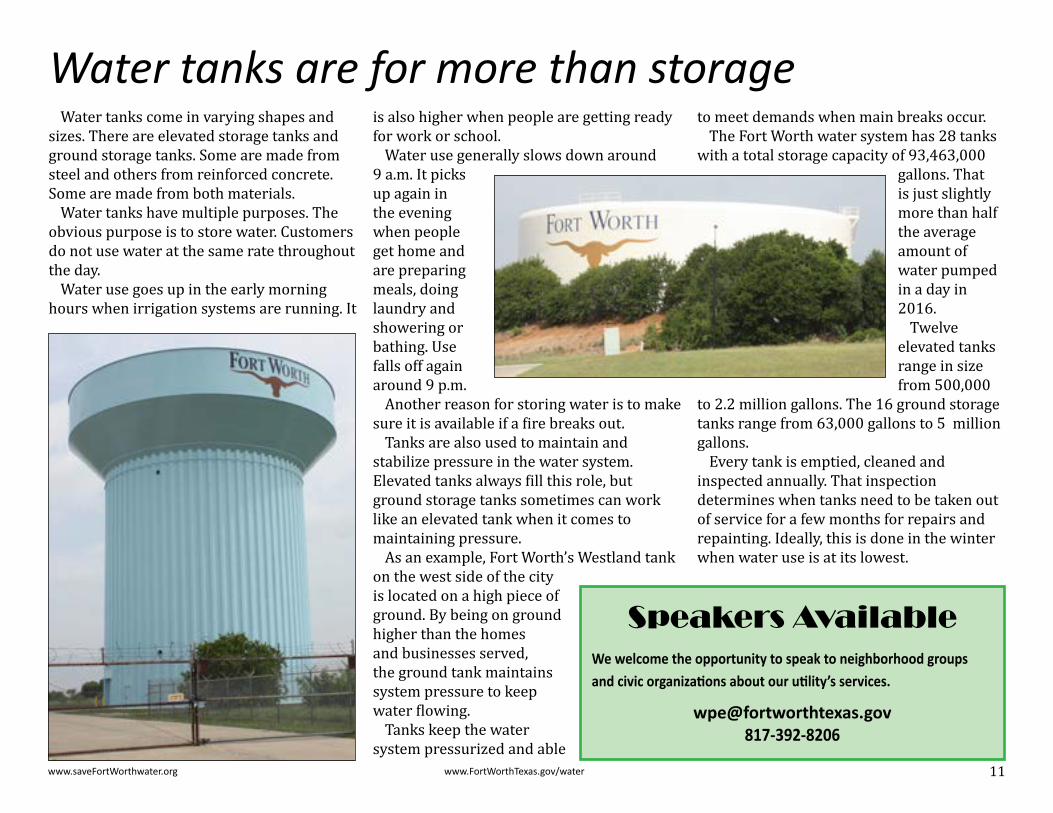
Water tanks come in varying shapes and sizes. There are elevated storage tanks and ground storage tanks. Some are made from steel and others from reinforced concrete. Some are made from both materials.
Water tanks have multiple purposes. The obvious purpose is to store water. Customers do not use water at the same rate throughout the day.
Water use goes up in the early morning hours when irrigation systems are running. It
is also higher when people are getting ready for work or school.
Water use generally slows down around 9 a.m. It picks up again in the evening when people get home and are preparing meals, doing laundry and showering or bathing. Use falls off again around 9 p.m.
Another reason for storing water is to make sure it is available if a fire breaks out.
Tanks are also used to maintain and stabilize pressure in the water system. Elevated tanks always fill this role, but ground storage tanks sometimes can work like an elevated tank when it comes to maintaining pressure.
As an example, Fort Worth’s Westland tank on the west side of the city is located on a high piece of ground. By being on ground higher than the homes and businesses served, the ground tank maintains system pressure to keep water flowing.
Tanks keep the water system pressurized and able
to meet demands when main breaks occur. The Fort Worth water system has 28 tanks
with a total storage capacity of 93,463,000 gallons. That is just slightly more than half the average amount of water pumped in a day in 2016.
Twelve elevated tanks range in size from 500,000
to 2.2 million gallons. The 16 ground storage tanks range from 63,000 gallons to 5 million gallons.
Every tank is emptied, cleaned and inspected annually. That inspection determines when tanks need to be taken out of service for a few months for repairs and repainting. Ideally, this is done in the winter when water use is at its lowest.
Water tanks are for more than storage
11www.saveFortWorthwater.org www.FortWorthTexas.gov/water
Speakers Available We welcome the opportunity to speak to neighborhood groups and civic organizations about our utility’s services.