drew talbot executive summit presentation final
TRANSCRIPT
© 2012 Acxiom Corporation. All Rights Reserved.
TRANSFORMATION THROUGH CUSTOMER FOCUS
ATTRIBUTION

KEY TAKE-AWAYS> Attribution problem points out flaw in structuring GTM around
traditional funnel – better is to look at cycle of buying and align metrics along a common thread
> Customer-centric approach and data suggests making customer-level ROI the common thread for marketing performance, not per-touch ROI
> A critical step to providing marketing performance metrics that matter is to define the customer and look at customer behavior for a collection of touches
2

3
ANSWERS YOU CAN TRUSTMORE IMPORTANT TO MAKE IT REAL EMPIRICAL AND IMPORTANT THAN REAL TIME AND TRIVIAL> Strategic means big numbers, enterprise level> Challenges happen when numbers don’t correspond to other known
realities or expectations – avoid internal inconsistencies and limit assumptions
> Evidence need not be highly granular or zero latency
“The most exciting phrase to hear in science, the one that heralds new discoveries, is not ‘Eureka!’ (I found it!) but ‘That's funny.’”
Isaac Asimov

CRAWL – WALK – RUNCrawl> Mobilize and normalize data across media,
touchpoints> Model individual channel elasticity> Model cross-channel interaction> Benchmark top line metrics> Adjust budgets periodically by channel /
product / region
Walk> Incorporate new media in multichannel
models> Allow for rapid fine-tuning and optimization
with increased granularity> Build Designs of Experiment for test / learn> Provide segment view> Consider non-MARCOMS aspects of GTM
Run> Include all touches in 360o framework –
inbound and outbound > Enhance customer-centricity through next-
gen models
Where do I place my bets?
Best ROI for next $
What does it mean for what customers will do?
Embrace complexity, enhance engagement
How to have real conversations that increase CLV 4

5
ATTRIBUTION DECISIONSIdentify goals and measures of success
Align and charter what will make actionable work acted upon
Behavioral segmentation and CLV modeling
Connect touches to people
Connect touches to outcomes
Connect people to outcomes
Evaluate interaction effects / synergies / halo
Connect other aspects of GTM to people and outcomes
DOE, market tests and feedback

THE PROBLEM OF ATTRIBUTION> What is at stake here?> What is wrong with the question?> What is a pragmatic way to deal with this?

THE PROBLEM OF ATTRIBUTION" I know what some of my tactics contribute to sales because I can follow the contact stream all the way through.
In other cases I don't know because I don't have a direct link in the data from a message we sent, to a customer's receipt of the message, to the customer connecting and completing a transaction.
How do I resolve this to learn what my real ROI is by channel, campaign and tactic?"

THE PROBLEM OF ATTRIBUTION
Trying to get high performance out of too
small an engine:
The relationship is what must pay, not the
touch

9
HOW PURCHASES HAPPENMore like this
Less like thisBut metrics still assume it happens this way

10
CRAWLWHERE DO I PLACE MY BETS?
> Compare elasticity by channel against a common KPI, e.g. sales, to allocate media spend more efficiently
Response curves
14.60
14.80
15.00
15.20
15.40
15.60
15.80
16.00
$0
$
5
$1
0
$1
5
$2
0
$2
5
$3
0
$3
4
$4
0
$4
5
$5
0
$5
5
$6
0
$6
5
$7
0
$7
5
$8
0
$8
5
$9
0
$9
5
$1
00
$
10
5
$1
10
$
11
5
$1
20
$
12
5
$1
30
$
13
5
$1
40
$
14
5
$1
50
$
15
5
$1
60
$
16
5
$1
70
$
17
5
$1
80
$
18
5
$1
90
$
19
5
$2
00
$
20
5
Tota
l Pro
du
ct U
nit
sM
illio
ns
Media Investment ($M)
Response Curves
Direct Mail
TV
OOH
Display
Radio
Search Limitations> Single metric may not apply to
each channel in straight forward ways
> Tends to mask interaction between touches and other factors
> Good for limited range of channels or input variables
> Not so flexible for new data streams or what if scenarios
> Limited predictive applicability

WALKMAKING MARKETING MORE CUSTOMER- CENTRIC THROUGH SEGMENTATION AND EXPERIMENTATION> Identify individuals and
households across touches and segment
> Bucket style and frequency of communication by segment
> Natural clusters> CLV> Identify key inbound
variables and match to segments
> Taylor outbound messaging to segment variables for increased relevance
> Test, test, test- 400%
+ 500%
Top 30% Next 50% Bottom 20%Customer Value Segment
Contribution to Overall Profit
Contribution to Overall Profit
11
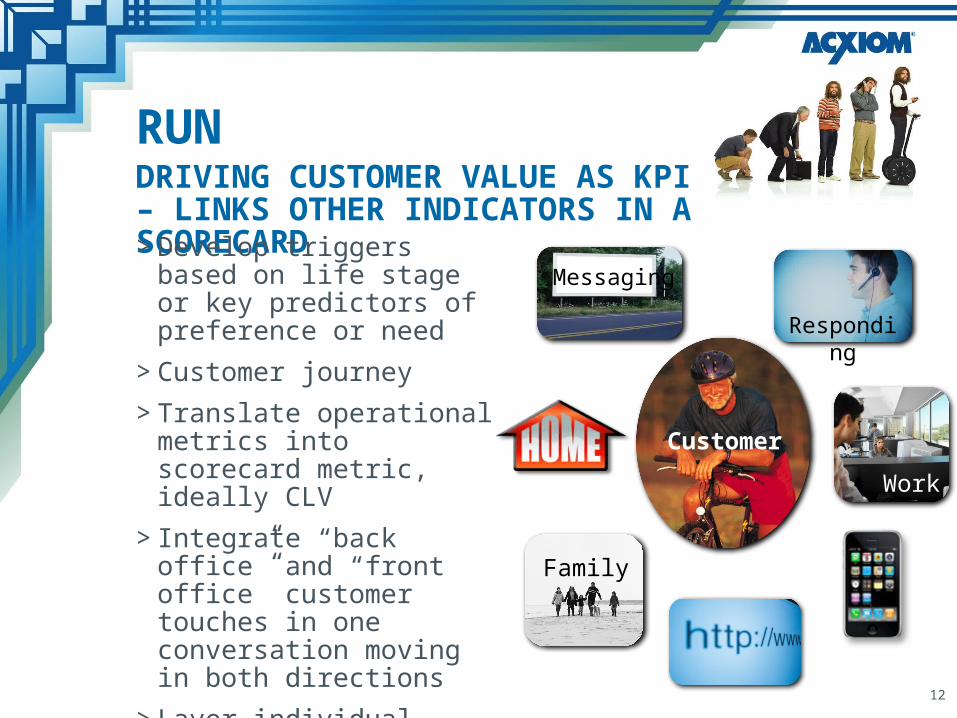
RUNDRIVING CUSTOMER VALUE AS KPI – LINKS OTHER INDICATORS IN A SCORECARD> Develop triggers based on life
stage or key predictors of preference or need
> Customer journey> Translate operational metrics
into scorecard metric, ideally CLV
> Integrate “back office” and “front office” customer touches in one conversation moving in both directions
> Layer individual contact via social strategy and personal contact / offer strategy
Messaging
Family
Work
Customer
Responding
12