dream diversify deliver - nishat mills, ltd
TRANSCRIPT

DreamDiversifyDeliver
Interim Financial Report of Nishat Mills Limited for the quarter ended 30 September 2012


Nishat Mills Limited
02 Company Information04 Directors’ Report08 Unconsolidated Condensed Interim Balance Sheet10 Unconsolidated Condensed Interim Profit and Loss Account11 Unconsolidated Condensed Interim Statement of Comprehensive Income12 Unconsolidated Condensed Interim Cash Flow Statement13 Unconsolidated Condensed Interim Statement of Changes in Equity14 Selected Notes to the Unconsolidated Condensed Interim Financial Information
Nishat Mills Limited and its Subsidiary Companies
24 Consolidated Condensed Interim Balance Sheet26 Consolidated Condensed Interim Profit and Loss Account27 Consolidated Condensed Interim Statement of Comprehensive Income28 Consolidated Condensed Interim Cash Flow Statement29 Consolidated Condensed Interim Statement of Changes in Equity30 Selected Notes to the Consolidated Condensed Interim Financial Information
Contents
2
Board of Directors
Mian Umer Mansha Chairman/CEO
Mian Hassan ManshaMr. Khalid Qadeer QureshiSyed Zahid Hussain Mr. Muhammad AzamMs. Nabiha Shahnawaz Cheema Mr. Maqsood Ahmad
Audit Committee
Mr. Khalid Qadeer Qureshi Chairman/Member
Mr. Muhammad Azam Member
Ms. Nabiha Shahnawaz Cheema Member
Human Resource & Remuneration (HR & R) CommitteeMian Hassan Mansha Chairman/Member
Mian Umer Mansha Member
Mr. Khalid Qadeer Qureshi Member
Chief Financial Officer
Mr. Badar-ul-Hassan
Company Secretary
Mr. Khalid Mahmood Chohan
Auditors
Riaz Ahmad & Company Chartered Accountants
Legal Advisor
Mr. M. Aurangzeb Khan, Advocate,Chamber No. 6, District Court,Faisalabad.
Bankers to the Company
Albaraka Bank (Pakistan) LimitedAllied Bank LimitedAskari Bank LimitedBank Alfalah LimitedBank Islami Pakistan LimitedBarclays Bank PLCBurj Bank LimitedCitibank N.A.Deutsche Bank AGDubai Islamic Bank Pakistan LimitedFaysal Bank LimitedHabib Bank LimitedHabib Metropolitan Bank Limited HSBC Bank Middle East LimitedJS Bank LimitedKASB Bank LimitedMeezan Bank Limited National Bank of Pakistan NIB Bank LimitedPak Brunei Investment Company LimitedPak Oman Investment Company LimitedPakistan Kuwait Investment Company (Private) LimitedSamba Bank LimitedSaudi Pak Industrial & Agricultural Investment Company LimitedSilk Bank LimitedSoneri Bank LimitedSummit Bank LimitedStandard Chartered Bank (Pakistan) LimitedThe Bank of PunjabUnited Bank Limited
Company Information
3
Unconsolidated Condensed Interim Financial Information for the Quarter ended 30 September 2012
Mills
Spinning units, Yarn Dyeing & Power plantNishatabad, Faisalabad.
Weaving units & Power plant 12 K.M. Faisalabad Road, Sheikhupura.
Stitching unit 21 K.M. Ferozepur Road, Lahore.
Weaving units, Dyeing & Finishing unit, Processing unit, Stitching unit and Power plant
5 K.M. Nishat AvenueOff 22 K.M. Ferozepur Road, Lahore.
Apparel Unit 7 K.M. Nishat Avenue Off 22 K.M. Ferozepur Road, Lahore.
Spinning unit & Power plant 20 K.M. Sheikhupura Faisalabad Road,Feroze Watwan.
Registered office & Shares Department
Nishat House,53 - A, Lawrence Road, Lahore.Tel: 042-36360154, 042-111 113 333Fax: 042-36367414
Head Office
7, Main Gulberg, Lahore.Tel: 042-35716351-59, 042-111 332 200Fax: 042-35716349-50E-mail: [email protected]: www.nishatmillsltd.com
Liaison Office
Ist Floor, Karachi Chambers,Hasrat Mohani Road, Karachi.Tel: 021-32414721-23Fax: 021-32412936
4
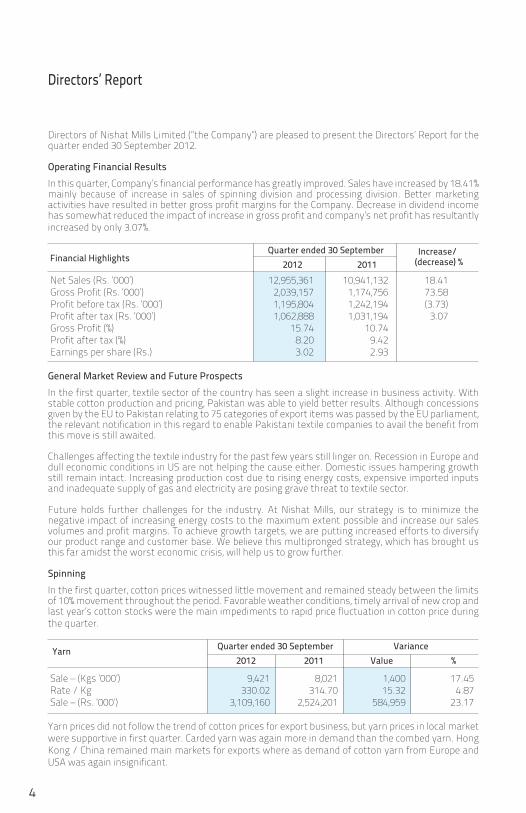
Directors of Nishat Mills Limited (“the Company”) are pleased to present the Directors’ Report for the quarter ended 30 September 2012.
Operating Financial ResultsIn this quarter, Company’s financial performance has greatly improved. Sales have increased by 18.41% mainly because of increase in sales of spinning division and processing division. Better marketing activities have resulted in better gross profit margins for the Company. Decrease in dividend income has somewhat reduced the impact of increase in gross profit and company’s net profit has resultantly increased by only 3.07%.
Financial Highlights Quarter ended 30 September Increase/
2012 2011 (decrease) %
Net Sales (Rs. ‘000’) 12,955,361 10,941,132 18.41 Gross Profit (Rs. ‘000’) 2,039,157 1,174,756 73.58 Profit before tax (Rs. ‘000’) 1,195,804 1,242,194 (3.73) Profit after tax (Rs. ‘000’) 1,062,888 1,031,194 3.07 Gross Profit (%) 15.74 10.74 Profit after tax (%) 8.20 9.42 Earnings per share (Rs.) 3.02 2.93
General Market Review and Future ProspectsIn the first quarter, textile sector of the country has seen a slight increase in business activity. With stable cotton production and pricing, Pakistan was able to yield better results. Although concessions given by the EU to Pakistan relating to 75 categories of export items was passed by the EU parliament, the relevant notification in this regard to enable Pakistani textile companies to avail the benefit from this move is still awaited.
Challenges affecting the textile industry for the past few years still linger on. Recession in Europe and dull economic conditions in US are not helping the cause either. Domestic issues hampering growth still remain intact. Increasing production cost due to rising energy costs, expensive imported inputs and inadequate supply of gas and electricity are posing grave threat to textile sector. Future holds further challenges for the industry. At Nishat Mills, our strategy is to minimize the negative impact of increasing energy costs to the maximum extent possible and increase our sales volumes and profit margins. To achieve growth targets, we are putting increased efforts to diversify our product range and customer base. We believe this multipronged strategy, which has brought us this far amidst the worst economic crisis, will help us to grow further.
SpinningIn the first quarter, cotton prices witnessed little movement and remained steady between the limits of 10% movement throughout the period. Favorable weather conditions, timely arrival of new crop and last year’s cotton stocks were the main impediments to rapid price fluctuation in cotton price during the quarter.
Yarn Quarter ended 30 September Variance 2012 2011 Value %
Sale – (Kgs ‘000’) 9,421 8,021 1,400 17.45 Rate / Kg 330.02 314.70 15.32 4.87 Sale – (Rs. ‘000’) 3,109,160 2,524,201 584,959 23.17
Yarn prices did not follow the trend of cotton prices for export business, but yarn prices in local market were supportive in first quarter. Carded yarn was again more in demand than the combed yarn. Hong Kong / China remained main markets for exports where as demand of cotton yarn from Europe and USA was again insignificant.
Directors’ Report

5
Unconsolidated Condensed Interim Financial Information for the Quarter ended 30 September 2012
Weaving
First quarter witnessed stability in cotton prices internationally. On the contrary, polyester fiber prices have remained bullish for the last few months owing to supply disruption from Chinese plants. Consequently there has been a sharp decline in work-wear business involving poly/cotton blends. Cotton fabric demand has remained stable during the first quarter especially from Far East Countries. Business in Europe has been steady (at times slow) owing to summer holidays, change of season and volatile Euro.
Grey Cloth Quarter ended 30 September Variance 2012 2011 Value %
Sale – (Meters ‘000’) 15,974 14,715 1,259 8.56 Rate / Meter 161.10 176.13 (15.03) (8.53) Sale – (Rs. ‘000’) 2,573,388 2,591,798 (18,410) (0.71)
Our target has been to export most of our production capacity. On the contrary, local grey fabric market has been more lucrative owing to huge finished fabric orders for local dye houses. A huge number of orders have diverted from China. Top grade weaving mills have a very busy schedule thus creating a shortage of fabric in the local market. Our business with some local finishing mills has flourished in this scenario.
We have started planning for replacing our 74 old Tsudakoma Airjet looms. We are also analyzing the option of purchasing European looms this time. Negotiations and discussions with machine suppliers are underway.
Processing and Home TextileIn the first quarter we have seen unprecedented increase in demand of dyed fabrics. There is significant shift of orders from China to this region, which has created capacity crunch in spinning, weaving and dyeing/finishing mills. Because of demand factor, prices of raw material have not come down despite sufficient supply of cotton. Most of the mills are booked for next couple of months due to which production lead times have increased.
Increased demand has also put enormous pressure on our processing division infrastructure. Despite increased production capacity, it is becoming increasingly difficult to manage orders in house. In order to retain the customers, we are going out for commercial processing. Our dyeing production capacities are fully booked till January 2013.
Processed Cloth and Made-ups Quarter ended 30 September Variance 2012 2011 Value %
Sale – (Meters ‘000’) 19,697 13,858 5,839 42.13 Rate / Meter 261.66 292.52 (30.86) (10.55) Sale – (Rs. ‘000’) 5,153,876 4,053,759 1,100,117 27.14
In the home textile division, we have continued our strategy to increase capacity for narrow width business both for apparel dying and apparel printing. Our current production capacities are fully booked. To enable us to meet the order influx, we have initiated activities to increase our production capacity. To this end we have already bought or committed to buy machinery worth Euro 4.5 million to date. These investments will not only increase capacity but also enhance our quality. In this quarter, we were also able to initiate business with Pakistan Army, after successfully delivering quality uniform fabrics to armed forces of Turkey, France and Jordan.
On the whole, we have added many prestigious retailers to our customer base and one of our existing customers has been bought out by Bed Bath and Beyond in USA which is one of the largest retailers of the world. This move is expected to add to our sale volumes in future.
6
Garments
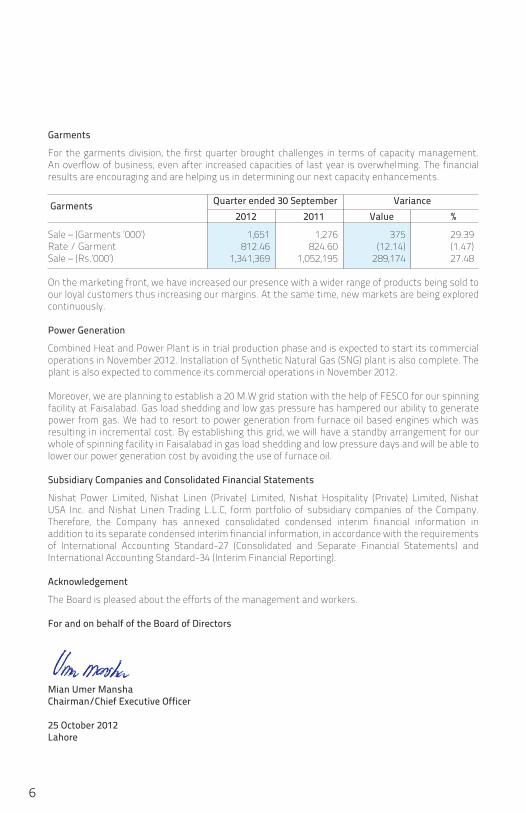
For the garments division, the first quarter brought challenges in terms of capacity management. An overflow of business, even after increased capacities of last year is overwhelming. The financial results are encouraging and are helping us in determining our next capacity enhancements.
Garments Quarter ended 30 September Variance 2012 2011 Value %
Sale – (Garments ‘000’) 1,651 1,276 375 29.39Rate / Garment 812.46 824.60 (12.14) (1.47)Sale – (Rs.’000’) 1,341,369 1,052,195 289,174 27.48
On the marketing front, we have increased our presence with a wider range of products being sold to our loyal customers thus increasing our margins. At the same time, new markets are being explored continuously.
Power Generation
Combined Heat and Power Plant is in trial production phase and is expected to start its commercial operations in November 2012. Installation of Synthetic Natural Gas (SNG) plant is also complete. The plant is also expected to commence its commercial operations in November 2012.
Moreover, we are planning to establish a 20 M.W grid station with the help of FESCO for our spinning facility at Faisalabad. Gas load shedding and low gas pressure has hampered our ability to generate power from gas. We had to resort to power generation from furnace oil based engines which was resulting in incremental cost. By establishing this grid, we will have a standby arrangement for our whole of spinning facility in Faisalabad in gas load shedding and low pressure days and will be able to lower our power generation cost by avoiding the use of furnace oil.
Subsidiary Companies and Consolidated Financial Statements
Nishat Power Limited, Nishat Linen (Private) Limited, Nishat Hospitality (Private) Limited, Nishat USA Inc. and Nishat Linen Trading L.L.C, form portfolio of subsidiary companies of the Company. Therefore, the Company has annexed consolidated condensed interim financial information in addition to its separate condensed interim financial information, in accordance with the requirements of International Accounting Standard-27 (Consolidated and Separate Financial Statements) and International Accounting Standard-34 (Interim Financial Reporting).
Acknowledgement
The Board is pleased about the efforts of the management and workers.
For and on behalf of the Board of Directors
Mian Umer ManshaChairman/Chief Executive Officer
25 October 2012Lahore
7
Unconsolidated Condensed Interim Financial Information for the Quarter ended 30 September 2012
Unconsolidated Condensed Interim
Financial InformationFor the quarter ended 30 September 2012
8
Unconsolidated Condensed Interim Balance SheetAs at 30 September 2012
Un-audited Audited 30 September 30 June 2012 2012 Note (Rupees in thousand)
EQUITY AND LIABILITIES
SHARE CAPITAL AND RESERVES
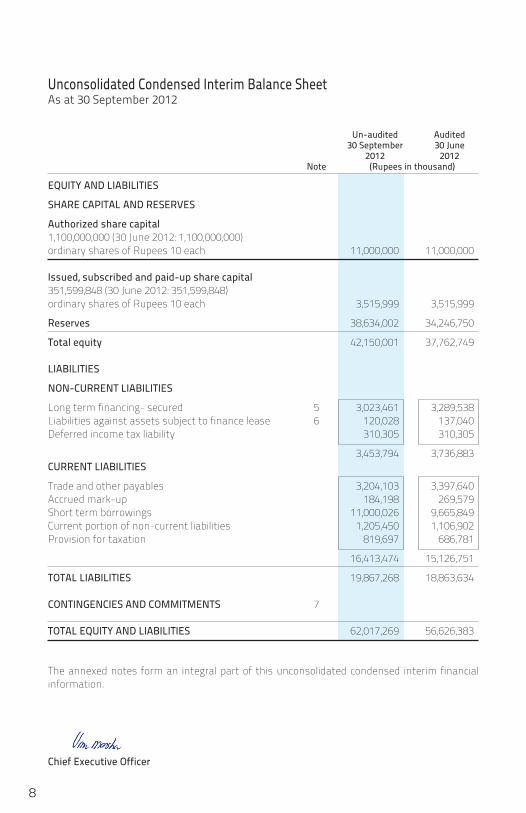
Authorized share capital 1,100,000,000 (30 June 2012: 1,100,000,000) ordinary shares of Rupees 10 each 11,000,000 11,000,000
Issued, subscribed and paid-up share capital 351,599,848 (30 June 2012: 351,599,848) ordinary shares of Rupees 10 each 3,515,999 3,515,999
Reserves 38,634,002 34,246,750
Total equity 42,150,001 37,762,749 LIABILITIES
NON-CURRENT LIABILITIES
Long term financing- secured 5 3,023,461 3,289,538Liabilities against assets subject to finance lease 6 120,028 137,040Deferred income tax liability 310,305 310,305
3,453,794 3,736,883 CURRENT LIABILITIES
Trade and other payables 3,204,103 3,397,640Accrued mark-up 184,198 269,579Short term borrowings 11,000,026 9,665,849Current portion of non-current liabilities 1,205,450 1,106,902Provision for taxation 819,697 686,781
16,413,474 15,126,751
TOTAL LIABILITIES 19,867,268 18,863,634
CONTINGENCIES AND COMMITMENTS 7
TOTAL EQUITY AND LIABILITIES 62,017,269 56,626,383
The annexed notes form an integral part of this unconsolidated condensed interim financial information.
Chief Executive Officer

9
Unconsolidated Condensed Interim Financial Information for the Quarter ended 30 September 2012
Un-audited Audited 30 September 30 June 2012 2012 Note (Rupees in thousand)
ASSETS
NON-CURRENT ASSETS
Property, plant and equipment 8 14,462,731 14,318,639 Investment properties 240,802 241,969 Long term investments 25,188,465 21,912,790 Long term loans 9 270,710 268,330 Long term deposits and prepayments 41,100 36,984
40,203,808 36,778,712
CURRENT ASSETS
Stores, spare parts and loose tools 1,299,809 1,019,041 Stock in trade 7,781,661 9,695,133 Trade debts 5,593,334 3,489,070 Loans and advances 1,981,033 867,631 Short term deposits and prepayments 38,446 41,008 Other receivables 799,210 758,077 Accrued interest 39,086 30,062 Short term investments 1,697,942 1,589,093 Cash and bank balances 2,582,940 2,358,556
21,813,461 19,847,671 TOTAL ASSETS 62,017,269 56,626,383
Director
10
Unconsolidated Condensed Interim Profit and Loss AccountFor the quarter ended 30 September 2012 (Un-audited)
Quarter ended 30 September 30 September 2012 2011 Note (Rupees in thousand)
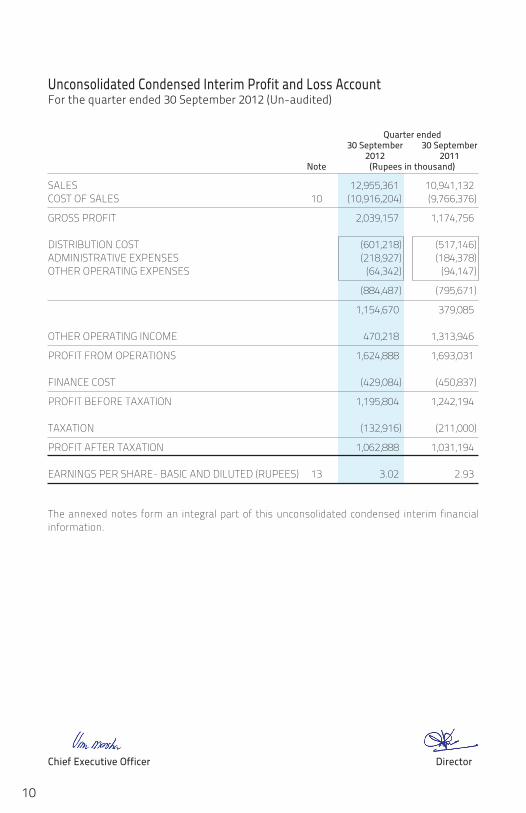
SALES 12,955,361 10,941,132 COST OF SALES 10 (10,916,204) (9,766,376)
GROSS PROFIT 2,039,157 1,174,756 DISTRIBUTION COST (601,218) (517,146)ADMINISTRATIVE EXPENSES (218,927) (184,378)OTHER OPERATING EXPENSES (64,342) (94,147)
(884,487) (795,671)
1,154,670 379,085 OTHER OPERATING INCOME 470,218 1,313,946
PROFIT FROM OPERATIONS 1,624,888 1,693,031 FINANCE COST (429,084) (450,837)
PROFIT BEFORE TAXATION 1,195,804 1,242,194 TAXATION (132,916) (211,000)
PROFIT AFTER TAXATION 1,062,888 1,031,194 EARNINGS PER SHARE- BASIC AND DILUTED (RUPEES) 13 3.02 2.93 The annexed notes form an integral part of this unconsolidated condensed interim financial information.
Chief Executive Officer Director
11
Unconsolidated Condensed Interim Financial Information for the Quarter ended 30 September 2012
Unconsolidated Condensed Interim Statement of Comprehensive IncomeFor the quarter ended 30 September 2012 (Un-audited)
Quarter ended 30 September 30 September 2012 2011 (Rupees in thousand)
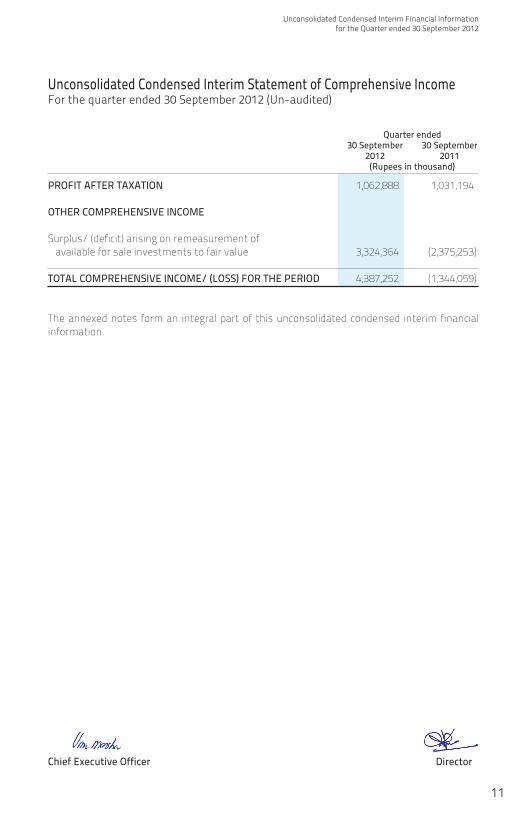
PROFIT AFTER TAXATION 1,062,888 1,031,194 OTHER COMPREHENSIVE INCOME Surplus/ (deficit) arising on remeasurement of available for sale investments to fair value 3,324,364 (2,375,253) TOTAL COMPREHENSIVE INCOME/ (LOSS) FOR THE PERIOD 4,387,252 (1,344,059) The annexed notes form an integral part of this unconsolidated condensed interim financial information.
Chief Executive Officer Director

12
Unconsolidated Condensed Interim Cash Flow StatementFor the quarter ended 30 September 2012 (Un-audited)
Quarter ended 30 September 30 September 2012 2011 Note (Rupees in thousand)
CASH FLOWS FROM OPERATING ACTIVITIES
Cash generated from operations 11 905,461 2,876,786
Finance cost paid (514,465) (524,525)Income tax paid (121,923) (207,414)Exchange gain on forward exchange contracts received 12,815 190,586 Net (increase) / decrease in long term loans to employees (3,468) 2,264 Net (increase) / decrease in long term deposits and prepayments (2,886) 271
Net cash generated from operating activities 275,534 2,337,968 CASH FLOWS FROM INVESTING ACTIVITIES
Capital expenditure on property, plant and equipment (462,895) (362,212)Proceeds from sale of property, plant and equipment 11,982 7,196 Investments made (59,550) (110,819)Loans and advances to subsidiary companies (1,394,352) (689,552)Repayment of loans from subsidiary companies 403,193 303,796 Interest received 14,026 35,100 Dividends received 286,898 1,147,081
Net cash (used in) / from investing activities (1,200,698) 330,590 CASH FLOWS FROM FINANCING ACTIVITIES
Proceeds from long term financing - 45,220 Repayment of long term financing (168,637) (237,380)Repayment of liabilities against assets subject to finance lease (15,904) (14,682)Short term borrowings- net 1,334,177 (536,234)Dividend paid (88) (399)
Net cash from / (used in) financing activities 1,149,548 (743,475)
Net increase in cash and cash equivalents 224,384 1,925,083 Cash and cash equivalents at the beginning of the period 2,358,556 1,132,701
Cash and cash equivalents at the end of the period 2,582,940 3,057,784 The annexed notes form an integral part of this unconsolidated condensed interim financial information.
Chief Executive Officer Director
13
Unconsolidated Condensed Interim Financial Information for the Quarter ended 30 September 2012
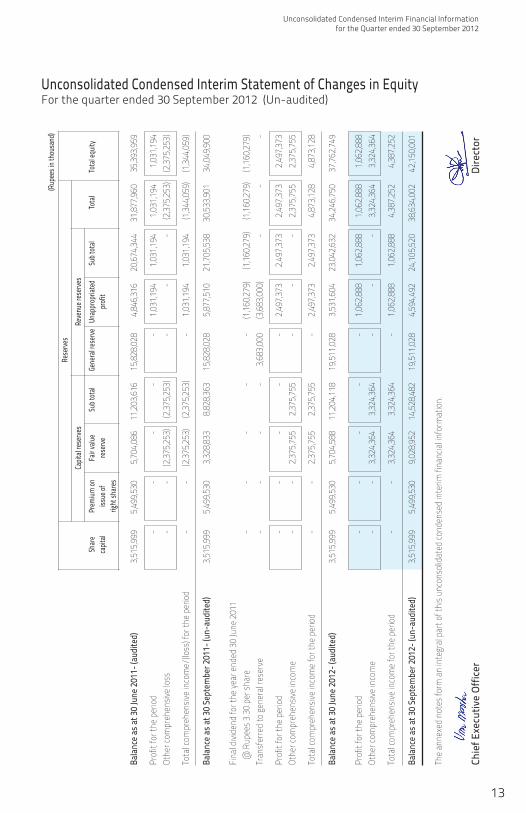
Unconsolidated Condensed Interim Statement of Changes in EquityFor the quarter ended 30 September 2012 (Un-audited)
(Rupe
es in
thou
sand
)
Rese
rves
Ca
pital
reserv
es
Reve
nue r
eserv
es
Sh
are
Prem
ium on
Fa
ir valu
e Su
b tot
al Ge
neral
rese
rve
Unap
prop
riated
Su
b tot
al To
tal
Tota
l equ
ity
ca
pital
issue
of
reserv
e
pr
ofit
rig
ht sh
ares
Balan
ce as
at 30
June
2011
- (au
dited
) 3
,515,9
99
5,49
9,530
5
,704,0
86
11,2
03,61
6
15,8
28,02
8
4,84
6,316
2
0,674
,344
3
1,877
,960
3
5,393
,959
Prof
it fo
r the
per
iod
-
-
-
-
-
1,03
1,194
1
,031,1
94
1,03
1,194
1
,031,1
94
Othe
r com
preh
ensiv
e los
s -
-
(2
,375,2
53)
(2,37
5,253
) -
-
-
(2
,375,2
53)
(2,37
5,253
)
Tota
l com
preh
ensiv
e inc
ome/
(loss
) for
the p
eriod
-
-
(2
,375,2
53)
(2,37
5,253
) -
1
,031,1
94
1,03
1,194
(1
,344,0
59)
(1,34
4,059
)
Balan
ce as
at 30
Sept
embe
r 201
1- (u
n-au
dited
) 3
,515,9
99
5,49
9,530
3
,328,8
33
8,82
8,363
1
5,828
,028
5
,877,5
10
21,7
05,53
8
30,5
33,90
1
34,0
49,90
0
Fina
l divi
dend
for t
he ye
ar en
ded
30 Ju
ne 2
011
@ R
upee
s 3.3
0 pe
r sha
re
-
-
-
-
-
(1,16
0,279
) (1
,160,2
79)
(1,16
0,279
) (1
,160,2
79)
Tran
sfer
red
to ge
nera
l res
erve
-
-
-
-
3
,683,0
00
(3,68
3,000
) -
-
-
Prof
it fo
r the
per
iod
-
-
-
-
-
2,49
7,373
2
,497,3
73
2,49
7,373
2
,497,3
73
Othe
r com
preh
ensiv
e inc
ome
-
-
2,375
,755
2
,375,7
55
-
-
-
2,37
5,755
2
,375,7
55
Tota
l com
preh
ensiv
e inc
ome f
or th
e per
iod
-
-
2,37
5,755
2
,375,7
55
-
2,49
7,373
2
,497,3
73
4,87
3,128
4
,873,1
28
Balan
ce as
at 30
June
2012
- (au
dited
) 3
,515,9
99
5,49
9,530
5
,704,5
88
11,2
04,11
8
19,5
11,02
8
3,53
1,604
2
3,042
,632
3
4,246
,750
3
7,762
,749
Prof
it fo
r the
per
iod
-
-
-
-
-
1,06
2,888
1
,062,8
88
1,06
2,888
1
,062,8
88
Othe
r com
preh
ensiv
e inc
ome
-
-
3,324
,364
3
,324,3
64
-
-
-
3,32
4,364
3
,324,3
64
Tota
l com
preh
ensiv
e inc
ome f
or th
e per
iod
-
-
3,32
4,364
3
,324,3
64
-
1,06
2,888
1
,062,8
88
4,38
7,252
4
,387,2
52
Balan
ce as
at 30
Sept
embe
r 201
2- (u
n-au
dited
) 3
,515,9
99
5,49
9,530
9
,028,9
52
14,5
28,48
2
19,5
11,02
8
4,59
4,492
2
4,105
,520
3
8,634
,002
4
2,150
,001
The a
nnex
ed n
otes
form
an
inte
gral
part
of th
is un
cons
olida
ted
cond
ense
d in
terim
fina
ncial
info
rmat
ion.
Chie
f Exe
cutiv
e Of
ficer
Dire
ctor
14
Selected Notes to the Unconsolidated Condensed Interim Financial InformationFor the quarter ended 30 September 2012 (Un-audited)
1 THE COMPANY AND ITS OPERATIONS
Nishat Mills Limited is a public limited Company incorporated in Pakistan under the Companies Act, 1913 (Now Companies Ordinance, 1984) and listed on all Stock Exchanges in Pakistan. Its registered office is situated at 53-A, Lawrence Road, Lahore. The Company is engaged in the business of textile manufacturing and of spinning, combing, weaving, bleaching, dyeing, printing, stitching, apparel, buying, selling and otherwise dealing in yarn, linen, cloth and other goods and fabrics made from raw cotton, synthetic fibre and cloth, and to generate, accumulate, distribute, supply and sell electricity.
2 BASIS OF PREPARATION
This unconsolidated condensed interim financial information is un-audited and is being submitted to share holders as required by section 245 of the Companies Ordinance, 1984 and the listing regulations of the Islamabad, Karachi and Lahore stock exchanges. This unconsolidated condensed interim financial information of the Company for the quarter ended 30 September 2012 has been prepared in accordance with the requirements of International Accounting Standard 34 (Interim Financial Reporting) and provisions of and directives issued under the Companies Ordinance, 1984. In case where requirements differ, the provisions of or directives issued under the Companies Ordinance, 1984 have been followed. This unconsolidated condensed interim financial information should be read in conjunction with the preceding audited annual published financial statements of the Company for the year ended 30 June 2012.
3 ACCOUNTING POLICIES
The accounting policies and methods of computations adopted for the preparation of this unconsolidated condensed interim financial information are the same as applied in the preparation of the preceding audited annual published financial statements of the Company for the year ended 30 June 2012.
4 CRITICAL ACCOUNTING ESTIMATES AND JUDGEMENTS
The preparation of this unconsolidated condensed interim financial information in conformity with the approved accounting standards requires the use of certain critical accounting estimates. It also requires the management to exercise its judgment in the process of applying the Company’s accounting policies. Estimates and judgments are continually evaluated and are based on historical experience and other factors, including expectations of future events that are believed to be reasonable under the circumstances.
During preparation of this unconsolidated condensed interim financial information, the significant judgments made by the management in applying the Company’s accounting policies and the key sources of estimation and uncertainty were the same as those that applied in the preceding audited annual published financial statements of the Company for the year ended 30 June 2012.

15
Unconsolidated Condensed Interim Financial Information for the Quarter ended 30 September 2012
Un-audited Audited 30 September 30 June 2012 2012 (Rupees in thousand)
5 LONG TERM FINANCING- SECURED
Opening balance 4,331,178 3,882,849 Add: Obtained during the period / year - 1,941,842 Less: Repaid during the period / year 168,637 1,493,513
4,162,541 4,331,178 Less: Current portion shown under current liabilities 1,139,080 1,041,640
3,023,461 3,289,538
6 LIABILITIES AGAINST ASSETS SUBJECT TO FINANCE LEASE
Future minimum lease payments 220,558 242,580 Less: Un-amortized finance charge 34,160 40,278
Present value of future minimum lease payments 186,398 202,302 Less: Current portion shown under current liabilities 66,370 65,262
120,028 137,040 7 CONTINGENCIES AND COMMITMENTS
Contingencies
i) The Company is contingently liable for Rupees 0.631 million (30 June 2012: Rupees 0.631 million) on account of central excise duty not acknowledged as debt as the cases are pending before Court.
ii) Guarantees of Rupees 549.705 million (30 June 2012: Rupees 539.902 million) are
given by the banks of the Company to Sui Northern Gas Pipelines Limited against gas connections, Shell Pakistan Limited and Pakistan State Oil Limited against purchase of furnace oil and Director Excise and Taxation, Karachi against infrastructure cess.
iii) Post dated cheques of Rupees 1,764.734 million (30 June 2012: Rupees 1,591.201
million) are issued to customs authorities in respect of duties on imported items availed on the basis of consumption and export plans. If documents of exports are not provided on due dates, cheques issued as security shall be encashable.
Commitments
i) Contracts for capital expenditure are approximately of Rupees 685.440 million (30 June 2012: Rupees 639.874 million).
ii) Letters of credit other than for capital expenditure are of Rupees 574.178 million (30 June 2012: Rupees 613.976 million).

16
8 PROPERTY, PLANT AND EQUIPMENT Un-audited Audited 30 September 30 June 2012 2012 Note (Rupees in thousand)
Operating fixed assets Owned 8.1 12,368,355 12,250,991 Leased 8.2 240,315 246,378 Capital work-in-progress 8.3 1,854,061 1,821,270
14,462,731 14,318,639
8.1 Operating fixed assets- Owned
Opening book value 12,250,991 12,107,389 Add: Cost of additions during the period/year 8.1.1 430,104 1,573,932 Less: Book value of assets transferred to investment properties during the year - 120,279
12,681,095 13,561,042 Less: Book value of deletions during the period/ year 8.1.2 9,805 82,737
12,671,290 13,478,305 Less: Depreciation charged during the period/ year 302,935 1,227,314
12,368,355 12,250,991
8.1.1 Cost of additions
Freehold land - 44,433 Buildings on freehold land - 381,732 Plant and machinery 408,059 995,021 Electric installations 999 18,883 Factory equipment 12,911 30,193 Furniture, fixtures and office equipment 3,077 14,990 Computer equipment 1,787 7,530 Vehicles 3,271 81,150
430,104 1,573,932
Selected Notes to the Unconsolidated Condensed Interim Financial InformationFor the quarter ended 30 September 2012 (Un-audited)
17
Unconsolidated Condensed Interim Financial Information for the Quarter ended 30 September 2012
Un-audited Audited 30 September 30 June 2012 2012 (Rupees in thousand)
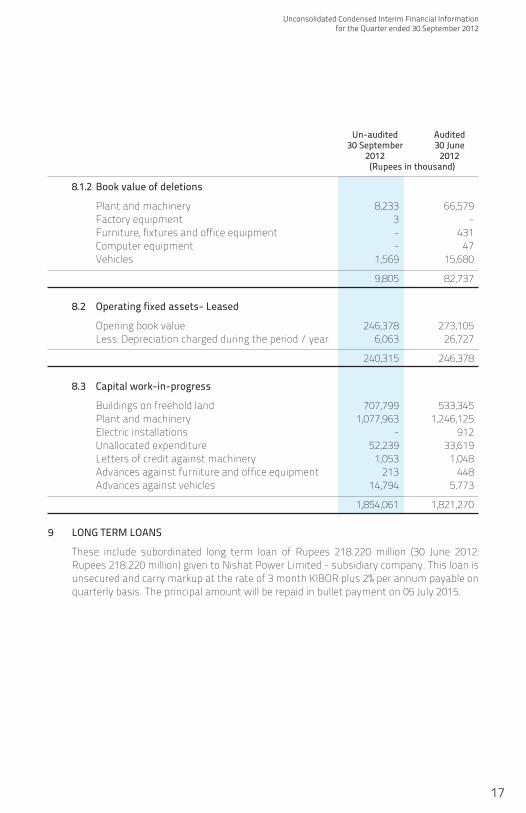
8.1.2 Book value of deletions
Plant and machinery 8,233 66,579 Factory equipment 3 - Furniture, fixtures and office equipment - 431 Computer equipment - 47 Vehicles 1,569 15,680
9,805 82,737
8.2 Operating fixed assets- Leased
Opening book value 246,378 273,105 Less: Depreciation charged during the period / year 6,063 26,727
240,315 246,378
8.3 Capital work-in-progress
Buildings on freehold land 707,799 533,345 Plant and machinery 1,077,963 1,246,125 Electric installations - 912 Unallocated expenditure 52,239 33,619 Letters of credit against machinery 1,053 1,048 Advances against furniture and office equipment 213 448 Advances against vehicles 14,794 5,773
1,854,061 1,821,270 9 LONG TERM LOANS
These include subordinated long term loan of Rupees 218.220 million (30 June 2012: Rupees 218.220 million) given to Nishat Power Limited - subsidiary company. This loan is unsecured and carry markup at the rate of 3 month KIBOR plus 2% per annum payable on quarterly basis. The principal amount will be repaid in bullet payment on 05 July 2015.
18
Quarter ended 30 September 30 September 2012 2011 (Rupees in thousand)
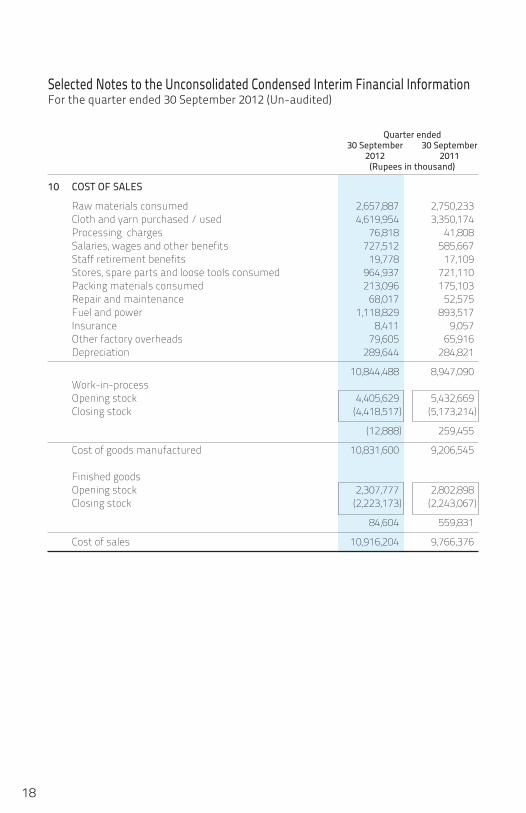
10 COST OF SALES
Raw materials consumed 2,657,887 2,750,233 Cloth and yarn purchased / used 4,619,954 3,350,174 Processing charges 76,818 41,808 Salaries, wages and other benefits 727,512 585,667 Staff retirement benefits 19,778 17,109 Stores, spare parts and loose tools consumed 964,937 721,110 Packing materials consumed 213,096 175,103 Repair and maintenance 68,017 52,575 Fuel and power 1,118,829 893,517 Insurance 8,411 9,057 Other factory overheads 79,605 65,916 Depreciation 289,644 284,821
10,844,488 8,947,090 Work-in-process Opening stock 4,405,629 5,432,669 Closing stock (4,418,517) (5,173,214)
(12,888) 259,455
Cost of goods manufactured 10,831,600 9,206,545 Finished goods Opening stock 2,307,777 2,802,898 Closing stock (2,223,173) (2,243,067)
84,604 559,831
Cost of sales 10,916,204 9,766,376
Selected Notes to the Unconsolidated Condensed Interim Financial InformationFor the quarter ended 30 September 2012 (Un-audited)
19
Unconsolidated Condensed Interim Financial Information for the Quarter ended 30 September 2012
Quarter ended 30 September 30 September 2012 2011 Note (Rupees in thousand)
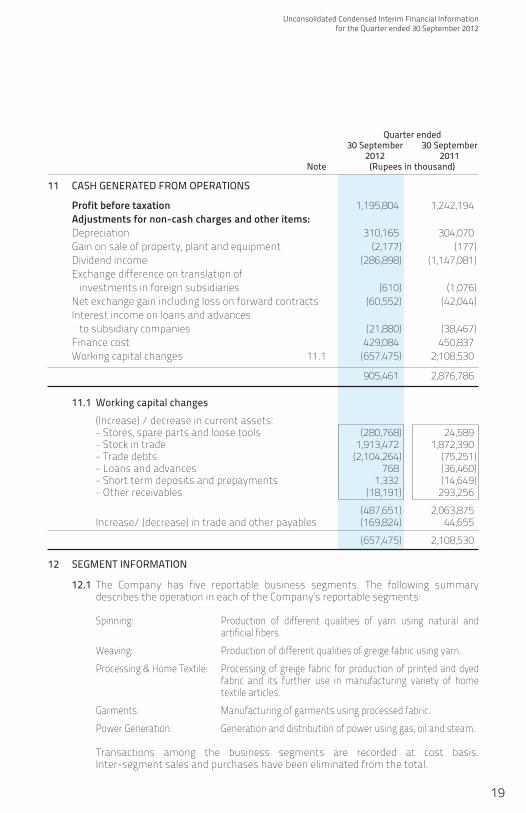
11 CASH GENERATED FROM OPERATIONS
Profit before taxation 1,195,804 1,242,194 Adjustments for non-cash charges and other items: Depreciation 310,165 304,070 Gain on sale of property, plant and equipment (2,177) (177) Dividend income (286,898) (1,147,081) Exchange difference on translation of investments in foreign subsidiaries (610) (1,076) Net exchange gain including loss on forward contracts (60,552) (42,044) Interest income on loans and advances to subsidiary companies (21,880) (38,467) Finance cost 429,084 450,837 Working capital changes 11.1 (657,475) 2,108,530
905,461 2,876,786
11.1 Working capital changes (Increase) / decrease in current assets: - Stores, spare parts and loose tools (280,768) 24,589 - Stock in trade 1,913,472 1,872,390 - Trade debts (2,104,264) (75,251) - Loans and advances 768 (36,460) - Short term deposits and prepayments 1,332 (14,649) - Other receivables (18,191) 293,256
(487,651) 2,063,875 Increase/ (decrease) in trade and other payables (169,824) 44,655
(657,475) 2,108,530
12 SEGMENT INFORMATION
12.1 The Company has five reportable business segments. The following summary describes the operation in each of the Company’s reportable segments:
Spinning: Production of different qualities of yarn using natural and artificial fibers.
Weaving: Production of different qualities of greige fabric using yarn.
Processing & Home Textile: Processing of greige fabric for production of printed and dyed fabric and its further use in manufacturing variety of home textile articles.
Garments: Manufacturing of garments using processed fabric.
Power Generation: Generation and distribution of power using gas, oil and steam. Transactions among the business segments are recorded at cost basis.
Inter-segment sales and purchases have been eliminated from the total.

20
12.2
(U
n-au
dited
)
Spinn
ing
Wea
ving
Proc
essin
g &
Garm
ents
Po
wer G
ener
ation
Eli
mina
tion o
f inte
r-
Tota
l- Co
mpa
ny
Ho
me T
extil
e
se
gmen
t tra
nsac
tions
Quar
ter e
nded
Qu
arte
r end
ed
Quar
ter e
nded
Qu
arte
r end
ed
Quar
ter e
nded
Qu
arte
r end
ed
Quar
ter e
nded
Sep 2
012
Sep 2
011
Sep 2
012
Sep 2
011
Sep 2
012
Sep 2
011
Sep 2
012
Sep 2
011
Sep 2
012
Sep 2
011
Sep 2
012
Sep 2
011
Sep 2
012
Sep 2
011
(Rup
ees i
n tho
usan
d)
Sales
Exte
rnal
3,47
5,630
2,
946,6
69
2,67
3,068
2,
679,2
02
5,43
3,892
4,
225,5
59
1,36
2,147
1,
080,3
37
10,62
4 9,
365
-
-
12,95
5,361
10
,941,1
32
In
ters
egm
ent
797,5
07
971,6
97
1,64
9,663
1,
585,0
84
194,9
13
142,9
17
-
7
1,06
9,999
88
4,544
(3
,712,0
82)
(3,58
4,249
) -
-
4,27
3,137
3,
918,3
66
4,32
2,731
4,
264,2
86
5,62
8,805
4,
368,4
76
1,36
2,147
1,
080,3
44
1,08
0,623
89
3,909
(3
,712,0
82)
(3,58
4,249
) 12
,955,3
61
10,94
1,132
Cost
of sa
les
(3,63
6,650
) (3
,781,6
10)
(3,92
6,186
) (3
,978,7
48)
(4,89
1,409
) (3
,811,0
42)
(1,09
8,513
) (8
87,15
5)
(1,07
5,528
) (8
92,07
0)
3,71
2,082
3,
584,2
49
(10,9
16,20
4)
(9,76
6,376
)
Gr
oss p
rofit
63
6,487
13
6,756
39
6,545
28
5,538
73
7,396
55
7,434
26
3,634
19
3,189
5,
095
1,83
9 -
-
2,
039,1
57
1,17
4,756
Dist
ribut
ion co
st
(82,3
62)
(86,1
88)
(138
,845)
(1
31,76
5)
(284
,543)
(2
37,32
9)
(94,9
13)
(61,8
64)
(555
) -
-
-
(6
01,21
8)
(517
,146)
Ad
min
istra
tive e
xpen
ses
(58,4
60)
(50,4
12)
(48,6
39)
(48,1
68)
(85,2
84)
(65,8
61)
(18,2
44)
(14,4
38)
(8,30
0)
(5,49
9)
-
-
(218
,927)
(1
84,37
8)
(140
,822)
(1
36,60
0)
(187
,484)
(1
79,93
3)
(369
,827)
(3
03,19
0)
(113
,157)
(7
6,302
) (8
,855)
(5
,499)
-
-
(8
20,14
5)
(701
,524)
Pr
ofit/
(loss
) befo
re ta
xatio
n and
u
nallo
cated
inco
me an
d exp
ense
s 49
5,665
15
6 20
9,061
10
5,605
36
7,569
25
4,244
15
0,477
11
6,887
(3
,760)
(3
,660)
-
-
1,
219,0
12
473,2
32
Un
alloc
ated
inco
me a
nd ex
pens
es:
Ot
her o
pera
ting e
xpen
ses
(64,3
42)
(94,1
47)
Ot
her o
pera
ting i
ncom
e
47
0,218
1,
313,9
46
Fin
ance
cost
(4
29,08
4)
(450
,837)
Ta
xatio
n
(1
32,91
6)
(211
,000)
Pr
ofit
afte
r tax
ation
1,
062,8
88
1,03
1,194
Spinn
ing
Wea
ving
Proc
essin
g &
Garm
ents
Po
wer G
ener
ation
To
tal-
Com
pany
Ho
me T
extil
e
Un-a
udite
d Au
dited
U
n-au
dited
Au
dited
Un
-aud
ited
Audit
ed
Un-a
udite
d Au
dited
Un
-aud
ited
Audit
ed
Un-a
udite
d Au
dited
Sep 2
012
Jun 2
012
Sep 2
012
Jun 2
012
Sep 2
012
Jun 2
012
Sep 2
012
Jun 2
012
Sep 2
012
Jun 2
012
Sep 2
012
Jun 2
012
(R
upee
s in t
hous
and)
To
tal a
sset
s for
repo
rtable
segm
ents
7,
186,7
07
8,30
1,318
5,
582,3
59
5,07
2,193
10
,607,2
15
9,85
0,474
2,
019,6
91
2,29
0,564
3,
958,2
80
3,56
3,078
29
,354,2
52
29,07
7,627
Un
alloc
ated
asse
ts:
Lo
ng te
rm in
vest
men
ts
25,18
8,465
21
,912,7
90
Ot
her r
eceiv
ables
79
9,210
75
8,077
Cash
and b
ank b
alanc
es
2,58
2,940
2,
358,5
56
Ot
her c
orpo
rate
asse
ts
4,09
2,402
2,
519,3
33
To
tal a
sset
s as p
er ba
lance
shee
t
62
,017,2
69
56,62
6,383
Selected Notes to the Unconsolidated Condensed Interim Financial InformationFor the quarter ended 30 September 2012 (Un-audited)
12.3
Reco
ncilia
tion o
f rep
orta
ble se
gmen
t ass
ets

21
Unconsolidated Condensed Interim Financial Information for the Quarter ended 30 September 2012
13 EARNINGS PER SHARE - BASIC AND DILUTED
There is no dilutive effect on the basic earnings per share. 14 TRANSACTIONS WITH RELATED PARTIES
The related parties comprise subsidiary companies, associated undertakings, other related companies, key management personnel and provident fund trust. The Company in the normal course of business carries out transactions with various related parties. Detail of transactions with related parties are as follows:
Quarter ended 30 September 30 September 2012 2011 (Rupees in thousand)
Subsidiary companies
Investment made 59,550 65,000 Short term loans made 1,394,352 689,552 Short term loans payment received 403,193 303,796 Interest income 21,880 38,467 Rental income 3,100 1,170 Sale of goods and services 675,796 135,040 Purchase of goods and services 13,254 39,470 Associated companies
Purchase of goods and services 3,176 6,113 Sale of goods and services 63 236 Rental income 53 2,147 Sale of operating fixed assets 1,327 - Dividend income 286,898 1,147,081 Insurance premium paid 44,919 44,086 Insurance claim received 4,291 3,467 Profit on term deposit receipt 7,980 - Subscription paid 1,250 1,000 Other related parties
Purchase of goods and services 4,954 - Sale of goods and services 25,845 1,095 Company’s contribution to provident fund trust 27,988 24,075 Remuneration paid to Chief Executive Officer, Directors and Executives 123,469 83,099

22
15 FINANCIAL RISK MANAGEMENT
The Company’s financial risk management objectives and policies are consistent with those disclosed in the preceding audited annual published financial statements of the Company for the year ended 30 June 2012.
16 DATE OF AUTHORIZATION FOR ISSUE
This unconsolidated condensed interim financial information was approved by the Board of Directors and authorized for issue on 25 October 2012.
17 CORRESPONDING FIGURES
Corresponding figures have been re-arranged, wherever necessary, for the purpose of comparison. However, no significant re-arrangement have been made.
18 GENERAL
Figures have been rounded off to the nearest thousand of Rupees unless otherwise stated.
Selected Notes to the Unconsolidated Condensed Interim Financial InformationFor the quarter ended 30 September 2012 (Un-audited)
Chief Executive Officer Director
23
Consolidated Condensed Interim Financial Information for the Quarter ended 30 September 2012
Consolidated Condensed Interim
Financial InformationFor the quarter ended 30 September 2012
24
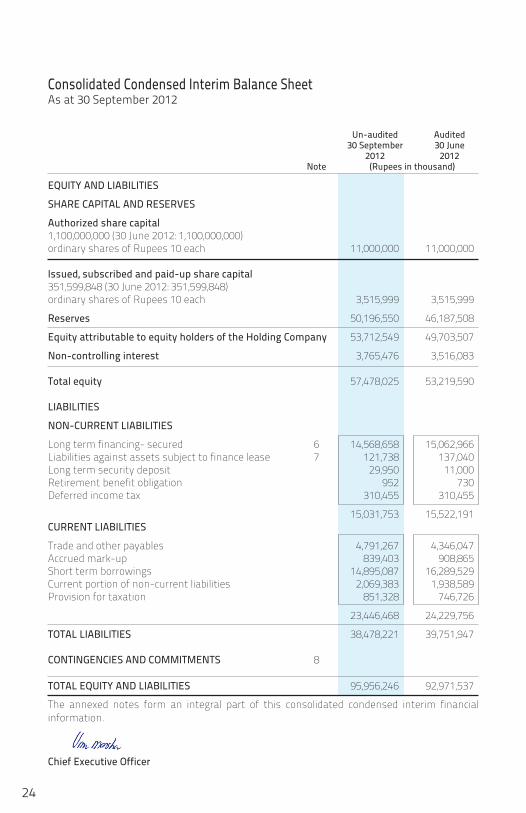
Consolidated Condensed Interim Balance SheetAs at 30 September 2012
Un-audited Audited 30 September 30 June 2012 2012 Note (Rupees in thousand)
EQUITY AND LIABILITIES
SHARE CAPITAL AND RESERVES
Authorized share capital 1,100,000,000 (30 June 2012: 1,100,000,000) ordinary shares of Rupees 10 each 11,000,000 11,000,000
Issued, subscribed and paid-up share capital 351,599,848 (30 June 2012: 351,599,848) ordinary shares of Rupees 10 each 3,515,999 3,515,999
Reserves 50,196,550 46,187,508
Equity attributable to equity holders of the Holding Company 53,712,549 49,703,507
Non-controlling interest 3,765,476 3,516,083 Total equity 57,478,025 53,219,590 LIABILITIES
NON-CURRENT LIABILITIES
Long term financing- secured 6 14,568,658 15,062,966Liabilities against assets subject to finance lease 7 121,738 137,040Long term security deposit 29,950 11,000Retirement benefit obligation 952 730 Deferred income tax 310,455 310,455
15,031,753 15,522,191 CURRENT LIABILITIES
Trade and other payables 4,791,267 4,346,047Accrued mark-up 839,403 908,865Short term borrowings 14,895,087 16,289,529Current portion of non-current liabilities 2,069,383 1,938,589Provision for taxation 851,328 746,726
23,446,468 24,229,756
TOTAL LIABILITIES 38,478,221 39,751,947 CONTINGENCIES AND COMMITMENTS 8 TOTAL EQUITY AND LIABILITIES 95,956,246 92,971,537
The annexed notes form an integral part of this consolidated condensed interim financial information.
Chief Executive Officer

25
Consolidated Condensed Interim Financial Information for the Quarter ended 30 September 2012
Un-audited Audited 30 September 30 June 2012 2012 Note (Rupees in thousand)
ASSETS
NON-CURRENT ASSETS
Property, plant and equipment 9 29,456,222 29,469,622Investment properties 240,802 241,969Long term investments 32,429,339 29,853,657Long term loans 52,490 50,110Long term deposits and prepayments 51,059 42,645
62,229,912 59,658,003 CURRENT ASSETS
Stores, spare parts and loose tools 1,693,689 1,424,420Stock-in-trade 9,686,533 10,549,271Trade debts 15,849,201 14,196,364Loans and advances 1,037,716 1,958,525Short term deposits and prepayments 91,514 75,324Other receivables 988,658 969,638Accrued interest 36,316 50,233Short term investments 1,697,942 1,589,093Cash and bank balances 2,644,765 2,500,666
33,726,334 33,313,534
TOTAL ASSETS 95,956,246 92,971,537
Director

26
Consolidated Condensed Interim Profit and Loss AccountFor the quarter ended 30 September 2012 (Un-audited)
Quarter ended 30 September 30 September 2012 2011 Note (Rupees in thousand)
SALES 18,590,095 17,502,287COST OF SALES 10 (15,238,397) (15,097,785)
GROSS PROFIT 3,351,698 2,404,502 DISTRIBUTION COST (671,657) (537,071)ADMINISTRATIVE EXPENSES (263,916) (211,457)OTHER OPERATING EXPENSES (65,004) (95,295)
(1,000,577) (843,823)
2,351,121 1,560,679 OTHER OPERATING INCOME 457,186 322,677
PROFIT FROM OPERATIONS 2,808,307 1,883,356 FINANCE COST (1,094,067) (1,165,332)
1,714,240 718,024 SHARE OF PROFIT FROM ASSOCIATED COMPANIES 630,405 164,863
PROFIT BEFORE TAXATION 2,344,645 882,887 TAXATION (140,448) (218,351)
PROFIT AFTER TAXATION 2,204,197 664,536 SHARE OF PROFIT ATTRIBUTABLE TO: EQUITY HOLDERS OF HOLDING COMPANY 1,954,804 453,568NON-CONTROLLING INTEREST 249,393 210,968
2,204,197 664,536 EARNINGS PER SHARE- BASIC AND DILUTED (RUPEES) 13 5.56 1.29 The annexed notes form an integral part of this consolidated condensed interim financial information.
Chief Executive Officer Director
27
Consolidated Condensed Interim Financial Information for the Quarter ended 30 September 2012
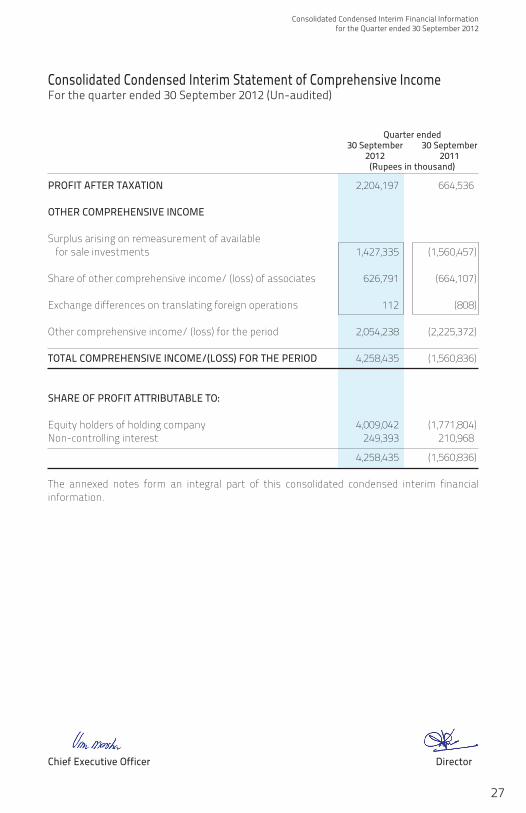
Consolidated Condensed Interim Statement of Comprehensive IncomeFor the quarter ended 30 September 2012 (Un-audited)
Quarter ended 30 September 30 September 2012 2011 (Rupees in thousand)
PROFIT AFTER TAXATION 2,204,197 664,536 OTHER COMPREHENSIVE INCOME Surplus arising on remeasurement of available for sale investments 1,427,335 (1,560,457) Share of other comprehensive income/ (loss) of associates 626,791 (664,107) Exchange differences on translating foreign operations 112 (808) Other comprehensive income/ (loss) for the period 2,054,238 (2,225,372) TOTAL COMPREHENSIVE INCOME/(LOSS) FOR THE PERIOD 4,258,435 (1,560,836) SHARE OF PROFIT ATTRIBUTABLE TO: Equity holders of holding company 4,009,042 (1,771,804)Non-controlling interest 249,393 210,968
4,258,435 (1,560,836) The annexed notes form an integral part of this consolidated condensed interim financial information.
Chief Executive Officer Director
28
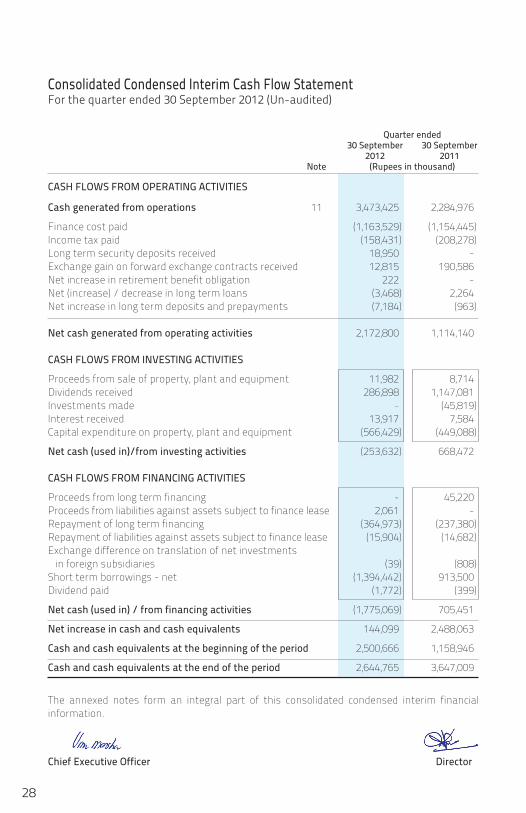
Consolidated Condensed Interim Cash Flow StatementFor the quarter ended 30 September 2012 (Un-audited)
Quarter ended 30 September 30 September 2012 2011 Note (Rupees in thousand)
CASH FLOWS FROM OPERATING ACTIVITIES
Cash generated from operations 11 3,473,425 2,284,976
Finance cost paid (1,163,529) (1,154,445)Income tax paid (158,431) (208,278)Long term security deposits received 18,950 - Exchange gain on forward exchange contracts received 12,815 190,586 Net increase in retirement benefit obligation 222 - Net (increase) / decrease in long term loans (3,468) 2,264 Net increase in long term deposits and prepayments (7,184) (963) Net cash generated from operating activities 2,172,800 1,114,140 CASH FLOWS FROM INVESTING ACTIVITIES
Proceeds from sale of property, plant and equipment 11,982 8,714 Dividends received 286,898 1,147,081 Investments made - (45,819)Interest received 13,917 7,584 Capital expenditure on property, plant and equipment (566,429) (449,088)
Net cash (used in)/from investing activities (253,632) 668,472 CASH FLOWS FROM FINANCING ACTIVITIES
Proceeds from long term financing - 45,220 Proceeds from liabilities against assets subject to finance lease 2,061 - Repayment of long term financing (364,973) (237,380)Repayment of liabilities against assets subject to finance lease (15,904) (14,682)Exchange difference on translation of net investments in foreign subsidiaries (39) (808)Short term borrowings - net (1,394,442) 913,500 Dividend paid (1,772) (399)
Net cash (used in) / from financing activities (1,775,069) 705,451
Net increase in cash and cash equivalents 144,099 2,488,063
Cash and cash equivalents at the beginning of the period 2,500,666 1,158,946
Cash and cash equivalents at the end of the period 2,644,765 3,647,009
The annexed notes form an integral part of this consolidated condensed interim financial information.
Chief Executive Officer Director

29
Consolidated Condensed Interim Financial Information for the Quarter ended 30 September 2012
Consolidated Condensed Interim Statement of Changes in EquityFor the quarter ended 30 September 2012 (Un-audited)
Balan
ce as
at 30
June
2011
- (au
dited
) 3,
515,9
99
5,49
9,530
5,
896,1
30
1,26
0 11
1,002
11
,507,9
22
23,05
8,882
9,
151,2
33
32,21
0,115
43
,718,0
37
47,23
4,036
2,
691,6
79
49,92
5,715
Prof
it for
the p
eriod
-
-
-
-
-
-
-
45
3,568
45
3,568
45
3,568
45
3,568
21
0,968
66
4,536
Ot
her c
ompr
ehen
sive i
ncom
e for
the p
eriod
-
-
(2
,224,5
64)
(808
) -
(2,
225,3
72)
-
-
-
(2,22
5,372
) (2
,225,3
72)
-
(2,22
5,372
)
Tota
l com
preh
ensiv
e inc
ome f
or th
e per
iod
-
-
(2,22
4,564
) (8
08)
-
(2,22
5,372
) -
45
3,568
45
3,568
(1
,771,8
04)
(1,77
1,804
) 21
0,968
(1
,560,8
36)
Balan
ce as
at 30
Sept
embe
r 201
1- (u
n-au
dited
) 3,
515,9
99
5,49
9,530
3,
671,5
66
452
111,0
02
9,28
2,550
23
,058,8
82
9,60
4,801
32
,663,6
83
41,94
6,233
45
,462,2
32
2,90
2,647
48
,364,8
79
Final
divide
nd fo
r the
year
ende
d 30 J
une 2
011
@ R
upee
s 3.30
per s
hare
-
-
-
-
-
-
-
(1,16
0,279
) (1
,160,2
79)
(1,16
0,279
) (1
,160,2
79)
-
(1,16
0,279
) Tr
ansfe
rred t
o gen
eral
rese
rve
-
-
-
-
-
-
7,84
6,000
(7
,846,0
00)
-
-
-
-
- Di
viden
d rela
ting t
o 201
1 paid
to
non
-con
trollin
g int
eres
t -
-
-
-
-
-
-
-
-
-
-
(173
,455)
(173
,455)
Prof
it for
the p
eriod
-
-
-
-
-
-
-
3,78
2,784
3,
782,7
84
3,78
2,784
3,
782,7
84
786,8
91
4,56
9,675
Ot
her c
ompr
ehen
sive i
ncom
e for
the p
eriod
-
-
1,
615,7
32
3,03
8 -
1
,618,7
70
-
-
-
1,61
8,770
1,
618,7
70
-
1,61
8,770
Tota
l com
preh
ensiv
e inc
ome f
or th
e per
iod
-
-
1,61
5,732
3,
038
-
1,61
8,770
-
3,
782,7
84
3,78
2,784
5,
401,5
54
5,40
1,554
78
6,891
6,
188,4
45
Balan
ce as
at 30
June
2012
- (au
dited
) 3,
515,9
99
5,49
9,530
5,
287,2
98
3,49
0 11
1,002
1
0,901
,320
30,90
4,882
4,
381,3
06
35,28
6,188
46
,187,5
08
49,70
3,507
3,
516,0
83
53,21
9,590
Pr
ofit f
or th
e per
iod
-
-
-
-
-
-
-
1,
954,8
04
1,95
4,804
1,
954,8
04
1,95
4,804
24
9,393
2,
204,1
97
Othe
r com
preh
ensiv
e inc
ome f
or th
e per
iod
-
-
2,05
4,126
11
2 -
2
,054,2
38
-
-
-
2,05
4,238
2,
054,2
38
-
2,05
4,238
Tota
l com
preh
ensiv
e inc
ome f
or th
e per
iod
-
-
2,05
4,126
11
2 -
2
,054,2
38
-
1,95
4,804
1,
954,8
04
4,00
9,042
4,
009,0
42
249,3
93
4,25
8,435
Ba
lance
as at
30 Se
ptem
ber 2
012-
(un-
audit
ed)
3,51
5,999
5,
499,5
30
7,34
1,424
3,
602
111,0
02
12,9
55,55
8 30
,904,8
82
6,33
6,110
37
,240,9
92
50,19
6,550
53
,712,5
49
3,76
5,476
57
,478,0
25
The
anne
xed
note
s fo
rm a
n in
tegr
al p
art o
f thi
s co
nsol
idat
ed c
onde
nsed
inte
rim fi
nanc
ial i
nfor
mat
ion.
Attri
buta
ble to
equit
y hold
ers of
the h
olding
comp
any
(Rup
ees i
n tho
usan
d)
Capit
al res
erve
Reve
nue r
eserv
eSh
are
capit
alPr
emium
oniss
ue of
right
shar
es
Exch
ange
trans
lation
reserv
e
Capit
alred
empt
ionres
erve f
und
Non-
cont
rollin
gint
erest
Fair v
alue
reserv
eSu
b tot
alSu
b tot
alTo
tal e
quity
Tota
lres
erves
Shar
ehold
ers’
equit
yGe
nera
l res
erve
Unapp
ropria
tedpro
fit
Chie
f Exe
cutiv
e Of
ficer
Dire
ctor
30
Selected Notes to the Consolidated Condensed Interim Financial InformationFor the quarter ended 30 September 2012 (Un-audited)
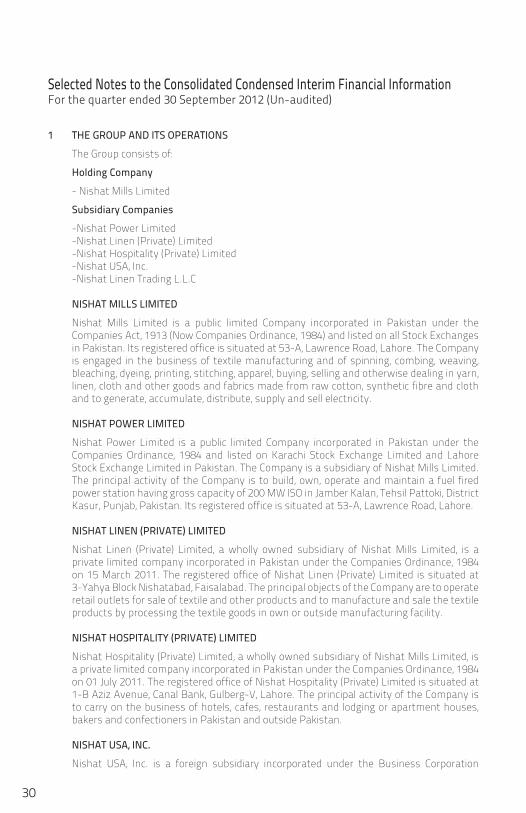
1 THE GROUP AND ITS OPERATIONS
The Group consists of:
Holding Company
- Nishat Mills Limited
Subsidiary Companies
-Nishat Power Limited -Nishat Linen (Private) Limited -Nishat Hospitality (Private) Limited -Nishat USA, Inc. -Nishat Linen Trading L.L.C
NISHAT MILLS LIMITED
Nishat Mills Limited is a public limited Company incorporated in Pakistan under the Companies Act, 1913 (Now Companies Ordinance, 1984) and listed on all Stock Exchanges in Pakistan. Its registered office is situated at 53-A, Lawrence Road, Lahore. The Company is engaged in the business of textile manufacturing and of spinning, combing, weaving, bleaching, dyeing, printing, stitching, apparel, buying, selling and otherwise dealing in yarn, linen, cloth and other goods and fabrics made from raw cotton, synthetic fibre and cloth and to generate, accumulate, distribute, supply and sell electricity.
NISHAT POWER LIMITED
Nishat Power Limited is a public limited Company incorporated in Pakistan under the Companies Ordinance, 1984 and listed on Karachi Stock Exchange Limited and Lahore Stock Exchange Limited in Pakistan. The Company is a subsidiary of Nishat Mills Limited. The principal activity of the Company is to build, own, operate and maintain a fuel fired power station having gross capacity of 200 MW ISO in Jamber Kalan, Tehsil Pattoki, District Kasur, Punjab, Pakistan. Its registered office is situated at 53-A, Lawrence Road, Lahore.
NISHAT LINEN (PRIVATE) LIMITED
Nishat Linen (Private) Limited, a wholly owned subsidiary of Nishat Mills Limited, is a private limited company incorporated in Pakistan under the Companies Ordinance, 1984 on 15 March 2011. The registered office of Nishat Linen (Private) Limited is situated at 3-Yahya Block Nishatabad, Faisalabad. The principal objects of the Company are to operate retail outlets for sale of textile and other products and to manufacture and sale the textile products by processing the textile goods in own or outside manufacturing facility.
NISHAT HOSPITALITY (PRIVATE) LIMITED
Nishat Hospitality (Private) Limited, a wholly owned subsidiary of Nishat Mills Limited, is a private limited company incorporated in Pakistan under the Companies Ordinance, 1984 on 01 July 2011. The registered office of Nishat Hospitality (Private) Limited is situated at 1-B Aziz Avenue, Canal Bank, Gulberg-V, Lahore. The principal activity of the Company is to carry on the business of hotels, cafes, restaurants and lodging or apartment houses, bakers and confectioners in Pakistan and outside Pakistan.
NISHAT USA, INC.
Nishat USA, Inc. is a foreign subsidiary incorporated under the Business Corporation

31
Consolidated Condensed Interim Financial Information for the Quarter ended 30 September 2012
Laws of the State of New York. The registered office of Nishat USA, Inc. is situated at 676 Broadway, New York, NY 10012, U.S.A. The principal business of the Subsidiary Company is to provide marketing services to Nishat Mills Limited - Holding Company. Nishat Mills Limited acquired 100% shareholding of Nishat USA, Inc. on 01 October 2008.
NISHAT LINEN TRADING L.L.C
Nishat Linen Trading L.L.C is a limited liability company formed in pursuance to statutory provisions of the United Arab Emirates (UAE) Federal Law No. (8) of 1984 as amended and registered with the Department of Economic Development, Government of Dubai. Nishat Linen Trading L.L.C is a subsidiary of Nishat Mills Limited as Nishat Mills Limited, through the powers given to it under Article 11 of the Memorandum of Association, exercise full control on the management of Nishat Linen Trading L.L.C. Date of incorporation of the Company was 29 December 2010. The registered office of Nishat Linen Trading L.L.C is situated at P.O. Box 28189 Dubai, UAE. The principal business of the Subsidiary Company is to operate retail outlets in UAE for sale of textile and related products.
2 BASIS OF PREPARATION
This consolidated condensed interim financial information is un-audited and is being submitted to share holders as required by section 245 of the Companies Ordinance, 1984 and the listing regulations of the Islamabad, Karachi and Lahore stock exchanges. This consolidated condensed interim financial information has been prepared in accordance with the requirements of International Accounting Standard-34 (Interim Financial Reporting) and International Accounting Standard-27 (Consolidated and separate financial statements) and provisions of and directives issued under the Companies Ordinance, 1984. In case where requirements differ, the provisions of and directives issued under the Companies Ordinance, 1984 have been followed. This consolidated condensed interim financial information should be read in conjunction with the preceding audited annual published consolidated financial statements of the Group for the year ended 30 June 2012.
3 ACCOUNTING POLICIES
The accounting policies and methods of computations adopted for the preparation of this consolidated condensed interim financial information are the same as applied in the preparation of preceding audited annual published consolidated financial statements of the Group for the year ended 30 June 2012.
4 CONSOLIDATION
a) Subsidiaries
Subsidiaries are those entities in which Holding Company directly or indirectly controls, beneficially owns or holds more than 50% of the voting securities or otherwise has power to elect and appoint more than 50% of its directors. The condensed interim financial information of the subsidiary companies is included in this consolidated condensed interim financial information from the date control commences until the date that control ceases.
The assets and liabilities of Subsidiary Companies have been consolidated on a line by
line basis and carrying value of investments held by the Holding Company is eliminated against Holding Company’s share in paid up capital of the Subsidiary Companies.

32
Un-audited Audited 30 September 30 June 2012 2012 (Rupees in thousand)
6 LONG TERM FINANCING- SECURED
Opening balance 16,936,293 17,104,952 Add: Obtained during the period / year - 1,941,842 Less: Repaid during the period / year 364,973 2,110,501
16,571,320 16,936,293 Less: Current portion shown under current liabilities 2,002,662 1,873,327
14,568,658 15,062,966
Intra-group balances and transactions have been eliminated. Non-controlling interests are that part of net results of the operations and of net assets
of Subsidiary Companies attributable to interest which are not owned by the Holding Company. Non-controlling interests are presented as separate item in this consolidated condensed interim financial information.
b ) Associates
Associates are the entities over which the Group has significant influence but not control, generally accompanying a shareholding of between 20% and 50% of the voting rights. Investments in these associates are accounted for using the equity method of accounting and are initially recognized at cost. The Group’s investment in associate includes goodwill identified on acquisition, net of any accumulated impairment loss, if any.
The Group’s share of its associates’ post-acquisition profits or losses, movement in other comprehensive income, and its share of post-acquisition movements in reserves is recognized in the consolidated profit and loss account, consolidated statement of comprehensive income and reserves respectively. The cumulative post-acquisition movements are adjusted against the carrying amount of the investment. Distributions received from an associate reduce the carrying amount of the investment.
5 CRITICAL ACCOUNTING ESTIMATES AND JUDGEMENTS
The preparation of this consolidated condensed interim financial information in conformity with the approved accounting standards requires the use of certain critical accounting estimates. It also requires the management to exercise its judgment in the process of applying accounting policies. Estimates and judgments are continually evaluated and are based on historical experience and other factors, including expectations of future events that are believed to be reasonable under the circumstances.
During preparation of this consolidated condensed interim financial information, the
significant judgments made by the management in applying the accounting policies and the key sources of estimation and uncertainty were the same as those that applied in the preceding audited annual published consolidated financial statements of the Group for the year ended 30 June 2012.
Selected Notes to the Consolidated Condensed Interim Financial InformationFor the quarter ended 30 September 2012 (Un-audited)
33
Consolidated Condensed Interim Financial Information for the Quarter ended 30 September 2012
Un-audited Audited 30 September 30 June 2012 2012 (Rupees in thousand)
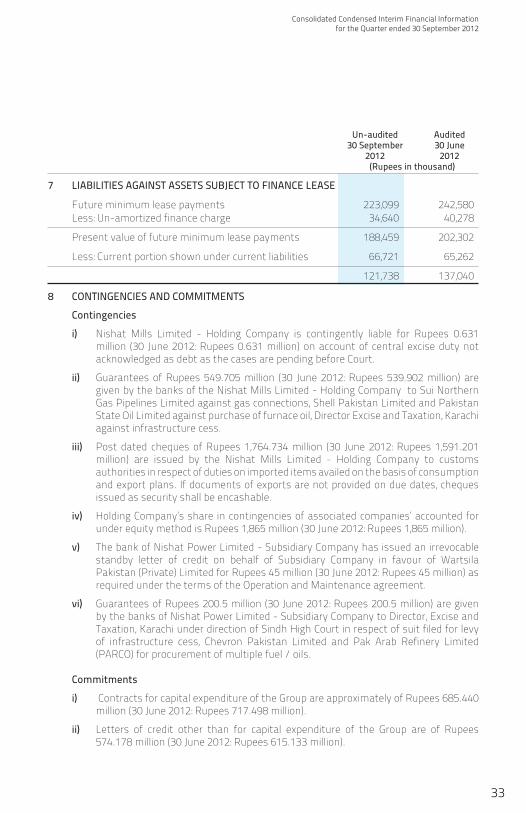
7 LIABILITIES AGAINST ASSETS SUBJECT TO FINANCE LEASE
Future minimum lease payments 223,099 242,580 Less: Un-amortized finance charge 34,640 40,278
Present value of future minimum lease payments 188,459 202,302
Less: Current portion shown under current liabilities 66,721 65,262
121,738 137,040
8 CONTINGENCIES AND COMMITMENTS
Contingencies
i) Nishat Mills Limited - Holding Company is contingently liable for Rupees 0.631 million (30 June 2012: Rupees 0.631 million) on account of central excise duty not acknowledged as debt as the cases are pending before Court.
ii) Guarantees of Rupees 549.705 million (30 June 2012: Rupees 539.902 million) are given by the banks of the Nishat Mills Limited - Holding Company to Sui Northern Gas Pipelines Limited against gas connections, Shell Pakistan Limited and Pakistan State Oil Limited against purchase of furnace oil, Director Excise and Taxation, Karachi against infrastructure cess.
iii) Post dated cheques of Rupees 1,764.734 million (30 June 2012: Rupees 1,591.201 million) are issued by the Nishat Mills Limited - Holding Company to customs authorities in respect of duties on imported items availed on the basis of consumption and export plans. If documents of exports are not provided on due dates, cheques issued as security shall be encashable.
iv) Holding Company’s share in contingencies of associated companies’ accounted for under equity method is Rupees 1,865 million (30 June 2012: Rupees 1,865 million).
v) The bank of Nishat Power Limited - Subsidiary Company has issued an irrevocable standby letter of credit on behalf of Subsidiary Company in favour of Wartsila Pakistan (Private) Limited for Rupees 45 million (30 June 2012: Rupees 45 million) as required under the terms of the Operation and Maintenance agreement.
vi) Guarantees of Rupees 200.5 million (30 June 2012: Rupees 200.5 million) are given by the banks of Nishat Power Limited - Subsidiary Company to Director, Excise and Taxation, Karachi under direction of Sindh High Court in respect of suit filed for levy of infrastructure cess, Chevron Pakistan Limited and Pak Arab Refinery Limited (PARCO) for procurement of multiple fuel / oils.
Commitments
i) Contracts for capital expenditure of the Group are approximately of Rupees 685.440 million (30 June 2012: Rupees 717.498 million).
ii) Letters of credit other than for capital expenditure of the Group are of Rupees 574.178 million (30 June 2012: Rupees 615.133 million).

34
iv) The amount of future payments under operating lease and the period in which these payments will become due from Nishat Power Limited - Subsidiary Company are as follows:
Un-audited Audited 30 September 30 June 2012 2012 (Rupees in thousand)
Not later than one year 12,461 12,461 Later than one year and not later than five years 49,846 49,846
62,307 62,307
v) Nishat Power Limited - Subsidiary Company has entered into a contract for purchase of fuel oil from Shell Pakistan Limited (‘SPL’) for a period of ten years starting from the commercial operations date of the power station i.e. 09 June 2010. Under the terms of the Fuel Supply Agreement, the Subsidiary Company is not required to buy any minimum quantity of oil from SPL.
vi) Nishat Power Limited - Subsidiary Company has also entered into an agreement with Wartsila Pakistan (Private) Limited for the operations and maintenance (O&M) of the power station for a five years period starting from the commercial operations date of the power station i.e. 09 June 2010. Under the terms of the O&M agreement, the Subsidiary Company is required to pay a monthly fixed O&M fee and a variable O&M fee depending on the net electrical output, both of which are adjustable according to the Wholesale Price Index.
9 PROPERTY, PLANT AND EQUIPMENT Un-audited Audited 30 September 30 June 2012 2012 Note (Rupees in thousand)
Operating fixed assets Owned 9.1 27,052,584 27,187,410 Leased 9.2 242,580 246,378 Capital work in progress 9.3 2,161,058 2,035,834
29,456,222 29,469,622
9.1 Operating fixed assets- Owned
Opening book value 27,187,410 27,938,481 Add: Cost of additions during the period/year 9.1.1 438,885 1,660,414 Less: Book value of assets transferred to investment properties during the year - 120,279
27,626,295 29,478,616 Less: Book value of deletions during the period/year 9.1.2 9,805 84,475
27,616,490 29,394,141 Less: Depreciation charged for the period/year 564,057 2,208,415 Add: Currency translation 151 1,684
27,052,584 27,187,410
Selected Notes to the Consolidated Condensed Interim Financial InformationFor the quarter ended 30 September 2012 (Un-audited)

35
Consolidated Condensed Interim Financial Information for the Quarter ended 30 September 2012
Un-audited Audited 30 September 30 June 2012 2012 (Rupees in thousand)
9.1.1 Cost of additions
Freehold land - 44,433 Buildings on freehold land - 415,550 Plant and machinery 416,652 1,028,748 Electric installations 999 19,098 Factory equipment 12,911 30,193 Furniture, fixtures and office equipment 3,129 28,632 Computer equipment 1,923 9,023 Vehicles 3,271 84,737
438,885 1,660,414 9.1.2 Book value of deletions
Plant and machinery 8,233 66,579 Factory equipment 3 - Furniture, fixtures and office equipment - 431 Computer equipment - 65 Vehicles 1,569 17,400
9,805 84,475
9.2 Operating fixed assets- Leased
Opening book value 246,378 273,105 Add: Addition during the period 2,320 - Less: Depreciation charged during the period / year 6,118 26,727
242,580 246,378 9.3 Capital work-in-progress
Buildings on freehold land 988,625 735,805 Plant and machinery 1,077,963 1,246,125 Electric installations - 912 Unallocated expenses 52,893 34,079 Letters of credit against machinery 1,053 1,048 Advances against furniture and office equipment 212 448 Advances against vehicles 14,794 5,773 Advances to contractors 25,518 11,644
2,161,058 2,035,834
36
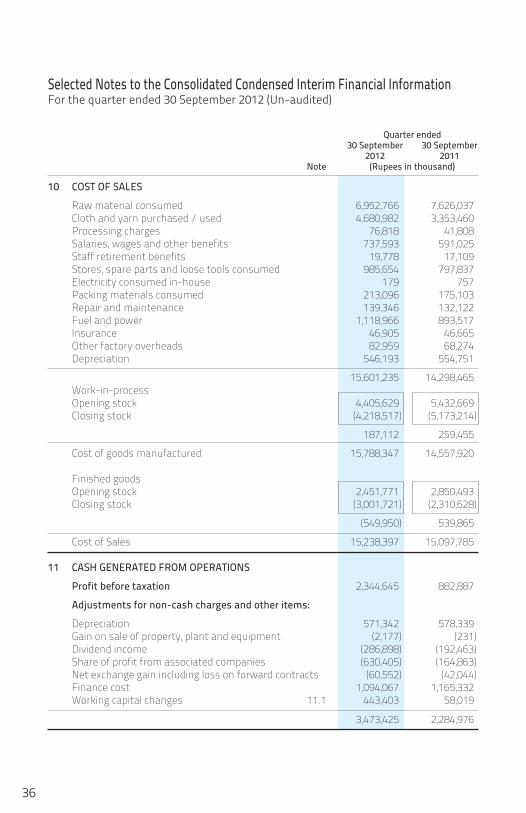
Quarter ended 30 September 30 September 2012 2011 Note (Rupees in thousand)
10 COST OF SALES
Raw material consumed 6,952,766 7,626,037 Cloth and yarn purchased / used 4,680,982 3,353,460 Processing charges 76,818 41,808 Salaries, wages and other benefits 737,593 591,025 Staff retirement benefits 19,778 17,109 Stores, spare parts and loose tools consumed 985,654 797,837 Electricity consumed in-house 179 757 Packing materials consumed 213,096 175,103 Repair and maintenance 139,346 132,122 Fuel and power 1,118,966 893,517 Insurance 46,905 46,665 Other factory overheads 82,959 68,274 Depreciation 546,193 554,751
15,601,235 14,298,465 Work-in-process Opening stock 4,405,629 5,432,669 Closing stock (4,218,517) (5,173,214)
187,112 259,455
Cost of goods manufactured 15,788,347 14,557,920 Finished goods Opening stock 2,451,771 2,850,493 Closing stock (3,001,721) (2,310,628)
(549,950) 539,865
Cost of Sales 15,238,397 15,097,785 11 CASH GENERATED FROM OPERATIONS
Profit before taxation 2,344,645 882,887
Adjustments for non-cash charges and other items:
Depreciation 571,342 578,339 Gain on sale of property, plant and equipment (2,177) (231) Dividend income (286,898) (192,463) Share of profit from associated companies (630,405) (164,863) Net exchange gain including loss on forward contracts (60,552) (42,044) Finance cost 1,094,067 1,165,332 Working capital changes 11.1 443,403 58,019
3,473,425 2,284,976
Selected Notes to the Consolidated Condensed Interim Financial InformationFor the quarter ended 30 September 2012 (Un-audited)
37
Consolidated Condensed Interim Financial Information for the Quarter ended 30 September 2012
Quarter ended 30 September 30 September 2012 2011 (Rupees in thousand)
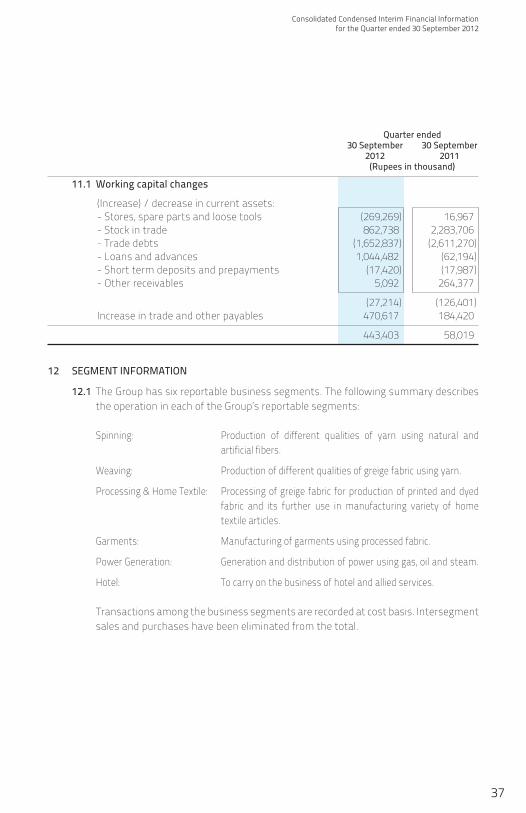
11.1 Working capital changes
(Increase) / decrease in current assets: - Stores, spare parts and loose tools (269,269) 16,967 - Stock in trade 862,738 2,283,706 - Trade debts (1,652,837) (2,611,270) - Loans and advances 1,044,482 (62,194) - Short term deposits and prepayments (17,420) (17,987) - Other receivables 5,092 264,377
(27,214) (126,401) Increase in trade and other payables 470,617 184,420
443,403 58,019
12 SEGMENT INFORMATION
12.1 The Group has six reportable business segments. The following summary describes the operation in each of the Group’s reportable segments:
Spinning: Production of different qualities of yarn using natural and artificial fibers.
Weaving: Production of different qualities of greige fabric using yarn.
Processing & Home Textile: Processing of greige fabric for production of printed and dyed fabric and its further use in manufacturing variety of home textile articles.
Garments: Manufacturing of garments using processed fabric.
Power Generation: Generation and distribution of power using gas, oil and steam.
Hotel: To carry on the business of hotel and allied services. Transactions among the business segments are recorded at cost basis. Intersegment
sales and purchases have been eliminated from the total.

38
Sales
Ex
tern
al 3,6
08,21
8 3,
240,9
73
2,67
3,068
2,
679,2
02
5,18
4,502
4,
228,1
08
1,36
2,147
1,
080,3
37
5,75
6,495
6,
273,6
67
5,66
5 -
-
-
18
,590,0
95
17,50
2,287
Int
erse
gmen
t 79
7,507
97
1,697
1,
649,6
63
1,58
5,084
19
4,913
14
2,917
-
7
1,
069,9
99
884,5
44
-
-
(3,71
2,082
) (3
,584,2
49)
-
-
4,
405,7
25
4,21
2,670
4,
322,7
31
4,26
4,286
5,
379,4
15
4,37
1,025
1,
362,1
47
1,08
0,344
6,
826,4
94
7,15
8,211
5,
665
-
(3,71
2,082
) (3
,584,2
49)
18,59
0,095
17
,502,2
87
Cost
of sa
les
(3,74
0,130
) (4
,047,0
16)
(3,92
6,186
) (3
,978,7
48)
(4,56
1,187
) (3
,805,7
09)
(1,09
8,513
) (8
87,15
4) (5
,622,1
07)
(5,96
3,407
) (2
,356)
-
3,71
2,082
3,
584,2
49
(15,2
38,39
7) (1
5,097
,785)
Gros
s pro
fit
665,5
95
165,6
54
396,5
45
285,5
38
818,2
28
565,3
16
263,6
34
193,1
90
1,20
4,387
1,
194,8
04
3,30
9 -
-
-
3,
351,6
98
2,40
4,502
Di
strib
ution
cost
(8
2,472
) (8
9,115
) (1
38,84
5) (1
31,76
5) (3
54,87
2) (2
54,32
7) (9
4,913
) (6
1,864
) (5
55)
-
-
-
-
-
(671
,657)
(537
,071)
Adm
inist
rativ
e exp
ense
s (5
8,217
) (5
1,274
) (4
8,639
) (4
8,168
) (1
01,49
3) (7
2,377
) (1
8,244
) (1
4,437
) (3
6,549
) (2
5,201
) (7
74)
-
-
-
(263
,916)
(211
,457)
(1
40,68
9) (1
40,38
9) (1
87,48
4) (1
79,93
3) (4
56,36
5) (3
26,70
4) (1
13,15
7) (7
6,301
) (3
7,104
) (2
5,201
) (7
74)
-
-
-
(935
,573)
(748
,528)
Prof
it bef
ore t
axat
ion an
d u
nallo
cate
d inc
ome a
nd ex
pens
es
524,9
06
25,26
5 20
9,061
10
5,605
36
1,863
23
8,612
15
0,477
11
6,889
1,
167,2
83
1,16
9,603
2,
535
-
-
-
2,41
6,125
1,
655,9
74
Unall
ocat
ed in
come
and e
xpen
ses:
Othe
r ope
ratin
g exp
ense
s
(6
5,004
) (9
5,295
)Ot
her o
pera
ting i
ncom
e
45
7,186
32
2,677
Fin
ance
cost
(1
,094,0
67)
(1,16
5,332
)Sh
are o
f pro
fit fr
om as
socia
ted c
ompa
nies
630,4
05
164,8
63
Taxa
tion
(140
,448)
(218
,351)
Pr
ofit a
fter t
axat
ion
2,20
4,197
66
4,536
12.2
12.3
Reco
ncilia
tion o
f rep
orta
ble se
gmen
t ass
ets
Tota
l ass
ets f
or re
porta
ble se
gmen
ts
7,
862,2
02
8,31
8,490
5,
582,3
59
5,07
2,193
11
,164,7
72
10,03
4,118
2,
019,6
91
2,29
0,564
30
,115,0
91
31,38
3,994
26
3,410
21
8,040
57
,007,5
25
57,31
7,399
Un
alloc
ated
asse
ts:
Long
term
inve
stm
ents
32
,429,3
39
29,85
3,657
Ot
her r
eceiv
ables
98
8,658
96
9,638
Ca
sh an
d ban
k bala
nces
2,
644,7
65
2,50
0,666
Ot
her c
orpo
rate
asse
ts
2,885
,959
2,33
0,177
Tota
l ass
ets a
s per
balan
ce sh
eet
95,95
6,246
92
,971,5
37
Spinn
ing
Wea
ving
Proc
essin
g &
Garm
ents
Po
wer G
ener
ation
Ho
tel
Elim
inatio
n of in
ter-
To
tal-
Grou
p
Ho
me T
extil
e
segm
ent t
rans
actio
ns
Quar
ter e
nded
Qu
arte
r end
ed
Quar
ter e
nded
Qu
arte
r end
ed
Quar
ter e
nded
Qu
arte
r end
ed
Quar
ter e
nded
Qu
arte
r end
ed
Sep 2
012
Sep 2
011
Sep 2
012
Sep 2
011
Sep 2
012
Sep 2
011
Sep 2
012
Sep 2
011
Sep 2
012
Sep 2
011
Sep 2
012
Sep 2
011
Sep 2
012
Sep 2
011
Sep 2
012
Sep 2
011
(Rup
ees i
n tho
usan
d)
Sp
inning
W
eavin
g Pr
oces
sing &
Ga
rmen
ts
Powe
r Gen
erat
ion
Hote
l To
tal-
Grou
p
Hom
e Tex
tile
Un-a
udite
d Au
dited
Un
-aud
ited
Audit
ed
Un-a
udite
d Au
dited
Un
-aud
ited
Audit
ed
Un-a
udite
d Au
dited
Un
-aud
ited
Audit
ed
Un-a
udite
d Au
dited
Sep 2
012
Jun 2
012
Sep 2
012
Jun 2
012
Sep 2
012
Jun 2
012
Sep 2
012
Jun 2
012
Sep 2
012
Jun 2
012
Sep 2
012
Jun 2
012
Sep 2
012
Jun 2
012
(Rup
ees i
n tho
usan
d)
Selected Notes to the Consolidated Condensed Interim Financial InformationFor the quarter ended 30 September 2012 (Un-audited)
(Un-
audit
ed)

39
Consolidated Condensed Interim Financial Information for the Quarter ended 30 September 2012
13 EARNINGS PER SHARE - BASIC AND DILUTED
There is no dilutive effect on the basic earnings per share. 14 TRANSACTIONS WITH RELATED PARTIES
The related parties comprise associated undertakings, other related companies, key management personnel and provident fund trust. The Group in the normal course of business carries out transactions with various related parties. Detail of transactions with related parties are as follows:
Quarter ended 30 September 30 September 2012 2011 (Rupees in thousand)
Associated companies
Purchase of goods and services 3,176 15,289 Sale of goods and services 63 236 Rental income 53 2,147 Sale of operating fixed assets 1,327 - Insurance premium paid 44,919 99,517 Insurance claim received 4,291 3,467 Profit on term deposit receipt 7,980 - Subscription paid 1,250 1,000 Other related parties
Purchase of goods and services 4,954 - Sale of goods and services 25,845 1,095 Group’s contribution to provident fund trust 28,815 24,939 Remuneration paid to Chief Executive Officer, Directors and Executives of the Holding Company 123,469 83,099

40
15 FINANCIAL RISK MANAGEMENT
The Group’s financial risk management objectives and policies are consistent with those disclosed in the preceding audited annual published financial statements of the Group for the year ended 30 June 2012.
16 DATE OF AUTHORIZATION FOR ISSUE
This consolidated condensed interim financial information was approved by the Board of Directors and authorized for issue on 25 October 2012.
17 CORRESPONDING FIGURES
Corresponding figures have been re-arranged, wherever necessary, for the purpose of comparison. However, no significant re-arrangements have been made.
18 GENERAL
Figures have been rounded off to the nearest thousand of Rupees unless otherwise stated.
Selected Notes to the Consolidated Condensed Interim Financial InformationFor the quarter ended 30 September 2012 (Un-audited)
Chief Executive Officer Director


Nishat Mills LimitedHead Office:7, Main Gulberg, Lahore.Tel: 042-35716351-59, 042-111 332 200Fax: 042-35716349-50E-mail: [email protected]
www.nishatmillsltd.com
Printing by VANTAGE - www.vantageprinters.com