drawing on your knowledge with visirule
TRANSCRIPT
RULE-BASED SYSTEMS HAVE BEENaround for a long time without breakingthrough to mainstream computing. Rule-based systems represent knowledge interms of a bunch of if-then rules, abunch of facts, and some interpretercontrolling the application of the rules,given the facts. One reason for theirlack of success is that they have beenlargely text-based systems that oftenrequire specialist rule authors. Decisiontrees are useful for capturing structureddecision-making processes. Thisapproach is useful for troubleshootingand configuration applications. The
knowledge for these applications isoften structured into a set of steps anddecision points. Binary decision treeshave been used to build predictivemodels for target variables and can beautomatically constructed from data sets.However, automatic construction is datadependent (i.e., the order of the splits isdependent on the order in which thedata is analyzed), and the tree does notallow loop back nor convergence.
VISIRULEVisiRule is a graphical tool devel-
oped by Logic Programming Associates,
Ltd. and first released in 2005 that letsyou draw decision charts and executethem in situ. The main constructs inVisiRule are nodes that represent ques-tions and/or computable functions andexpressions that guard the variouspaths through the network. You candivide your problem domain into multi-ple files each containing one or morecharts. Charts can have continuationnodes to support modularity and scala-bility. VisiRule generates code in theform of Flex rules (LPA’s expert systemproduct) that can be executed, inspect-ed, and exported for embedding inexternal applications. Charts can beexported as Windows Metafiles (WMF)for usage within other common desk-top applications such as Word.
VisiRule is not designed to automati-cally construct visual models or exe-cutable code from data, rather it is atool that allows experts to build decisionmodels using a graphical paradigm, likeMindMap, but one that can be annotat-ed using code and or Boolean logic andthen executed and exported to otherprograms and processes.
People have argued that decisiontrees and decision tables do offer amore practical way of representingknowledge than text-based ruleswhere the amount of text canobscure the structure and interrela-t ionships inherent in the rules .Indeed, some business rule vendorsnow offer limited support for thesewithin their systems.
No doubt, decision tables can provevery compact and familiar structures towork with (especially for those of uswith an Excel inclination), but in thisarticle, we examine how decision chartsoffer a richer and more appropriate for-mat. Only by using a graphical para-digm can we hope to retain and re-usethe structuring information required tounderstand, navigate, and maintaincomplex rule bases.
COMPANY LOAN EXAMPLELet ’s consider the process of
whether or not to grant an employeea company loan. We can start with a
0278-6648/07/$25.00 © 2007 IEEE20 IEEE POTENTIALS
© EYEWIRE
Drawing on your knowledge with VisiRule
CLIVE SPENSER
Table 1. Simple set of rules.
If Full time = yes and Over4yrs = yes then answer = Grant LoanIf Full time = yes and Over4yrs = no then answer = UnclearIf Full time = no and Over4yrs = yes then answer = UnclearIf Full time = no and Over4yrs = no then answer = No Loan
Table 2. Initial decision table.
Full time yes yes no noOver4yrs yes no yes no
Grant Unclear Unclear No Loan Loan
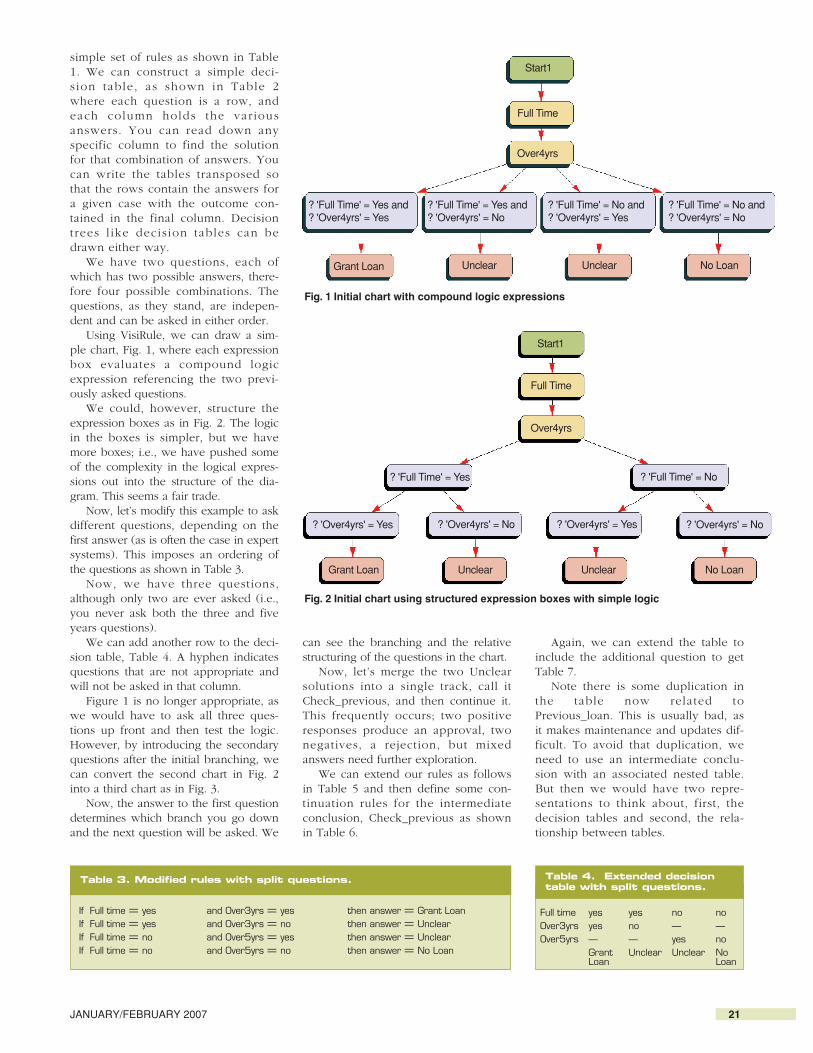
simple set of rules as shown in Table1. We can construct a simple deci-s ion table , as shown in Table 2where each question is a row, andeach column holds the var iousanswers. You can read down anyspecific column to find the solutionfor that combination of answers. Youcan write the tables transposed sothat the rows contain the answers fora given case with the outcome con-tained in the final column. Decisiontrees l ike decis ion tables can bedrawn either way.
We have two questions, each ofwhich has two possible answers, there-fore four possible combinations. Thequestions, as they stand, are indepen-dent and can be asked in either order.
Using VisiRule, we can draw a sim-ple chart, Fig. 1, where each expressionbox evaluates a compound logicexpression referencing the two previ-ously asked questions.
We could, however, structure theexpression boxes as in Fig. 2. The logicin the boxes is simpler, but we havemore boxes; i.e., we have pushed someof the complexity in the logical expres-sions out into the structure of the dia-gram. This seems a fair trade.
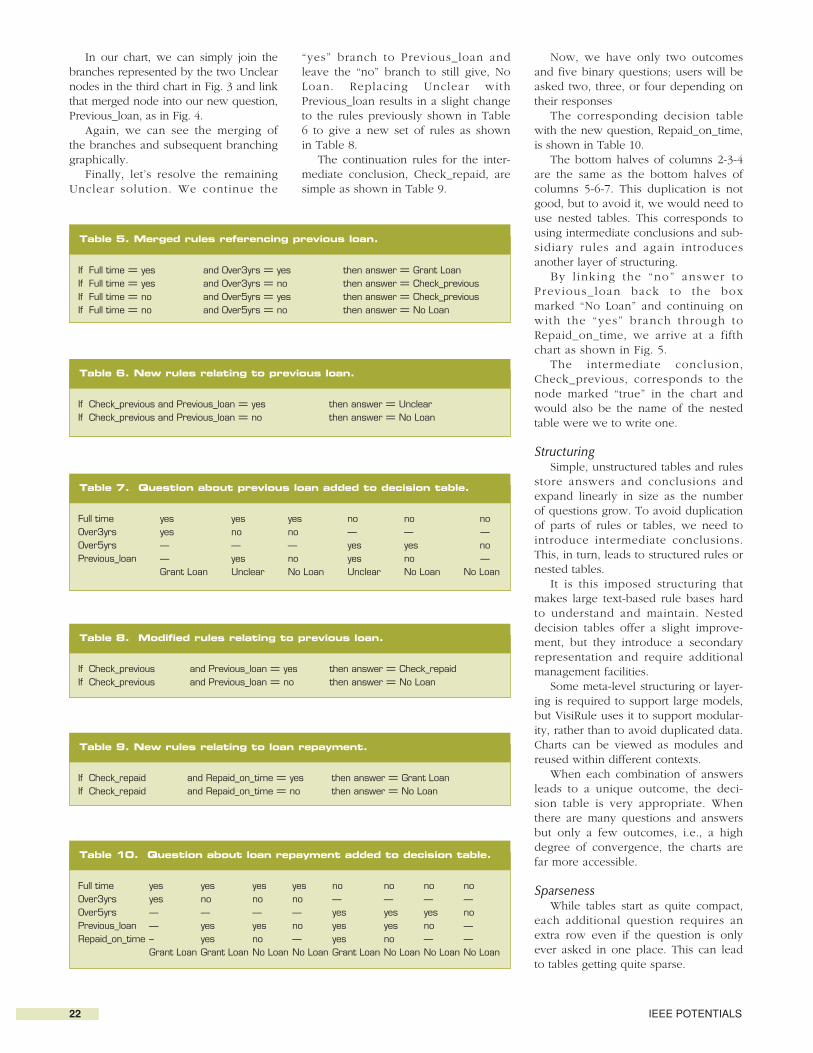
Now, let’s modify this example to askdifferent questions, depending on thefirst answer (as is often the case in expertsystems). This imposes an ordering ofthe questions as shown in Table 3.
Now, we have three questions,although only two are ever asked (i.e.,you never ask both the three and fiveyears questions).
We can add another row to the deci-sion table, Table 4. A hyphen indicatesquestions that are not appropriate andwill not be asked in that column.
Figure 1 is no longer appropriate, aswe would have to ask all three ques-tions up front and then test the logic.However, by introducing the secondaryquestions after the initial branching, wecan convert the second chart in Fig. 2into a third chart as in Fig. 3.
Now, the answer to the first questiondetermines which branch you go downand the next question will be asked. We
can see the branching and the relativestructuring of the questions in the chart.
Now, let’s merge the two Unclearsolutions into a single track, call itCheck_previous, and then continue it.This frequently occurs; two positiveresponses produce an approval, twonegatives, a rejection, but mixedanswers need further exploration.
We can extend our rules as followsin Table 5 and then define some con-tinuation rules for the intermediateconclusion, Check_previous as shownin Table 6.
Again, we can extend the table toinclude the additional question to getTable 7.
Note there is some duplication inthe table now related toPrevious_loan. This is usually bad, asit makes maintenance and updates dif-ficult. To avoid that duplication, weneed to use an intermediate conclu-sion with an associated nested table.But then we would have two repre-sentations to think about, first, thedecision tables and second, the rela-tionship between tables.
JANUARY/FEBRUARY 2007 21
Table 3. Modified rules with split questions.
If Full time = yes and Over3yrs = yes then answer = Grant Loan If Full time = yes and Over3yrs = no then answer = Unclear If Full time = no and Over5yrs = yes then answer = Unclear If Full time = no and Over5yrs = no then answer = No Loan
Start1
Full Time
Over4yrs
? 'Full Time' = Yes and? 'Over4yrs' = Yes
? 'Full Time' = Yes and? 'Over4yrs' = No
? 'Full Time' = No and? 'Over4yrs' = Yes
? 'Full Time' = No and? 'Over4yrs' = No
No LoanUnclearUnclearGrant Loan
Fig. 1 Initial chart with compound logic expressions
Start1
Full Time
Over4yrs
? 'Over4yrs' = Yes ? 'Over4yrs' = Yes
? 'Full Time' = Yes ? 'Full Time' = No
? 'Over4yrs' = No ? 'Over4yrs' = No
No LoanUnclearUnclearGrant Loan
Table 4. Extended decisiontable with split questions.
Full time yes yes no no Over3yrs yes no — —Over5yrs — — yes no
Grant Unclear Unclear No Loan Loan
Fig. 2 Initial chart using structured expression boxes with simple logic
22 IEEE POTENTIALS
In our chart, we can simply join thebranches represented by the two Unclearnodes in the third chart in Fig. 3 and linkthat merged node into our new question,Previous_loan, as in Fig. 4.
Again, we can see the merging ofthe branches and subsequent branchinggraphically.
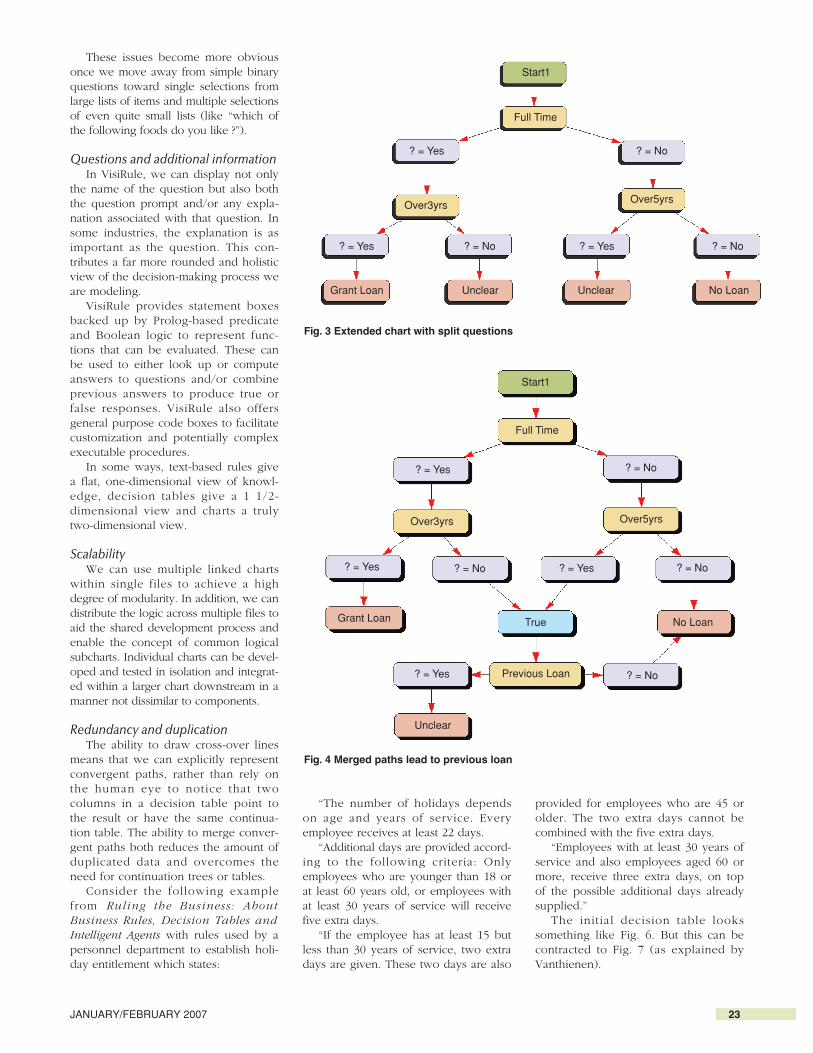
Finally, let’s resolve the remainingUnclear solution. We continue the
“yes” branch to Previous_loan andleave the “no” branch to still give, NoLoan. Replacing Unclear withPrevious_loan results in a slight changeto the rules previously shown in Table6 to give a new set of rules as shownin Table 8.
The continuation rules for the inter-mediate conclusion, Check_repaid, aresimple as shown in Table 9.
Now, we have only two outcomesand five binary questions; users will beasked two, three, or four depending ontheir responses
The corresponding decision tablewith the new question, Repaid_on_time,is shown in Table 10.
The bottom halves of columns 2-3-4are the same as the bottom halves ofcolumns 5-6-7. This duplication is notgood, but to avoid it, we would need touse nested tables. This corresponds tousing intermediate conclusions and sub-sidiary rules and again introducesanother layer of structuring.
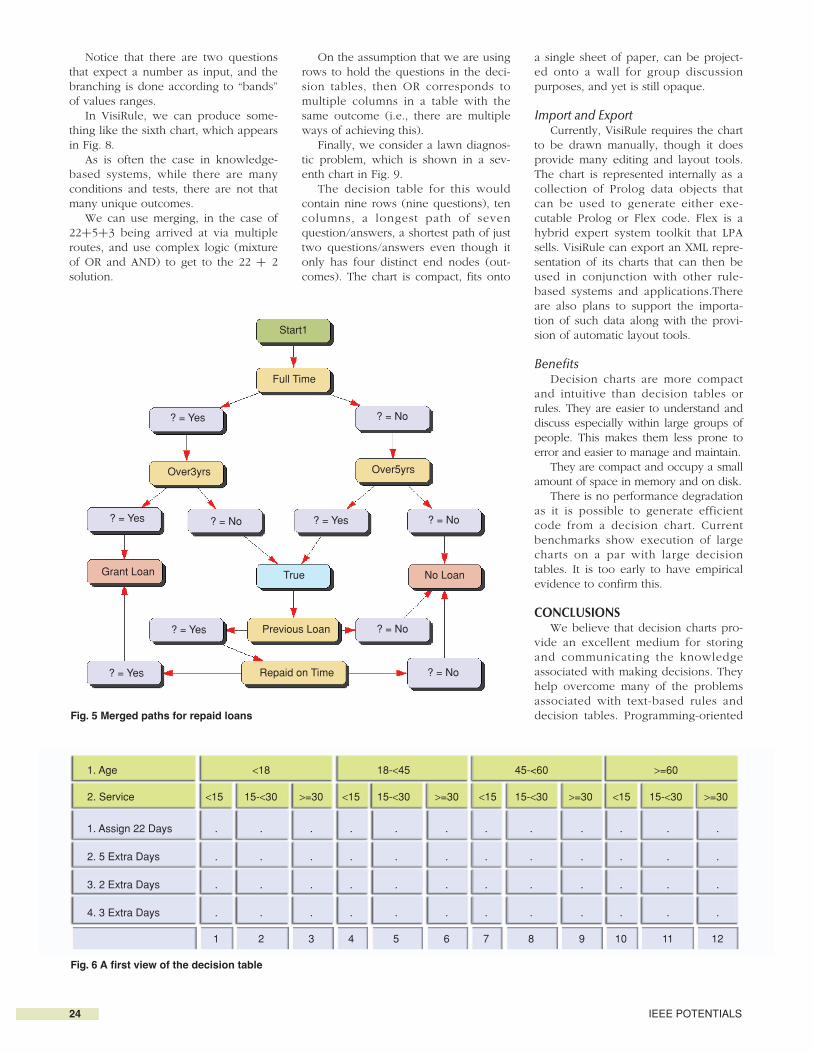
By l inking the “no” answer toPrevious_loan back to the boxmarked “No Loan” and continuing onwith the “yes” branch through toRepaid_on_time, we arrive at a fifthchart as shown in Fig. 5.
The intermediate conclusion,Check_previous, corresponds to thenode marked “true” in the chart andwould also be the name of the nestedtable were we to write one.
StructuringSimple, unstructured tables and rules
store answers and conclusions andexpand linearly in size as the numberof questions grow. To avoid duplicationof parts of rules or tables, we need tointroduce intermediate conclusions.This, in turn, leads to structured rules ornested tables.
It is this imposed structuring thatmakes large text-based rule bases hardto understand and maintain. Nesteddecision tables offer a slight improve-ment, but they introduce a secondaryrepresentation and require additionalmanagement facilities.
Some meta-level structuring or layer-ing is required to support large models,but VisiRule uses it to support modular-ity, rather than to avoid duplicated data.Charts can be viewed as modules andreused within different contexts.
When each combination of answersleads to a unique outcome, the deci-sion table is very appropriate. Whenthere are many questions and answersbut only a few outcomes, i.e., a highdegree of convergence, the charts arefar more accessible.
SparsenessWhile tables start as quite compact,
each additional question requires anextra row even if the question is onlyever asked in one place. This can leadto tables getting quite sparse.
Table 7. Question about previous loan added to decision table.
Full time yes yes yes no no noOver3yrs yes no no — — —Over5yrs — — — yes yes noPrevious_loan — yes no yes no —
Grant Loan Unclear No Loan Unclear No Loan No Loan
Table 10. Question about loan repayment added to decision table.
Full time yes yes yes yes no no no noOver3yrs yes no no no — — — —Over5yrs — — — — yes yes yes noPrevious_loan — yes yes no yes yes no —Repaid_on_time – yes no — yes no — —
Grant Loan Grant Loan No Loan No Loan Grant Loan No Loan No Loan No Loan
Table 8. Modified rules relating to previous loan.
If Check_previous and Previous_loan = yes then answer = Check_repaidIf Check_previous and Previous_loan = no then answer = No Loan
Table 9. New rules relating to loan repayment.
If Check_repaid and Repaid_on_time = yes then answer = Grant LoanIf Check_repaid and Repaid_on_time = no then answer = No Loan
Table 5. Merged rules referencing previous loan.
If Full time = yes and Over3yrs = yes then answer = Grant Loan If Full time = yes and Over3yrs = no then answer = Check_previous If Full time = no and Over5yrs = yes then answer = Check_previousIf Full time = no and Over5yrs = no then answer = No Loan
Table 6. New rules relating to previous loan.
If Check_previous and Previous_loan = yes then answer = UnclearIf Check_previous and Previous_loan = no then answer = No Loan
These issues become more obviousonce we move away from simple binaryquestions toward single selections fromlarge lists of items and multiple selectionsof even quite small lists (like “which ofthe following foods do you like ?”).
Questions and additional informationIn VisiRule, we can display not only
the name of the question but also boththe question prompt and/or any expla-nation associated with that question. Insome industries, the explanation is asimportant as the question. This con-tributes a far more rounded and holisticview of the decision-making process weare modeling.
VisiRule provides statement boxesbacked up by Prolog-based predicateand Boolean logic to represent func-tions that can be evaluated. These canbe used to either look up or computeanswers to questions and/or combineprevious answers to produce true orfalse responses. VisiRule also offersgeneral purpose code boxes to facilitatecustomization and potentially complexexecutable procedures.
In some ways, text-based rules givea flat, one-dimensional view of knowl-edge, decision tables give a 1 1/2-dimensional view and charts a trulytwo-dimensional view.
ScalabilityWe can use multiple linked charts
within single files to achieve a highdegree of modularity. In addition, we candistribute the logic across multiple files toaid the shared development process andenable the concept of common logicalsubcharts. Individual charts can be devel-oped and tested in isolation and integrat-ed within a larger chart downstream in amanner not dissimilar to components.
Redundancy and duplicationThe ability to draw cross-over lines
means that we can explicitly representconvergent paths, rather than rely onthe human eye to notice that twocolumns in a decision table point tothe result or have the same continua-tion table. The ability to merge conver-gent paths both reduces the amount ofduplicated data and overcomes theneed for continuation trees or tables.
Consider the following examplefrom Ruling the Business: AboutBusiness Rules, Decision Tables andIntelligent Agents with rules used by apersonnel department to establish holi-day entitlement which states:
“The number of holidays dependson age and years of service. Everyemployee receives at least 22 days.
“Additional days are provided accord-ing to the following criteria: Onlyemployees who are younger than 18 orat least 60 years old, or employees withat least 30 years of service will receivefive extra days.
“If the employee has at least 15 butless than 30 years of service, two extradays are given. These two days are also
provided for employees who are 45 orolder. The two extra days cannot becombined with the five extra days.
“Employees with at least 30 years ofservice and also employees aged 60 ormore, receive three extra days, on top of the possible additional days alreadysupplied.”
The initial decision table lookssomething like Fig. 6. But this can becontracted to Fig. 7 (as explained byVanthienen).
JANUARY/FEBRUARY 2007 23
Fig. 3 Extended chart with split questions
Start1
Full Time
? = Yes
Over3yrs Over5yrs
? = Yes
Grant Loan No LoanUnclear Unclear
? = Yes? = No
? = No
? = No
Fig. 4 Merged paths lead to previous loan
Start1
Full Time
? = No
? = No ? = No
? = No
No LoanTrue
Previous Loan
Unclear
Grant Loan
? = Yes
? = Yes ? = Yes
? = Yes
Over3yrs Over5yrs
24 IEEE POTENTIALS
Notice that there are two questionsthat expect a number as input, and thebranching is done according to “bands”of values ranges.
In VisiRule, we can produce some-thing like the sixth chart, which appearsin Fig. 8.
As is often the case in knowledge-based systems, while there are manyconditions and tests, there are not thatmany unique outcomes.
We can use merging, in the case of22+5+3 being arrived at via multipleroutes, and use complex logic (mixtureof OR and AND) to get to the 22 + 2solution.
On the assumption that we are usingrows to hold the questions in the deci-sion tables, then OR corresponds tomultiple columns in a table with thesame outcome (i.e., there are multipleways of achieving this).
Finally, we consider a lawn diagnos-tic problem, which is shown in a sev-enth chart in Fig. 9.
The decision table for this wouldcontain nine rows (nine questions), tencolumns, a longest path of sevenquestion/answers, a shortest path of justtwo questions/answers even though itonly has four distinct end nodes (out-comes). The chart is compact, fits onto
a single sheet of paper, can be project-ed onto a wall for group discussionpurposes, and yet is still opaque.
Import and ExportCurrently, VisiRule requires the chart
to be drawn manually, though it doesprovide many editing and layout tools.The chart is represented internally as acollection of Prolog data objects thatcan be used to generate either exe-cutable Prolog or Flex code. Flex is ahybrid expert system toolkit that LPAsells. VisiRule can export an XML repre-sentation of its charts that can then beused in conjunction with other rule-based systems and applications.Thereare also plans to support the importa-tion of such data along with the provi-sion of automatic layout tools.
BenefitsDecision charts are more compact
and intuitive than decision tables orrules. They are easier to understand anddiscuss especially within large groups ofpeople. This makes them less prone toerror and easier to manage and maintain.
They are compact and occupy a smallamount of space in memory and on disk.
There is no performance degradationas it is possible to generate efficientcode from a decision chart. Currentbenchmarks show execution of largecharts on a par with large decisiontables. It is too early to have empiricalevidence to confirm this.
CONCLUSIONSWe believe that decision charts pro-
vide an excellent medium for storingand communicating the knowledgeassociated with making decisions. Theyhelp overcome many of the problemsassociated with text-based rules anddecision tables. Programming-oriented
Fig. 6 A first view of the decision table
1. Age <18
<15
18-<45
15-<30 >=30 <15 15-<30 >=30 >=30 >=30<15 <1515-<30 15-<30
1 2 3 4 5 6 7 8 9 10 11 12
45-<60 >=60
2. Service
1. Assign 22 Days
2. 5 Extra Days
3. 2 Extra Days
4. 3 Extra Days
. . . . . . . . . . . .
. . . . . . . . . . . .
. . . . . . . . . . . .
. . . . . . . . . . . .
Fig. 5 Merged paths for repaid loans
Start1
Full Time
? = No
? = No ? = No
? = No
No LoanTrue
Repaid on Time
Grant Loan
? = Yes
? = Yes ? = Yes
? = Yes
? = NoPrevious Loan? = Yes
Over3yrs Over5yrs

JANUARY/FEBRUARY 2007 25
engineers are not required to constructand maintain them. They can beaccessed and used by a wide range ofpeople directly involved with the busi-ness processes.
VisiRule provides a drawing envi-ronment that lets you draw decisioncharts, which can be immediately exe-cuted and verified, or exported asgraphical objects or as program text forembedding within larger computerprocesses and/or applications.
READ MORE ABOUT IT • J. Vanthienen, “Ruling the busi-
ness: About business rules, decisiontables and intelligent agents,” in NewDirections in Software Engineering, J.Vandenbulcke and M. Snoeck, Eds.Leuven, Belgium: Leuven Univ. Press,2001, pp. 103–120, 160.
ABOUT THE AUTHORClive Spenser completed his M.Sc. at
Imperial College, London, in the areaof advanced information systems. Hehas worked for LPA for more than 20years as a researcher, project engineer,and in product development, sales, andmarketing departments. He also advisesresearch centers on the commercialexploitation of innovative research.
Fig. 9 Chart for diagnosing lawn problems
? = No
Start Here
MossDoes the lawn have moss
or weeds?
weeds_or_mossIs it full of weeds and/or mosswith very little grass present?
bare_earthIs the grass very sparse with
bare earth showing everywhere?
bare_patchesDoes it have heaps ofearth or bare patches?
fine_leavesAre the grass leaves very fine,
giving the lawn a'bowling green' appearance?
First Rate Lawn(Luxury Grade)
First Rate Lawn(Utility Grade)
brown_patchesDoes it have unsightly
brown patches?
LevelIs it free from obvious
bumps and depressions?
even_colourIs it the same green
color and texture all over?
quick_drainingIs it reasonably quick
draining after heavy rain?
? = No
? = Yes
? = Yes
? = Yes ? = Yes
? = Yes
? = Yes
? = Yes
? = No
? = YesSecond Rate
Lawn
? = No ? = No
? = No
? = No
Worn OutLawn
Fig. 8 Chart for holiday entitlement
Start
AgeHow Old Are You?
? >= 60 ServiceLength of Service in Years?
22 + 5 + 3 ? >= 30
? < 18
22
22 + 5 22 + 2
? < 15 and? Age < 45
? >= 15 and < 30 or? Age >= 45 and
? < 15
? >= 15 and? < 60
Fig. 7 The final decision table
<18
<15
18-<45
15-<30 >=30 <15 or 15-<30 >=30 --
1 2 3 4 5 6 7
45-<60 >=601. Age
2. Service
1. Assign 22 Days
2. 5 Extra Days
3. 2 Extra Days
4. 3 Extra Days . .
. . . .
.
.
X
X X X X X X X
XXX
X X
X
X X.
...