drainage systems for golf courses - ohio state · pdf filedrainage systems for golf courses...
TRANSCRIPT

1
Drainage Systems for Golf Courses Dr. Ed McCoy
Ohio State University

2
Table of Contents
Chapter 1: Background Material 3 Introduction and Rationale 3 Hillslope Hydrology 4 Watershed Hydrology 8 Soil Hydrologic Properties 10 Wetlands and Drainage 13 Chapter 2: Surface Drainage of Fairways & Roughs 14 The Rational Method 14 Culverts 19 Channel Design 22 Diversions 27 Surface Inlets & Storm Sewers 27 Pipe Flow Control 31 Surface Runoff Interceptors 34 Conclusions 35 Chapter 3: Subsurface Drainage of Fairways & Roughs 36 Subsurface Drainage System Design 36 Hillside Interceptors 46 Springs 48 Chapter 4: Drainage of Greens, Tees & Sand Bunkers 49 Surface Drainage of Tees & Greens 49 Subsurface Drainage of Tees & Greens 50 Sand Bunker Drainage 57 Subsurface Drainage System Design for Greens, Tees & Bunkers 59 Chapter 5: Outlets 63 Classical Outlets 63 Pump & Siphon Outlets 64 Dry Wells & Subsurface Reservoirs 66 Stormwater Wetlands 69 Bibliography 74

3
Chapter 1: Background Material Introduction and Rationale Natural precipitation on a golf course can frequently result in unwanted water that is flowing across the surface or ponded in depressions. The controlled removal of this excess surface water is surface drainage. Rainfall or snowmelt can also infiltrate into the soil and create waterlogged soil conditions. Removal of this excess subsurface water is subsurface drainage. The controlled and deliberate removal of surface runoff and subsurface water is widely recognized as a critical feature of a golf course. Drainage improvements can create a healthy environment for turfgrass, improve course playability, allow timely maintenance and thus yield increased course revenues. This handbook will address many of the important topics related to the controlled removal of excess water from the soil surface as well as the soil profile. Natural drainage occurs without man’s intervention by virtue of the natural topography of the landscape and natural soil characteristics. When topography and soil do not contribute to the timely removal of unwanted water, man-made or artificial drainage practices and structures are necessary. Indeed, artificial drainage is a key component of golf course design, yet, not all drainage need is recognized during initial design and course construction. In fact, even if a drainage need is recognized at the design stage, architects may not recommend a particular drainage improvement until after the course is opened and additional revenue is generated. For these reasons, golf course superintendents are often faced with the need for in-house drainage system design and installation. While the overall goal of golf course drainage, the controlled removal of excess surface and subsurface water, is similar to that for agricultural production; golf courses and recreational turf in general have unique requirements that necessitate a different set of design criteria. Both surface and subsurface drainage have capacity and intensity attributes. For surface drainage, the capacity attribute refers to the amount of land area that can be drained by surface runoff. The intensity attribute refers to how fast a given land area can become drained by surface flow, or how quickly any surface ponding can be eliminated. For subsurface drainage, the capacity attribute refers to the maximum soil depth that the water table can be lowered. The intensity attribute correspondingly refers to how rapidly the water table can be lowered. In agricultural production, water ponding on the soil surface for up to several days can be tolerated since activity on this area is limited and crops can typically tolerate this ponding without a yield reduction. On the other hand, it is desirable to maximize the land area for production and minimize the land area relegated to channels, ditches, or other flow control structures. Thus, surface drainage for agricultural production tends to emphasize the capacity attribute and de-emphasize the intensity attribute of surface drainage. In the same vein, agricultural production tends to emphasize the capacity attribute and de-emphasize the intensity attribute of subsurface drainage. Again, crops can tolerate water saturated soils conditions for several days without suffering a significant yield loss. On

4
the other hand, most crops experience enhanced yields when there is a large soil volume available for root exploration; so lowering a water table is preferred. In recreational turf situations, the intensity attributes of both surface and subsurface drainage is emphasized. Land areas tend to be smaller and the time needed for return to play after a rain is much more critical. Also, mowed turf roots systems tend to be shallow so the depth of rooting is less important as compared with the speed at which a water table can be lowered. Rapidly lowering a water table will return the soil to favorable conditions for both play and for the ability of a soil to resist compaction due to foot and maintenance traffic. Hillslope Hydrology A discussion of hillslope hydrology may not at first seem applicable to all golf courses since not all golf courses contain what is widely thought of as hillslopes. Yet, all golf courses are shaped and contoured to contain mounding, dips and swales thus creating miniature hills. Indeed, water flow across and within golf course soils obeys hillslope hydrologic processes whether the surface consists of fairways & roughs, tees, greens, or bunkers. Hydrology is concerned with 1) precipitation as rain or snowfall, 2) runoff, the movement of water over the ground surface, and 3) the downward or lateral movement of water through the earth’s strata. Understanding these components will lead to successful drainage system design. Precipitation: A rain storm can be described in several different ways. The most common way to describe a rain storm is the total amount of precipitation given as a depth, usually in inches. Alternatively, the time interval from the beginning of a storm to it’s end is the storm duration. The parameter most useful in drainage system design, however, is the rate of precipitation or storm intensity. The storm intensity is found by dividing the rainfall amount for a given time period by the length of that period. Storm intensity is typically expressed as inches per hour. Thus, more intense storms deliver a larger number of inches per hour whereas less intense storms may only deliver a fraction of an inch per hour. Interestingly, some of the greatest recorded storm intensities have occurred in Maryland, West Virginia and Pennsylvania. Also important in drainage system design is the frequency at which a given storm intensity will occur in a particular location. By studying local, storm intensity records over many years, hydrologists have established the probability of occurrence of a given storm intensity in any year. Thus, very intense storms, delivering high rain amounts over short duration, are less probable during the year as compared with less intense storms. In design, we are not so much concerned with storm intensity probability during the year, but rather the likely number of years between a given intensity event. This number of years is called the return period and it is calculated as the inverse probability:
Return Period = 1Probability

5
For example, a rain storm that has a 5% (0.05) probability of occurring in a given year has a 20-year return period. Similarly, a storm with a 1% probability of occurrence each year has a 100-year return period. Because of the relation, for a particular geographic location, between storm intensity and its return period, we often use return period to describe a storm and only infrequently talk about the actual storm intensity. Thus, we speak of storms as, for example, a 10-year storm, a 50-year storm, or a 100-year storm. It is important to remember, however, that although improbable, it is possible to experience, for example, several 10-year return period storms within a 10-year period. Very intense storms clearly cause flooding and subsequent flood damage. The return period provides a rational method for personal judgment to enter into the design of flow control structures. Drainage systems are often designed to acceptably control rain storms of a given return period or correspondingly intensity. Thus, a flow control structure can be though of as being able to handle, say, a 10-, 50- or even 100-year storm. The smaller the return period a system is designed for, the greater the risk that the area will experience flooding and subsequent flood damage. Alternatively, there is a smaller risk of flooding when the system is designed to handle a 100-year storm. Of course, a system that is designed to only handle a 10-year storm is often much less expensive to install, and likely has a much smaller impact on the existing or natural landscape. Correspondingly, the system designed for a 100-year storm can be quite expensive and have a great impact on the landscape. Thus the balance between the risk one is willing to accept and the money one is willing to spend is expressed by the return period of the storm for which the system is designed. This is an issue where the balance between risk and expense differs for recreational turf drainage as compared with agricultural drainage. Profit margins in production agriculture are relatively small and damage due to flooding may not be costly. Thus, in production agriculture short return periods of 2- to 10-years are commonly used in design. For golf courses and other recreational turf conditions, profit margins are seemingly greater and flood damage more costly. Therefore, longer return periods of 25- to 50-years are commonly used in drainage systems design. Runoff: Precipitation that strikes the earth’s surface either infiltrates into the soil surface or produces runoff. The fate of this precipitation depends on rainfall intensity and the infiltration rate of the soil. When rain intensity exceeds the infiltration rate, water is striking the earth’s surface faster that it can penetrate into the soil and the excess water results in runoff. When rain intensity is less than the infiltration rate, all precipitation enters the soil surface and no runoff is generated. Further, runoff that collects in surface depressions results in localized ponding on the golf course. For turfgrass surfaces, the infiltration rate largely depends on the soil texture (percent sand, silt and clay) and the degree of soil compaction. Soils containing an appreciable quantity of silt and clay, called heavy textured soils, have a lower infiltration rate as compared with sandy or light textured soils. Thus a rainstorm on a heavy textured soil will yield more runoff as compared with a light textured soil. Correspondingly, a compacted soil will also yield
6
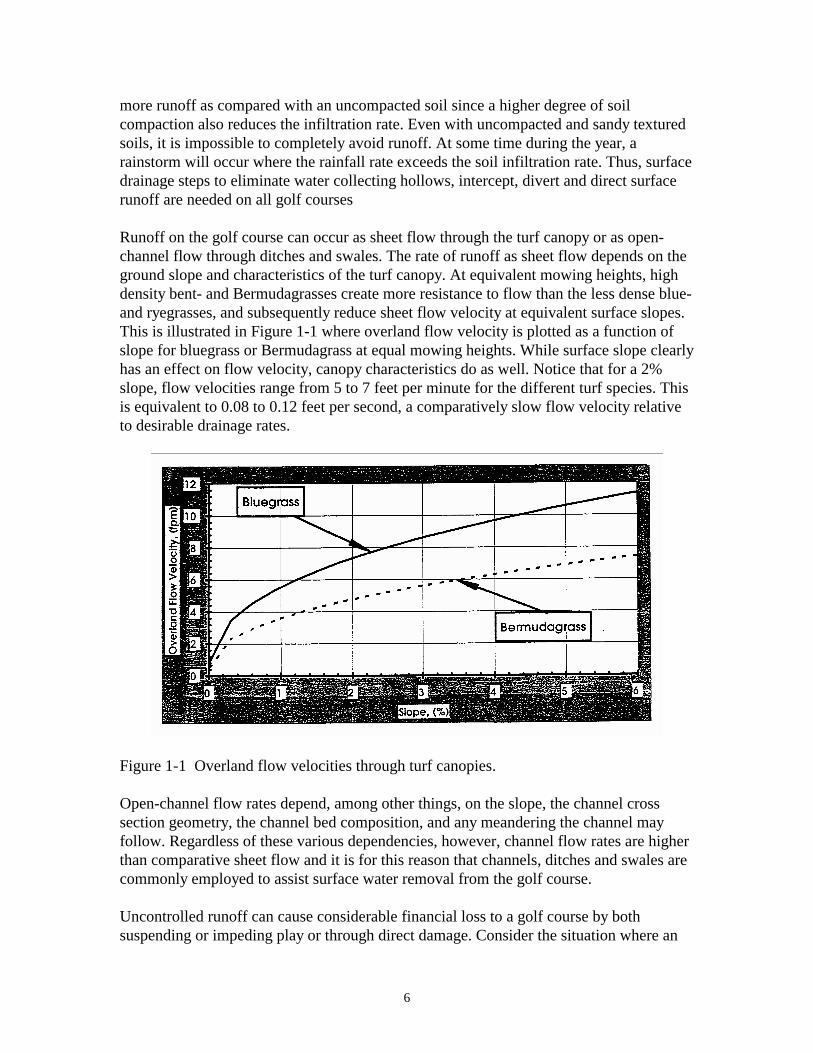
more runoff as compared with an uncompacted soil since a higher degree of soil compaction also reduces the infiltration rate. Even with uncompacted and sandy textured soils, it is impossible to completely avoid runoff. At some time during the year, a rainstorm will occur where the rainfall rate exceeds the soil infiltration rate. Thus, surface drainage steps to eliminate water collecting hollows, intercept, divert and direct surface runoff are needed on all golf courses Runoff on the golf course can occur as sheet flow through the turf canopy or as open-channel flow through ditches and swales. The rate of runoff as sheet flow depends on the ground slope and characteristics of the turf canopy. At equivalent mowing heights, high density bent- and Bermudagrasses create more resistance to flow than the less dense blue- and ryegrasses, and subsequently reduce sheet flow velocity at equivalent surface slopes. This is illustrated in Figure 1-1 where overland flow velocity is plotted as a function of slope for bluegrass or Bermudagrass at equal mowing heights. While surface slope clearly has an effect on flow velocity, canopy characteristics do as well. Notice that for a 2% slope, flow velocities range from 5 to 7 feet per minute for the different turf species. This is equivalent to 0.08 to 0.12 feet per second, a comparatively slow flow velocity relative to desirable drainage rates.
Figure 1-1 Overland flow velocities through turf canopies. Open-channel flow rates depend, among other things, on the slope, the channel cross section geometry, the channel bed composition, and any meandering the channel may follow. Regardless of these various dependencies, however, channel flow rates are higher than comparative sheet flow and it is for this reason that channels, ditches and swales are commonly employed to assist surface water removal from the golf course. Uncontrolled runoff can cause considerable financial loss to a golf course by both suspending or impeding play or through direct damage. Consider the situation where an
7
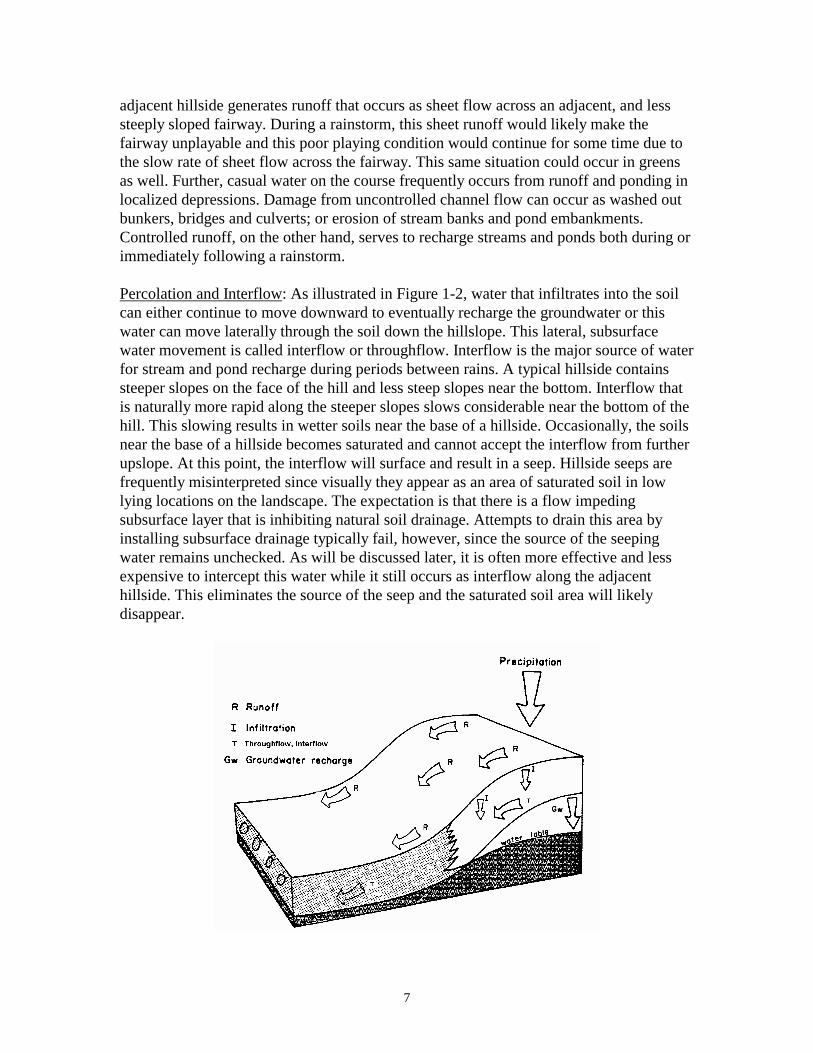
adjacent hillside generates runoff that occurs as sheet flow across an adjacent, and less steeply sloped fairway. During a rainstorm, this sheet runoff would likely make the fairway unplayable and this poor playing condition would continue for some time due to the slow rate of sheet flow across the fairway. This same situation could occur in greens as well. Further, casual water on the course frequently occurs from runoff and ponding in localized depressions. Damage from uncontrolled channel flow can occur as washed out bunkers, bridges and culverts; or erosion of stream banks and pond embankments. Controlled runoff, on the other hand, serves to recharge streams and ponds both during or immediately following a rainstorm. Percolation and Interflow: As illustrated in Figure 1-2, water that infiltrates into the soil can either continue to move downward to eventually recharge the groundwater or this water can move laterally through the soil down the hillslope. This lateral, subsurface water movement is called interflow or throughflow. Interflow is the major source of water for stream and pond recharge during periods between rains. A typical hillside contains steeper slopes on the face of the hill and less steep slopes near the bottom. Interflow that is naturally more rapid along the steeper slopes slows considerable near the bottom of the hill. This slowing results in wetter soils near the base of a hillside. Occasionally, the soils near the base of a hillside becomes saturated and cannot accept the interflow from further upslope. At this point, the interflow will surface and result in a seep. Hillside seeps are frequently misinterpreted since visually they appear as an area of saturated soil in low lying locations on the landscape. The expectation is that there is a flow impeding subsurface layer that is inhibiting natural soil drainage. Attempts to drain this area by installing subsurface drainage typically fail, however, since the source of the seeping water remains unchecked. As will be discussed later, it is often more effective and less expensive to intercept this water while it still occurs as interflow along the adjacent hillside. This eliminates the source of the seep and the saturated soil area will likely disappear.

8
Figure 1-2 Flow paths for water movement on hillslopes. Watershed Hydrology Watersheds: Hillslopes with their associated valleys, waterways, lakes and even rock outcrops comprise the landscape of the golf course. Pertinent to the discussion of drainage, the golf course landscape (including areas surrounding the course) can be subdivided into a collection of watersheds or catchments. As illustrated in Figure 1-3, a watershed is that portion of the landscape that contributes water to a single discharge location whether this be a permanent stream, the next higher order stream, a lake or pond. A watershed is defined by its boundary or divide, across which no runoff occurs. This may be a natural feature such as a ridge or artificial features such as sloped cart paths, ditches along roads, or existing storm water drains. All runoff within the boundary will flow to the discharge location while flow outside the boundary will be associated with an adjacent watershed. Delineation of a watershed boundary is typically accomplished using either topographic maps or from direct field surveys for smaller areas. Often, it is sufficient for a superintendent to simply walk the course during a rainstorm to effectively view that portion of the landscape that contributes water to a discharge.
Figure 1-3 A watershed or catchment containing a permanent or intermittent waterway. By reshaping the landscape during course construction or renovation we have the opportunity to create individual watersheds that did not previously exist or alter existing and adjacent watersheds. Thus, in building a swale to divert hillside runoff away from a fairway, we create a watershed having the swale as one boundary and a discharge where the swale exits the watershed. Indeed, even pocket depressions across the course represent watersheds even though their areas may be very small. Hydrologic Behavior of Watersheds: For small watersheds typical of a golf course, rainfall is uniform across the watershed area. The hydrologic behavior of a golf course watershed can be understood by studying the conceptual model of Figure 1-4. This figure

9
shows rainfall intensity for an individual storm, the contributing watershed area, and runoff at the discharge location with time after the storm begins. At the start of a runoff producing rainstorm, the runoff discharge from the watershed is zero. As the rain continues, a small area within the watershed that is adjacent to permanent or intermittent waterways has generated runoff reaching the discharge location. The boundary of this small area is denoted by t1. As further rainfall occurs, larger and more temporally remote portions of the watershed begin to contribute discharge, see time t2. After a sufficiently long storm duration when the entire watershed is contributing runoff to the discharge location, the rate of runoff has reached its maximum or peak rate. The graph of discharge rate with time is called a hydrograph. As mentioned before, at the start of the rain storm the discharge rate is zero. As the rain continues, the discharge rate increases, since progressively larger areas of the watershed are now contributing runoff to the outlet. The times t1 and t2 on the hydrograph correspond to the accompanying times on the watershed diagram. Time tc is when the discharge reaches it’s peak, called the peak runoff rate, and the entire watershed is contributing flow. Of course, when the rain storm stops, the hydrograph will trail off with time and eventually return to zero.
Figure 1-4 A conceptual model of watershed hydrologic processes. A sufficiently short duration rainstorm that does not yield flow from the entire watershed will produce a peak in the hydrograph at some time less than tc. Correspondingly, the peak observed will be less than that potentially available from a similarly intense storm of simply longer duration. These storms and their resulting hydrographs are of little use in design work. Alternatively, if the rain continues for times longer than tc, then the hydrograph will level off at the peak discharge rate and only decline when the rainfall stops. Thus, the peak runoff rate value for a given watershed depends only on the rainfall

10
intensity. The proper design of most surface drainage structures, such as diversions, channels, storm drains and culverts require peak runoff rate values as an important component of the design process. The time, tc, for a given watershed is called it’s time of concentration and is the time required for the entire watershed area to contribute flow at the discharge location. The time of concentration is an inherent property of the watershed. Thus, a longer and less steeply sloped watershed will have a larger tc value than a shorter and more steeply sloped watershed. Also, an urban watershed containing impermeable surfaces such as roofs, roads and sidewalks will have a shorter tc value than a comparatively sized and sloped forested watershed. A larger tc value implies that it will require a longer duration storm to fully engage the watershed in contributing flow to the discharge. Historical records tell us, however, that long duration storms are generally of lower intensity than short duration storms. Thus, the time of concentration value for a given watershed in a prescribed geographical location can be used to determine the maximum storm intensity that the particular watershed will experience for a given return period. Soil Hydrologic Properties A body of soil consists of solid material and pore space. While different soils vary in their percentages of solids and pores, it is common to think of soil as consisting of about 50% solid matter and 50% pore space. Thus, when holding a clod of soil in your hand, it is important to realize that this very solid looking object is actually about one-half pore space. Consequently, this pore space can be entirely filled with water, (i.e. saturated), entirely filled with air, or (more likely) containing varying proportions of air and water. Importance of Air and Water Balance in Soil: The degree to which the soil pore space contains either water or air is expressed as the soil moisture content, given as a percent of the total soil volume. Thus, for a soil containing 50% pore space and 25% moisture the remaining 25% of the soil volume will contain air. While it is important for a soil to contain adequate moisture, it is also important for a soil to contain adequate air-filled pore spaces since these pores provide routes for gas exchange with the atmosphere. The exchange of atmospheric gases with soil gases is called soil aeration. Soil aeration is needed to create a healthy environment for plants and plant beneficial microbes living in the soil. As these organisms consume oxygen and generate CO2, efficient soil aeration is necessary to prevent soil oxygen depletion and the build-up of excessive CO2 or other, toxic metabolic gases. For example, a 12-inch root zone containing 20% air-filled pores would become completely oxygen depleted after 22 to 43 hours if gas exchange did not occur. For adequate soil aeration, it is commonly noted that a soil should contain at least 10 to 20% air-filled pore space for most of the growing season. If there are extended periods of time that the air-filled pore space is less than this minimum, the soil is termed waterlogged. Waterlogged soils lead to turf decline by inhibiting root respiration. Also, waterlogged soils favor the invasion of shallow rooted species such as Poa annua,
11
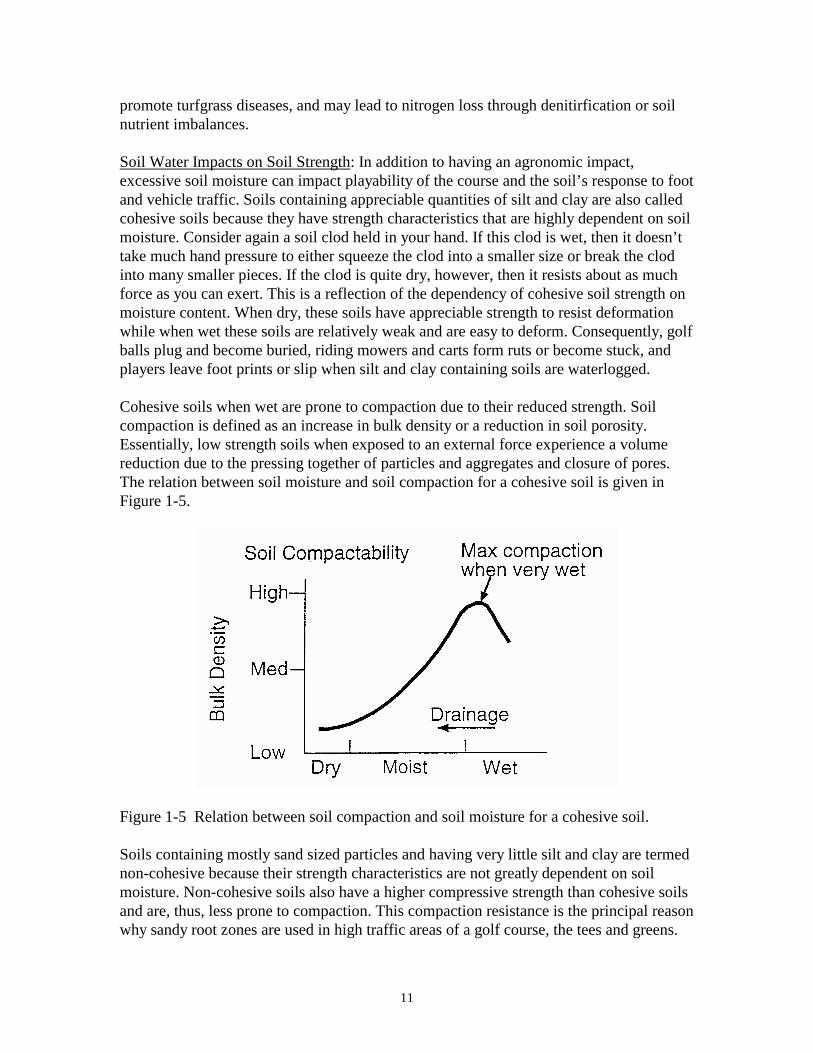
promote turfgrass diseases, and may lead to nitrogen loss through denitirfication or soil nutrient imbalances. Soil Water Impacts on Soil Strength: In addition to having an agronomic impact, excessive soil moisture can impact playability of the course and the soil’s response to foot and vehicle traffic. Soils containing appreciable quantities of silt and clay are also called cohesive soils because they have strength characteristics that are highly dependent on soil moisture. Consider again a soil clod held in your hand. If this clod is wet, then it doesn’t take much hand pressure to either squeeze the clod into a smaller size or break the clod into many smaller pieces. If the clod is quite dry, however, then it resists about as much force as you can exert. This is a reflection of the dependency of cohesive soil strength on moisture content. When dry, these soils have appreciable strength to resist deformation while when wet these soils are relatively weak and are easy to deform. Consequently, golf balls plug and become buried, riding mowers and carts form ruts or become stuck, and players leave foot prints or slip when silt and clay containing soils are waterlogged. Cohesive soils when wet are prone to compaction due to their reduced strength. Soil compaction is defined as an increase in bulk density or a reduction in soil porosity. Essentially, low strength soils when exposed to an external force experience a volume reduction due to the pressing together of particles and aggregates and closure of pores. The relation between soil moisture and soil compaction for a cohesive soil is given in Figure 1-5.
Figure 1-5 Relation between soil compaction and soil moisture for a cohesive soil. Soils containing mostly sand sized particles and having very little silt and clay are termed non-cohesive because their strength characteristics are not greatly dependent on soil moisture. Non-cohesive soils also have a higher compressive strength than cohesive soils and are, thus, less prone to compaction. This compaction resistance is the principal reason why sandy root zones are used in high traffic areas of a golf course, the tees and greens.
12
Interestingly, soil moisture is a management factor to help cohesive soil greens hold lofted golf shots. If these push-up style greens are allowed to become somewhat dry, then their higher soil strength resists divoting resulting in greens that do not hold. For this reason, push-up greens are kept on the wet side to improve their acceptance by U.S. style golfers. The down side of this management approach is the resulting soil compaction that occurs on wetter, mineral soils when exposed to frequent foot traffic. Alternatively, non-cohesive soils have a relatively low shear strength that, as before, is largely independent of soil moisture. A lofted golf shot will much more readily (and over most water contents) divot and hold on a sandy textured green. This makes high sand greens play more consistently day to day.
Soil Compaction and Soil Hydraulic Behavior: While soil compaction is defined by reduced total porosity, more significant is the fact that not all soil porosity is influenced to the same degree. Soil compaction results primarily in the collapse of the macro- or larger sized pores with a proportionate increase in smaller pores. This loss of macropores affects the hydraulic behavior of the soil and in particular its ability to drain excess water. Soil pores are often classified according to their size and hydraulic function. Macropores are the very large soil pores that mainly serve as routes for water infiltration, water drainage and soil aeration or gas exchange. You may think of macropores as the route for mass movement of water and air through a soil body. As in flow through pipes, to move large quantities of air and water through a soil, there is a need large and highly conductive pores. Mesopores are the middle sized pores that conduct water more slowly. When short distances are involved or flow occurs more slowly, these pores can be quite useful in the normal functioning of a soil. Thus, mesopores provide for capillary water movement to roots and for moisture redistribution (or wicking) within the soil profile. Micorpores, because of their small size do not readily transmit water through the soil but rather serve to hold water within the soil body and serve as a storage reservoir. By reducing the proportion of macropores, the soil’s potential for drainage and aeration are reduced. For this reason, compaction is probably the most serious damage that can occur in recreational turf soils. Compaction results in a downward spiraling of soil hydraulic properties and the ability of a soil to support turf and play. Consider an area of a fairway with a cohesive soil of adequate macroporosity for aeration and drainage. Foot traffic on this area shortly after a rainfall results in a slight degree of compaction and closure of some soil macropores. This results in a slightly reduced drainage potential for this soil so after the next rain the soil remains wet longer. Thus, the soil has a longer window where it is prone to compaction by traffic. With repeated events, the soil becomes progressively compacted, experiences further reduced drainage and is subsequently more prone to even more damage. Thus soil compaction and reduced drainage are interrelated, with compaction reducing drainage and reduced drainage leaving the soil prone to further compaction.
13
Soil Permeability: Since soils are porous and the pores are interconnected, water can pass through the soil pores. The permeability or hydraulic conductivity of a soil is a measure of how readily water passes through different soils. Soil permeability is an inherent property of a soil and while permeability is not affected by drainage per say, soil drainage is greatly affected by permeability. The hydraulic conductivity is defined as the ratio between volume of water passing through a soil layer with time and the driving force for this water flow. Common English units for permeability are inches per hour or inches per day. High sand content soils that contain a large proportion of macropores have high permeabilities ranging from 1 to 100 in/hr. Alternatively, heavy textured clay soils that contain predominately micropores may have permeabilities as low as 0.01 in/day. For drainage applications the driving force for water flow is gravity. Thus, from a practical standpoint, permeability values can be viewed as the rate at which a water table in the soil will fall over time. For example, in a soil with a permeability of 1 in/hr, the water table would fall two feet over the course of a day. Alternatively, in a soil with a permeability of 0.01 in/day, the water table will only fall 0.01 inches in a day. Wetlands and Drainage Some wetlands were, in the past, modified for golf course construction or renovation by either filling or draining the wetland area. Despite these earlier activities, Section 404 of the Clean Water Act protects many of these wetlands from further drainage or drainage improvements. The Clean Water Act regulates the discharge of dredged or fill material in wetlands, streams, rivers, and other ‘waters of the United States.’ The Army Corps of Engineers is the federal agency that is authorized the issue permits (known as Section 404 permits) for all activities conducted in wetlands. In the case of farmers, certain activities conducted in agricultural wetlands are exempt from Section 404 requirements, and do not require notification or application to the Corps for a Section 404 permit. In order to be exempt, the activities must be part of an on-going operation and cannot be associated with bringing a wetland into production of converting a wetland into a non-wetland area. A section 404 permit is not required to conduct tillage, seeding, cultivation, and harvesting on wetlands that are currently used for production. Maintenance of existing drainage systems within production areas such as, cleaning channels, mowing banks, replacing broken drain lines and replacing water control structures may occur. It is not, however, permissible to increase the effectiveness of the existing drainage systems within wetlands. Wetlands that are not currently being used for agricultural of golf activities may not be modified either drained or filled, without a Section 404 permit.
14
Chapter 2: Surface Drainage of Fairways & Roughs Surface drainage of fairways and roughs includes the design and installation of culverts, channels, diversions, surface inlets and interceptors. The focus of the design step is ensuring that these surface drainage structures are sized properly to handle the anticipated storm flow. Installation is, then, simply placing the designed structure on the site in a manner whereby it functions appropriately, is protected from damage, and easily maintained. For smaller areas on the course such as within a section of a fairway or a greens complex, required dimensions of drainage element are quite small. In these cases, the actual dimensions of drainage structures are often larger than required due to installation and turf maintenance concerns. For example, where a 3-inch pipe is adequate, a 4-inch pipe will commonly be installed due to the ready availability and low cost of the 4-inch pipe. Also, a surface drainage channel will often be larger than required to avoid turf scalping from riding mowers. Thus, overdesign for small areas is more practical and represents only a small if any additional cost. For larger areas, however, it is important to more precisely follow recommended design procedures to ensure adequate drainage function while avoiding wasted expense. The key step in surface drainage design is to first determine the peak runoff rate for the specific watershed or catchment. The Rational Method There are several methods to calculate peak runoff rates. These methods use knowledge of the watershed dimensions, expected storm characteristics, soil type within the watershed, and land use. The simplest and most commonly used approach is the Rational Method given by: q = C i A where q is the peak runoff rate given in cubic feet per second (cfs), C is a coefficient related to the soil and land use of the watershed, i is the expected rainfall intensity for a given return period (inches per hour), and A is the watershed area (acres). While this equation appears quite simple, there are several steps involved in finding the proper values for each of the equation parameters. The Runoff Coefficient: The runoff coefficient, C, provides the integrated influence of soil type, slope, vegetation and land use on peak runoff prediction. Thus, watersheds containing sandy soils will produce less severe runoff events than the same rainfall on watersheds with loams or clays. Denser and taller vegetation will intercept a portion of the rainfall removing this from runoff, slow overland flow velocities, and, being more deeply rooted, increase infiltration. Finally, man made surfaces such as buildings, roads and sidewalks are relatively impermeable and lead to higher runoff rates. The runoff coefficient, C, is defined as the ratio of the peak runoff rate to the rainfall intensity. From a practical standpoint, C can be viewed as the proportion of rain that becomes runoff. Therefore, this values ranges from 0.0 to 1.0, where C = 0.0 indicates no
15
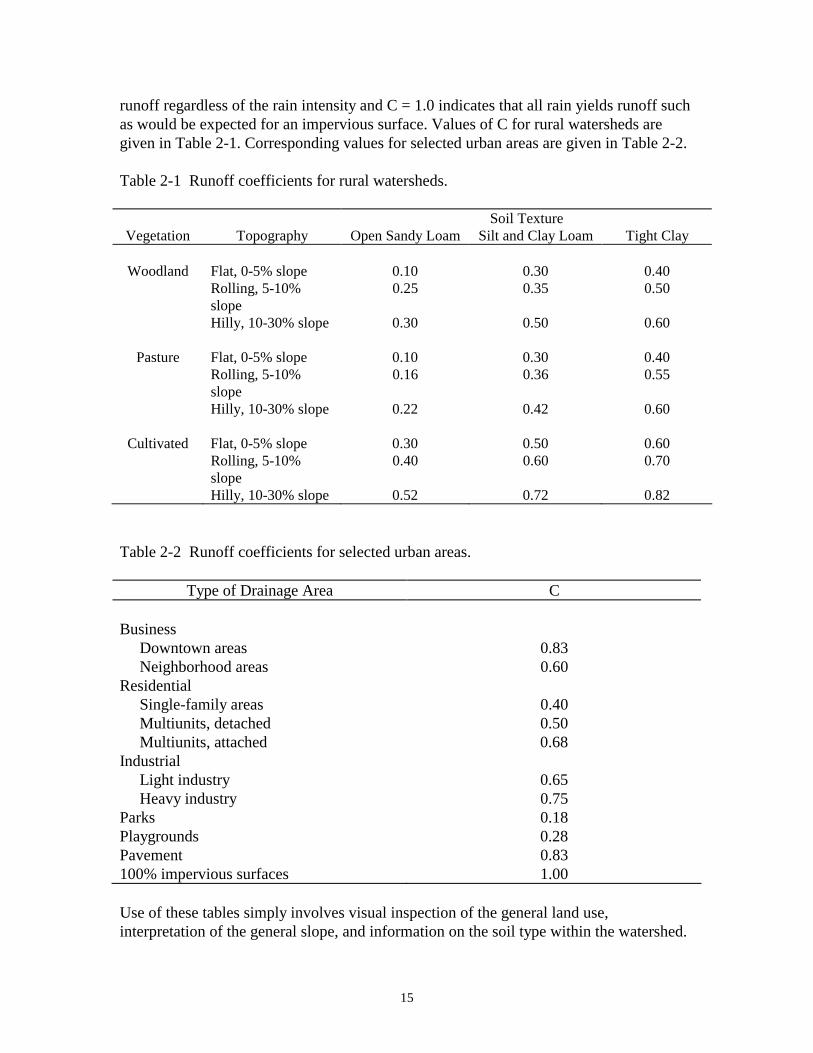
runoff regardless of the rain intensity and C = 1.0 indicates that all rain yields runoff such as would be expected for an impervious surface. Values of C for rural watersheds are given in Table 2-1. Corresponding values for selected urban areas are given in Table 2-2. Table 2-1 Runoff coefficients for rural watersheds. Soil Texture Vegetation Topography Open Sandy Loam Silt and Clay Loam Tight Clay
Woodland Flat, 0-5% slope 0.10 0.30 0.40
Rolling, 5-10% slope
0.25 0.35 0.50
Hilly, 10-30% slope 0.30 0.50 0.60
Pasture Flat, 0-5% slope 0.10 0.30 0.40 Rolling, 5-10%
slope 0.16 0.36 0.55
Hilly, 10-30% slope 0.22 0.42 0.60
Cultivated Flat, 0-5% slope 0.30 0.50 0.60 Rolling, 5-10%
slope 0.40 0.60 0.70
Hilly, 10-30% slope 0.52 0.72 0.82 Table 2-2 Runoff coefficients for selected urban areas.
Type of Drainage Area C Business Downtown areas 0.83 Neighborhood areas 0.60 Residential Single-family areas 0.40 Multiunits, detached 0.50 Multiunits, attached 0.68 Industrial Light industry 0.65 Heavy industry 0.75 Parks 0.18 Playgrounds 0.28 Pavement 0.83 100% impervious surfaces 1.00 Use of these tables simply involves visual inspection of the general land use, interpretation of the general slope, and information on the soil type within the watershed.

16
If you wish to assume less risk, select a slightly higher C value; while if you wish to reduce cost, select a slightly lower C value. Rainfall Intensity: The design rainfall intensity, i, for a particular watershed and given return period is found from the relation between time of concentration and rainfall intensity. Rainfall intensity and storm duration are related, using historical records, for a specified geographical location and return period. Further, storm duration, for design work, is specified by the time of concentration since peak runoff will only occur when the entire watershed is contributing flow to the discharge location. Therefore, the first step in determining rainfall intensity is by calculating the time of concentration for a particular watershed. The time of concentration of a watershed for use in design work is given by: tc = 0.0078 L0.77 S-0.385 where tc is time of concentration in minutes, L is the length of the watershed from the discharge to the most remote or highest elevation point (feet), and S is the slope of the watershed from the most remote or highest point and the discharge (feet per feet). Notice that time of concentration from this equation depends only on the terrain attributes of the watershed whereas other characteristics of the watershed are contained in the runoff coefficient, C. Time of concentration values for lengths of 300 to 10,000 ft and slopes of 1.0 to 20.0 % (corresponding to relatively small watersheds) are given in Table 2-3. Alternatively, a superintendent could estimate the time of concentration for a golf course watershed by observing runoff at the watershed outlet with time after the start of a large rainstorm. Table 2-3 Time of concentration in minutes for small watersheds. Slope (%) Length (ft) 1.0 2.0 4.0 7.0 10.0 15.0 20.0 (minutes)
300 4 3 2 2 2 1 1 500 6 4 3 3 2 2 2
1,000 9 7 6 4 4 3 3 2,000 16 12 9 8 7 6 5 4,000 27 21 16 13 11 10 9 6,000 37 29 22 18 15 13 12 8,000 47 36 27 22 19 16 15
10,000 55 42 32 26 23 20 17 As discussed previously, the time of concentration for a watershed should equal the expected storm duration for our design. Using this equivalence and employing a chart of rain intensities for various storm durations we can determine design rainfall intensity.

17
Figure 2-1 is a graph of rainfall intensity vs. storm duration for various return periods when located at St. Louis, MO. By choosing the appropriate duration (found from the time of concentration equation) and selecting a return period, the rainfall intensity can be read directly from the graph. For time of concentration values less than 8 minutes (the minimum duration on the graph) use 8 minutes as a reasonable duration estimate.
Figure 2-1 Rainfall intensity as a function of storm duration for various return periods at
St. Louis, MO. Of course, this information is specific to St. Louis and the rainfall intensity data needs to be adjusted for other geographical locations. This adjustment is found from the map of the continental U.S. (Figure 2-2) where values on the isolines are multiplied by the St. Louis intensities to determine the correspondingly location specific intensities.

18
Figure 2-2 Factors to adjust St. Louis rainfall intensity to other areas in the U.S. Watershed Area: The final step in using the Rational Method is estimating the watershed area. A watershed is delineated using, for example, a topographic map by identifying the watershed divide. Since most watersheds are irregularly shaped, a reasonable approach is to subdivide the watershed into a collection of regular shapes whose area formulas are well known. Thus, the watershed can be divided into 1) squares, rectangles or parallelograms (area = length x width), 2) trapezoids (area = average length of parallel sides x height), 3) triangles (area = ½ x base x height), or 4) circles (area = 3.14 x radius2). The areas of these regular shapes are then added together to estimate the watershed area. Peak Runoff Calculation: Peak runoff calculation is just the process of using the above information together with the Rational Method formula to determine peak runoff rates in cubic feet per second. For example, determine peak runoff rate from a 25-year rain storm on a 16-acre wooded watershed along the Kentucky-Ohio border. The watershed is predominately a silt loam soil, has a maximum flow length of 2,000 feet and an average slope of 2.0% (0.02 ft/ft). The time of concentration from Table 2-3 is 12 minutes. Since the storm duration equals the time of concentration, the design duration is also 12 minutes. Figure 2-1 shows the design rainfall intensity for St. Louis to be 8.5 inches per hour. Multiplying this by the geographical isoline (0.8, from Figure 2-2) results in a rainfall intensity of 6.8 inches per hour. Further, the runoff coefficient value from Table 2-1 is equal to 0.3. Using the formula, Q = C i A, we find that the peak runoff rate, Q equals 32.6 cubic feet per second (32.6 = 0.3 x 6.8 x 16). Peak runoff rates are commonly used to design channels, diversions, surface inlets, storm sewers and culverts.

19
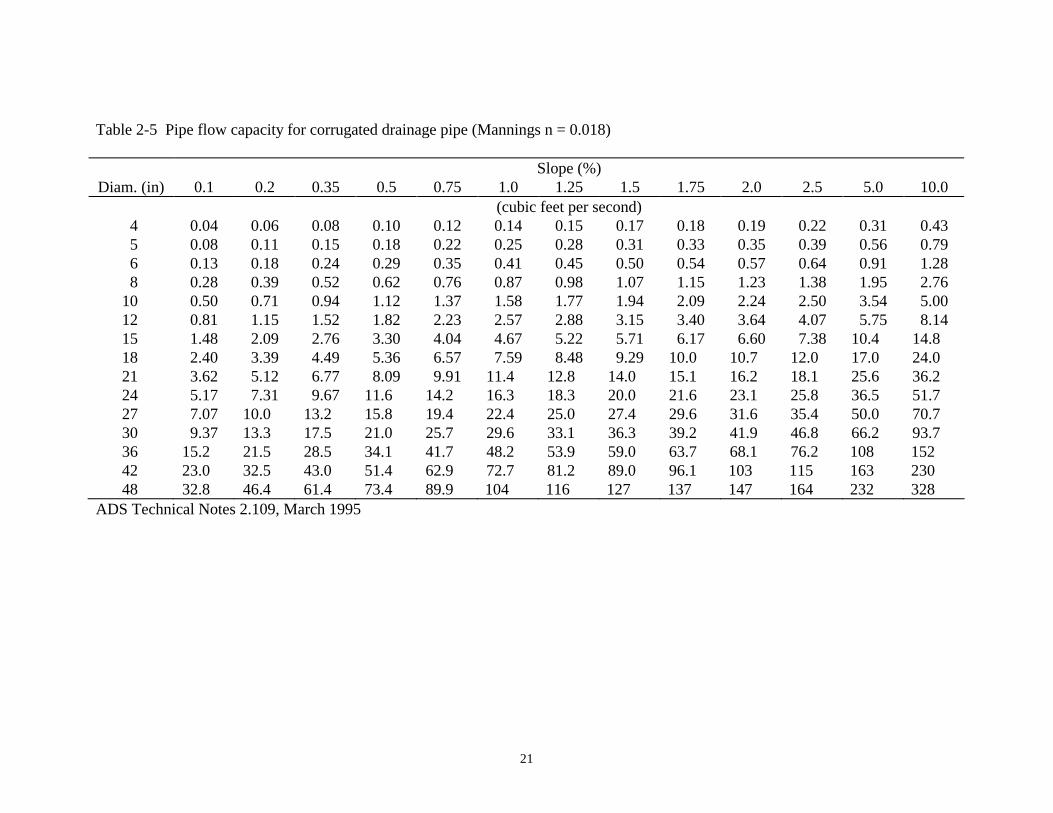
Culverts Large flow control structures such as culverts would likely be designed and installed during course construction. In some cases, however, these structures may require replacement due to age and/or damage. Additionally, many of the larger flow control structures on the course convey at least some portion of water from adjacent properties. Consequently, land use modifications of property adjacent to a course may result in a flood hazard on the course if the current flow control structure is inadequate. Culvert design makes use of peak runoff rates for the contributing watershed. In this case, the culvert represents the discharge location for the watershed. It is important to remember, however, that placement of a culvert often results in an adjustment of the watershed size and shape. For example, suppose that a section of fairway occurs as an intermittent waterway within a larger watershed. It is desired, however, to eliminate surface water drainage across this fairway. This would be accomplished by possibly raising this section of the fairway and installing a culvert, directing flow underground at the upslope edge. The resulting watershed will consequently be smaller, with a different average slope and length as occurred prior to culvert installation. The final information used to properly design the culvert is the slope at which the culvert is to be laid, and the desired culvert material. Thus, Table 2-4 gives the required diameter of smooth walled pipe needed to convey a given peak runoff rate (in cfs) when laid at a specified slope. Smooth walled culverts include those made of clay, concrete or plastic. Correspondingly, Table 2-5 gives the required diameter of corrugated pipe needed to convey a given peak runoff rate (in cfs) when laid at a specified slope. Corrugated pipe can be either metal or plastic. Notice from comparing Tables 2-4 and 2-5 that a larger diameter pipe is often required for a corrugated pipe due to the roughness introduced by the corrugations. A popular culvert material is that consisting of corrugated plastic with a smooth walled insert (e.g. ADS N-12) having the strength of a corrugated pipe and the improved flow of a smooth walled pipe. Additionally, plastic pipe is lighter and easier to install than concrete or metal.

20
Table 2-4 Pipe flow capacity for smooth walled drainage pipe (Mannings n = 0.012) Slope (%) Diam. (in) 0.1 0.2 0.35 0.5 0.75 1.0 1.25 1.5 1.75 2.0 2.5 5.0 10.0 (cubic feet per second)
4 0.07 0.09 0.12 0.15 0.18 0.21 0.23 0.25 0.27 0.29 0.33 0.46 0.65 5 0.12 0.17 0.22 0.26 0.32 0.37 0.42 0.46 0.49 0.53 0.59 0.84 1.18 6 0.19 0.27 0.36 0.43 0.53 0.61 0.68 0.74 0.80 0.86 0.96 1.36 1.92 8 0.41 0.59 0.77 0.93 1.13 1.31 1.46 1.60 1.73 1.85 2.07 2.93 4.14
10 0.75 1.06 1.40 1.68 2.06 2.37 2.65 2.91 3.14 3.36 3.75 5.31 7.51 12 1.22 1.73 2.28 2.73 3.34 3.86 4.32 4.73 5.11 5.46 6.10 8.63 12.2 15 2.21 3.13 4.14 4.95 6.06 7.00 7.82 8.57 9.26 9.90 11.1 15.7 22.1 18 3.60 5.09 6.73 8.05 9.86 11.4 12.7 13.9 15.1 16.1 18.0 25.5 36.0 21 5.43 7.68 10.2 12.1 14.9 17.2 19.2 21.0 22.7 24.3 27.1 38.4 54.3 24 7.75 11.0 14.5 17.3 21.2 24.5 27.4 30.0 32.4 34.7 38.8 54.8 77.5 27 10.6 15.0 19.9 23.7 29.1 33.6 37.5 41.1 44.4 47.5 53.1 75.0 106 30 14.1 19.9 26.3 31.4 38.5 44.4 49.7 54.4 58.8 62.8 70.3 99.4 140 36 22.9 32.3 42.8 51.1 62.6 72.3 80.8 88.5 95.6 102 114 162 229 42 34.5 48.7 64.5 77.1 94.4 109 122 134 144 154 172 243 344 48 49.2 69.6 92.1 110 135 156 174 191 206 220 246 348 492
ADS Technical Notes 2.109, March 1995
21
Table 2-5 Pipe flow capacity for corrugated drainage pipe (Mannings n = 0.018) Slope (%) Diam. (in) 0.1 0.2 0.35 0.5 0.75 1.0 1.25 1.5 1.75 2.0 2.5 5.0 10.0 (cubic feet per second)
4 0.04 0.06 0.08 0.10 0.12 0.14 0.15 0.17 0.18 0.19 0.22 0.31 0.43 5 0.08 0.11 0.15 0.18 0.22 0.25 0.28 0.31 0.33 0.35 0.39 0.56 0.79 6 0.13 0.18 0.24 0.29 0.35 0.41 0.45 0.50 0.54 0.57 0.64 0.91 1.28 8 0.28 0.39 0.52 0.62 0.76 0.87 0.98 1.07 1.15 1.23 1.38 1.95 2.76
10 0.50 0.71 0.94 1.12 1.37 1.58 1.77 1.94 2.09 2.24 2.50 3.54 5.00 12 0.81 1.15 1.52 1.82 2.23 2.57 2.88 3.15 3.40 3.64 4.07 5.75 8.14 15 1.48 2.09 2.76 3.30 4.04 4.67 5.22 5.71 6.17 6.60 7.38 10.4 14.8 18 2.40 3.39 4.49 5.36 6.57 7.59 8.48 9.29 10.0 10.7 12.0 17.0 24.0 21 3.62 5.12 6.77 8.09 9.91 11.4 12.8 14.0 15.1 16.2 18.1 25.6 36.2 24 5.17 7.31 9.67 11.6 14.2 16.3 18.3 20.0 21.6 23.1 25.8 36.5 51.7 27 7.07 10.0 13.2 15.8 19.4 22.4 25.0 27.4 29.6 31.6 35.4 50.0 70.7 30 9.37 13.3 17.5 21.0 25.7 29.6 33.1 36.3 39.2 41.9 46.8 66.2 93.7 36 15.2 21.5 28.5 34.1 41.7 48.2 53.9 59.0 63.7 68.1 76.2 108 152 42 23.0 32.5 43.0 51.4 62.9 72.7 81.2 89.0 96.1 103 115 163 230 48 32.8 46.4 61.4 73.4 89.9 104 116 127 137 147 164 232 328
ADS Technical Notes 2.109, March 1995

22
Use of Tables 2-4 and 2-5 is illustrated by considering the following example. Find the required diameter of smooth walled pipe able to convey a peak runoff rate of 32.6 cfs, from our pervious example, when laid at a 1% slope. Since the pipe is smooth walled, we will use Table 2-4. Under the 1% slope column, we search for 32.6 cfs. This value falls between 24.5 for a 24-inch diameter pipe and 33.6 for a 27-inch diameter pipe. Thus, we choose the 27-inch diameter pipe for our application since it has a capacity exceeding our peak runoff rate. Clearly, from these tables, as drainage pipe diameter increases, so does the flow capacity. Also, increasing the slope at which the pipe is laid will also increase its capacity. Thus, for a smooth walled pipe designed to convey 9.9 cfs, you will need either a 15-inch pipe at 2% slope or a 24-inch pipe at 0.2% slope. If at all possible, economy can be obtained by merely increasing the grade of the pipe (of course, this may require extra excavation costs). It is important to remember, however, that the goal is to size the pipe so that it can handle peak runoff rates from some possible future rainstorm. If the pipe is undersized, then the area upstream may become flooded or flow may occur over the embankment containing the culvert resulting in erosion and possible washing-out of the pipe. Channel Design Surface drainage channels on the golf course commonly exist as a branching network of individual channel elements with lower order channels emptying into high order channels. This arrangement is similar to that found naturally in the arrangement of intermittent waterways, streams and rivers. Drainage channel shapes can be triangular, trapezoidal, parabolic, or more complex including a main channel with flood plains. Parabolic shapes are, however, preferred in golf course situations since the areas needing surface drainage are small and a parabolic shape appears more natural. For this reason, we shall only discuss parabolic shaped channels here. Sheet flow across long, gently sloped surfaces is a relatively inefficient method to move water to a discharge location. A more preferred approach is to sculpture the flat surface into a branching network of naturally meandering channels divided by slightly elevated mounding. This approach, common in modern landscape design, thus transforms an uninteresting inclined plane surface into a more natural appearing terrain. In addition, localized depressions scattered about fairways and roughs are often surface drained by these lower order, parabolic shaped channels. At this first level of a surface drainage network, discharges in terms of peak runoff rates are quite small and it is unlikely that any visually apparent channel would have an insufficient capacity. Rather, it is important in design at this level to ensure the channel has a proper grade and to select the appropriate dimensions of the channel to fit into the existing terrain. The grade of a drainage channel (or any drainage element) is the ratio of the elevation difference and the distance between where water enters the channel and the discharge

23
location. Since the objective is to drain a surface depression, the drain elevation at the depression must be at least as deep or slightly deeper than the depression. The discharge point should, correspondingly, be slightly above the normal water level where the drain enters the next higher order watercourse. In the example shown in Figure 2-3, a depression collects water during rainfall. We wish to construct a channel so water will freely flow by gravity from the depression to an adjacent stream. The first design step is to select a logical route for this channel. The centerline of the chosen routing is shown on the map. If we had selected a centerline further downstream, the depth of cut would be less, but the channel would be longer.
Figure 2-3 An example of surface drainage for a depression. After the centerline is selected, the bottom of the depression is marked as 0+00 (surveyors notation for 0 horizontal distance). Corresponding locations along the centerline are

24
marked 50-foot intervals (e.g. 0+50, 1+00, 1+50, etc.). Using these distances and their associated elevations, we can construct a lay-of-the-land profile from the bottom of the depression to the stream as shown in the bottom half of Figure 2-3. (Notice that we used a topographic map of the area for this example. If a good map does not exist, then it would be necessary to conduct a survey along the centerline to obtain the desired elevations.) We can now select a channel elevation at 0+00 which in this example coincides with the elevation at the bottom of the depression, 41.6 feet. The discharge end of the channel must be located above the stream’s normal water level and, as in this example, it could be even higher. Thus, the discharge end coincides with the existing ground elevation at station 3+00, 39.6 feet. Connecting elevations at 0+00 and 3+00 with a straight line gives the channel elevation along its entire run as shown in graph of Figure 2-3. Since there is a 2-foot drop from 0+00 to 3+00, the grade or slope of the channel is 0.67%. This together with the existing elevations determines the cut required along the centerline to establish a 0.67% slope. The only remaining requirement is to determine the dimensions of the parabolic channel so that it fits into the landscape and allows routine maintenance with common turf maintenance equipment. This involved knowledge of the side slopes of a parabolic shaped channel. The recommended shape of a parabolic channel is shown in Figure 2-4. This shape can be specified by the width, W, at a 1-foot depth. The drawing shows W = 10 feet, which is about the minimum width that is practical. Side slopes for the bottom quarter of the 1-foot depth, second quarter depth, and top half of the depth are shown in Table 2-6 for top widths from 10 to 50 feet. In staking for construction, ½W is the width for the bottom quarter depth, and ¾W is the width for the top half depth. Additionally, a 0.3-foot freeboard is commonly added to the depth of a parabolic channel as a safety margin. The slope of this 0.3-foot freeboard is the same as that used for the top half depth. Thus, in the example the freeboard continues at a 3:1 slope. This increases the top width from 10 feet to 10 + 2 x (3 x 0.3) = 11.8 feet which is rounded to 12. Once the required depth of the channel is known, and the top half slope is selected from either maintenance or aesthetic considerations, then the channel width can be determined from Table 2-6 as a proportion of that given for a 1-foot depth.
Figure 2-4 Cross section of a parabolic shaped channel.
25
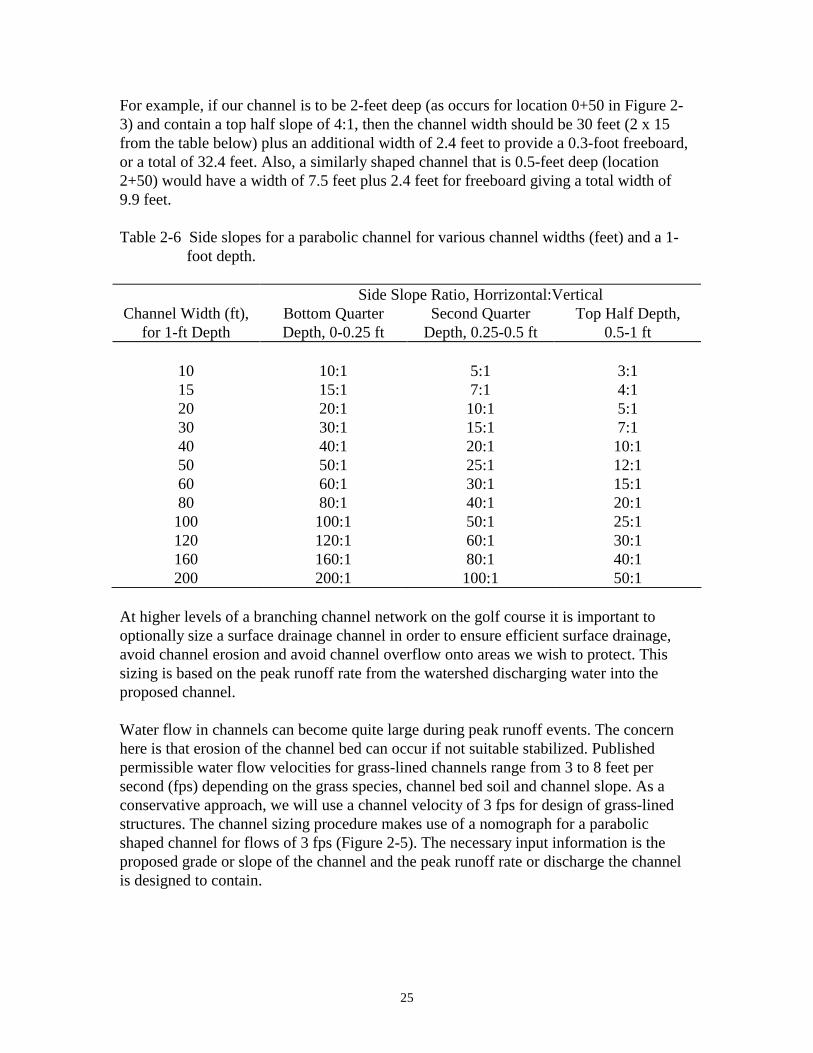
For example, if our channel is to be 2-feet deep (as occurs for location 0+50 in Figure 2-3) and contain a top half slope of 4:1, then the channel width should be 30 feet (2 x 15 from the table below) plus an additional width of 2.4 feet to provide a 0.3-foot freeboard, or a total of 32.4 feet. Also, a similarly shaped channel that is 0.5-feet deep (location 2+50) would have a width of 7.5 feet plus 2.4 feet for freeboard giving a total width of 9.9 feet. Table 2-6 Side slopes for a parabolic channel for various channel widths (feet) and a 1-
foot depth. Side Slope Ratio, Horrizontal:Vertical Channel Width (ft),
for 1-ft Depth Bottom Quarter Depth, 0-0.25 ft
Second Quarter Depth, 0.25-0.5 ft
Top Half Depth, 0.5-1 ft
10 10:1 5:1 3:1 15 15:1 7:1 4:1 20 20:1 10:1 5:1 30 30:1 15:1 7:1 40 40:1 20:1 10:1 50 50:1 25:1 12:1 60 60:1 30:1 15:1 80 80:1 40:1 20:1
100 100:1 50:1 25:1 120 120:1 60:1 30:1 160 160:1 80:1 40:1 200 200:1 100:1 50:1
At higher levels of a branching channel network on the golf course it is important to optionally size a surface drainage channel in order to ensure efficient surface drainage, avoid channel erosion and avoid channel overflow onto areas we wish to protect. This sizing is based on the peak runoff rate from the watershed discharging water into the proposed channel. Water flow in channels can become quite large during peak runoff events. The concern here is that erosion of the channel bed can occur if not suitable stabilized. Published permissible water flow velocities for grass-lined channels range from 3 to 8 feet per second (fps) depending on the grass species, channel bed soil and channel slope. As a conservative approach, we will use a channel velocity of 3 fps for design of grass-lined structures. The channel sizing procedure makes use of a nomograph for a parabolic shaped channel for flows of 3 fps (Figure 2-5). The necessary input information is the proposed grade or slope of the channel and the peak runoff rate or discharge the channel is designed to contain.

26
Figure 2-5 Design nomograph for a grass-lined channel with flow velocities limited to 3
feet per second. Use of the nomograph is illustrated by the following example: Determine the minimum sized parabolic channel that may be used to direct a discharge of 70 cfs down a 1%sloped, grass-lined channel. The solution is as follows: Working from left to right, the slope and discharge are aligned using a ruler to define, on the middle line, a channel top width of 37 feet. Then from this channel-top-width-point on the middle line we again align this point with the discharge value of 70 cfs on the 4th line. Following this alignment to the furthest right line gives a required channel depth of 1.4 feet (including a 0.3-foot depth freeboard). This defines the parabolic channel required to convey 70 cfs down a 1% slope. Notice from Figure 2-5 that if the channel slope is increased for the same discharge, then the channel becomes wider and shallower. If the slope is decreased, the channel becomes less wide and deeper. Further, it is important to check that the channel dimensions from the nomograph will fit into the landscape and have adequately gentle side slopes for planned turf maintenance. For example, a 15-foot wide channel with a 3-foot depth will, from Table 2-6, expectedly have top-half side slopes greater than 4:1. If these side slopes exceed the planned turf maintenance practices, then the channel will need to be wider for a given depth. What happens here are that the revised channel dimensions will provide for a higher capacity of flow than the watershed will discharge. If, when working with the nomograph for a grass-lined channel, the slope and discharge values align in such a fashion to extend above the top width scale (e.g. 2% slope and 240

27
cfs discharge), then the flow velocity in the channel will exceed 3 fps during peak runoff events. In this case, a grass-lined channel would be inappropriate and result in a risk of channel erosion. Lining of the channel with erosion resistant materials such as riprap, concrete or asphalt is subsequently required. Diversions In cases where a hillside runs adjacent to a fairway it is often more practical to divert the subsequent runoff away from the fairway rather than channeling this flow across the fairway. Diversions are commonly grass-lined channels constructed up slope from an area we desire to protect from runoff. As shown in Figure 2-6, a diversion on a slope is simply created by excavating a channel along the slope and gradually grading the spoil to form a downslope ridge. A parabolic shaped diversion can appear as a natural landscape feature. Further, the diversion should not precisely follow the contour of the slope but rather should be placed at some angle to the slope to provide an appropriate grade for water flow along its length. Placement of a diversion along a hillslope will create a new watershed with one edge of the watershed being the diversion itself. Thus, the Rational Method could be applied for this new watershed to determine the predicted peak runoff rate the diversion would convey. Sizing of the diversion is accomplished using the nomograph for grass-lined channels given in Figure 2-5. In addition to maintaining the diversion in grasses, a 20-foot wide strip above the diversion should also be maintained in turf to prevent suspended materials from further being deposited in and silting up the diversion bed. The diversion would subsequently empty into a higher order channel, stream, pond or any other protected discharge location.
Figure 2-6 Cross section of a typical diversion. Surface Inlets & Catch Basins Frequently, small, localized depressions are used as an architectural features on fairways or as grass lined bunkers in greens complexes. These depressions should not be surface drained by cutting channels into the depression bottom. Rather, a surface inlet should be installed at the lowest point in the depression to rapidly conduct runoff into a subsurface system of pipes. A surface inlet (also called an open inlet or catch basin) is an intake structure for removal of surface runoff. It consists of a riser, vertically extended to the ground surface, connected to a subsurface pipe directing flow to an outlet. The subsurface pipe should be sufficiently deep to prevent damage from vehicle traffic. A discussion on installing subsurface drainage pipe is given in Chapter 3. A grate is placed on the end of
28
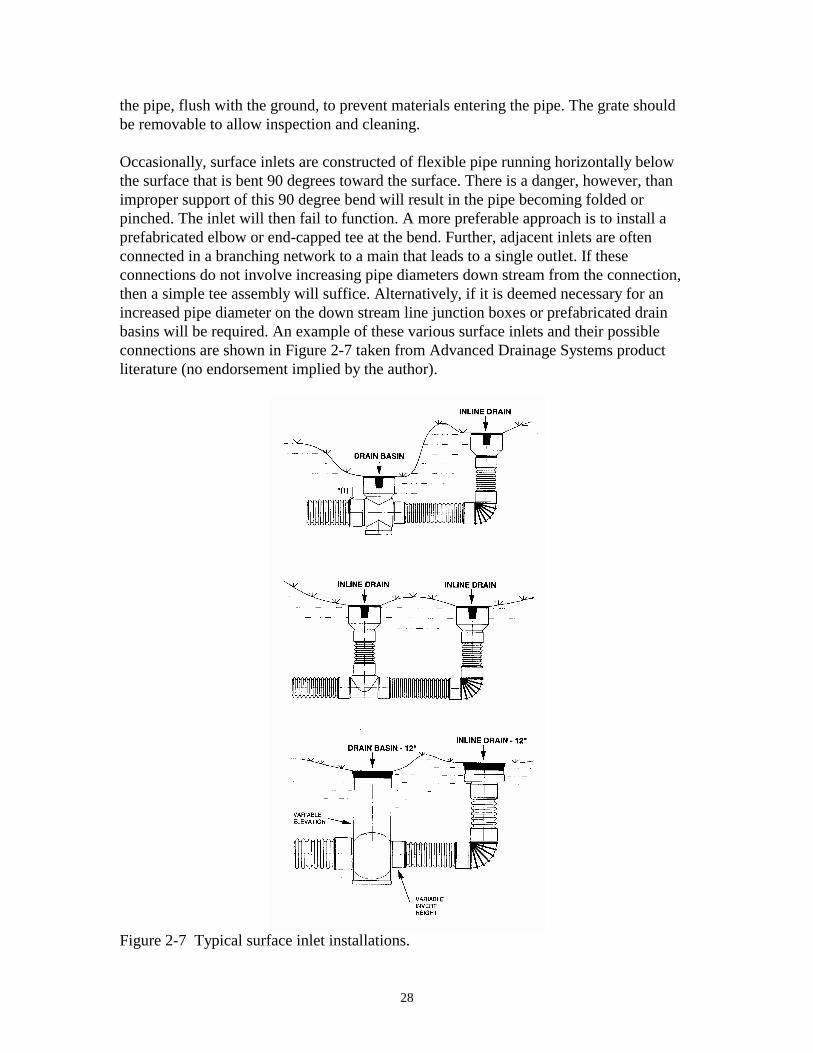
the pipe, flush with the ground, to prevent materials entering the pipe. The grate should be removable to allow inspection and cleaning. Occasionally, surface inlets are constructed of flexible pipe running horizontally below the surface that is bent 90 degrees toward the surface. There is a danger, however, than improper support of this 90 degree bend will result in the pipe becoming folded or pinched. The inlet will then fail to function. A more preferable approach is to install a prefabricated elbow or end-capped tee at the bend. Further, adjacent inlets are often connected in a branching network to a main that leads to a single outlet. If these connections do not involve increasing pipe diameters down stream from the connection, then a simple tee assembly will suffice. Alternatively, if it is deemed necessary for an increased pipe diameter on the down stream line junction boxes or prefabricated drain basins will be required. An example of these various surface inlets and their possible connections are shown in Figure 2-7 taken from Advanced Drainage Systems product literature (no endorsement implied by the author).
Figure 2-7 Typical surface inlet installations.

29
Similar to small depressions on fairways, small diversions placed on the side of a hill could be drained using a surface inlet. These small diversions are similar to terraces used in agricultural practices. Essentially, when the downslope area needing protection from runoff is small, such as within a greens complex, an embankment located along the contour impounds and directs runoff to the deepest point in the diversion, usually the center. A surface inlet is then installed at this deepest location. The proper size of drain pipe to convey flow from a surface inlet is typically found by estimating peak runoff rate for the area being drained and using a drainage pipe capacity chart. Yet, the Rational Method approach used before is not appropriate for small, localized depressions on a golf course. We can, however, use the Rational Method to determine the largest land area that can be drained under a given set of conditions. For example, a 6-inch diameter, corrugated drain pipe when laid at a 0.5% slope has a flow capacity of about 0.29 cubic feet per second (Table 2-5). What, then is the maximum surface area that this pipe can drain for a high intensity rainstorm in a given geographical region. Choosing a 50-year, 8-minute duration rainstorm at St. Louis, MO we find the rain intensity from Fig. 2-1 to be 12 inches per hour. A worst-case scenario runoff coefficient gives us a C value of 0.6 (for a steeply sloped area with a tight clay soil). By using A = Q/(C x i) we find the area to be 0.4 acres or 1740 square feet. This also is a circular area having a diameter of 47 feet. Thus, for virtually all turf surfaces, a 6-inch pipe should adequately drain a circular, 47 feet diameter depression having similar rain intensities as St. Louis, MO. The table below gives corresponding areas (and circular depression diameters) for a range of pipe sizes and three diverse geographical regions. Table 2-7 Diameters of horizontal pipe connected to surface inlets that adequately drain
localized depressions under extreme rain intensity and soil conditions. Select the appropriate depression area (or circular diameter) for your geographic region (see Fig. 2-2) and read pipe diameter on the right.
Regional Rain Intensity Adjustment Factor†
0.6 1.0 1.4 Area, sq ft (Circular Diameter, ft) Pipe Diameter, inch‡
980 (35) 590 (27) 420 (23) 4 2890 (61) 1740 (47) 1240 (40) 6 6220 (89) 3730 (69) 2670 (58) 8
11000 (120) 6780 (93) 4840 (79) 10 18000 (150) 11000 (120) 7860 (100) 12
33000 20000 14000 15 54000 32000 23000 18 82000 49000 35000 21
116000 70000 50000 24 † The given regional adjustment factors apply, for example, to northern Michigan (0.6),
eastern Missouri (1.0) and south Florida (1.4). ‡ Assuming corrugated drain pipe at 0.5% slope, a C value of 0.6, and a 50-year, 8-
minute duration rain intensity.
30
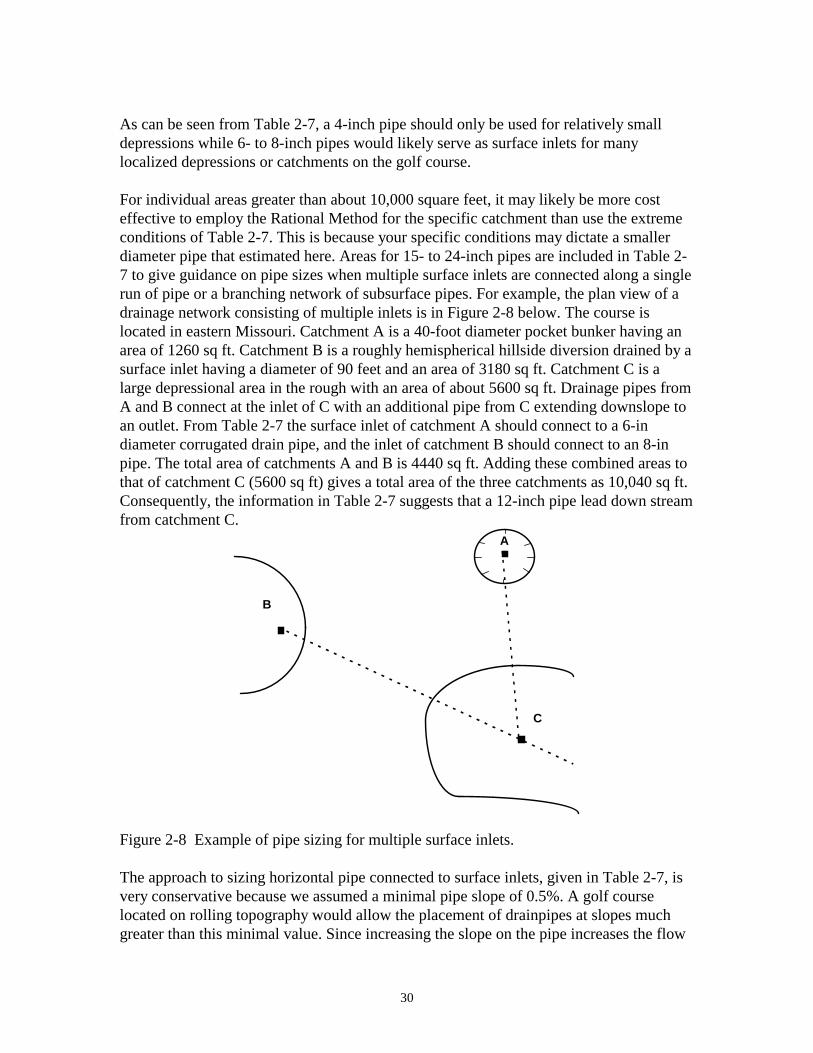
As can be seen from Table 2-7, a 4-inch pipe should only be used for relatively small depressions while 6- to 8-inch pipes would likely serve as surface inlets for many localized depressions or catchments on the golf course. For individual areas greater than about 10,000 square feet, it may likely be more cost effective to employ the Rational Method for the specific catchment than use the extreme conditions of Table 2-7. This is because your specific conditions may dictate a smaller diameter pipe that estimated here. Areas for 15- to 24-inch pipes are included in Table 2-7 to give guidance on pipe sizes when multiple surface inlets are connected along a single run of pipe or a branching network of subsurface pipes. For example, the plan view of a drainage network consisting of multiple inlets is in Figure 2-8 below. The course is located in eastern Missouri. Catchment A is a 40-foot diameter pocket bunker having an area of 1260 sq ft. Catchment B is a roughly hemispherical hillside diversion drained by a surface inlet having a diameter of 90 feet and an area of 3180 sq ft. Catchment C is a large depressional area in the rough with an area of about 5600 sq ft. Drainage pipes from A and B connect at the inlet of C with an additional pipe from C extending downslope to an outlet. From Table 2-7 the surface inlet of catchment A should connect to a 6-in diameter corrugated drain pipe, and the inlet of catchment B should connect to an 8-in pipe. The total area of catchments A and B is 4440 sq ft. Adding these combined areas to that of catchment C (5600 sq ft) gives a total area of the three catchments as 10,040 sq ft. Consequently, the information in Table 2-7 suggests that a 12-inch pipe lead down stream from catchment C.
A
B
C
Figure 2-8 Example of pipe sizing for multiple surface inlets. The approach to sizing horizontal pipe connected to surface inlets, given in Table 2-7, is very conservative because we assumed a minimal pipe slope of 0.5%. A golf course located on rolling topography would allow the placement of drainpipes at slopes much greater than this minimal value. Since increasing the slope on the pipe increases the flow

31
velocity and the corresponding pipe capacity, then greater slopes would allow the use of smaller diameter pipes than given in Table 2-7. Thus, if the slope on the pipe exceeds 0.5%, the pipe diameter indicated from Table 2-7 can be corrected downward provided the pipe slope exceeds a set threshold value. The information for downward adjustment of pipe diameters with increasing slope is given in Table 2-8. Table 2-8 Corrected pipe diameters for installations where the minimum slope along the
horizontal run of pipe exceed 0.5%.
Table 2-7 Pipe Diameter Pipe Slope Greater Than Corrected Pipe Diameter (inch) (%) (inch)
6 3 4 8 2.5 6 8 16 4
10 2 8 10 8 6 10 50 4 12 4.5 8 12 24 6 15 17 8 18 50 8
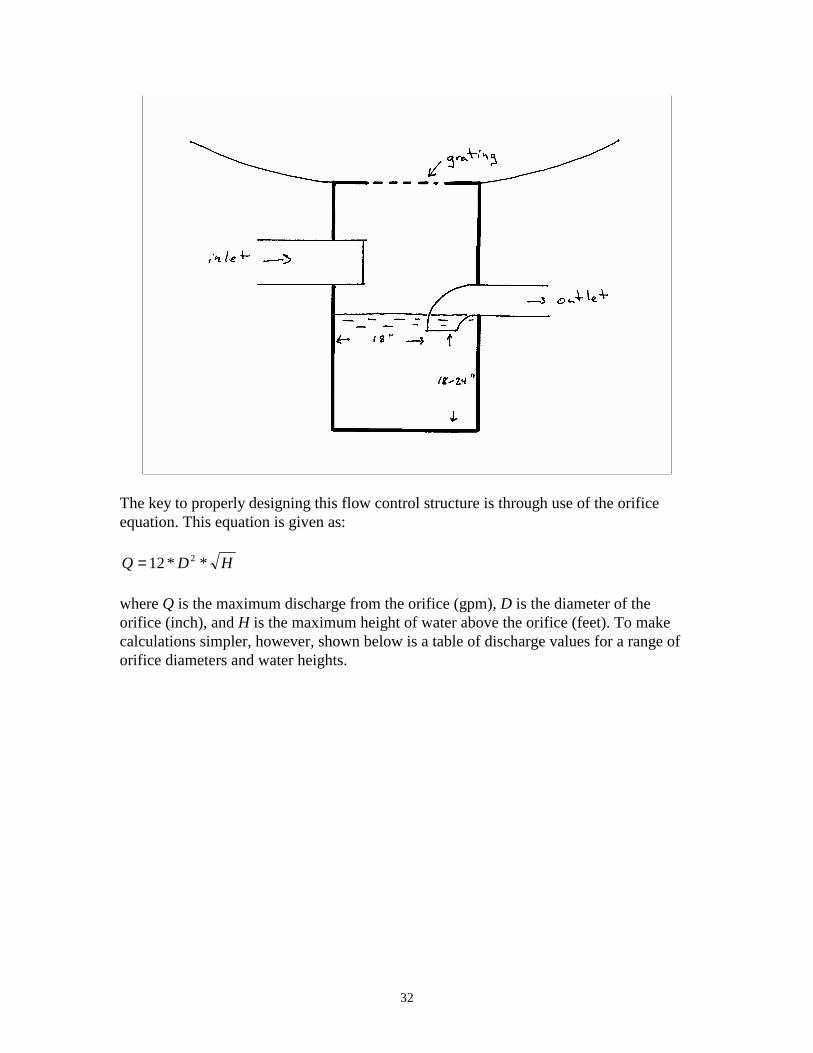
The approach described in Tables 2-7 and 2-8 constitutes a practical means to plan a network of catch basins for the course when individual connected areas are too small for a reasonable application of the Rational Method. Pipe Flow Control It may be desirable to control the flow through a subsurface pipe system. Perhaps you are installing some surface inlets and wish to connect them to a preexisting subsurface drainage array. Yet you do not with to pressurize the preexisting system. Or, perhaps you are installing some surface inlets and chose to use 4-inch corrugated pipe when the design calls for eight. Finally, you may need or wish to be a good neighbor and want to slow the discharge off the course. These objectives can be met using some form of pipe flow control. One common means of pipe flow control is shown in the figure below. Essentially, this is a cistern or basin that has sufficient strength and integrity to contain ponded water for a brief period of time. Also important is the down-turned elbow directing flow out of the structure. Commonly, this structure would be placed in a surface depression to increase storage capacity. Thus, during a rainstorm, the large discharge(s) arriving at the structure will quickly fill the basin and the surrounding surface depression with water. The structure will subsequently drain but in a more slower and controlled fashion.
32
The key to properly designing this flow control structure is through use of the orifice equation. This equation is given as:
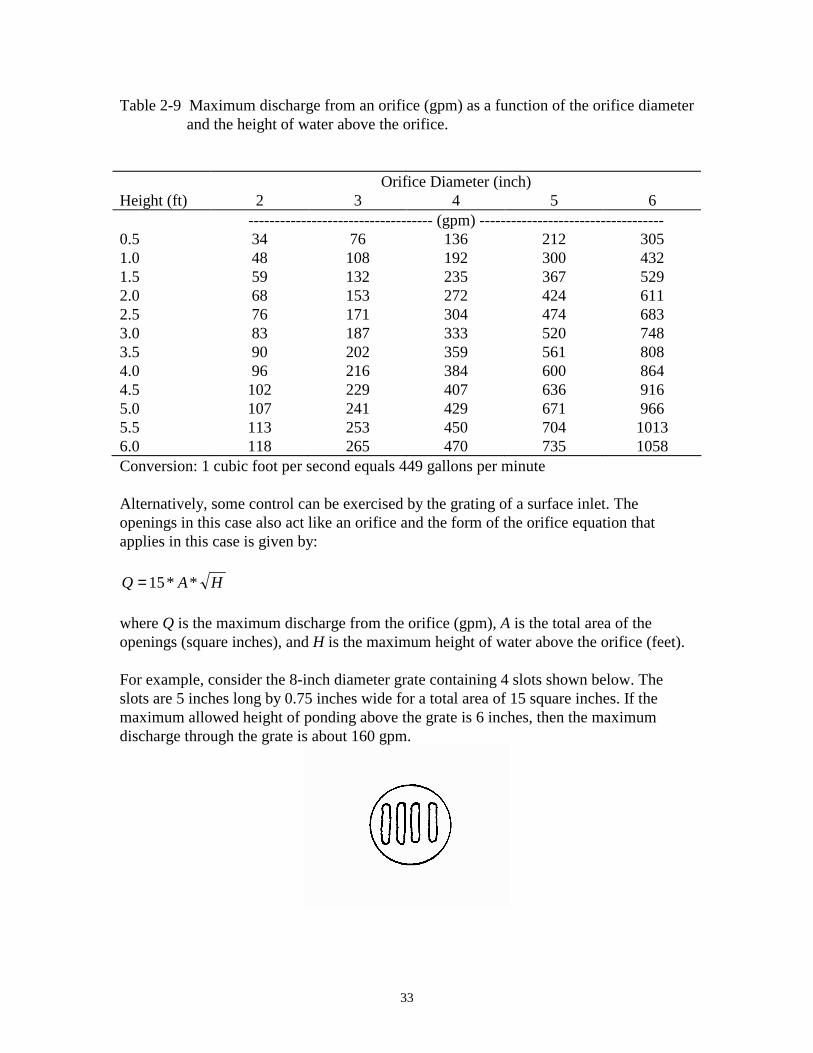
HDQ **12 2= where Q is the maximum discharge from the orifice (gpm), D is the diameter of the orifice (inch), and H is the maximum height of water above the orifice (feet). To make calculations simpler, however, shown below is a table of discharge values for a range of orifice diameters and water heights.
33
Table 2-9 Maximum discharge from an orifice (gpm) as a function of the orifice diameter and the height of water above the orifice.
Orifice Diameter (inch) Height (ft) 2 3 4 5 6 ----------------------------------- (gpm) ----------------------------------- 0.5 34 76 136 212 305 1.0 48 108 192 300 432 1.5 59 132 235 367 529 2.0 68 153 272 424 611 2.5 76 171 304 474 683 3.0 83 187 333 520 748 3.5 90 202 359 561 808 4.0 96 216 384 600 864 4.5 102 229 407 636 916 5.0 107 241 429 671 966 5.5 113 253 450 704 1013 6.0 118 265 470 735 1058 Conversion: 1 cubic foot per second equals 449 gallons per minute Alternatively, some control can be exercised by the grating of a surface inlet. The openings in this case also act like an orifice and the form of the orifice equation that applies in this case is given by:
HAQ **15= where Q is the maximum discharge from the orifice (gpm), A is the total area of the openings (square inches), and H is the maximum height of water above the orifice (feet). For example, consider the 8-inch diameter grate containing 4 slots shown below. The slots are 5 inches long by 0.75 inches wide for a total area of 15 square inches. If the maximum allowed height of ponding above the grate is 6 inches, then the maximum discharge through the grate is about 160 gpm.

34
Of course, gratings can become plugged with leaves or other debris, and may occasionally deliver less water to the drainage system than the quantity calculated by the orifice equation. If this happens, then unexpected surface ponding may occur. Surface Runoff Interceptors Diversions collect and direct larger runoff volumes as open channel flow across the surface. Diversions protect relatively larger areas downslope. When the area needing protection is small, as in a greens complex, a teeing area, an individual bunker; and when the hillside area is too small for a swale and embankment, then surface runoff interceptors can be used to intercept the surface runoff and direct it underground. Essentially, a surface runoff interceptor consists of a gravel or coarse sand filled trench that is cut along the contour and perpendicular to the overland flow. Sizing of these trenches vary depending on the available equipment and allowable disruption of the turf area. French drains are commonly 4- to 6-inch wide trenches backfilled with pea gravel. These are best employed as a single line in roughs or other higher mowed turf situations and when slopes are short and steep. If the French drain additionally contains a perforated drainage pipe in the trench bottom, then this is referred to in the drainage literature as a blind inlet. Slit drains are narrower, up to 2-inches wide, backfilled with coarse sand and often placed as an array with spacing of 3 to 4 feet. Slit drains are best employed in finer turf areas (such as within a fairway) where turf is mowed shorter and for longer, less steep slopes. Indeed, slit drains are often sufficiently narrow so that turf may grow across the slits resulting in essentially invisible structures. A commercial slit drain installation procedure where the slit contains a small diameter pipe is called the Cambridge System. The Cambridge System has a 1-inch wide, perforated, oval pipe that is placed in the trench during a one-step trenching and backfilling operation. With certain exceptions, both French drains and slit drains should additionally be installed with a grade along their run to move water through the trench to an outlet. One exception is when the subsoil is sandy or gravely, allowing rapid water drainage from the trench. The other exception (occasionally seen in slit drains) is when the bottom of the trench periodically intersects the gravel envelope of a subsurface drainage system. When water movement along the trench is not assisted by placement of a pipe in the trench, the trench grade will need to be greater than 2%. Placement of a pipe in the trench allows less steep grades down to 0.5%. Surface runoff interceptors require maintenance and special care to ensure that the gravel or coarse sand backfill does not become capped with the surrounding soil. For French drains this is less of a concern unless the trench is incompletely filled and firmed. The narrow slit drains, however, can become quite easily capped over time. Although not always practical, occasional sand topdressing of the area contain a slit drainage array should help avoid capping of the individual interceptor elements.

35
Finally, in creating an array of trenches across an area with these trenches connected to a positive outlet, some degree of subsurface drainage is obtained. Conclusion A grass-lined channel corresponding to the dimensions of the nomograph of Figure 2-5 and flowing full will conduct flow at 3 feet per second (fps). Additionally, a 6-inch diameter smooth walled pipe flowing full at 1% slope will also yield a flow velocity of 3 fps. Three feet per second is 60 yards per minute or about 1 mile in half an hour. Thus, a parcel of water flowing in these storm control structures when flowing full could easily leave the golf course in less than a half an hour. Of course, as the storm subsides and flows are less than capacity, the flow velocities will decrease. Essentially what I am trying to illustrate is that a golf course, fully equipped with surface runoff structures should flush like a toilet. Rational control may be exercised on the drainage, however, through the use of a flow control structure.

36
Chapter 3: Subsurface Drainage of Fairways and Roughs Subsurface drainage is the removal of excess subsurface water by using an underground system of perforated pipes. The key to understand subsurface drainage is knowing how excess subsurface water occurs. Rainfall that infiltrates into the soil surface generally percolates downward through the soil profile until it reaches a saturated zone referred to as groundwater. During periods of higher rainfall and lower evapotranspiration, such as in the spring and fall in the midwest U.S., the upper surface of the groundwater (the water table) rises in the soil profile. When the water table approaches the soil surface, then waterlogged conditions described in Chapter 1 occur. Consequently, the underground system of perforated pipes is used to intercept this groundwater, the rising water entering the pipes from below. The pipe system then routes this water to an outlet, and maintains the water table at a reasonable depth below the soil surface. Soils may have poor natural drainage and form elevated water tables for a number of reasons. Landscape positions with elevations close to that of a waterway may have a permanent high water table. Other gently sloped areas far from a waterway may have intermittent high water tables depending on climatic conditions. Some areas may be poorly drained due to seepage from upslope areas or because they are in depressional areas with no drainage outlet. Finally, water drains slowly from soils with low permeability subsurface layers such that, regardless of their position in the landscape, they develop intermittent high water tables. Subsurface Drainage System Design Subsurface drainage on golf courses typically consists of an array of perforated pipes (drain tiles or drain lines) buried at some depth below the soil surface. Design of a subsurface drainage system includes consideration of the pattern of the pipe array, drain spacing and depth, use of envelopes and filters, pipe composition, pipe size and slope. Drain Line Pattern: Subsurface pipe drain lines can be installed as either singular or composite systems. A singular system consists of an array of individual drain lines each emptying into an outlet ditch or waterway. Composite systems consist of laterals connected to a common main line which either empties to an outlet or connects to a larger collector also having an outlet. Composite systems are typically preferred because they have only a single outlet, further, composite systems function better on sloping terrain that is typically present on golf courses. One key feature of both systems and essential to a proper functioning drainage system is that all drain lines eventually empty to a positive outlet. Design and construction of outlets will be covered in a later chapter. Composite systems can have a variety of patterns consisting of either a gridiron, herringbone, or random. Gridiron and herringbone patterns are used to drain larger areas where no portion of the area is less important or less in need of drainage than another. Random drains are used when small localized areas need drainage while areas in between are well drained. In layout of a random drain system, mains often follow natural swales
37
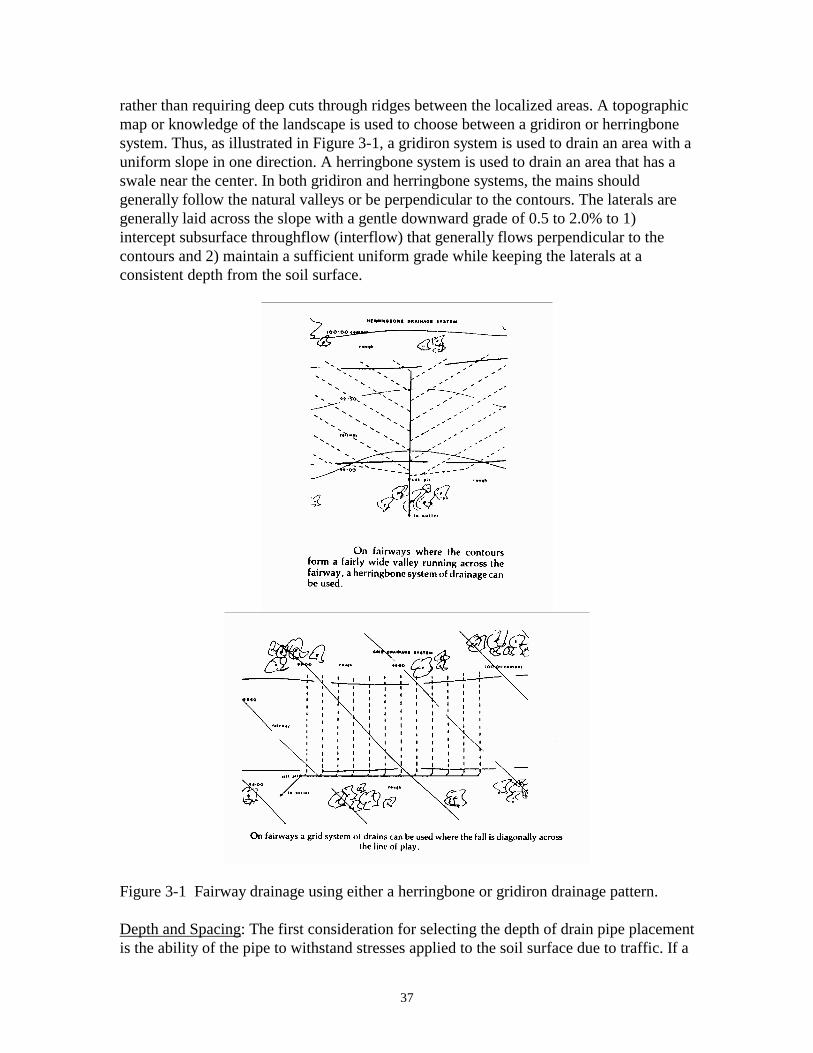
rather than requiring deep cuts through ridges between the localized areas. A topographic map or knowledge of the landscape is used to choose between a gridiron or herringbone system. Thus, as illustrated in Figure 3-1, a gridiron system is used to drain an area with a uniform slope in one direction. A herringbone system is used to drain an area that has a swale near the center. In both gridiron and herringbone systems, the mains should generally follow the natural valleys or be perpendicular to the contours. The laterals are generally laid across the slope with a gentle downward grade of 0.5 to 2.0% to 1) intercept subsurface throughflow (interflow) that generally flows perpendicular to the contours and 2) maintain a sufficient uniform grade while keeping the laterals at a consistent depth from the soil surface.
Figure 3-1 Fairway drainage using either a herringbone or gridiron drainage pattern. Depth and Spacing: The first consideration for selecting the depth of drain pipe placement is the ability of the pipe to withstand stresses applied to the soil surface due to traffic. If a
38
drain line becomes crushed by heavy wheeled traffic it will fail to function. Two feet is the commonly recommended minimum depth of cover over clay and concrete drain pipe. Minimum depths of cover for corrugated plastic pipe range from 12 inches (ADS Product Note 3.116) to 2 feet (ASTM D 2321-89) when the pipe is embedded in a gravel envelope. As mentioned in Chapter 1, the goal of subsurface drainage for agricultural production is lowering of the water table for deeply rooted crop species. This would argue in favor of deeper placement of drain lines. Excessively deep placement of a drain line into impervious subsoil material, however, leads to a failure of the drainage system since the low permeability of the subsoil would inhibit water reaching the drains in a timely fashion. Further, excessively deep placement results in higher construction costs. Thus, in agricultural drainage a compromise must be found. This compromise is expressed in Table 3-1 of average depth and spacing of pipe drains dependent on soil texture. Note that very deep and widely spaced tiles are normally employed for irrigated soils. This is because irrigated soils for crop production are generally have high permeabilities and deeply placed drains are needed to promote removal of excess salts. Table 3-1 Average depth and spacing of pipe drains for field crops.
Soil Texture Spacing (ft) Depth (ft) Clay 30 to 50 3.0 to 3.5 Clay loam 40 to 70 3.0 to 3.5 Average loam 60 to 100 3.5 to 4.0 Fine sandy loam 100 to 120 4.0 to 4.5 Sandy loam 100 to 200 4.0 to 5.0 Peat and muck 100 to 300 4.0 to 5.0 Irrigated soils 150 to 600 5.0 to 8.0 These recommended depths and spacing of drains are based on drainage capacity considerations. Further, these recommendations presume that a sufficient freely draining soil depth is available for tile installation. Indeed, installation of subsurface drainage systems for production agriculture where drainage capacity is of principal concern is often considered uneconomical for low permeability, shallow soils. As discussed in Chapter 1, drainage intensity rather than drainage capacity should be the focus for subsurface drainage of golf courses. Additionally, golf course soils often mimic shallow, low permeability soil conditions due to subsoil disruption during course construction. While not studied as thoroughly as agricultural drainage, golf course applications typically adopt a shallower placement of drain lines and necessarily closer spacing. Based on soil drainage from an intensity point of view, therefore, recommended drain line depths range from 2 to 2.5 feet to trench bottom (invert) with spacing up to 30 feet on high permeability soils to as little as 15 feet on low permeability soils. Deeper depths should correspond with wider spacing and vice versa.
39
Drainage Envelopes: Subsurface drainage pipe can be inserted directly into soil using drainage plows. This is a common practice in agricultural drainage, since the operation can be conducted with precision and lower expense. Excavating a trench and surrounding the drain line with an aggregate envelope, however, provides several advantages over direct placement: 1) An aggregate base provides improved bedding of the drain pipe to protect against soil settling and a loss of grade. 2) An aggregate envelope will protect the pipe from crushing without the need for tamping. 3) The envelope increased effective surface area for water inflow into the drainage system, allowing more rapid drainage rates. 4) An envelope acting as a filter can help prevent the migration of soil particles into the drain line. 5) And, an aggregate envelope allows for future surface drainage improvements such as the use of slit drains. In this case, the gravel envelope of the subsurface drain line is cross connected with the sand of the slit drain providing a positive outlet for the slit drainage system. In the drainage trench, aggregate envelope method of installing subsurface drain pipe, it is recommended (ASTM D 2321-89) that a minimum of 4 inches of aggregate extend below the pipe and a minimum of 6 inches extend above the pipe. Width of the trench should be adequate to allow a minimum of 8 inches (ASTM) on either side of the pipe. While these are recommended dimensions of an installation, frequently these dimensions are reduced in golf course practices. A less conservative recommendation is for a minimum of 2 inches of aggregate envelope surrounding the pipe with a minimum of 4 inches over the crown of the pipe. If filtering of particles is not of concern, aggregate can be composed of clean gravel, slag, crushed stone or even shells having diameters no greater than 1/6 of the pipe diameter. In soils with piping or migration potential such as uniformly sized sands, or sand-silt mixtures (to name a few) it is possible that the flow of water into the drain pipe will carry these soil particles into the pipe, eroding the trench and plugging the pipe. Proper sizing of the aggregate envelope is then needed to prevent particle migration. This step will require testing of the soils and recommendations from a drainage engineer. Finally, a sufficient depth of topsoil should cover the aggregate envelope. Commonly, a minimum of 6 inches of topsoil is applied to cap the trench to provide an adequate depth of growing medium for the turf. The topsoil should have an adequate water and nutrient holding capacity to support the turf. Otherwise, the trench lines may show a different color and turf density during stressful periods. If there are questions regarding the quality of topsoil, then a deeper depth of soil may be required over the aggregate envelope. Drainage Pipe Composition: Corrugated plastic tubing is the most widely used type of subsurface drainage material, replacing concrete and clay tile. The corrugated plastic tubing is made of polyethylene or polyvinylchloride and is resistant to acid soils and freezing. It has deep corrugations, which gives it strength, especially when installed with lateral support such as an aggregate envelope. As such, corrugated plastic pipe can be placed at a shallower depth than concrete or clay. Corrugated plastic pipe may be either

40
single walled having corrugations on the inside or double walled containing a smooth lining. Water enters the tubing through small slots, placed between the corrugations, that extend around the circumference and along the length of the pipe. Some manufactures market a slitted pipe that is used when pipes are to be placed directly in medium to coarse textured sands. This step is designed to reduce the need for a filtering envelope surrounding the pipe. The tubing is manufactured in long, continuous lengths ranging from 500 feet for 2-inch diameter pipe to 240 feet for 4-inch diameter pipe. Corrugated tubing larger than 6 inches is usually made in 20-foot lengths. The plastic tubing is unbreakable and flexible. The cost of plastic tubing is currently about the same as clay or concrete tile as a result of lower shipping weights and easier handling. Concrete and clay tiles are usually manufactured in 1-foot long sections for subsurface drainage. The tiles are placed with small separations between individual tiles to allow water entry into the drainage system. Standard-quality concrete tiles are resistant to freezing and thawing but should not be used in acidic soils or when exposed to low pH waters. Standard-quality clay tiles are not affected by low pH water, but are likely to be damaged by exposure to freezing and thawing. Both concrete and clay tiles should be placed with at least two feet of cover. Panel drains, also called edge drains, fin drains, or simply flat pipe; are relatively new to the drainage industry and generally consist of narrow and elongated drainage structures. Early designs were made of a plastic, cuspated (egg-carton) core surrounded by a geotextile fabric. More recently, panel drains have the appearance of a post-supported flattened, corrugated pipe (e.g. ADS AdvanEDGE). Panel drain dimensions range from 1 to 2-inches thick and from 4 to 18-inches wide. These drain lines were designed as edge drains for use along foundations, roadbeds, and railways. They were designed for vertical placement in the soil. As such, trench widths can be substantially reduced as compared with circular pipe. A proposed ASTM standard method calls for a minimum of 3 to 6 inches plus the thickness of the product being installed (ADS literature calls for a 4-inch overall trench thickness for AdvanEDGE pipe). This installation thus results in the use of less gravel in the aggregate envelope than circular pipe. Hydraulic performance data for use in subsurface drainage design is, to the author’s knowledge, currently unavailable. This, however, may not be much of a problem if the panel pipe is used as laterals for the relatively short runs expected in golf course applications. Geotextiles: Geotextiles are a woven, synthetic fiber, fabric that is designed to serve, among other things, as a filter envelope. These products come in a variety of weaves and fiber compositions. Geotextiles are used in drainage applications in an effort to eliminate particle migration into the drainage pipe. In this case, corrugated plastic pipe is wrapped with the geotextile fabric to blind or eliminate soil particle migration. This material is also used as a perimeter wrap in cuspated panel pipes. Geotextiles have also been used to cap or line drainage trenches in bunkers, and (unfortunately) as a replacement for the intermediate layer in a USGA style green.

41
Geotextiles are proving to be an unreliable drainage system material. Though its use is sound in practice, there are many reported instances of the filter fabric becoming clogged. In some cases, the clogging occurs as a filter cake, where fine sand and silt particles simply build up on the fabric to restrict flow. In other cases, geotextile clogging may result from biofouling, wherein anaerobic conditions, on the external, wet side of the fabric, favor bacteria that produce a slimy capsule. This slimy material, subsequently plugs the fabric pores and restricts drainage. Consequently, the use of geotextiles in drainage is not generally recommended. Drainage Pipe Size and Slope: Subsurface drain lines are designed to function as open channels. What this means is that flow in drainage pipes is expected to occur with an air-water interface throughout the entire length of the pipe. Thus, water flows through the pipe under the influence of gravity due to the slope or grade of the pipe, not because there is a pressure pushing water through the pipe. If, however, a subsurface drainage pipe is asked to convey more water than it was designed for, it will first fill to capacity and then become pressurized along some portion of the flow length. When drainage pipes become pressurized, the water tries to escape through the inlet holes of the pipe. This creates a pressure on the water in the drain line trench that can result in the soil surrounding the pipe becoming liquefied. This liquefied soil can become flowable and is easily eroded. Thus, at the extreme, pressurization can cause the drainage pipe to erode out of its trench and subsequently require extensive repair. This is particularly true near the outlet of a long run of pipe at a steeper slope. Substantial water pressures can develop near the outlet and erode the soil from the outlet end of the pipe. Pipe pressurization has also been observed to create a water ‘lens’ between the turf and the soil. In this case, the turf and thatch layer essentially floats off of the soil surface causing play and maintenance problems. The key is to properly size the drainage pipe, taking into account the expected flows, so the pipe behaves as a open channel. Drainage laterals usually collect water uniformly along their entire length. This quantity of water is then discharged into collector mains that convey the collected water to a convenient discharge location. The quantity of water collected by a drainage system is a product of the area being drained and the rate of water loss from the soil profile. In subsurface drainage, this rate of water loss is approximated by the rate at which the water table moves deeper in the soil profile. The limiting factor, in this case is the soil’s permeability and the distance water must travel to get to the drain. Essentially, water cannot get into a drain any faster than the soil below, beside and above the drain can conduct water into it. Measuring the soil permeability and determining its likely pathway to a drain can be a rather complex process. Thus, for design purposes, drainage engineers utilize a factor called the drainage coefficient as an estimate of water loss from the soil profile. Drainage coefficient values applicable to native soils found in fairways and roughs are given in Table 3-2. Note that these drainage coefficients have units of inches per day and are given
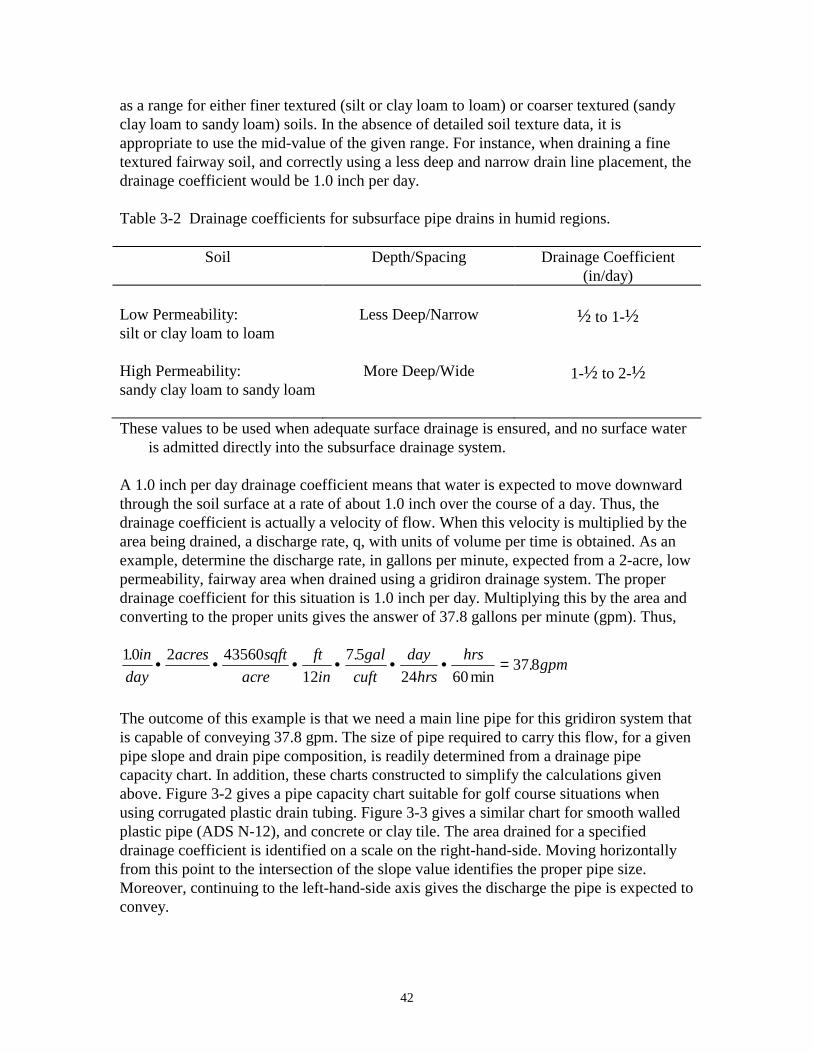
42
as a range for either finer textured (silt or clay loam to loam) or coarser textured (sandy clay loam to sandy loam) soils. In the absence of detailed soil texture data, it is appropriate to use the mid-value of the given range. For instance, when draining a fine textured fairway soil, and correctly using a less deep and narrow drain line placement, the drainage coefficient would be 1.0 inch per day. Table 3-2 Drainage coefficients for subsurface pipe drains in humid regions.
Soil Depth/Spacing Drainage Coefficient (in/day)
Low Permeability: silt or clay loam to loam
Less Deep/Narrow ½ to 1-½
High Permeability: sandy clay loam to sandy loam
More Deep/Wide 1-½ to 2-½
These values to be used when adequate surface drainage is ensured, and no surface water
is admitted directly into the subsurface drainage system. A 1.0 inch per day drainage coefficient means that water is expected to move downward through the soil surface at a rate of about 1.0 inch over the course of a day. Thus, the drainage coefficient is actually a velocity of flow. When this velocity is multiplied by the area being drained, a discharge rate, q, with units of volume per time is obtained. As an example, determine the discharge rate, in gallons per minute, expected from a 2-acre, low permeability, fairway area when drained using a gridiron drainage system. The proper drainage coefficient for this situation is 1.0 inch per day. Multiplying this by the area and converting to the proper units gives the answer of 37.8 gallons per minute (gpm). Thus, 10 2 43560
127 5
24 6037 8. .
min.in
dayacres sqft
acreftin
galcuft
dayhrs
hrs gpm• • • • • • =
The outcome of this example is that we need a main line pipe for this gridiron system that is capable of conveying 37.8 gpm. The size of pipe required to carry this flow, for a given pipe slope and drain pipe composition, is readily determined from a drainage pipe capacity chart. In addition, these charts constructed to simplify the calculations given above. Figure 3-2 gives a pipe capacity chart suitable for golf course situations when using corrugated plastic drain tubing. Figure 3-3 gives a similar chart for smooth walled plastic pipe (ADS N-12), and concrete or clay tile. The area drained for a specified drainage coefficient is identified on a scale on the right-hand-side. Moving horizontally from this point to the intersection of the slope value identifies the proper pipe size. Moreover, continuing to the left-hand-side axis gives the discharge the pipe is expected to convey.
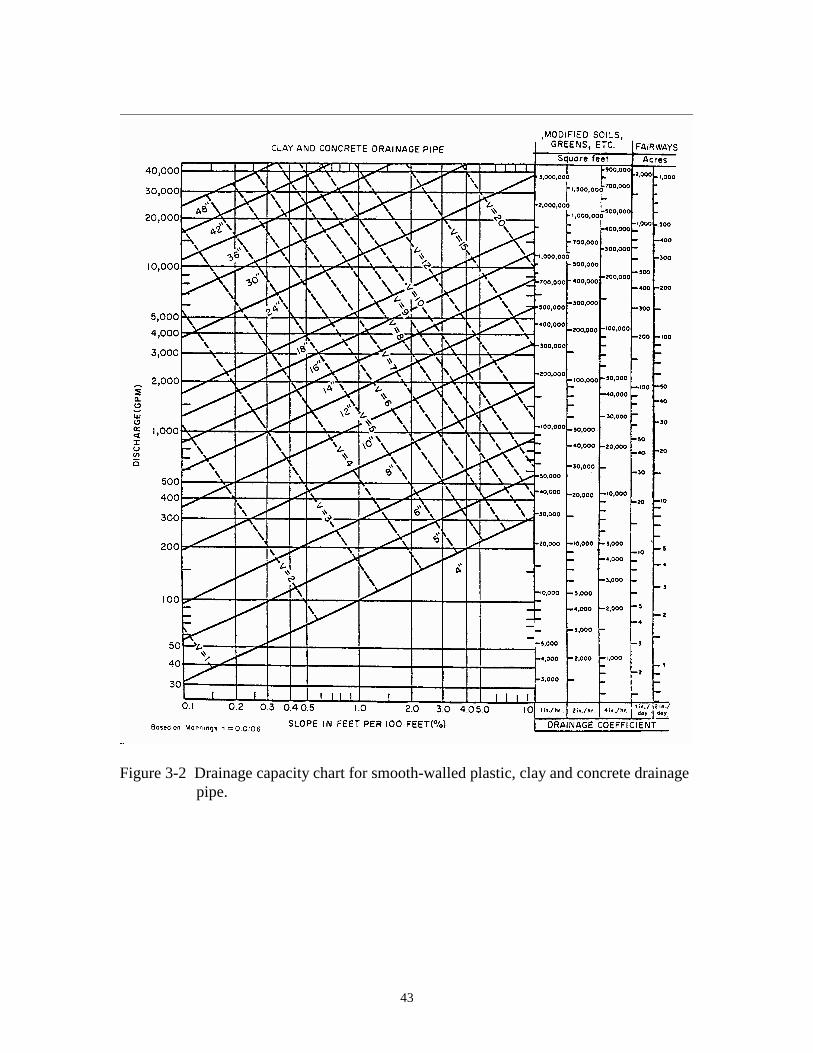
43
Figure 3-2 Drainage capacity chart for smooth-walled plastic, clay and concrete drainage
pipe.
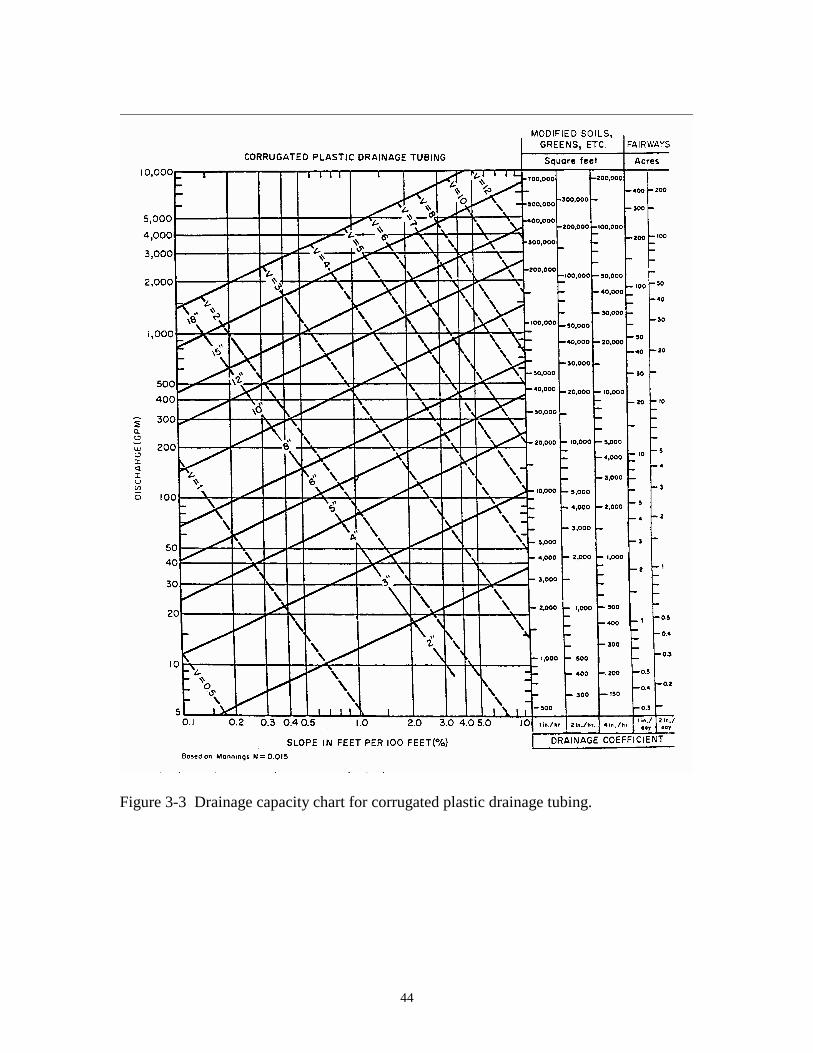
44
Figure 3-3 Drainage capacity chart for corrugated plastic drainage tubing.
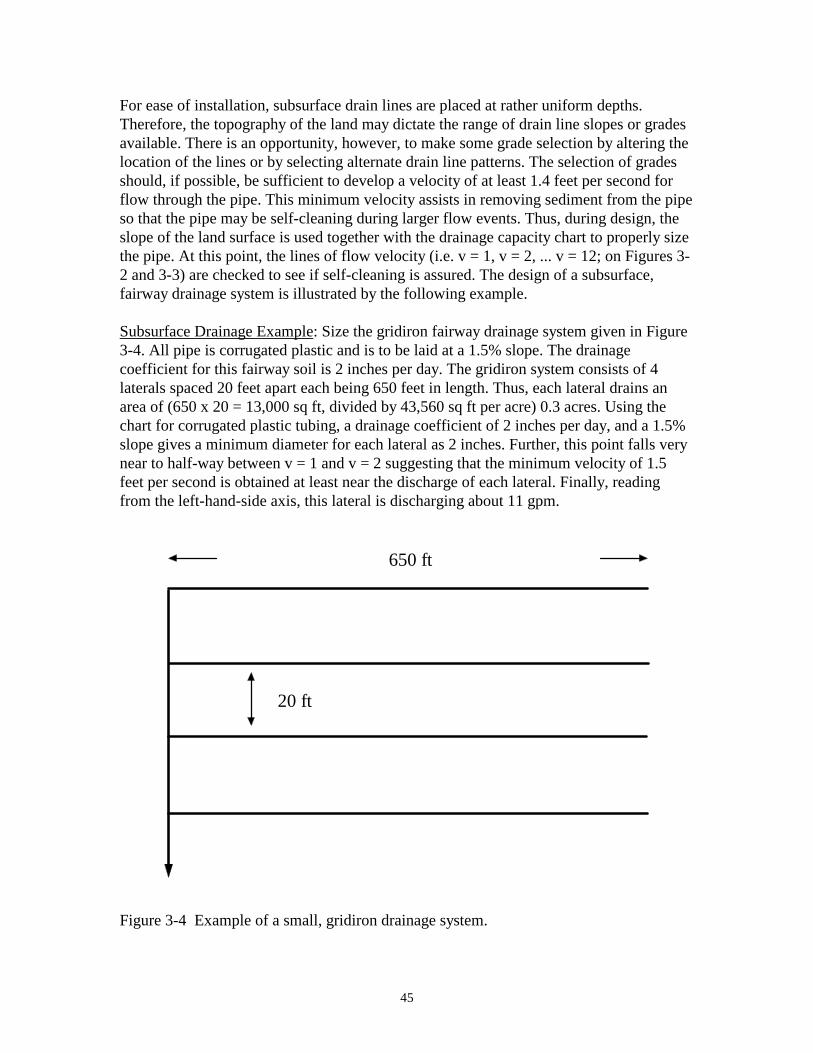
45
For ease of installation, subsurface drain lines are placed at rather uniform depths. Therefore, the topography of the land may dictate the range of drain line slopes or grades available. There is an opportunity, however, to make some grade selection by altering the location of the lines or by selecting alternate drain line patterns. The selection of grades should, if possible, be sufficient to develop a velocity of at least 1.4 feet per second for flow through the pipe. This minimum velocity assists in removing sediment from the pipe so that the pipe may be self-cleaning during larger flow events. Thus, during design, the slope of the land surface is used together with the drainage capacity chart to properly size the pipe. At this point, the lines of flow velocity (i.e. v = 1, v = 2, ... v = 12; on Figures 3-2 and 3-3) are checked to see if self-cleaning is assured. The design of a subsurface, fairway drainage system is illustrated by the following example. Subsurface Drainage Example: Size the gridiron fairway drainage system given in Figure 3-4. All pipe is corrugated plastic and is to be laid at a 1.5% slope. The drainage coefficient for this fairway soil is 2 inches per day. The gridiron system consists of 4 laterals spaced 20 feet apart each being 650 feet in length. Thus, each lateral drains an area of (650 x 20 = 13,000 sq ft, divided by 43,560 sq ft per acre) 0.3 acres. Using the chart for corrugated plastic tubing, a drainage coefficient of 2 inches per day, and a 1.5% slope gives a minimum diameter for each lateral as 2 inches. Further, this point falls very near to half-way between v = 1 and v = 2 suggesting that the minimum velocity of 1.5 feet per second is obtained at least near the discharge of each lateral. Finally, reading from the left-hand-side axis, this lateral is discharging about 11 gpm.
650 ft
20 ft
Figure 3-4 Example of a small, gridiron drainage system.

46
The main of this gridiron system is composed of 4 sections, each carrying the outflow from an additional lateral. Thus, the furthest upstream main section is the same size as one of the laterals, 2 inches. The second main drains twice the area as a single lateral, or 0.6 acres. This area again with a drainage coefficient of 2 inches per day at 1.5% slope generates from the chart a pipe size of 3 inches and a velocity of about 1.75 feet per second. Thus, the second main should be sized at 3 inches minimum. Following the same approach, the third main section is also sized at 3 inches minimum since the additional 0.3 acres to be drained does not result in a sufficient discharge to necessitate a larger pipe. Finally, the fourth main section must handle the discharge of the entire gridiron system to an outlet. The area is 1.2 acres ( = 0.3 x 4) and the total discharge is about 44 gpm ( = 11 x 4). Using either the area or gpm information with the 1.5% slope gives a pipe size just into the 4 inch range. Thus this pipe should be 4 inches minimum and conveys water at just under 2 feet per second. Notice that in this example, the required pipe sizes were given as minimums. Thus, while the laterals could be as small as 2-inch in diameter, it would be appropriate and may be more convenient to use 4-inch laterals. This is even more true for the mains. Instead of joining short sections of 2- to 3- to 4-inch pipes at each intersection, a 4-inch main throughout would be the most practical. One simplification of this design, however, was the stipulation that the laterals and mains were at a uniform 1.5% slope. This would likely not be the case for an entire system and pipe sizes may need to be adjusted for varying slopes within the overall system. Finally, as a additional precaution against siltation and clogging of drainage pipe, wyes could be placed along the run of a main leading to the outlet. The wyes would be positioned so that the branches extend upslope. It is usually recommended that these wyes occur where the grade of the main changes from steeper to less steep. One branch of the wye would extend to the soil surface and be capped. This would allow access to the drain line for inspection and flushing. Hillside Interceptors Hillside interceptors shown in Figure 3-5 are used to drain areas made wet by hillside seepage. Much of the drainage in hilly areas on the golf course are of this type, particularly at the intersection of a steep slope and a flatter slope. Hillside seepage occurs when the soils on a hill are underlain by a tighter, less permeable layer that restricts vertical water movement. Rainfall on the soils surface percolates downward through the pervious surface soil until it reaches the tighter layer, which may be a clay subsoil, a fragipan or cemented soil layer. The water flows laterally over this less pervious layer until it emerges at the soil surface forming a hillside seep. A seep may occur anywhere along a slope wetting the area below it.

47
Figure 3-5 A subsurface interceptor used to drain a hillside seep. A hillside seep may be drained by a subsurface drain line placed across the hillside nearly perpendicular to the slope above the seep zone. The purpose of this subsurface drain is to intercept the water flowing on the slowly permeable layer before it appears on the soil surface. In this case, the subsurface hillside interceptor acts much like a diversion controlling surface runoff. There may be several seeps, one above the other along the hillslope. In such cases, the upper line of seepage should be intercepted first to help eliminate other seep areas farther down slope. The placement of the interceptor drain line can be determined best by digging test holes when the seep is evident. The test holes should extend, in a grid pattern, upslope from the seep area and to a depth of 2 to 3 feet. By observing the water level in the test holes a day after they are dug, the position of the water table can be located. The drain line should be installed where the water table is 1 to 2 feet below the soil surface. The drain line trench, as described for a subsurface drainage system, should be dug to approximately a 2.5 foot depth. The trench, therefore, will extend below the water table. If the trench is backfilled with gravel to at least the depth of the water table, the water will easily enter the drain line and the seep should be eliminated. Design flow rates for the interceptor drain are shown in Table 3-3. Proper sizing of interceptor pipes is accomplished similar to that for subsurface drainage pipes. The length of interceptor needed together with the soil texture and slope of the hillside will, using Table 3-3, provide a discharge rate in gallons per minute (gpm). For example, a 500 foot hillside seep through a silt loam soil along an 8% slope is expected to discharge from 12 to 24 gpm. Then, using this range of values and for a perforated, corrugated pipe at a 1%
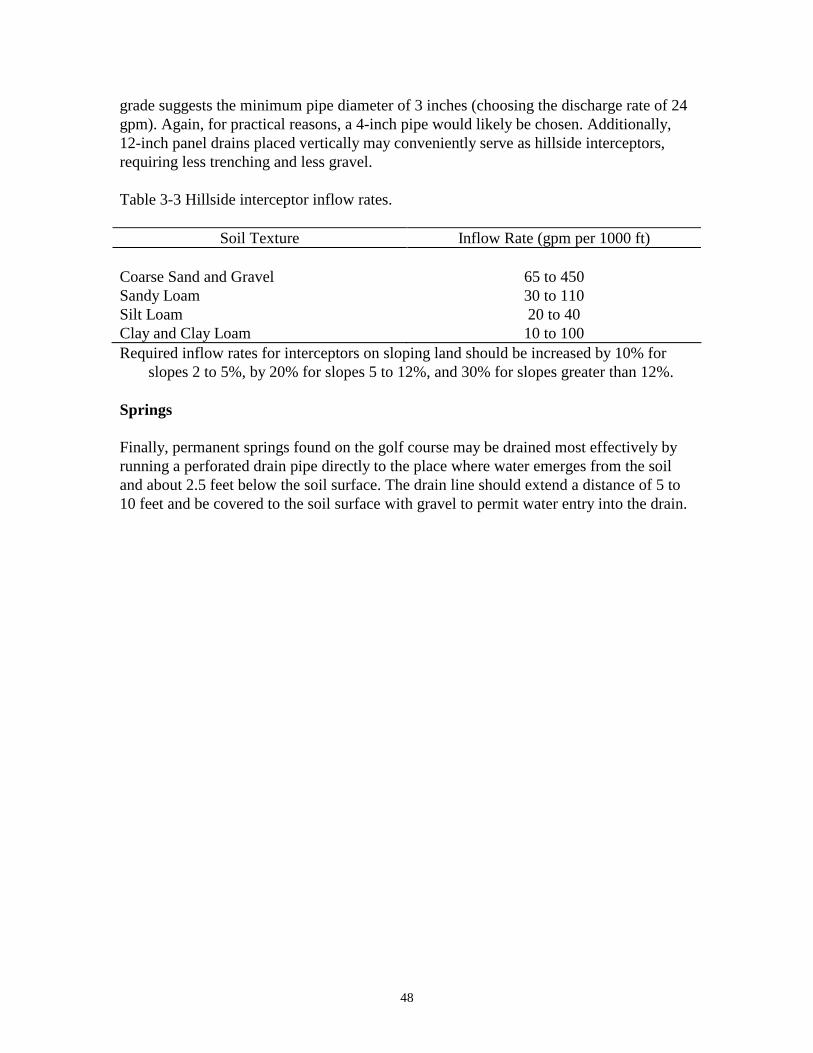
48
grade suggests the minimum pipe diameter of 3 inches (choosing the discharge rate of 24 gpm). Again, for practical reasons, a 4-inch pipe would likely be chosen. Additionally, 12-inch panel drains placed vertically may conveniently serve as hillside interceptors, requiring less trenching and less gravel. Table 3-3 Hillside interceptor inflow rates.
Soil Texture Inflow Rate (gpm per 1000 ft) Coarse Sand and Gravel 65 to 450 Sandy Loam 30 to 110 Silt Loam 20 to 40 Clay and Clay Loam 10 to 100 Required inflow rates for interceptors on sloping land should be increased by 10% for
slopes 2 to 5%, by 20% for slopes 5 to 12%, and 30% for slopes greater than 12%. Springs Finally, permanent springs found on the golf course may be drained most effectively by running a perforated drain pipe directly to the place where water emerges from the soil and about 2.5 feet below the soil surface. The drain line should extend a distance of 5 to 10 feet and be covered to the soil surface with gravel to permit water entry into the drain.
49
Chapter 4: Drainage of Greens, Tees & Sand Bunkers It has been said that the condition of the putting surface is the single most important attribute of a golf course when a golfer chooses where to play. This, therefore, partially explains the emphasis placed on putting green performance. Tees and sand bunkers are also important structures due to their own importance in play and their visibility on the course. It is no surprise, therefore, that drainage is a key feature of all these surfaces, since drainage influences both course playability and agronomic issues. The principles of surface drainage covered in Chapter 2 also apply to greens and tees. The difference here is that most surface drainage concerns are simply addressed by providing appropriate surface slopes to encourage runoff. Further, subsurface drainage principles covered in Chapter 3 can be applied to greens, tees and bunkers as well. The focus in this chapter, however, is on drainage system specifications for various green designs and how root zone and bunker soil profiles influence subsurface drainage system design. Surface Drainage of Greens and Tees A wide variety of putting green soil profiles exist on golf courses. These range from ‘push-up’ greens merely constructed from appropriately shaped soil materials native to the site to highly modified greens constructed to exacting specifications. Regardless of the greens construction approach used, all designs and/or recommendations call for consideration of surface drainage. Providing surface drainage off the green resulted as a consequence of irrigation system development for golf courses in the 1920s. Prior to this time, every effort was made to conserve water on the green resulting in greens that were actually bowl shaped and set into the surrounding terrain providing runoff onto the green. Of course this approach was primarily used for inland courses since courses on links lands typically experience more frequent rainfall. Greens constructed of native soil (i.e. push-up greens) are characterized by the expected low infiltration rate and poor internal drainage typical for high silt and clay content soil materials. In this case, surface drainage represents the only effective method for removal of excess rainwater. To promote surface drainage, these greens typically have more severe slopes and short slope lengths off the green. In addition, push-up greens have a high number of possible pathways for water flow off the green. For optimal surface drainage, therefore, these greens would be essentially dome shaped, or as it is referred to ‘turtle backed’. More modern putting greens, such as the USGA and California designs are constructed with high sand content and freely draining root zone. Consequently, these more modern putting greens can be less reliant on surface drainage. Surface drainage is still an important consideration, however, because even with these high permeability root zones, rainfall rates frequently exceed the root zone infiltration rate. In these modern greens, surface slopes are less severe and slope lengths can be longer. And, with a reduced reliance on surface drainage, effective drainage of high sand content greens can be
50
accomplished with fewer possible pathways for water flow off the green. Current day recommendations are to provide at least 2 to 3 pathways for water flow off the green. Further recommendations are to provide a minimum of 1 to 1.5% slope for surface drainage of these greens. This does not imply that the entire green have at least 1% slope for in this case we would be left with a rather uninteresting green surface. Rather, 1 to 1.5% should represent the minimum average along a given flow pathway. Near the divide of a flow pathway the green can essentially be flat (0% slope) whereas, when flow paths converge to follow off the green the flow pathway will need steeper slopes for rapid drainage of this converging surface water. Indeed, rather than appearing as domes or turtle backs, these more modern greens may appear as a collection of individual watersheds each with its own discharge location off the green. Of course, green slopes must meet both surface drainage and playability requirements. Thus, it has been suggested that for green speeds typical of modern management, the surface slope surrounding the cup should typically be no more that 3% for Bermuda or ryegrass greens or more than 2% for bentgrass greens. Alternatively, green slope may be considered a design feature, at the prerogative of the architect, that is adjusted on a course by course basis. That is, a links land style course may have greens, for the sake of the design, that are more severely and generally contoured. Inland style courses, on the other hand, may be terraced green designs having relatively large, flatter areas. One problem with push-up style greens is that they may not meet both of these requirements. The surface drainage need for steeper slopes may well conflict with playability need for flatter areas surrounding the cup. As with greens, golf tees can be constructed of native soils or using high sand content root zones. Regardless of the construction, golf tees need some degree of slope for surface drainage. Again, slopes of 1 to 1.5% are commonly used in tees as this would provide adequate surface drainage across the smaller tee area. Further, if these slopes are uniform across the tee surface, as in a simple inclined plane, they would be barely noticeable to the golfer. Subsurface Drainage System Layout for Greens and Tees Push-up Greens: A push-up green as mentioned earlier essentially consists of the soil native to the site that has been pushed and shaped to form the green contours. In this regard, the soil of a push-up green would be similar to that of the fairway and rough areas. Correspondingly, a subsurface drainage system for a push-up green would essentially be identical to that covered in Chapter 3 for fairways and roughs. Recall that for subsurface drainage of native soils, the goal is to intercept a rising water table, preventing the water table from approaching the soil surface. Since greens are rather small areas that are typically elevated, it can be questioned whether an elevated water table would occur in a push-up green. Indeed, it would seem that the green surround would need to be essentially flooded before a high water table would form on an elevated green. Consequently, although subsurface drainage systems have been installed in push-up greens, one may wonder if it is needed for a relatively small, elevated area.
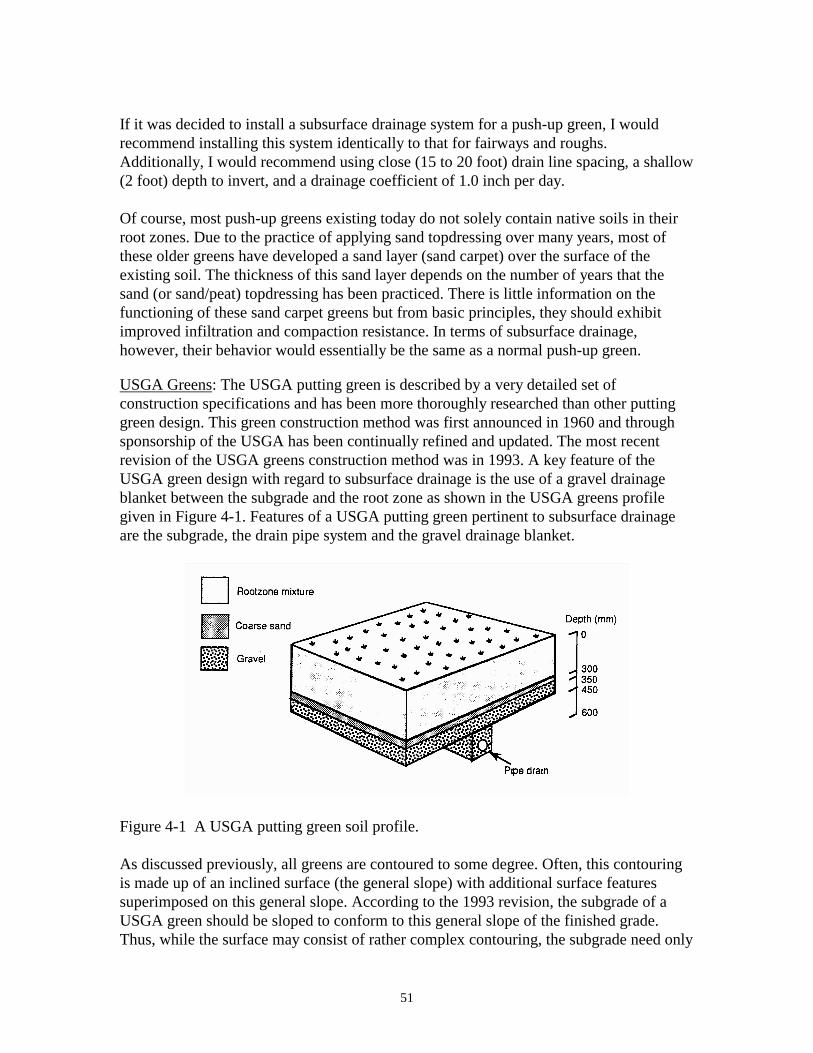
51
If it was decided to install a subsurface drainage system for a push-up green, I would recommend installing this system identically to that for fairways and roughs. Additionally, I would recommend using close (15 to 20 foot) drain line spacing, a shallow (2 foot) depth to invert, and a drainage coefficient of 1.0 inch per day. Of course, most push-up greens existing today do not solely contain native soils in their root zones. Due to the practice of applying sand topdressing over many years, most of these older greens have developed a sand layer (sand carpet) over the surface of the existing soil. The thickness of this sand layer depends on the number of years that the sand (or sand/peat) topdressing has been practiced. There is little information on the functioning of these sand carpet greens but from basic principles, they should exhibit improved infiltration and compaction resistance. In terms of subsurface drainage, however, their behavior would essentially be the same as a normal push-up green. USGA Greens: The USGA putting green is described by a very detailed set of construction specifications and has been more thoroughly researched than other putting green design. This green construction method was first announced in 1960 and through sponsorship of the USGA has been continually refined and updated. The most recent revision of the USGA greens construction method was in 1993. A key feature of the USGA green design with regard to subsurface drainage is the use of a gravel drainage blanket between the subgrade and the root zone as shown in the USGA greens profile given in Figure 4-1. Features of a USGA putting green pertinent to subsurface drainage are the subgrade, the drain pipe system and the gravel drainage blanket.
Figure 4-1 A USGA putting green soil profile. As discussed previously, all greens are contoured to some degree. Often, this contouring is made up of an inclined surface (the general slope) with additional surface features superimposed on this general slope. According to the 1993 revision, the subgrade of a USGA green should be sloped to conform to this general slope of the finished grade. Thus, while the surface may consist of rather complex contouring, the subgrade need only
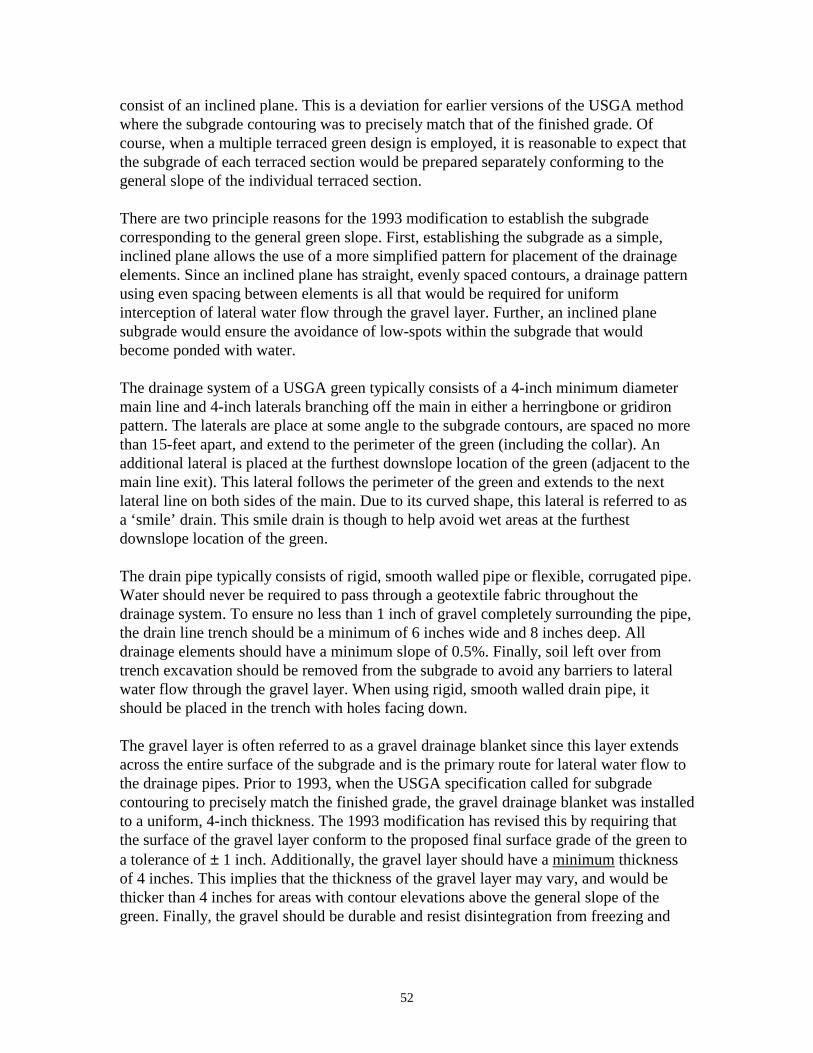
52
consist of an inclined plane. This is a deviation for earlier versions of the USGA method where the subgrade contouring was to precisely match that of the finished grade. Of course, when a multiple terraced green design is employed, it is reasonable to expect that the subgrade of each terraced section would be prepared separately conforming to the general slope of the individual terraced section. There are two principle reasons for the 1993 modification to establish the subgrade corresponding to the general green slope. First, establishing the subgrade as a simple, inclined plane allows the use of a more simplified pattern for placement of the drainage elements. Since an inclined plane has straight, evenly spaced contours, a drainage pattern using even spacing between elements is all that would be required for uniform interception of lateral water flow through the gravel layer. Further, an inclined plane subgrade would ensure the avoidance of low-spots within the subgrade that would become ponded with water. The drainage system of a USGA green typically consists of a 4-inch minimum diameter main line and 4-inch laterals branching off the main in either a herringbone or gridiron pattern. The laterals are place at some angle to the subgrade contours, are spaced no more than 15-feet apart, and extend to the perimeter of the green (including the collar). An additional lateral is placed at the furthest downslope location of the green (adjacent to the main line exit). This lateral follows the perimeter of the green and extends to the next lateral line on both sides of the main. Due to its curved shape, this lateral is referred to as a ‘smile’ drain. This smile drain is though to help avoid wet areas at the furthest downslope location of the green. The drain pipe typically consists of rigid, smooth walled pipe or flexible, corrugated pipe. Water should never be required to pass through a geotextile fabric throughout the drainage system. To ensure no less than 1 inch of gravel completely surrounding the pipe, the drain line trench should be a minimum of 6 inches wide and 8 inches deep. All drainage elements should have a minimum slope of 0.5%. Finally, soil left over from trench excavation should be removed from the subgrade to avoid any barriers to lateral water flow through the gravel layer. When using rigid, smooth walled drain pipe, it should be placed in the trench with holes facing down. The gravel layer is often referred to as a gravel drainage blanket since this layer extends across the entire surface of the subgrade and is the primary route for lateral water flow to the drainage pipes. Prior to 1993, when the USGA specification called for subgrade contouring to precisely match the finished grade, the gravel drainage blanket was installed to a uniform, 4-inch thickness. The 1993 modification has revised this by requiring that the surface of the gravel layer conform to the proposed final surface grade of the green to a tolerance of ± 1 inch. Additionally, the gravel layer should have a minimum thickness of 4 inches. This implies that the thickness of the gravel layer may vary, and would be thicker than 4 inches for areas with contour elevations above the general slope of the green. Finally, the gravel should be durable and resist disintegration from freezing and

53
thawing or mechanical abrasion. Thus, soft limestone, sandstone or shales are not acceptable for the gravel drainage blanket. For proper hydraulic function of a USGA green, it is important to ensure that a sharp and well-defined interface exists between the various profile layers. If sand particles of the root zone are allowed to migrate into the pores between the gravel, then the interface will be destroyed; and if the migration occurs to a great extent, the pores between gravel particles will become completely filled with sand, reducing the drainage capability of the gravel layer. Thus, it is crucial that sand particle migration does not occur. To ensure this, the gravel must consist of particle sizes that correspond with the particle sizes of the root zone mix. Specifically, the smallest 15% of the gravel particles must have diameters no more than 5 times greater than the largest 15% of the root zone particles. If this situation occurs, then the root zone particles will arch or bridge across the pores between the gravel and layer integrity will be maintained. This is the necessary condition that allows construction of a 2-tier USGA profile. On the other hand, if it is impossible to acquire the appropriately sized gravel for constructing a 2-tier profile, then an intermediate layer must be used. This results in construction of a 3-tier profile. The intermediate layer is spread to a uniform 2- to 4-inch layer over the gravel drainage blanket. This does not mean that the thickness of the layer would range between 2 to 4 inches but rather any thickness between 2 to 4 inches can be used. Regardless of the thickness chosen, it should remain constant across the green. Thus, as with the gravel layer, the surface contours of the intermediate layer would conform the contours of the proposed finish grade. Not only does this layer lie intermediate (i.e. between) the root zone and gravel, but the particle sizes of the material in this layer should in general be intermediate between those of the root zone and the gravel. Thus, the particles of the intermediate layer will arch between pores of the gravel, and the particles of the root zone will arch between pores of the intermediate layer material. The root zone of a USGA putting green typically consists of a high sand content mix composed of a medium-coarse textured sand, an organic material and occasionally some soil material. The root zone is placed on the green to a uniform, firmed depth of 12 inches (± ½ inch). The mix should be moist when applied to the green to discourage particle migration into the gravel or intermediate layers and to assist in firming. The layering of the relatively finer textured root zone over the coarser textured gravel or intermediate layers produces, when the profile is at field capacity, a ‘perched water table’ at the base of the root zone. That is, when a water saturated USGA profile is allowed to drain to field capacity, a zone of saturated soil forms in the root zone above the root zone/gravel (or root zone/intermediate layer) interface. The coarser layer below this interface is, however, unsaturated thus producing the suspended or perched water table. Optimally, this zone of saturated soil should extend no more than about 6 inches up from the interface. Consequently, the upper region of the root zone layer is unsaturated after profile drainage. Thus, soil profile layering in a USGA green aids in water and to some
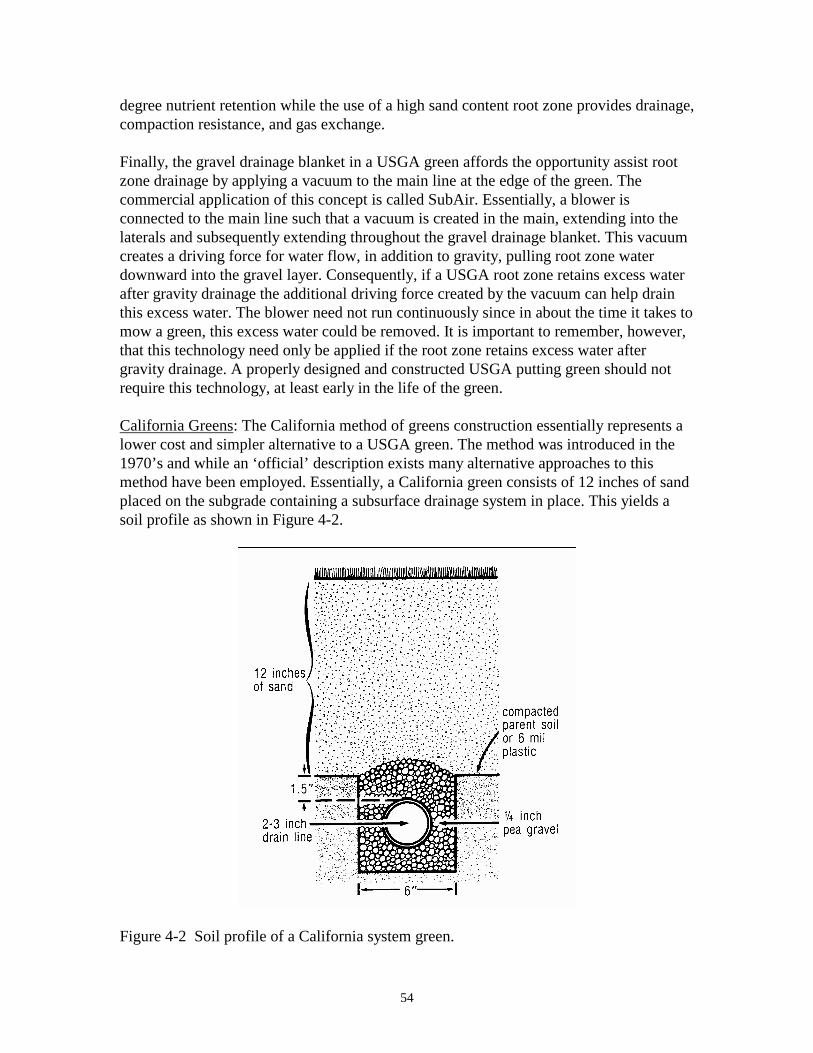
54
degree nutrient retention while the use of a high sand content root zone provides drainage, compaction resistance, and gas exchange. Finally, the gravel drainage blanket in a USGA green affords the opportunity assist root zone drainage by applying a vacuum to the main line at the edge of the green. The commercial application of this concept is called SubAir. Essentially, a blower is connected to the main line such that a vacuum is created in the main, extending into the laterals and subsequently extending throughout the gravel drainage blanket. This vacuum creates a driving force for water flow, in addition to gravity, pulling root zone water downward into the gravel layer. Consequently, if a USGA root zone retains excess water after gravity drainage the additional driving force created by the vacuum can help drain this excess water. The blower need not run continuously since in about the time it takes to mow a green, this excess water could be removed. It is important to remember, however, that this technology need only be applied if the root zone retains excess water after gravity drainage. A properly designed and constructed USGA putting green should not require this technology, at least early in the life of the green. California Greens: The California method of greens construction essentially represents a lower cost and simpler alternative to a USGA green. The method was introduced in the 1970’s and while an ‘official’ description exists many alternative approaches to this method have been employed. Essentially, a California green consists of 12 inches of sand placed on the subgrade containing a subsurface drainage system in place. This yields a soil profile as shown in Figure 4-2.
Figure 4-2 Soil profile of a California system green.

55
As with the 1993 revision of the USGA greens specification, the slope of the subgrade typically conforms the general slope of the finished grade. Thus, it is generally not considered necessary for the subgrade contouring to precisely match the contouring of the finished surface. This provides a cost savings over constructing a more contoured subgrade and, as with a newer USGA green avoids water-collecting hollows. Unlike USGA greens, the California system allows some flexibility in drain line spacing. As shown in Figure 4-3, flat greens (having a general slope of less than 2%) require an extensive drainage system. Laterals are typically placed at 10-foot intervals across the subgrade. Where slopes exceed 2% and the subgrade has been properly prepared, the recommendation calls for no laterals in the back half of the green. The rationale for this is that some studies have shown that for a sloped green, most of the excess drainage water is intercepted by only the first few, furthest downslope drain lines. Regardless of the drain spacing employed, however, a major interceptor drain is placed at the perimeter of the green either completely around the edge or only at the more downslope locations. Thus, some judgment of the builder is needed for layout of the drainage system. Higher rainfall conditions may require more intensive drain spacing. Also, when steep slopes surround the green, the perimeter drain line should extend adjacent to these slopes to ensure that runoff onto the green is properly intercepted.
Figure 4-3 Recommended drain line placement in a California green; (A) under
conditions of low rainfall or a steeply sloped green; (B) under conditions of high rainfall or a gently sloped green.
The selection of the drain pipe, and trench construction is similar to that used in a USGA green. As shown in Figure 4-2, drainage gravel (¼-inch diameter pea gravel) is only placed in the trench and is not used as a drainage blanket. The gravel envelope should completely surround the pipe and, a layer of gravel equal to the pipe diameter should cover the crown of the pipe to protect it from crushing. It is further recommended to mound the gravel slightly above the top of the trench to protect the trench and pipe during subsequent construction.

56
Since the root zone consists of un-amended sand, it is only necessary to place this sand into the excavated green area. According to the official recommendation, a uniform, depth of sand is placed on top of the subgrade. This material is subsequently smoothed and firmed to a uniform 12-inch depth. Since the subgrade is typically prepared as a simple inclined plane, this sand placement would result in a surface grade that also consists of a simple inclined plane. The installation of additional contouring to create the finished surface is accomplished by selective placement of 1 to 2 cubic yards of sand and blending this material to match the surrounding surface. Thus, the root zone thickness may vary across the green and may be as much as 3 inches thicker (for a total depth of 15 inches) in these contoured areas. Finally, some recently built California greens have employed a trenchless construction technique. This construction method does not use gravel filled trenches cut into the subgrade, but rather employs panel drainage pipe (i.e. 12-inch wide AdvanEDGE pipe) laid flat on the subgrade in either a herringbone or gridiron pattern. Although panel pipe is typically more expensive that round pipe, a considerable cost savings results from eliminating the trenching step and avoiding the purchase of gravel. Potential drainage problems with this construction method include 1) a low tolerance of slight loss of grade, 2) a suggested lack of self cleaning in greens construction, and 3) the lack of adequate design data. Panel pipes are by design rather narrow, about 1-inch thick. If in trenchless construction, there were a slight, 1-inch loss of grade along the run of a pipe, then this section of pipe would pond water and serve as a trap for any sediments. Over time, this sediment may plug the pipe and result in a loss of pipe function. In addition, some preliminary calculations suggest that flow velocities in a panel pipe laid flat would fall below the 1.5 foot per second minimum for self cleaning. This may, again, promote sediment accumulation in the pipe. Finally, adequate design data for sizing panel pipe in this application is currently not available. Recent research by the author has shown that flow interception in a trenchless design was equivalent to that of a round pipe placed in a gravel filled trench. A similar finding was observed for a USGA style greens construction. Thus, trenchless construction may be a cost effective means of putting green drainage. General Considerations: It is a good idea to provide clean-outs for all mains within a putting green drainage system. In this case, the main would extend beyond the green and collar and then, using either an elbow or wye, rise to the surface. The pipe would be fitted with a removable cap flush with the soil surface. Thus, access is provided at the end of the pipe for occasional water flushing or cleaning of the main line. Finally, an access port could also be installed at the outlet of the green by fitting the main with a capped tee extending to the surface. This would allow observation of outflow from the putting green drainage system. Subsurface Tee Drainage: For tees constructed of native soil (as with push-up greens) the need for a subsurface drainage system could be questioned. Tees are typically elevated so

57
a water table rising near the surface in the teeing area would be an unlikely occurrence. If it was decided to install a subsurface drainage system, then this system, for a native soil tee, should be designed analogous to that for a push-up green. Tees that have been cored-out and contain a high sand root zone would certainly need a subsurface drainage system to avoid a bathtub effect. A tee containing a gravel drainage blanket should have a subsurface drainage system identical to that of a USGA green. This should include all specifications such as a slope on the subgrade and proper sizing of the gravel to prevent particle migration. Also, a high sand content tee without a gravel drainage blanket should have a subsurface drainage system identical to that of a California green. One caveat here is that root zone depths in high sand tees tend to be less deep than greens, on the order of 6 to 8 inches. In this case, the drain line trench should be excavated deeper with adequate gravel envelope over the crown of the pipe. A 12-inch total cover of root zone and gravel over the crown of the pipe should be adequate for corrugated drainage pipe. This should help protect the pipe from becoming crushed. Finally, as in subsurface greens drainage, main lines within tees could be extended and provided with a access for occasional cleaning. Sand Bunker Drainage It only takes a few golf outings for a person to realize the importance of surface drainage on the golf course. Why is this? Well, because sand bunkers typically have no surface drainage and are frequently found to be half full of water! Indeed, bunker drainage seems to be a widespread problem even though the sand should be highly permeable and the bunkers should clearly contain subsurface drainage elements. Sand bunkers, as shown in Figure 4-4, are more or less completely enclosed depressions containing a specified sand. The sand should be maintained at a minimum depth of 4 inches across the bunker floor, grading to lesser depths around the edge and on bunker faces. The subgrade is firmly compacted or, if consisting of unstable soil, the subgrade may be covered by a layer of clay (as in a pond liner), a geotextile membrane or some other stabilizing treatment. A drainage trench is excavated into the subgrade and a perforated drainage pipe, encased in a gravel envelope, is placed in the trench. Typical sand bunkers need only a single drain line that follows the valley of the bunker floor. Massive, cape and bay bunkers may require mains and short laterals with laterals running into the bays.

58
Figure 4-4 Cross sectional view of a generalized sand bunker. Since the minimum depth of sand is rather shallow, great care is needed to ensure the drain line follows the absolute valley of the bunker floor. In addition, downslope lateral flow along the sand/subgrade interface (i.e. interflow, see Chapter 1) must eventually reach a drain line trench. Any water collecting hollows to even the slightest degree would hold water leading to either ponding in the bunker or at least an area of wet sand. Consequently, spoil from the drain line trench should be completely removed. Traditionally, drain line trenches are excavated to allow a minimum of 1 inch of gravel surrounding the pipe. Additionally, the gravel should extent no less than 3 inches above the crown of the pipe to protect the pipe from crushing. This means that for a 4-inch pipe, the trench should be 6 inches wide and 8 inches deep. As with other subsurface drain line trenches, the trench bottom should be firmed, smooth and have a uniform grade. Gravel for the drainage trench is often not addressed but pea gravel is frequently used. Routine bunker maintenance can lead to contamination of the bunker sand with gravel from the trench. To help alleviate this problem, the drain line trench could be excavated an additional 4 inches deeper leaving, after pipe and gravel placement, an additional 4 inches of the trench open to the surface of the bunker subgrade. This volume would then be filled with additional bunker sand, keeping the gravel out of the sand. Also, bunker sands have recently become a little bit finer textured. Failure of a bunker drainage system may be due to migration of the bunker sand into the trench gravel. Thus, to maintain integrity of the layered materials, one could follow USGA specifications for gravel sizing in putting greens by testing the bunker sand and the gravel to ensure that the smallest 15% of the gravel particles must have diameters no more than 5 times greater than the largest 15% of the bunker sand particles.
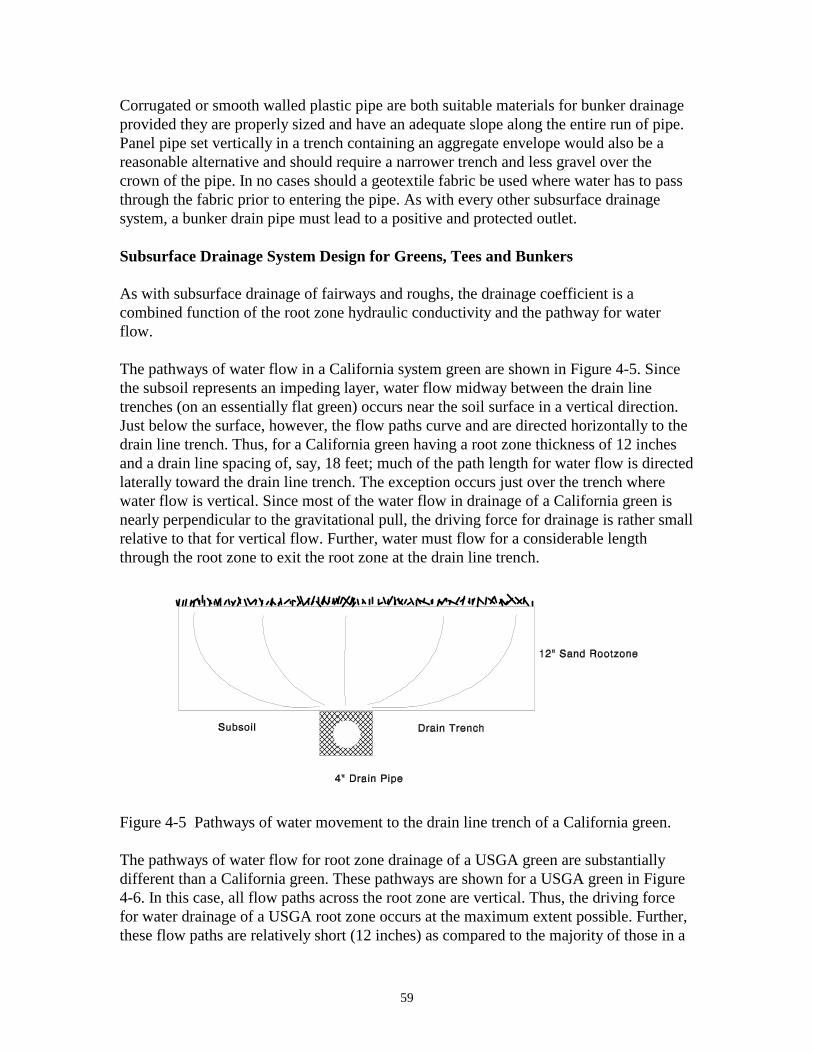
59
Corrugated or smooth walled plastic pipe are both suitable materials for bunker drainage provided they are properly sized and have an adequate slope along the entire run of pipe. Panel pipe set vertically in a trench containing an aggregate envelope would also be a reasonable alternative and should require a narrower trench and less gravel over the crown of the pipe. In no cases should a geotextile fabric be used where water has to pass through the fabric prior to entering the pipe. As with every other subsurface drainage system, a bunker drain pipe must lead to a positive and protected outlet. Subsurface Drainage System Design for Greens, Tees and Bunkers As with subsurface drainage of fairways and roughs, the drainage coefficient is a combined function of the root zone hydraulic conductivity and the pathway for water flow. The pathways of water flow in a California system green are shown in Figure 4-5. Since the subsoil represents an impeding layer, water flow midway between the drain line trenches (on an essentially flat green) occurs near the soil surface in a vertical direction. Just below the surface, however, the flow paths curve and are directed horizontally to the drain line trench. Thus, for a California green having a root zone thickness of 12 inches and a drain line spacing of, say, 18 feet; much of the path length for water flow is directed laterally toward the drain line trench. The exception occurs just over the trench where water flow is vertical. Since most of the water flow in drainage of a California green is nearly perpendicular to the gravitational pull, the driving force for drainage is rather small relative to that for vertical flow. Further, water must flow for a considerable length through the root zone to exit the root zone at the drain line trench.
Figure 4-5 Pathways of water movement to the drain line trench of a California green. The pathways of water flow for root zone drainage of a USGA green are substantially different than a California green. These pathways are shown for a USGA green in Figure 4-6. In this case, all flow paths across the root zone are vertical. Thus, the driving force for water drainage of a USGA root zone occurs at the maximum extent possible. Further, these flow paths are relatively short (12 inches) as compared to the majority of those in a

60
California green. All lateral water flow for drainage in a USGA green occurs in the gravel layer. This water no longer resides in the root zone and as such is not a primary concern for root zone drainage. Further, the gravel is highly permeable and would allow rapid water transmission even though the driving force is quite small.
Figure 4-6 Pathways of water movement to the drain line trench of a USGA green. Based on analysis of the flow paths, it would be easy to assume that the rate of drainage of a USGA root zone would be substantially greater than that for a California green. This, however, is not the complete story since the rate of soil drainage is also proportional to the hydraulic conductivity or permeability of the root zone. The saturated hydraulic conductivity of a root zone mix for a USGA green ranges from 6 to 24 inches per hour (from the 1993 revision) whereas the conductivity of a California green can range from 20 to 60 inches per hour. Thus, comparison of root zone drainage rates for these two profile designs must factor in a consideration of the saturated conductivity differences. When we compare a USGA green exhibiting an accelerated permeability (approaching 20 inches per hour) with a California green having a low permeability for this system (also approaching 20 inches per hour), it is apparent that based on flow paths, the USGA green will have the higher drainage rate. When, however, we compare a USGA green with a low permeability (near 6 inches per hour) to a California green having a high permeability (near 60 inches per hour) it is quite possible that in this case, the California green would have the higher drainage rate. Thus, a blanket statement cannot be made as to which green design exhibits a greater drainage rate. One final consideration is the decline in root zone permeability as greens and tees age. Roots growing within the pore space, the breakdown of organic materials, and the accumulation of silt and clay causes permeability declines with time for all of these root zones. Consequently, permeabilities even a few years after establishment have declined substantially. Taking into account the various hydrologic properties of greens, tees and sand bunkers; our best estimate of drainage coefficients for these systems is given in Table 4-1. Notice

61
that for push-up greens and tees, constructed of native soil, the units are inches per day whereas for high sand content greens and tees, and sand bunkers the units are in inches per hour. The lower drainage coefficient for high sand tees compared to that for greens is due to the expected shallower root zone depth in tees. The drainage coefficient for both USGA and California greens is estimated to be the same following the discussion given above. Table 4-1 Drainage Coefficients of Greens, Tees and Sand Bunkers
System Drainage Coefficient Push-up Greens and Tees 1 in day-1 High Sand Tees (6 - 8 inch root zone) 1 in hr-1 High Sand Greens (California & USGA) 2 in hr-1 Sand Bunkers 4 in hr-1 The drainage coefficient values and information on pipe composition and slope are subsequently used together with a drain pipe capacity chart to properly design the subsurface drainage systems for tees, greens and bunkers. In this case, we will use the drainage capacity charts given in Chapter 3 since their use is identical to that for greens, tees and bunkers. Also, drainage coefficient values from Table 4-1 are presented on these charts. As in Chapter 3, our goal is to avoid pipe pressurization and the subsequent damage that may occur. Use of the drainage capacity charts is illustrated by the following examples. High Sand Green Example: Consider a high sand putting green that has an area of 7400 sq ft and a uniform subgrade slope of 1%. The green contains a herringbone drainage system with a main along the subgrade slope and laterals angled at 30 degrees to the subgrade contours. The main and laterals are corrugated plastic pipe. There are 14 laterals spaced at 15-feet apart. Due to the irregular shape of the green, the laterals would have varying lengths and consequently each would drain a different sized area of the green. For design purposes, however, we choose the longest lateral, draining the largest portion of the green area. This maximum length lateral is 60 feet long, yielding 900 sq ft (60 x 15) of the green area drained by this individual lateral. Further, for laterals angled at 30 degrees to the contour the slope of each lateral would be 0.5% (1% subgrade slope x the sine of 30 degrees). Using a drainage coefficient of 2 inches per hour from Table 4-1 and the drain capacity chart in Figure 3-2, we see that the minimum diameter for the laterals is 3 inches. Clearly, the commonly prescribed lateral diameter of 4 inches for putting greens would be more than adequate, especially considering that we designed for the longest lateral. Further inspection of the drainage capacity chart, however, reveals that the projected flow velocity in this pipe would be just over 1 foot per second. This is less than the recommended value of 1.5 feet per second recommended for self cleaning. Consequently,

62
the gambling man would ignore the self flushing aspect and simply excavate the drain line trench to a uniform (for USGA greens) 8 inches depth. The more conservative individual would excavate a trench that was progressively deeper as the lateral approach the main so that there was an additional slope on the lateral. To yield an overall 1.5% slope on the lateral, therefore, the drainage trench for this 60 foot lateral would be (as recommended) 8 inches to invert at the furthest distance from the main and 15.2 inches to invert where the lateral enters the main. Consequently, the main line trench would need to be at least 15.2 inches to invert as well. Sizing of the main follows that for the laterals. In this case, the main should be able to convey drainage from the entire 7400 sq ft green. Using a 2 inch per hour drainage coefficient, a 1% slope on the main, and the chart given in Figure 3-2, we see that the minimum diameter of the main is 6 inches. Also, the main should self clean at a 1% slope since the flow velocity is about 2.5 feet per second. Thus, the main line trench would have a consistent depth (either 8 inches for the gambler or 15.2 inches for the cautions person) along its entire run. Notice that for smaller and steeper greens a 4-inch main may be adequate whereas larger, flatter green may require even an 8-inch main. Also, using values from this example and Figure 3-3 we see that smooth walled pipe would allow use of a 5-inch main as compared to a 6-inch main for corrugated tubing. High Sand Tee Example: Consider a roughly rectangular, 20 x 80 ft, high sand content teeing area. This 1600 sq ft area is sloped along its long axis at 1% primarily for surface drainage. A single, corrugated drain line running down the center along the long axis of the tee would seem adequate to drain this rather small area. Thus, it is a simple matter to size the pipe using a drainage coefficient of 1 inch per hour from Table 4-1 and Figure 3-2. The minimum sized drainage pipe, in this case would be 3 inches in diameter. Further, this pipe just meets the estimated self cleaning velocity of 1.5 feet per second. Clearly, again, a 4-inch pipe would be more than adequate and, just to be on the safe side, lets extend this pipe beyond the tee, elbowing it to the surface to provide a clean-out. Sand Bunker Example: Finally, consider a 2000 sq ft bunker with the bunker floor having slopes ranging from 2 to 5%. Finding the proper size of a corrugated drain pipe is again accomplished by selecting the appropriate drainage coefficient (4 inches per hour) from Table 4-1 and using Figure 3-2. Yet which is the appropriate slope value to apply in this drainage chart? Well, since we want to avoid pipe pressurization that would likely occur at the lower slope portion of the line, we would choose the smallest slope value of 2% in our design work. Consequently, in this 2000 sq ft bunker the minimum sized drain line would have a 4-inch diameter. Further, the flow velocity is nearly 3 feet per second suggesting that trench depths need not vary along the run of the pipe placed in this bunker.
63
Chapter 5: Outlets Outlets discharge flow from underground drainage pipes into receiving waterways; typically, channels, streams, or lakes. All drainage systems require an outlet with adequate capacity, stability and depth to meet the design requirements. If the outlet is inadequate, the effectiveness of the entire drainage system can be greatly reduced or eliminated. Thus, although left to last, information in this Chapter is by no means of lesser importance than the other sections. Outlets we will consider include, classical outlets, pumped outlets, siphon outlets, dry wells and subsurface reservoirs, and wetlands as discharge outlets. Classical Outlets Classical outlets consist as an extension of the subsurface pipe system to the discharge location. Since flow along the drainage pipe is usually by gravity, the location of this outlet must be at the low point of the drainage system. Efficient drainage system design means identifying the outlet location for an area on the course and then extending the drainage system array upslope from this location. We must also ensure that an adequate slope occurs along the entire run of the system, that subsurface pipes have adequate soil cover as a protection from crushing, and that excessively deep excavations are avoided. The drain outlet is usually the weakest portion of a drainage system since it is exposed and subject to damage or clogging. A classical outlet plan is shown in Figure 5-1. Rather than extending the tile or plastic tubing to the discharge point, a section of non-perforated metal pipe 10 to 15 feet in length is used to carry the water from the point where sufficient soil cover is available to the discharge. This section of higher strength pipe should resist crushing that may occur when there is insufficient cover to protect the pipe. The outlet pipe should be equipped with a bared guard to keep small animals from entering the pipe or flood gate to prevent water backing up into the pipe. The bared guard should be recessed into the pipe to keep debris from propping it open. The outlet pipe should be connected to the drainage pipe by a concrete collar to prevent pipe displacement. The outlet should be the same size or larger than the main line at the collar and the outlet should discharge at least one foot above the normal water level in the receiving waterway. A pipe that is submerged for extended periods is subject to siltation and clogging.
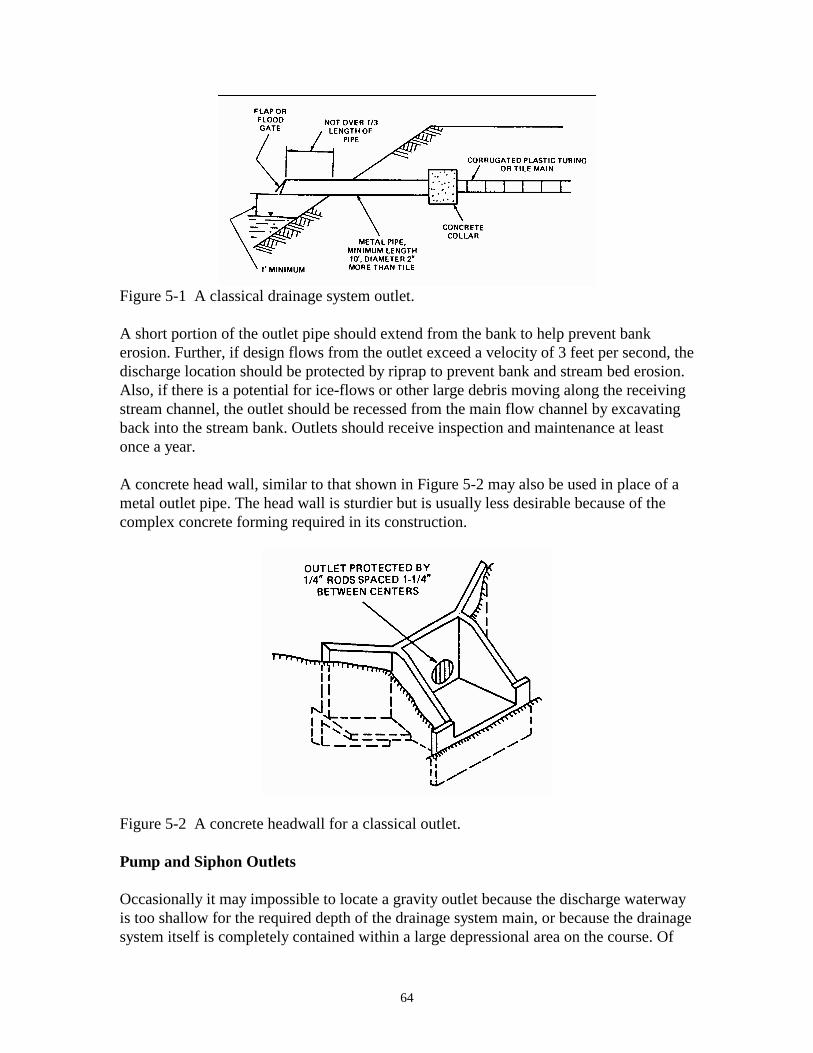
64
Figure 5-1 A classical drainage system outlet. A short portion of the outlet pipe should extend from the bank to help prevent bank erosion. Further, if design flows from the outlet exceed a velocity of 3 feet per second, the discharge location should be protected by riprap to prevent bank and stream bed erosion. Also, if there is a potential for ice-flows or other large debris moving along the receiving stream channel, the outlet should be recessed from the main flow channel by excavating back into the stream bank. Outlets should receive inspection and maintenance at least once a year. A concrete head wall, similar to that shown in Figure 5-2 may also be used in place of a metal outlet pipe. The head wall is sturdier but is usually less desirable because of the complex concrete forming required in its construction.
Figure 5-2 A concrete headwall for a classical outlet. Pump and Siphon Outlets Occasionally it may impossible to locate a gravity outlet because the discharge waterway is too shallow for the required depth of the drainage system main, or because the drainage system itself is completely contained within a large depressional area on the course. Of
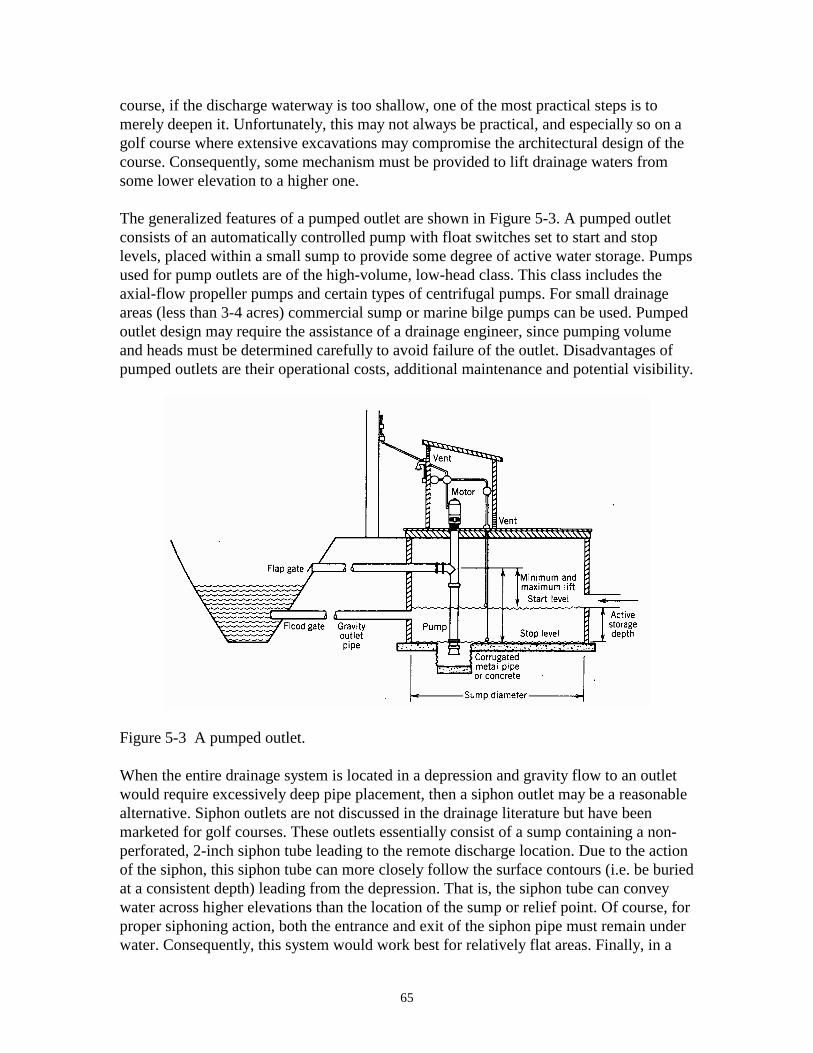
65
course, if the discharge waterway is too shallow, one of the most practical steps is to merely deepen it. Unfortunately, this may not always be practical, and especially so on a golf course where extensive excavations may compromise the architectural design of the course. Consequently, some mechanism must be provided to lift drainage waters from some lower elevation to a higher one. The generalized features of a pumped outlet are shown in Figure 5-3. A pumped outlet consists of an automatically controlled pump with float switches set to start and stop levels, placed within a small sump to provide some degree of active water storage. Pumps used for pump outlets are of the high-volume, low-head class. This class includes the axial-flow propeller pumps and certain types of centrifugal pumps. For small drainage areas (less than 3-4 acres) commercial sump or marine bilge pumps can be used. Pumped outlet design may require the assistance of a drainage engineer, since pumping volume and heads must be determined carefully to avoid failure of the outlet. Disadvantages of pumped outlets are their operational costs, additional maintenance and potential visibility.
Figure 5-3 A pumped outlet. When the entire drainage system is located in a depression and gravity flow to an outlet would require excessively deep pipe placement, then a siphon outlet may be a reasonable alternative. Siphon outlets are not discussed in the drainage literature but have been marketed for golf courses. These outlets essentially consist of a sump containing a non-perforated, 2-inch siphon tube leading to the remote discharge location. Due to the action of the siphon, this siphon tube can more closely follow the surface contours (i.e. be buried at a consistent depth) leading from the depression. That is, the siphon tube can convey water across higher elevations than the location of the sump or relief point. Of course, for proper siphoning action, both the entrance and exit of the siphon pipe must remain under water. Consequently, this system would work best for relatively flat areas. Finally, in a

66
typical installation, the siphon is connected to an irrigation line so the system can be primed and occasionally flushed. Dry Wells and Subsurface Reservoirs In certain cases on the golf course small areas that require drainage are located at some distance from a suitable discharge location such as a waterway or pond. To avoid lengthy trenching and piping, dry wells are installed adjacent to the area needing drainage. Dry wells are simply holes in the ground at the end of a drain line that are used to receive the drainage water. These wells, buried beneath the soil surface and containing an adequate soil cover to support turf would essentially be invisible. Frequently, however, these dry wells are undersized and located in slowly permeable soils such that a wet area is created in the vicinity of the well. In other words, the drainage problem is simply moved from one location to another. A dry well must be planned and sized to accept the water from a design storm and not flood or cause undue wetness when the design storm occurs. To estimate the volume of water the dry well must hold, you must estimate the depth of rain expected for the desired return period. Notice that here we are not estimating a flow rate such as cubic feet per second as was typically done for surface runoff or gallons per minute as for subsurface drainage. Rather, we need to estimate the accumulated rainfall depth (subsequently converting this to a volume) over a 24 hour period for a given geographic location and return period. This is accomplished by using the graph in Figure 2-1 of rainfall intensity vs. storm duration for St. Louis, MO. Selecting 24 hours as the storm duration and, for example, a 10-year return period, the rainfall intensity is 0.2 inches per hour. Multiplying this by 24 hours given a total rainfall depth of 4.8 inches. This same approach could be used for more or less conservative return periods where a more conservative (i.e. longer) return period will give a deeper rainfall depth and vice verse. Subsequently, conversion of the St. Louis rain depth to another geographic region is accomplished, as before, using the map in Figure 2-2. This approach assumes that the dry well is used as an outlet for a surface water collector or as an outlet for a small subsurface drainage system such as in a sand bunker or high sand content tee. Consequently, it is expected that rainwater for the 24 hour period will end up in the dry well. Further, the dry well should be located in a higher permeability soil or in a soil underlain by higher permeability strata that the dry well will intercept. Water collected in the dry well will, subsequently, slowly drain into the surrounding soil or subsurface strata. As an example, we will estimate the required storage volume of a dry well serving as the outlet of a 1600 sq ft tee located on a course in southwest Pennsylvania. The dry well should be capable of handling runoff from a 10-year return period storm, and the tee is pushed-up from the native silt loam soil. From Figure 2-1, a 10-year return period storm has a rainfall intensity in St. Louis of 0.2 inches per hour. Consequently, over a 24 hour period the total rainfall amount would be 4.8 inches. Using the geographical correction

67
for southwest Pennsylvania (equal to 0.8), the rain amount for the course would be 3.8 inches. Yet only a portion of this rainfall would be runoff. That portion is given by the runoff coefficient that in the case of a silt loam tee would be 0.3 (Table 2-1) or 30%. Thus, multiplying 3.8 inches by 0.3 gives us the rainfall amount that becomes runoff, or 1.2 inches. Converting inches to feet, the runoff amount would be equal to (1.2 ÷ 12) 0.1 feet. Subsequently multiplying this depth of water by the area of the tee gives a runoff volume of 160 cubic feet. Suppose an area of 10 by 10 feet is set aside for the dry well. A direct division of the 160 cubic feet of water by 100 square feet of well area suggests that the well need only be 1.6 feet deep. However, the dry well will need to be filled with aggregate reducing the overall well volume by about 60% (in other words, an aggregate layer has about 40% porosity). Thus the correct depth of the well is found by dividing 1.6 feet by 0.4 to give a depth of 4 feet. Checking our results, a 400 cubic foot excavation having 40% of its volume to receive water yields 160 cubic feet of storage volume. As can be seen from this example, a dry well outlet would only work effectively for draining a rather small area. Also, the dry well itself must drain into the surrounding soil or else the next rain, even if it is less than a 1 in 10 year event, will over-top the well and result in flooding. Dry wells can rarely be made large enough to adequately handle areas as large as greens. One positive aspect of the dry well is that it will recharge the groundwater at the golf course site. For classical outlets discharging into a stream, most of the drainage water will exit the site downstream. Thus, there is a possibility that drainage water outletted into a dry well could be reused on the golf course, assuming the course draws its irrigation water from on-site wells and the water draining from a dry well actually reaches the aquifer. A more direct opportunity for reuse of drainage water while using a remote, subsurface outlet is the creation of a subsurface reservoir. Essentially, these reservoirs consist of a section of large diameter drainage pipe, laid horizontally and buried in the ground. Advantages of subsurface reservoirs over dry wells is the additional storage volume of the pipe as compared to an aggregate backfill, and the more direct capability for reclaiming and reusing the drainage water. In this latter case, the pipe could be fitted with a small sump pump that could withdraw the collected water, routing it to an irrigation pond. Similar to dry wells, these subsurface reservoirs would be invisible structures and not influence activities at the soil surface. Two possible configurations of subsurface reservoirs exist. If it was desired to directly remove the collected water using a pump, a solid or perforated pipe could be placed directly in the soil without a gravel backfill ensuring a minimum of 2 feet of soil cover. In this case, it would not matter whether the pipe was placed in permeable soil or in contact with a permeable strata. If, however, it were desired to allow the drainage water to seep into the soil, a perforated pipe would need to be used in conjunction with a gravel backfill. Correspondingly, a permeable soil material would need to be in contact with the

68
gravel, and adequate cover of gravel and soil would be required. Figure 5-4 (taken from ADS Technical Note 2.120) illustrates these two possible configurations.
Figure 5-4 The two possible configurations for a subsurface reservoir. Sizing of the pipe (both diameter and width) would follow the same approach as used for sizing dry wells. As an example, consider a subsurface reservoir placed, without a gravel backfill, directly in the soil. Discharge into this reservoir would be 160 cubic feet as used in the dry well example. The volume of the pipe is found using the formula for the volume of a cylinder given by, π x (radius2) x length. Thus, for a 36-inch diameter pipe we would need a 22.6 foot section, since 160 cubic feet divided by π times 1.5 feet squared equals 22.6 feet. Further, using the same approach, a 24-inch pipe would need to be 50.9 feet long. Notice that this simple example ignores the discharge capacity of any sump pump placed within the reservoir. If this capacity, expressed in volume discharge per day, were included, then the reservoir size would likely be reduced. Thus, it is easy to see from this example, that very long sections of large diameter pipe may effectively serve as invisible drainage outlets for rather large discharges, providing this discharge is removed to an
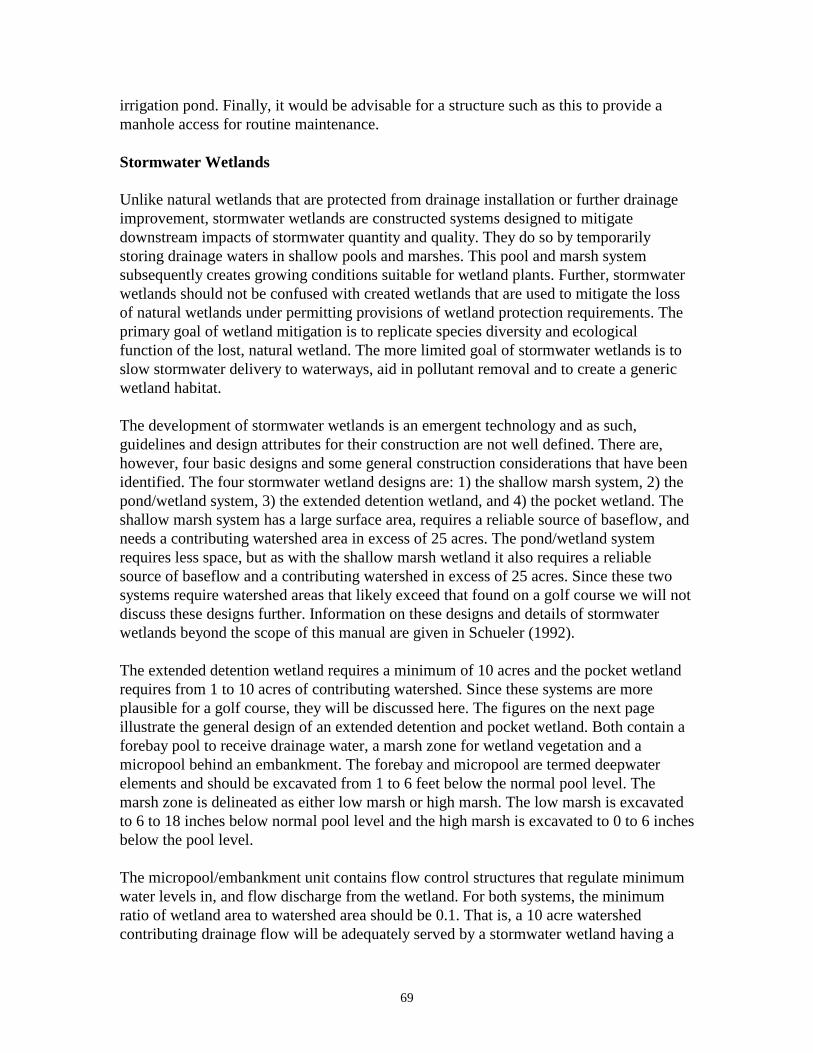
69
irrigation pond. Finally, it would be advisable for a structure such as this to provide a manhole access for routine maintenance. Stormwater Wetlands Unlike natural wetlands that are protected from drainage installation or further drainage improvement, stormwater wetlands are constructed systems designed to mitigate downstream impacts of stormwater quantity and quality. They do so by temporarily storing drainage waters in shallow pools and marshes. This pool and marsh system subsequently creates growing conditions suitable for wetland plants. Further, stormwater wetlands should not be confused with created wetlands that are used to mitigate the loss of natural wetlands under permitting provisions of wetland protection requirements. The primary goal of wetland mitigation is to replicate species diversity and ecological function of the lost, natural wetland. The more limited goal of stormwater wetlands is to slow stormwater delivery to waterways, aid in pollutant removal and to create a generic wetland habitat. The development of stormwater wetlands is an emergent technology and as such, guidelines and design attributes for their construction are not well defined. There are, however, four basic designs and some general construction considerations that have been identified. The four stormwater wetland designs are: 1) the shallow marsh system, 2) the pond/wetland system, 3) the extended detention wetland, and 4) the pocket wetland. The shallow marsh system has a large surface area, requires a reliable source of baseflow, and needs a contributing watershed area in excess of 25 acres. The pond/wetland system requires less space, but as with the shallow marsh wetland it also requires a reliable source of baseflow and a contributing watershed in excess of 25 acres. Since these two systems require watershed areas that likely exceed that found on a golf course we will not discuss these designs further. Information on these designs and details of stormwater wetlands beyond the scope of this manual are given in Schueler (1992). The extended detention wetland requires a minimum of 10 acres and the pocket wetland requires from 1 to 10 acres of contributing watershed. Since these systems are more plausible for a golf course, they will be discussed here. The figures on the next page illustrate the general design of an extended detention and pocket wetland. Both contain a forebay pool to receive drainage water, a marsh zone for wetland vegetation and a micropool behind an embankment. The forebay and micropool are termed deepwater elements and should be excavated from 1 to 6 feet below the normal pool level. The marsh zone is delineated as either low marsh or high marsh. The low marsh is excavated to 6 to 18 inches below normal pool level and the high marsh is excavated to 0 to 6 inches below the pool level. The micropool/embankment unit contains flow control structures that regulate minimum water levels in, and flow discharge from the wetland. For both systems, the minimum ratio of wetland area to watershed area should be 0.1. That is, a 10 acre watershed contributing drainage flow will be adequately served by a stormwater wetland having a

70

71
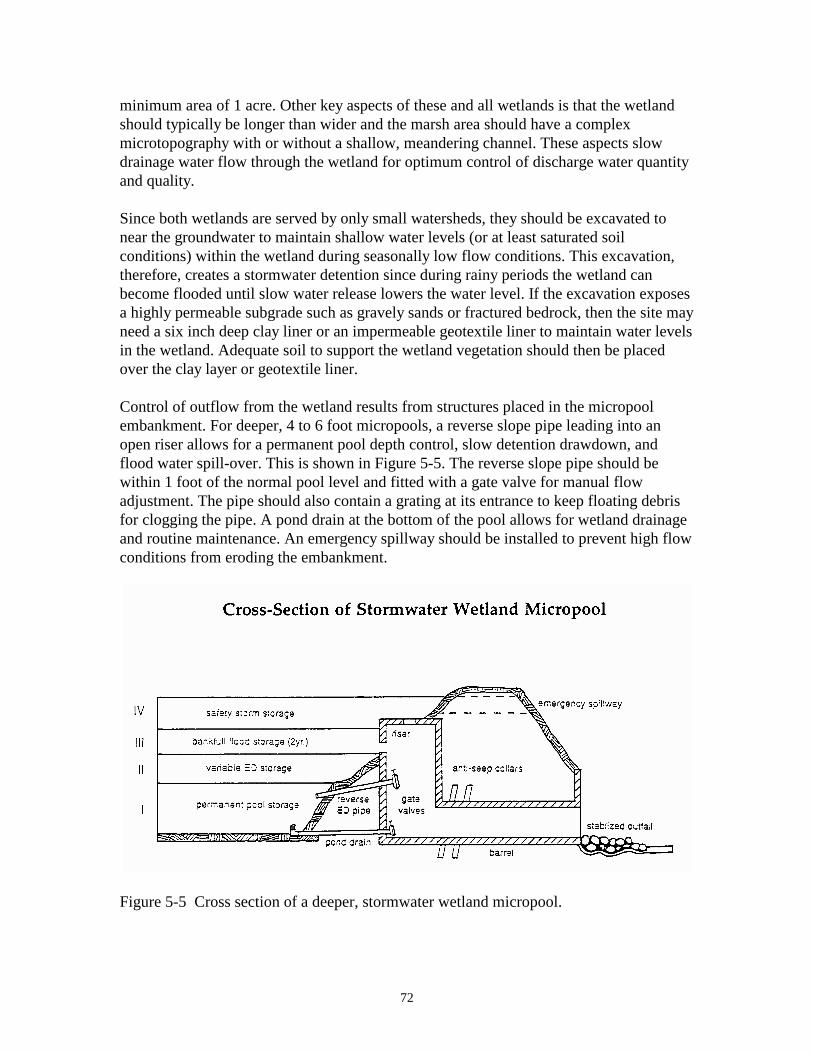
72
minimum area of 1 acre. Other key aspects of these and all wetlands is that the wetland should typically be longer than wider and the marsh area should have a complex microtopography with or without a shallow, meandering channel. These aspects slow drainage water flow through the wetland for optimum control of discharge water quantity and quality. Since both wetlands are served by only small watersheds, they should be excavated to near the groundwater to maintain shallow water levels (or at least saturated soil conditions) within the wetland during seasonally low flow conditions. This excavation, therefore, creates a stormwater detention since during rainy periods the wetland can become flooded until slow water release lowers the water level. If the excavation exposes a highly permeable subgrade such as gravely sands or fractured bedrock, then the site may need a six inch deep clay liner or an impermeable geotextile liner to maintain water levels in the wetland. Adequate soil to support the wetland vegetation should then be placed over the clay layer or geotextile liner. Control of outflow from the wetland results from structures placed in the micropool embankment. For deeper, 4 to 6 foot micropools, a reverse slope pipe leading into an open riser allows for a permanent pool depth control, slow detention drawdown, and flood water spill-over. This is shown in Figure 5-5. The reverse slope pipe should be within 1 foot of the normal pool level and fitted with a gate valve for manual flow adjustment. The pipe should also contain a grating at its entrance to keep floating debris for clogging the pipe. A pond drain at the bottom of the pool allows for wetland drainage and routine maintenance. An emergency spillway should be installed to prevent high flow conditions from eroding the embankment.
Figure 5-5 Cross section of a deeper, stormwater wetland micropool.

73
For a shallow or non-existent micropool, a Hickenbottom inlet, located within the wetland near the embankment, is connected to a drainage line continuing through the embankment. An in-line crested weir is placed along the drain line within the embankment to control water levels within the wetland. A Hickenbottom inlet is a, typically 6-inch diameter riser that contains variously sized inlet holes or orifices along its upper 2- to 4-foot length. The orifices control the rate of water flow from within the wetland into the drainage pipe and into the receiving waterway. Adding or removing stoplogs from the crested weir will control the normal pool depth within the wetland. Removal of all stoplogs would allow complete drainage of the wetland for routine maintenance. Stormwater wetlands require regular maintenance. These steps are taken during periods when the wetland has been drained. Vegetative biomass may require removal to reinvigorate the wetland community. Trash and other debris caught in the wetland should be removed. Also, if excessive siltation has occurred over time, this material would need to be excavated and removed. Depending on the quality of the drainage waters, extended detention wetlands may require cleanout every 2 to 5 years while pocket wetlands may require a cleanout every 10 years. Our coverage of stormwater wetlands is limited to earthmoving and flow control details. Lacking is information on selecting the proper plant species and steps in their establishment. This information can be found in Schueler (1992) and elsewhere. As can be noted in this presentation, however, stormwater wetlands require careful design and construction to yield a useful and environmentally friendly drainage outlets. Their advantage is that the main area of the golf course can drain rapidly and quickly return to play while delivery of drainage waters to streams or other waterways is slowed. This should lessen offsite impacts of the golf course.

74
Bibliography Jarrett, A.R. 1985. Golf course and grounds irrigation and drainage. Prentice-Hall, Inc., Englewood Cliffs, NJ. Schueler, T.R. 1992. Design of stormwater wetland systems: guidelines for creating diverse and effective stormwater wetlands in the mid-Atlantic region. Metropolitan Washington Council of Governments, publication no. 92710. Washington, DC. Schwab, G.O., D.D. Fangmeier and W.J. Elliot. 1996. Soil and water management systems, 4th ed. John Wliey & Sons, Inc., New York, NY. Ward, A.D. and W.J. Elliot. 1995. Environmental hydrology. CRC Press, Inc., Boca Raton, FL.