draftei dwdm system
TRANSCRIPT

8/6/2019 DraftEI Dwdm System
http://slidepdf.com/reader/full/draftei-dwdm-system 1/12
ENGINEERING INSTRUCTION
INTRODUCTION, INSTALLATION AND TESTING OFDWDM SYSTEMS
No. ………….
BHARAT SANCHAR NIGAM LIMITED(A Govt. of India Enterprise)
TECHNICAL & DEVELOPMENT CIRCLE,SANCHAR VIKAS BHAWAN, RESIDENCY ROAD,
JABALPUR, MP-482001
1
No of Pages: 12
Issue No.: 01
Issued By: T&D, Circle
Approved By: CGM T&D Circle
Date of Issue: DraftAmendment No (If Any) NIL
No of Pages
Issued by:
Approved By:
Date of Issue:
Restricted use by BSNL Employees
only
All efforts have been made to incorporate all relevant up to date information
available, any discrepancies or need for addition or deletion is felt necessarily may please be intimated to this office for further improvement, on E-Mail Id

8/6/2019 DraftEI Dwdm System
http://slidepdf.com/reader/full/draftei-dwdm-system 2/12
ENGINEERING INSTRUCTIONS
BHARAT SANCHAR NIGAM LIMITEDA Govt of India EnterprisesRestricted to Telecom Staff
ISSUE No.1Page 2 of 12
DATED: 31-03-1999
ENGINEERING INSTRUCTION ON INTRODUCTION INSTALLATION ANDTESTING OF DWDM SYSTEMS
1.0 Scope: This EI deals with the introduction to DWDM (Dense Wave Length Division Multiplexing) technology
emergence, installation of DWDM systems and also testing of DWDM systems.
2.0 Introduction:
2.1 Development of DWDM Technology:Early WDM began in the late 1980’s using the 2 wavelengths in 1310nm and 1550nm or 850 nm and1310nm regions sometimes called wideband WDM. A simple form of WDM system is illustrated inFig: 1-1.
Figure 1-1: WDM with Two Channels
Send
(1310 nm + 850 nm)
Receive
(1310 nm + 850 nm)
It may be noticed that one of the fiber pair is used to transmit and one used to receive . This is thearrangement mostly found in DWDM systems.
In the early 90’s a second generation of WDM sometimes called narrow band WDM emerged in which twoto eight channels were used. These channels were spaced about 400 GHz in the 1550 nm window. By themid 1990’s dense WDM(DWDM) emerged with 16 to 40 channels and spaced 100 to 200 GHz. By thelate 1990’s DWDM systems had evolved to the point were they were capable of 64 to 160 parallelchannels densely packed at 50 or even 25 GHz intervals.
As the figure 1-2 shows , the progression of the technology can be seen as an increase in the number of wavelength accompanied by a decrease in the spacing of the wavelength.
End
system
End
system
Endsystem
Endsystem

8/6/2019 DraftEI Dwdm System
http://slidepdf.com/reader/full/draftei-dwdm-system 3/12
ENGINEERING INSTRUCTIONS
BHARAT SANCHAR NIGAM LIMITEDA Govt of India EnterprisesRestricted to Telecom Staff
ISSUE No.1Page 3 of 12
DATED: 31-03-1999
Figure 1-2: Evolution of DWDM
Evolution of DWDM
Late 64+ channels1990’s 25-50 GHz spacing
1996 16+ channels 100-200 GHz spacingDense WDM , integrated systems
Early 2-8 channels passive WDM1990’s 200-400 GHz spacing passive WDM
components /parts
1980’s 2 channels wide band WDM1310 nm, 1550 nm
Increase in channel density resulting from DWDM technology had a dramatic impact on the carryingcapacity of fiber.
3.0 DWDM System Functions:DWDM involves a small number of physical layer functions as depicted in figure 1-3 which shows aDWDM schematic for four channels. Each optical channel occupies its own wavelength expressed innanometers.
Figure 1-3: DWDM Functional Schematic
Transmitters Receivers
combining separating
signals signals
Transmission on fiber
3.1 The system performs the following main functions:
3.1.1 Generating the signal: The source, a solid state laser must provide stable light with in a specificnarrow bandwidth.
3.1.2 Combining the signals: DWDM systems employee multiplexers to combine the signals. The lossassociated with multiplexing and de multiplexing is mitigated with optical amplifiers, which boost theentire wavelength.

8/6/2019 DraftEI Dwdm System
http://slidepdf.com/reader/full/draftei-dwdm-system 4/12
ENGINEERING INSTRUCTIONS
BHARAT SANCHAR NIGAM LIMITEDA Govt of India EnterprisesRestricted to Telecom Staff
ISSUE No.1Page 4 of 12
DATED: 31-03-1999
3.1.3 Transmitting the signals: The effect of crosstalk and optical signal degradation etc. can beminimized by controlling variables such as channel spacing, wavelength tolerance and laser power levels.
3.1.4 Separating the received signals: At the receiving end the multiplexed signals must be separated out.
3.1.5 Receiving the signals: The de-multiplexed signals are received by a photo detector.
In addition, a DWDM system must also be equipped with interfaces to receive the input signals. Thisfunction is performed by transponders. The interfaces can be SONET / SDH terminals or ADMs, ATMswitches or routers. The transponders are a key determinant of the openness of DWDM systems.
In the early form WDM was capable of carrying signals over two widely spaced wavelengths and for arelatively short distance. Improvements in optical filters and narrow band lasers enabled DWDM tocombine more than two signal wavelengths on a fiber. The invention of flat gain optical amplifiers coupledinline with the transmitting fiber to boost the optical signal increased the viability of DEDM systems byextending the transmission distance. Other technologies important in the development of DWDM includeimproved optical fiber with lower loss , EDFAs (Erbium doped fiber amplifiers) and devices such as fiberBragg gratings used in optical add/drop multiplexers .
4.0 Components and operation:
The essential components of DWDM can be classified by their place in the system as follows:
1. On the transmit side lasers with precise stable wavelengths.2. On the link low loss optical fiber in addition to flat gain optical amplifiers to boost the signals.3. On the receive side photo detectors and optical de-multiplexers4. Optical add/drop multiplexers and optical cross connect components.
4.1 Lasers:
The general types of light emitting devises used in optical transmission are light emitting diodes (LEDs)and laser diodes or semi conductor lasers. LEDs are relatively slow device suitable for use at speeds of lessthan 1 GBPS. These are often used in multimode fiber communications. Semi conductor lasers are bettersuited to single mode applications.
Two types of semi conductor lasers are widely used , Monolithic Fabry-perot lasers and Distributed FeedBack (DFB) lasers. The later type is well suited for DWDM applications.
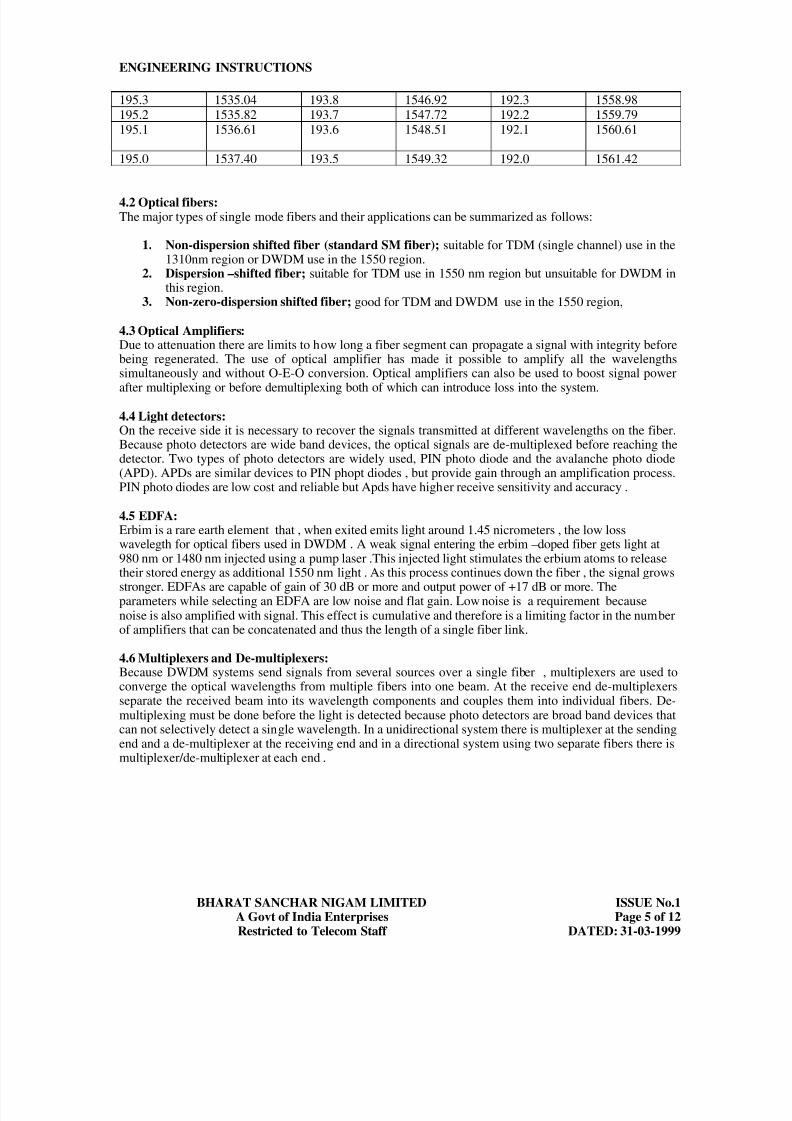
It is capable of high speeds , has better S/N ratio , has superior linearity. They also have center frequenciesin the region from 1520 nm to 1565 nm which is compatible with EDFAS . Cooled DFB lasers areavailable in specially selected wavelengths. The ITU draft standard G.692 defines a laser grid for point-to-point WDM systems based on 100 GHz wavelength spacing with a center wavelength of 1553.52 nm.
Table 1-1: ITU Grid
Frequency(THz)
Wavelength(nm)
Frequency(THz)
Wavelength(nm)
Frequency(THz)
Wavelength(nm)
196.1 1528.77 164.6 1540.56 193.1 1552.52
196.0 1529.55 194.5 1541.35 193.0 1553.33
195.9 1530.33 194.4 1542.14 192.9 1554.13
195.8 1531.12 194.3 1542.94 195.8 1554.94
195.7 1531.9 194.2 1543.73 192.7 1555.75
195.6 1532.68 194.1 1544.53 192.6 1556.56
195.5 1533.47 194.0 1545.32 195.5 1557.36
195.4 1534.25 193.9 1546.12 192.4 1558.17
8/6/2019 DraftEI Dwdm System
http://slidepdf.com/reader/full/draftei-dwdm-system 5/12
ENGINEERING INSTRUCTIONS
BHARAT SANCHAR NIGAM LIMITEDA Govt of India EnterprisesRestricted to Telecom Staff
ISSUE No.1Page 5 of 12
DATED: 31-03-1999
195.3 1535.04 193.8 1546.92 192.3 1558.98
195.2 1535.82 193.7 1547.72 192.2 1559.79
195.1 1536.61 193.6 1548.51 192.1 1560.61
195.0 1537.40 193.5 1549.32 192.0 1561.42
4.2 Optical fibers:The major types of single mode fibers and their applications can be summarized as follows:
1. Non-dispersion shifted fiber (standard SM fiber); suitable for TDM (single channel) use in the1310nm region or DWDM use in the 1550 region.
2. Dispersion –shifted fiber; suitable for TDM use in 1550 nm region but unsuitable for DWDM inthis region.
3. Non-zero-dispersion shifted fiber; good for TDM and DWDM use in the 1550 region,
4.3 Optical Amplifiers:Due to attenuation there are limits to how long a fiber segment can propagate a signal with integrity beforebeing regenerated. The use of optical amplifier has made it possible to amplify all the wavelengthssimultaneously and without O-E-O conversion. Optical amplifiers can also be used to boost signal power
after multiplexing or before demultiplexing both of which can introduce loss into the system.
4.4 Light detectors:On the receive side it is necessary to recover the signals transmitted at different wavelengths on the fiber.Because photo detectors are wide band devices, the optical signals are de-multiplexed before reaching thedetector. Two types of photo detectors are widely used, PIN photo diode and the avalanche photo diode(APD). APDs are similar devices to PIN phopt diodes , but provide gain through an amplification process.PIN photo diodes are low cost and reliable but Apds have higher receive sensitivity and accuracy .
4.5 EDFA:Erbim is a rare earth element that , when exited emits light around 1.45 nicrometers , the low losswavelegth for optical fibers used in DWDM . A weak signal entering the erbim –doped fiber gets light at980 nm or 1480 nm injected using a pump laser .This injected light stimulates the erbium atoms to releasetheir stored energy as additional 1550 nm light . As this process continues down the fiber , the signal grows
stronger. EDFAs are capable of gain of 30 dB or more and output power of +17 dB or more. Theparameters while selecting an EDFA are low noise and flat gain. Low noise is a requirement becausenoise is also amplified with signal. This effect is cumulative and therefore is a limiting factor in the numberof amplifiers that can be concatenated and thus the length of a single fiber link.
4.6 Multiplexers and De-multiplexers:Because DWDM systems send signals from several sources over a single fiber , multiplexers are used toconverge the optical wavelengths from multiple fibers into one beam. At the receive end de-multiplexersseparate the received beam into its wavelength components and couples them into individual fibers. De-multiplexing must be done before the light is detected because photo detectors are broad band devices thatcan not selectively detect a single wavelength. In a unidirectional system there is multiplexer at the sendingend and a de-multiplexer at the receiving end and in a directional system using two separate fibers there ismultiplexer/de-multiplexer at each end .

8/6/2019 DraftEI Dwdm System
http://slidepdf.com/reader/full/draftei-dwdm-system 6/12
ENGINEERING INSTRUCTIONS
BHARAT SANCHAR NIGAM LIMITEDA Govt of India EnterprisesRestricted to Telecom Staff
ISSUE No.1Page 6 of 12
DATED: 31-03-1999
Figure 1-4: Multiplexing and De-multiplexing in a Unidirectional System
MUX DEMUX
MUX DEMUX
Figure 1-5: Multiplexing and De-multiplexing in a Bi-directional system
MUX/DEMUX MUX/DEMUX
4.7 Optical Add/drop Multiplexers:Between multiplexing and de multiplexing points in a DWDM system, multiple wavelengths exists. It isoften required to be able to remove or insert one or more wave lengths at some points along this span. Anoptical add/drop multiplexer performs this function rather than combining or separating all wave lengths,the OADM can remove some while passing others on. OADMs are similar in many respects to SONETADM except that only optical wave lengths are added and dropped and no conversion of the signal fromoptical to electrical takes place. There are two types of OADMs . The first generation is a fixed device thatis physically configured to drop specific pre determined wave lengths while adding others. The secondgeneration is reconfigurable and capable of dynamically selecting which wave length are added and
dropped
5.0 Installation of DWDM System:
The standard procedures being followed while unpacking the equipment are to be followed before the startof installation
8/6/2019 DraftEI Dwdm System
http://slidepdf.com/reader/full/draftei-dwdm-system 7/12
ENGINEERING INSTRUCTIONS
BHARAT SANCHAR NIGAM LIMITEDA Govt of India EnterprisesRestricted to Telecom Staff
ISSUE No.1Page 7 of 12
DATED: 31-03-1999
Make sure that the packing has been properly positioned, refer to the symbol, then open the caseremove the shock proof material remove the goods from the case , bag and any other protection , removethe plastic bags cello taped to the pack and containing accessories that the goods are not damaged and thatthey correspond to those indicated on the packing list enclosed in the envelope, otherwise contact theagencies representative
Mechanical installation, possibility of personal injury has to be prevented. Brace top of rack / sub rack
during movements to prevent tipping and to avoid strains that can twist on damage back plane
5.1 Installation has been sub-divided into the following phases:
1. Rack positioning and fastening.2. Electrical connections.3. Sub-rack insertion into the rack
When positioning the rack make sure that at least 600mm space has been left in front of it. Refer to thestation lay out to see rack row assignment. The rack can be fastened to the station structure according toeither fixing the rack using expansion bolts on the concrete floor or fixing to the floating floor.
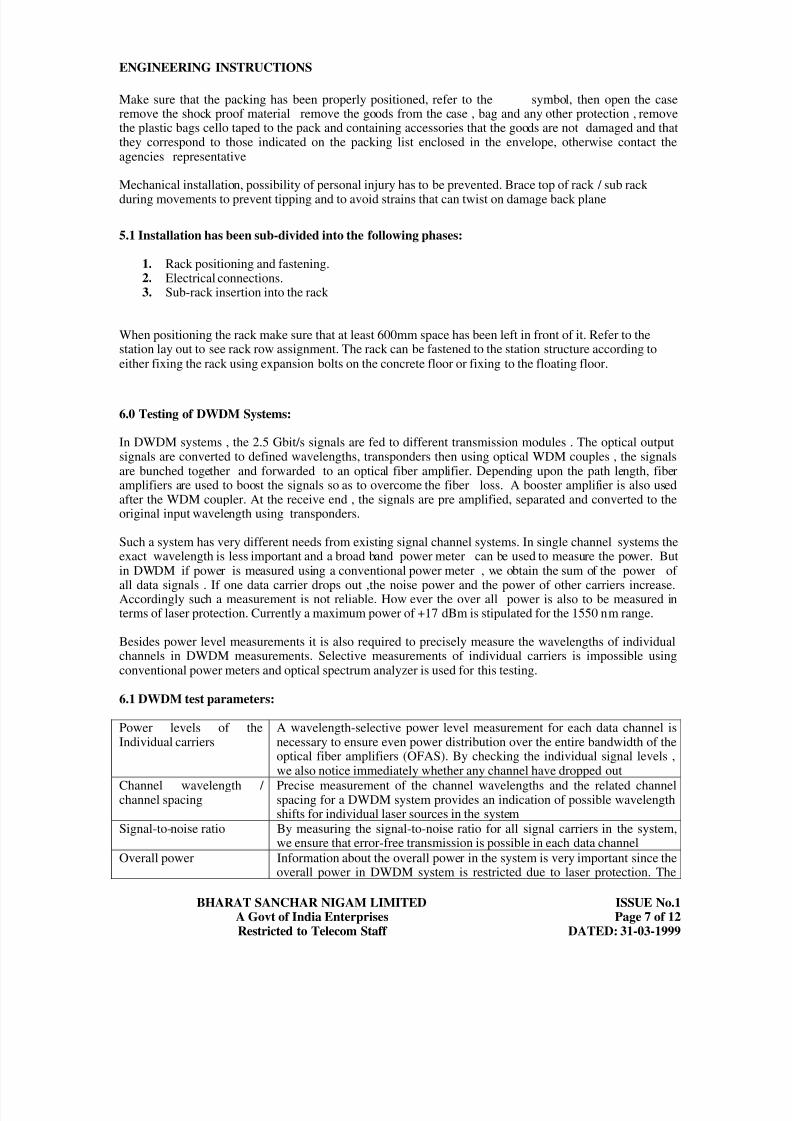
6.0 Testing of DWDM Systems:
In DWDM systems , the 2.5 Gbit/s signals are fed to different transmission modules . The optical outputsignals are converted to defined wavelengths, transponders then using optical WDM couples , the signalsare bunched together and forwarded to an optical fiber amplifier. Depending upon the path length, fiberamplifiers are used to boost the signals so as to overcome the fiber loss. A booster amplifier is also usedafter the WDM coupler. At the receive end , the signals are pre amplified, separated and converted to theoriginal input wavelength using transponders.
Such a system has very different needs from existing signal channel systems. In single channel systems theexact wavelength is less important and a broad band power meter can be used to measure the power. Butin DWDM if power is measured using a conventional power meter , we obtain the sum of the power of
all data signals . If one data carrier drops out ,the noise power and the power of other carriers increase.Accordingly such a measurement is not reliable. How ever the over all power is also to be measured interms of laser protection. Currently a maximum power of +17 dBm is stipulated for the 1550 nm range.
Besides power level measurements it is also required to precisely measure the wavelengths of individualchannels in DWDM measurements. Selective measurements of individual carriers is impossible usingconventional power meters and optical spectrum analyzer is used for this testing.
6.1 DWDM test parameters:
Power levels of theIndividual carriers
A wavelength-selective power level measurement for each data channel isnecessary to ensure even power distribution over the entire bandwidth of theoptical fiber amplifiers (OFAS). By checking the individual signal levels ,we also notice immediately whether any channel have dropped out
Channel wavelength / channel spacing
Precise measurement of the channel wavelengths and the related channelspacing for a DWDM system provides an indication of possible wavelengthshifts for individual laser sources in the system
Signal-to-noise ratio By measuring the signal-to-noise ratio for all signal carriers in the system,we ensure that error-free transmission is possible in each data channel
Overall power Information about the overall power in the system is very important since theoverall power in DWDM system is restricted due to laser protection. The

8/6/2019 DraftEI Dwdm System
http://slidepdf.com/reader/full/draftei-dwdm-system 8/12
ENGINEERING INSTRUCTIONS TRANSMISSIONCPE STM
EI NO:
BHARATH SANCHAR NIGAM LIMITED Page 8 of 12(A Govt of India Enterprise) Issue No:Restricted to Telecom Staff only Date:
maximum value is currently +17 dBm (+20 dBm im the future ).Using power level plans; the overall system can be checked to reliably avoidexceeding this limit. A check of the overall power before and after a fiberamplifier also serves as a functional check of this component.
Crosstalk This parameter is important primarily in the area of optical DWDM couplers,where it provides a quality indication for these system components.
However, interference is difficult to assess under field conditions
6.2 DWDM standards:
In order to plan and implement flexible and future-proof DWDM systems and components, basic standardsare necessary. This is the only way to ensure that highly variable components and modules from differentmanufacturers comply with defined interface parameters and interact properly. Accordingly, the individualmanufacturers must agree on specific focus wavelengths in order to ensure problem-free interplay of thevarious system elements. It is common to divide the wavelength range between 1530 and 1565 mm intotwo bands. The band below 1545 mm is know as the short band and over 1545 mm is the long band.
6.3 Current standards:ITU_T Recommendation G.692(“Optical Interfaces for Multichannel Systems with Optical Amplifiers”)
defines interface parameters for optical DWDM systems with 4 and 8 data channels at bit rates up to theOC-48 / STM-16 standard and path lengths between fiber amplifiers of 80,120, or 160 Km withregenerator spacing up to 640 Km. The revised Rec.G.692 will also define 16- and 32- channel systems upto the OC-192 /STM-64 standard as well as bi-directional systems. According to ITU-T Rec.G.692, all datachannels in a DWDM system should fall in a specified 100 GHz channel grid. The ITU-T grid is based on areference center frequency of 193.1 THz, which corresponds to an optical wavelength of 1552.52 mm.Conversion between center frequency f and focus wavelength ^ is based on the relation c = ^ * f using theexact value for the speed of light c=299792458 m/s.
6.4 System reference points:According to ITU-T Rec.G.692, reference test points are to be provided in DWDM system:
• S1 to Sn are reference points directly at the output of the individual optical transmitters 1 to n of the DWDM system.
• Rm1 to Rmn are reference points for the individual fiber directly before the input of the WDM
multiplexer . MPI-S is the test point directly at the output of the WDM multiplexer and MPI-R afurther test point directly at the input of the de-multiplexer.
• Sd1 to Sdn are the corresponding reference points directly at the output of the de-multiplexer andR1 to Rn are the reference points at the input of the individual receiver modules of the DWDMsystem.
6.5 Supervisory/Service channels:In order to monitor and control the overall communication system, the use of separate carriers(lasers) isrecommended, preferably located within or close to the third optical window (but not in the user range of the fiber amplifiers). Wavelengths of 1480, 1510,and 1625 nm are most commonly employed for thispurpose.
6.6 S/N measurements:Since optical network are analog creatures, the signal-to-noise (S/N) ratio is an obvious choice when it
comes to assessing the transmission quality. However , the S/N is a necessary quality criterion but not asufficient one. On the one hand, there is no clear relationship between the S/N ratio and bit error (BER). Onthe other hand , in an all-optical network (AON), only the optical S/N ratio can be determined and not theS/N ratio at the decoder input since the latter is a function of the properties of the receiver and is not clearlyrelated to the optical S/N ratio.
Moreover, the S/N ratio alone does not reflect any of the dispersion-related delay distortion, which is thelimited effect at very high speeds. Although static functions such as chromatic dispersion can be suitablycompensated, delays that fluctuate over time (e.g. due to polarization mode dispersion, PWD) remain.

8/6/2019 DraftEI Dwdm System
http://slidepdf.com/reader/full/draftei-dwdm-system 9/12
ENGINEERING INSTRUCTIONS TRANSMISSIONCPE STM
EI NO:
BHARATH SANCHAR NIGAM LIMITED Page 9 of 12(A Govt of India Enterprise) Issue No:Restricted to Telecom Staff only Date:
6.7 Determining the bit error ratio (BER):All in all, the decisive parameter in determining the transmission quality of a system is still the bit errorratio. The S/N ratio of the signal-to-noise-power ratio is only a rough guide. However, a low S/N ratio isalways a direct indication of a system error. The opposite is not necessarily true, for the reasons mentionedabove. To make a qualitative assessment requires a more in-depth check of the actual signal using a state-of-the art bit error analyzer.
6.8 Test solutions for quality monitoring:Together, an optical spectrum analyzer and a bit error test set are ideal for comprehensive qualitymonitoring on transparent DWDM systems. Conventional spectrum analyzers can precisely determine allof the optical parameters, but do not provide external filter functions for further bit error analysis. Some of DWDM System Analyzer is fitted with an external monitor output for this application. The OSA’smonochromator can be automatically tuned to the desired wavelength in order to directly evaluate theappropriate 2.5 Gbit/s channel in a DWDM system using a bit error analyzer(e.g. ANT-20). This is thequick and easy way to do selective error analysis work in a single channel of a multiple carrier system atthe bit, frame and alarm levels. Jitter measurements are just as simple.
6.9 Spectrum analysis and Power level adjustment:
The power level balance of a DWDM system is an important issue when it comes to system configuration.In systems with optical fiber amplifiers, if no countermeasures are taken, the channel-based power levelfluctuates as a function of the current channel usage since the total available power of the amplifier isdistributed among the currently used channels. This can significantly restrict the dynamic range of theoptical receivers and produce saturation effects in case of channel drop outs. This makes it necessary torecord the signal spectrum at the output of the fiber amplifiers and cross-connects using a spectrumanalyzer and adjust the output levels as necessary. Variable attenuators directly integrated into the opticalcross-connect are useful for adjusting the levels.
Particularly with cascaded fiber amplifiers, a gain tilt arises if no countermeasures are taken, i.e. the signalspectrum begins to tilt as the number of amplifiers increases. Here as well, selective levels measurementsand appropriate adjustment of the different channel levels is very important.
7.0 DWDM system analysis:There are three ways of analyzing DWDM systems. This is with reference to particular OSAs:
1. GRAPH mode lets you examine test results using zoom, cursor and marker functions. Youcan store reference traces and display relative results. This mode is very useful for fasttroubleshooting.
2. WDM mode provides a numerical listing of max 256 channels along with the related systemparameters such as wavelength, power level and OSNR. A bar graph shows the powerdifference between the displayed carriers. You can select a drift display to handle longer testcycles.
3. Filter functions let you select single DWDM channels for analysis the bit with an externalSDH tester. This mode makes it easy to selectively analyze the errors at bit, frame and alarmlevels in a single channel and make jitter measurements, all in a multi channel system.
8.0 Test configuration:
The OSA can be flexibly configured to handle the current DWDM system under test and most commonmeasurements. Changes can be saved as configuration files, which are used to immediately perform andevaluate measurements on identical systems (e.g. DWDM-8 , DWDM-16). The main settings relate to thesystem under test:
1. DWDM channel grid2. Power threshold for channel evaluation3. Min. optical signal-to-noise ratio (OSNR)
8/6/2019 DraftEI Dwdm System
http://slidepdf.com/reader/full/draftei-dwdm-system 10/12
ENGINEERING INSTRUCTIONS TRANSMISSIONCPE STM
EI NO:
BHARATH SANCHAR NIGAM LIMITED Page 10 of 12(A Govt of India Enterprise) Issue No:Restricted to Telecom Staff only Date:
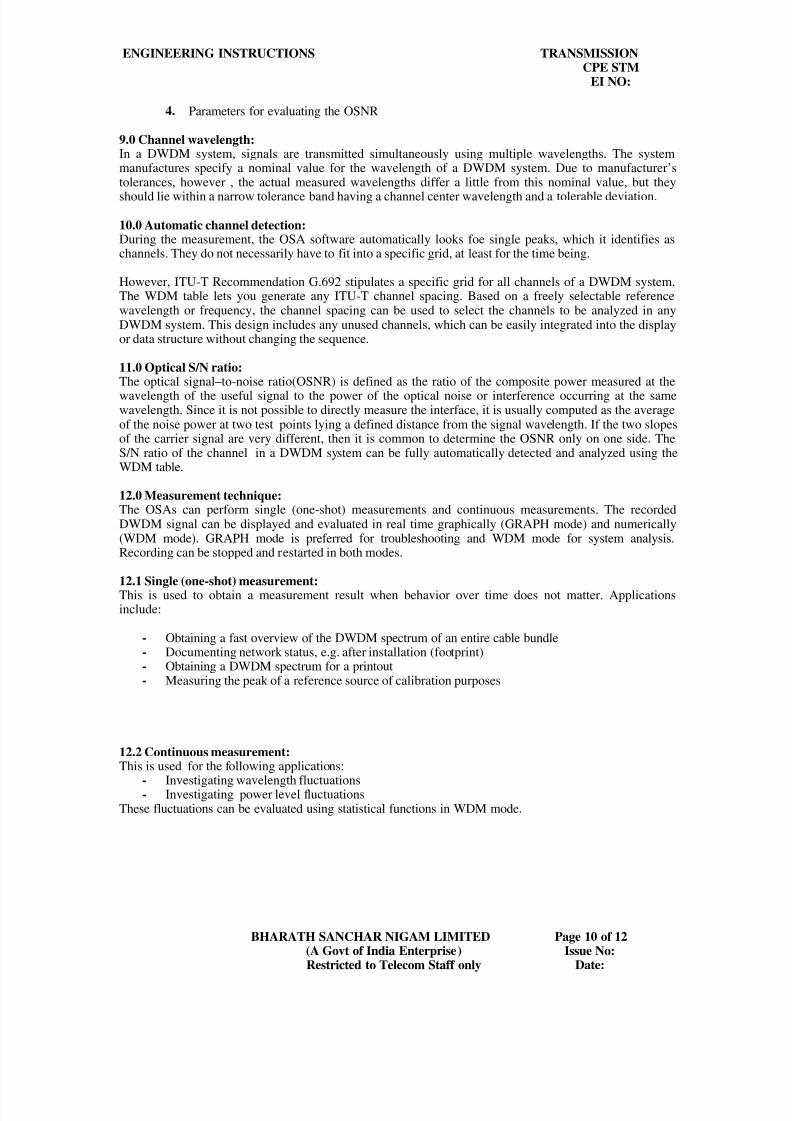
4. Parameters for evaluating the OSNR
9.0 Channel wavelength:In a DWDM system, signals are transmitted simultaneously using multiple wavelengths. The systemmanufactures specify a nominal value for the wavelength of a DWDM system. Due to manufacturer’stolerances, however , the actual measured wavelengths differ a little from this nominal value, but they
should lie within a narrow tolerance band having a channel center wavelength and a tolerable deviation.
10.0 Automatic channel detection:During the measurement, the OSA software automatically looks foe single peaks, which it identifies aschannels. They do not necessarily have to fit into a specific grid, at least for the time being.
However, ITU-T Recommendation G.692 stipulates a specific grid for all channels of a DWDM system.The WDM table lets you generate any ITU-T channel spacing. Based on a freely selectable referencewavelength or frequency, the channel spacing can be used to select the channels to be analyzed in anyDWDM system. This design includes any unused channels, which can be easily integrated into the displayor data structure without changing the sequence.
11.0 Optical S/N ratio:The optical signal–to-noise ratio(OSNR) is defined as the ratio of the composite power measured at the
wavelength of the useful signal to the power of the optical noise or interference occurring at the samewavelength. Since it is not possible to directly measure the interface, it is usually computed as the averageof the noise power at two test points lying a defined distance from the signal wavelength. If the two slopesof the carrier signal are very different, then it is common to determine the OSNR only on one side. TheS/N ratio of the channel in a DWDM system can be fully automatically detected and analyzed using theWDM table.
12.0 Measurement technique:The OSAs can perform single (one-shot) measurements and continuous measurements. The recordedDWDM signal can be displayed and evaluated in real time graphically (GRAPH mode) and numerically(WDM mode). GRAPH mode is preferred for troubleshooting and WDM mode for system analysis.Recording can be stopped and restarted in both modes.
12.1 Single (one-shot) measurement:This is used to obtain a measurement result when behavior over time does not matter. Applicationsinclude:
- Obtaining a fast overview of the DWDM spectrum of an entire cable bundle- Documenting network status, e.g. after installation (footprint)- Obtaining a DWDM spectrum for a printout- Measuring the peak of a reference source of calibration purposes
12.2 Continuous measurement:This is used for the following applications:
-
Investigating wavelength fluctuations- Investigating power level fluctuationsThese fluctuations can be evaluated using statistical functions in WDM mode.

8/6/2019 DraftEI Dwdm System
http://slidepdf.com/reader/full/draftei-dwdm-system 11/12
ENGINEERING INSTRUCTIONS TRANSMISSIONCPE STM
EI NO:
BHARATH SANCHAR NIGAM LIMITED Page 11 of 12(A Govt of India Enterprise) Issue No:Restricted to Telecom Staff only Date:
13.0 Wavelength fluctuations: By repeatedly recording measurement data, wavelength fluctuations can bestatistically evaluated. In WDM mode, the minimum, maximum and average wavelength can bedetermined for each channel.
14.0 Power level fluctuations:By repeatedly recording measurement data, power level fluctuations can be statistically evaluated. There
are two possibilities; In GRAPH mode, the trace of all mo\maximum values and the trace of all minimumvalues can be formed and displayed. The difference traced them shows where the greatest fluctuationsoccur.
14.1 Evaluating power level fluctuations (graphics):This is a way of detecting power level fluctuations at a glance. This technique is based on the assumptionthat the wavelength is stable ; otherwise, the results are unusable.
14.2 Evaluating power level fluctuations (table):The OSA software generates a table of statistical data on power level fluctuations. Besides the channelnumber and wavelength, the table contains for each channel the instantaneous power level and theminimum, maximum and average power level.
15.0 GRAPH mode:
In GRAPH mode, measurement data are displayed as a trace (DWDM spectrum)Each single measurement and each minimum, maximum or difference trace can be archived in GRAPHmode as a complete trace data set. The maximum power difference between the transmitted DWDMchannels can be determined using the “power difference function”. In GRAPH mode the composite powerfor the recorded signal spectrum cam be displayed . This is the fast and easy way to determine thetransmitted power for individual system channels including the super imposed spurious spectrum of opticalamplifiers for any wavelength range.
16.0 WDM mode:In this mode measurements are analyzed numerically, results are displayed in tabular format according tothe automatic identification of the DWDM channels or the DWDM grid specifications. A bar graph alsoclarifies the power level of the individual carriers and makes it easy to check the minimum power levelsduring single measurements. The OSNR values are computed online for each DWDM channel. Colorcoded indications of threshold violations helps to identify the faulty channels immediately.In WDM mode all channels in a DWDM system, which meet minimum power level and minimum OSNRcriteria, can be displayed easily. Also in this mode the composite power can be directly read off for thedisplayed system channels. This is computed online in WDM modeThe data can be stored in the OSA’s hard disk or on a disk as measurement traces (GRAPH mode) ,Evaluations (WDM mode) and configuration data. All these data types can also be printed as seen on thescreen either directly to a printer or to a file.
17.0 Filter mode:Filter mode works with instruments equipped with monitor output. It is used to select a single 2.5 Gbit/sDWDm channel from the overall spectrum. This channel is then available for further analysis with anSDH/SONET tester with optical interfaces(e.g. ANT-20) on the digital signal level. It is easy to selectivelyanalyze the errors at the bit, frame and alarm levels in a single channel and make jitter measurements in amulti channel system.

8/6/2019 DraftEI Dwdm System
http://slidepdf.com/reader/full/draftei-dwdm-system 12/12
ENGINEERING INSTRUCTIONS TRANSMISSIONCPE STM
EI NO:
BHARATH SANCHAR NIGAM LIMITED Page 12 of 12(A Govt of India Enterprise) Issue No:Restricted to Telecom Staff only Date:
18.0 Reference: Seminar on DWDM at Ernakulam
19.0 Abbreviations:
SL. No. Short Form Full Form
1. ADM Add Drop Multiplexer
2. DFB lasers Distributed Feed Back lasers
3. DWDM Dense Wave Length Division Multiplexing
4. EDFAS Erbium Doped Fibre Amplifiers
5. GBPS Giga Bits Per Second
6. ITU International Telecommunication Union
7. SDH Synchronised Digital Hierarchy
8. WDM Wave Length Division Multiplexing