draft* web-based survey best practices for the operations...
TRANSCRIPT

1
DRAFT* Web-Based Survey Best Practices for the
Operations Management Researcher Toolkit
Eve D. Rosenzweig
The Goizueta Business School Emory University
1300 Clifton Road NE Atlanta, GA 30322
E-mail: [email protected] Phone: (404) 727-4912 Fax: (404) 727-2053
Aleda V. Roth
The Kenan-Flagler Business School The University of North Carolina at Chapel Hill
Campus Box 3490, McColl Building Chapel Hill, NC 27599-3490
E-mail: [email protected] Phone: (919) 962-3181 Fax: (919) 962-6949
Wendell G. Gilland
The Kenan-Flagler Business School The University of North Carolina at Chapel Hill
Campus Box 3490, McColl Building Chapel Hill, NC 27599-3490
E-mail: [email protected] Phone: (919) 962-8465 Fax: (919) 962-4266
Kenan-Flagler Business School Working Paper, University of North Carolina, Chapel Hill NC, 2004. *Copyright Rosenzeig, Roth and Gilland, 2004. All rights reserved. Please do not distribute without expressed permission of authors.
2
Web-Based Survey Best Practices for the Operations Management Researcher Toolkit
1. Introduction (keep this section short)
Researchers and practitioners alike are increasingly turning to web-based surveys as a means
to collect information to describe, compare, or explain knowledge, practices, and behavior (Fink
1995; Morrel-Samuels 2003). For the purposes of this research, a web-based survey involves a
computerized, self-administered questionnaire that respondents complete by accessing the World
Wide Web (WWW) and using compatible web browsers (Bowers 1998/1999; Simsek and Veiga
2001). Touted benefits for utilizing web-based surveys in lieu of more traditional mail (paper-
based) surveys include design flexibility, faster response time, reduced item non-response, and
lower costs (Boyer et al. 2001, 2002; Cobanoglu et al. 2001; Couper 2000; Dillman 2000; Gaddis
1998; Goldby et al. 2001; Klaussen and Jacobs 2001; Schaefer and Dillman 1998; Schillewaert
et al. 1998; Simsek and Veiga 2001; Stanton and Rogelberg 2001). Despite the much-publicized
benefits, use of the WWW as a survey tool in operations management (OM) empirical research is
still at an early stage of adoption, and questions remain regarding how web-based surveys differ
from mail surveys. Likewise, web-based survey usage emerged in the practitioner literature,
often in the form of entertainment surveys like “question of the day” polls popular on many
media sites (see e.g., http://www.kovr13.com/daily/qod.htm) that do not follow “good” empirical
science techniques (Couper 2000; Sheenan and Hoy 1999). As a result, guidance on conducting
rigorous empirical research in OM using this novel survey tool as compared to more
conventional mail surveys is warranted.
3
“The ability to collect survey data quickly and inexpensively via the Web seems to have enticed
many to launch Web-based surveys…It is important, however, for researchers to consider the
advantages and disadvantages of Web-based surveys before collecting data” (Umbach 2004, 23).
This paper is divided into four additional sections. In section two we draw from the literature
and expert web designers to highlight the key aspects of questionnaire development for web-
based surveys in contrast to mail surveys. In the context of a research project that utilized a web-
based survey, we provide a set of web-based survey design choices and the tradeoffs associated
with those choices. Section three compares traditional mail and web-based survey
administration practices through the lens of good empirical research methodology. Counter to
applications in the practitioner literature, we show that traditional mail and web-based survey
administrative methodology do not differ substantially. Instead, the main differences between
the two modes of data collection lie in the design of the survey instrument. Finally, section four
offers some concluding thoughts regarding the use of web-based surveys in OM research.
2. Large-Scale Empirical Research in OM
In the early 1980s, several leading OM scholars called for fellow researchers to take a more
managerially-oriented, system-wide approach to future studies. Buffa (1980), for example,
highlighted the need for research on complex, managerial issues capturing intra- and inter-
functional factors and relationships, while Chase (1980, 11) stressed the need for integrative
research from a social science perspective, which considers people as “human beings rather than
as multi-purpose tools or material handling devices.” In response to this call, OM researchers
utilized empirical research designs, and in particular survey research designs (Flynn et al. 1990;
Malhotra and Grover 1998; Rungtusanatham et al. 2003), to explore more strategic, behavioral
issues such as operations strategy (Menor et al. 2001; Miller and Roth 1994; Swamidass and

4
Newell 1987; Voss et al. 2004), quality management (Anderson et al. 1995; Flynn et al. 1994),
and supply chain management Frohlich and Westbrook 2001; Rosenzweig et al. 2003). As noted
by Swamidass (1991), Malhotra and Grover (1998), and Boudreau et al. (2003), topics such as
these are often too “fuzzy” and “messy” to investigate using more traditional OM deductive tools
like mathematics and operations research. For this reason, the number of OM articles employing
a survey research design has grown at a relatively fast pace over the past several decades.
According to Rungtusanatham et al. (2003, 484), “Survey research in OM…has blossomed,
becoming increasingly accepted as a legitimate methodology for understanding the core issues
and problems that our discipline faces.”
2.1. Survey Research
Surveys are typically used to collect representative sample data at the firm-, business unit-,
plant- or individual-level such that inferences can be made about the population1 of interest
(Fowler 1988; Klaussen and Jacobs 2001; Nesbary 2000). There are currently three major
modes of data collection in survey research: 1) structured interviews conducted in person or by
telephone ; 2) self-administered, paper-based questionnaires distributed by mail (mail surveys)
(Dillman 2000); and more recently, 3) self-administered questionnaires accessed electronically
via the Internet (web-based surveys) (Dillman 2000). Note that while many studies utilize a
single method for collecting data (e.g., structured interviews, mail surveys, or web-based
surveys), it is not uncommon for a study to employ combinations of data collection methods
(Fowler 1988).
1 A population embodies the group of people, organizations, events, etc., that the researcher intends to describe or make generalizations about (Vogt 1993).

5
The three data collection methodologies vary on what the literature refers to as “media
richness” (see Table 1), or the communication medium’s ability to convey messages; a rich
medium is said to facilitate insight and rapid understanding (Daft and Lengel 1986; Daft et al.
1987; Froehle and Roth 2004; Palmer 2002; Vickery et al. 2004). Media richness is
operationalized by the communication medium’s 1) capacity to provide immediate feedback,
which allows questions to be asked and answered in real-time; 2) use of multiple cues including
voice inflection, gestures, words, symbols, numbers, etc., as well as the range of meaning
conveyed by language symbols (language variety); and 3) personal focus, or how customized the
message is to the targeted respondent. We explore the richness afforded by each data collection
mode and highlight the trade-offs associated with these mediums in the sections that follow.
Table 1: Media Richness of Survey Data Collection Modes
FeedbackMultiple cues and language variety
Personal focus
Structured interviews
high medium/high high
Mail surveys low low low
Web-based surveys
medium medium medium
Criteria
Medium
Source: Adapted from Daft and Lengel (1986), Daft et al. (1987) and Vickery et al. (2004)
2.1.1. Structured Interviews
Interviewing involves the collection of data in real-time by means of a verbal exchange
between the researcher (interviewer) and the respondent (interviewee). Structured interviews,
whether conducted in person or by telephone, follow a script or interview protocol which is
much like a questionnaire, as it specifies the questions that will be asked of the respondent, often

6
times with response choices measured on a 5- or 7-point Likert scale (Creswell 1994; Dillman
1978; Edwards 1998; Flynn et al. 1990). These protocols also contain instructions for probing—
interviewers may deviate from the questionnaire and ask probing questions to clarify the
response or to garner a more complete response, which is clearly an option not afforded by mail
surveys, for example (Kahn and Cannell 1957). Nonetheless, probing creates a clear opportunity
for interviewers to behave differently across respondents, which may bias responses and
ultimately reduce the validity of the data. Opportunities for bias also occur if interviewees feel
pressured to respond in a way they perceive to be desired by the interviewer (social desirability
bias). Compared to mail and web-based surveys, however, use of structured interviews typically
results in less item non-response.
2.1.1.1. Face-to-Face Interviews
During face-to-face structured interviews, interviewers and interviewees offer multiple verbal
and non-verbal cues such as voice inflection and body language, which enables both parties to
more fully convey his or her views (Edwards 1998). Face-to-to face interviews also facilitate
rapid question-and-answer, thereby providing “immediate feedback that allows understanding to
be validated and interpretations corrected” (Vickery et al. 2004, 1108). Capabilities such as
these permit interviewers to explore more complex topics and questions as compared to
researchers utilizing mail and web-based survey to collect data (Dillman 1978).
While the benefits of rich information exchange are apparent, few researchers are able to
conduct large-scale, face-to-face interviews given the sizeable amount of resources required to
pursue this endeavor (Dillman 1978). Further, the typical unit of analysis in OM research is at
the firm-, business unit-, or plant-level rather than the individual-level, and as a result, many
target research populations studied by OM scholars are geographically dispersed. This makes it

7
even more difficult for the OM researcher to conduct face-to-face interviews on a large-scale as
compared to their marketing and organizational behavior counterparts, who often employ an
individual-level unit of analysis (Klassen and Jacobs 2001). The 1997 International Service
Study (ISS), a multi-country, multi- industry research project led by scholars a t the Kenan-Flagler
Business School at the University of North Carolina—Chapel Hill, the Marshall School of
Business at the University of Southern California, and the London Business School, represents a
notable exception to conducting large-scale, face-to-face interviews in OM (See Roth et al. 1997
and Voss et al. 1997 for details of the study). These researchers consciously employed face-to-
face structured interviews to collect data rather than mail surveys because interviews have been
shown to reduce the potential for response bias in cross-cultural research (Clarke 2001).
2.1.1.2. Telephone Interviews
Structured interviews conducted by telephone can be administered at a faster pace and at
lower cost than face-to-face interviews, but relatively less rich information can be exchanged
since non-verbal cues are no longer feasible (Vickery et al. 2004). Further, difficulties may arise
when the telephone interviewer attempts to ask long and complex questions, or when the survey
itself is time consuming to complete. In this case, respondents are expected to tire quickly
because they must listen carefully and rely solely on their sense of hearing for comprehension,
often times with multiple competing distractions taking place in the background (Dillman 1978).
2.1.2. Mail Surveys
In mail surveys, the target respondent reads and responds to questions without the assistance
of an interviewer, thereby limiting the amount of cues and language variety. The majority of
survey research in OM has thus far been conducted using these self-administered, paper-and
8
pencil questionnaires (Flynn et al. 1990; Klassen and Jacobs 2001; Rungtusanatham et al. 2003).
Mail surveys offer several distinct benefits over structured interviews. For example, the costs
associated with collecting data from geographically dispersed sample units are relatively low,
which makes mail surveys an attractive approach for conducting large-scale survey research.
Moreover, social desirability bias is minimized, and interviewer-related bias is effectively
removed. Nonetheless, mail surveys typically offer little or no opportunity for immediate
feedback and personalization, which may impact the target respondent’s willingness to
participate in the study.
2.1.3. Web-Based Surveys
Web-based surveys attempt to combine the information richness afforded by structured
interviews with the geographic reach and low cost associated with mail surveys. According to
Vickery et al. 2004, 1108),
“Electronic media are not quite as rich as telephone [and the face-to-face medium]: While natural language can be utilized, tone of voice is missing. While most electronic media are not visual, video clips or photos can be used. Communication can be personalized and feedback can be fast, at least potentially. Electronic media can also encompass numeric language—an added advantage.”
In addition, web-based surveys can generally be implemented at a faster rate than structured
interviews and mail surveys. For example, Umbach (2004, 24) concludes,
“A mail survey can take several days to reach an individual and several days to return after completion. Assuming that an individual completes the survey immediately, the process can take a minimum of five to seven days. With the Web-based surveys, the invitation reaches the subject almost instantaneously.”
Moreover, upon survey receipt, the data entry task is automated, which results in time and cost
savings as well as improved coding accuracy. Note, however, that web-based surveys typically
take more time to develop than mail surveys because of the “need to learn the software package

9
and to carefully pre-test and de-bug the survey to make it as simple and transparent as possible”
(Boyer et al. 2002, 370).
2.2. Survey Research Process
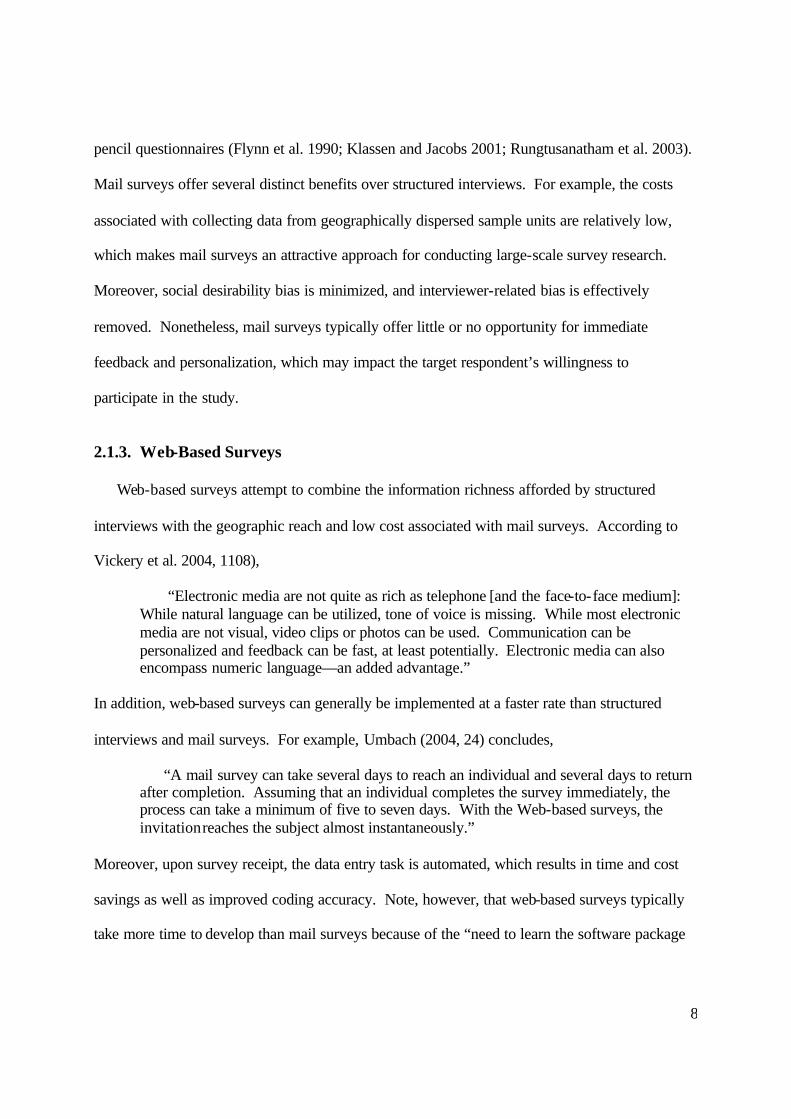
Figure 1 provides an overview of a rigorous process for conducting survey research. In the
first stage, the theoretical domain and corresponding operational definitions of the constructs to
be examined are specified. Once the items and measurement scales developed during the first
stage are shown to exhibit reasonable psychometric properties, the next step involves identifying
the research population and list from which the sample is to be drawn. It is in this second stage
where the survey instrument is designed and tested prior to full-scale implementation. During
the third stage, the survey is administered to the targeted respondents, with special care taken to
attain a high response rate and an unbiased sample. In the fourth stage, the data is coded and
subjected to multiple empirical tests, including tests for nonresponse bias, common methods
variance, as well as confirmatory factor analyses in order to establish scale reliability and
validity. Hypothesis tests are also carried out during this step by means of various empirical
techniques such as regression analysis, structural equation modeling, cluster analysis, etc.
Reports (e.g., Executive Summary) are generated and distributed during the fifth and final step of
the process. We briefly describe each step comprising the survey research process in more detail
below.
10
Figure 1: A Systematic Approach for Conducting Survey Research
Source: Adapted from Flynn et al. (1990), Malhotra and Grover (1998), and Menor and Roth (2003)
Survey Administration
• Implement target respondent solicitation strategy
• Control access • Ensure respondent anonymity
Theoretical Domain and Operational Definitions of
Constructs
• Generate items • Purify and pre-test items and
measurement scales
Data Analysis
• Code data • Analyze nonrespondent
characteristics • Conduct preliminary analysis • Conduct confirmatory analyses
of scales and test hypotheses
Report Generation
• Provide preliminary report • Provide final report
Questionnaire Development
• Define target population and sample frame
• Design survey instrument • Pilot test instrument

11
2.2.1. Stage 1: Theoretical Domain and Operational Definition of Constructs
2.2.1.1. Generate Items
The first step in the survey research process involves the identification of measurement items
within the theoretical domain that are thought to measure the hypothetical variables of interest
(Churchill 1979; O’Leary-Kelly and Vokurka 1998). Single-item measures are insufficient to
operationalize inherently complex business concepts such as operations strategy, quality
management, and supply chain management. Multi- item measurement scales can reduce
measurement error because they average several related items to provide a more robust construct
of complex variables (Hensley 1999; Stratman and Roth 2002). Note that constructs represent
the conceptual definition of an unobserved or latent variable, while items capture alternative
indicators of the construct, meaning that any one item could substitute for another. Items are
said to be either “reflective” in which the latent variable (construct) causes the observed
variables (items), or “formative” whereby the observed variables are assumed to cause a latent
variable (Bollen 1989).
A full literature review and search for existing scales is necessary to identify the salient items
that capture the constructs of interest. At times, the researcher must not only pull items from
existing scales, but also create additional items that appear to fit the construct definitions. Once
relevant constructs and their associated items are identified, they should be subjected to informal
review by knowledgeable practitioners. Taken together, these actions provide constructs and
their associated items with some level of content validity (Malhotra and Grover 1998).

12
2.2.1.2. Purify and Pre-Test Items and Measurement Scales
After the literature search and informal discussions with practitioners, the resulting
preliminary measures must be purified prior to any subsequent analysis (Malhotra and Grover
1998). In this case, the researcher must assess how well each potential item maps ont o its
intended construct, as well as to uncover any under-represented topics or missing measures
(Moore and Benbasat 1991; Ryan and Schmit 1996). Measures should also be checked for
redundancy, lack of relevance, and ambiguous wording that might introduce biases. Using a
scale development methodology called Q-sort, the researcher can purify the constructs and items
via interjudge agreement across experts who are knowledgeable about the research topic and are
generally representative of the sample of respondents who will complete the final survey
instrument (Churchill 1979; Hensley 1999; Menor and Roth 2003; Moore and Benbasat 1991).
This Q-sorting technique enables the researcher to determine which items should be used in the
various scales, and subsequently which items should be included in the preliminary survey
instrument. In summary, when developing multi- item scales, Malhotra and Grover (1998, 412)
state,
“…it is very important that the domain of the construct be well specified and that the items be generated based on this domain…It can be done through the theoretical basis for the items in the literature or a panel of experts who are well versed with the domain. Q-sort techniques can be used where experts are asked to separate items that are relevant to the domain from those that are not.”
2.2.2. Stage 2: Questionnaire Development
2.2.2.1. Define Target Population and Sample Frame
While OM survey research has increased substantially since the early 1980s and new data
collection modes (e.g., web-based surveys) have been introduced, sampling procedures have
remained virtually unchanged (Rungtusanatham et al. 2003; Sudman and Blair 1999). In survey

13
research, one typically identifies the sample frame, or the list from which a sample is to be
drawn, in order to represent the research population of interest (Vogt 1993). One of the most
critical issues a survey researcher must contend with is the potential for sample frame error,
which reflects the mismatch between the research population and the sample frame (Malhotra
and Grover 1998). For example, use of web-based surveys provides a source of error when
potential respondents are missing from the sample frame because they don’t have web access
(Couper 2000; Dillman et al. 1999; Klaussen and Jacobs 2001). Unless all members of the
research population are given an equal chance of participating in the study, then the resulting
sample cannot be said to represent them (Malhotra and Grover 1998).
2.2.2.2. Design Survey Instrument
Once the researcher decides on the targeted respondents, questionnaire design becomes the
primary focus of the survey research process. According to Fowler (1988, 99, 75), “Designing a
good questionnaire involves selecting the questions needed to meet the research objectives,
testing them to make sure they can be asked and answered as planned, then putting them into a
form to maximize the ease with which respondents and interviewers can do their job (p.
99)…Good questions are reliable, providing consistent measures in comparable situations, and
valid; answers correspond to what they are intended to measure” (p. 75). It is critically important
to have experts—individuals knowledgeable about the subject matter and representative of the
target population—review the questions prior to implementing the full-scale field study (Fink
1995). This “pilot test” helps the researcher learn how easy or difficult the questionnaire is to
complete and to identify questions that need revision in order to ensure measurement reliability
and validity (Flynn et al. 1990). A pilot test also typically provides the researcher with an
14
estimate of the survey completion time, the expected response rate, and the distribution of
responses (Fowler 1988).
2.2.3. Stage 3: Survey Administration
The ways in which respondents are recruited to participate in the field study clearly has an
effect on the response rate, or the number of completed questionnaires as a percentage of the
number of eligible sample frame members (Frohlich 2002; Fowler 1988; Hayslett and
Wildemuth 2004). A low response rate immediately opens a study up to legitimate concerns
about sample frame error and ultimately nonresponse bias (Frohlich 2002). Hence, the
researcher must carefully craft a variety of techniques to combat nonresponse, including multiple
contacts with members of the sample, use of incentives, etc. (Hayslett and Wildemuth 2004;
Malhotra and Grover 1998; Umbach 2004). For parsimony, we describe two target respondent
solicitation strategies involving multiple respondent contacts—one for mail surveys, which is the
most common data collection mode in empirical OM research (see Flynn et al. 1990), and one
for web-based surveys, the primary focus of this paper; see Figure 2.
15
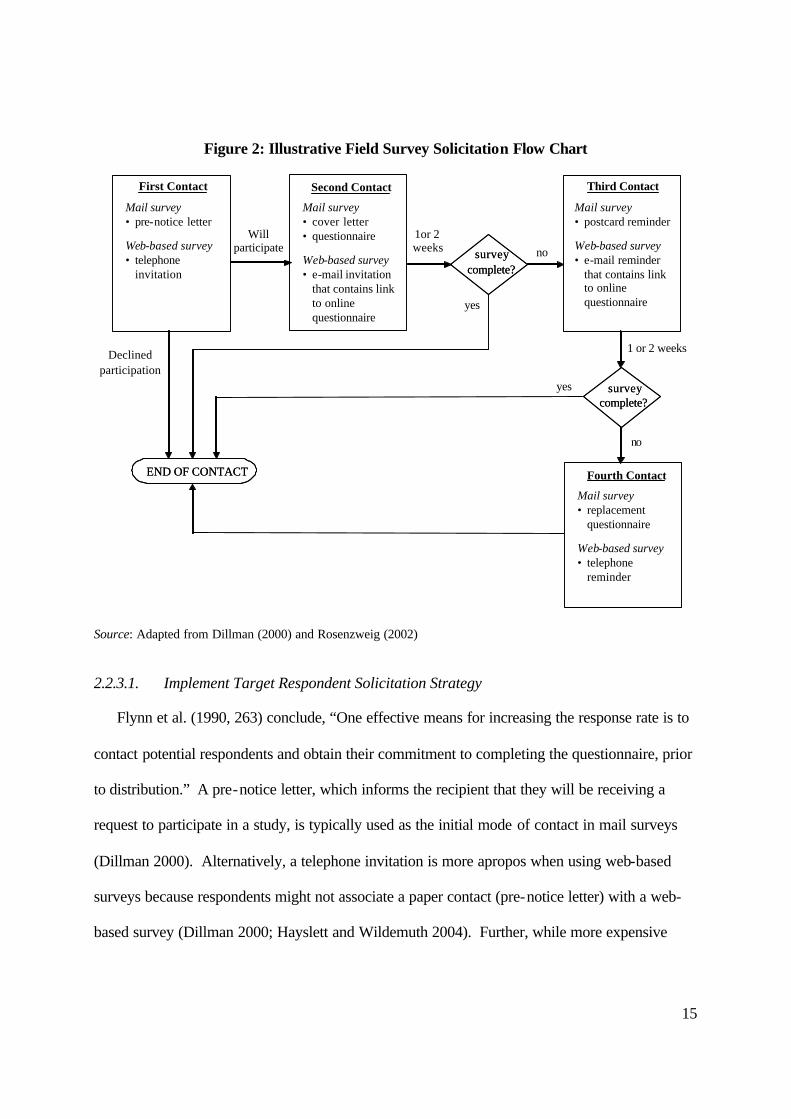
Figure 2: Illustrative Field Survey Solicitation Flow Chart
Source: Adapted from Dillman (2000) and Rosenzweig (2002)
2.2.3.1. Implement Target Respondent Solicitation Strategy
Flynn et al. (1990, 263) conclude, “One effective means for increasing the response rate is to
contact potential respondents and obtain their commitment to completing the questionnaire, prior
to distribution.” A pre-notice letter, which informs the recipient that they will be receiving a
request to participate in a study, is typically used as the initial mode of contact in mail surveys
(Dillman 2000). Alternatively, a telephone invitation is more apropos when using web-based
surveys because respondents might not associate a paper contact (pre-notice letter) with a web-
based survey (Dillman 2000; Hayslett and Wildemuth 2004). Further, while more expensive
surveycomplete?
surveycomplete?
surveycomplete?
surveycomplete?
END OF CONTACTEND OF CONTACT
Willparticipate
Declinedparticipation
1or 2weeks
yes
no
1 or 2 weeks
yes
no
First Contact
Mail survey• pre-notice letter
Web-based survey• telephone
invitation
Second Contact
Mail survey• cover letter• questionnaire
Web-based survey• e-mail invitation
that contains link to online questionnaire
Third Contact
Mail survey• postcard reminder
Web-based survey• e-mail reminder
that contains link to online questionnaire
Fourth Contact
Mail survey• replacement
questionnaire
Web-based survey• telephone
reminder
16
than a pre-notice E-mail, it is critical that researchers randomly telephone contacts from the
sample frame because targeted respondents might consider unsolicited e-mails, a.k.a. spam,
intrusive and generally unacceptable (Schillewaert et al. 1998; Sheenan and Hoy 1999; Umbach
2004).
The second contact involves the distribution of the actual survey instrument, which includes
an introductory letter that 1) explains the study in more detail; 2) outlines the significance of the
research; 3) describes the anticipated benefits to participants; and 4) indicates the approximate
time commitment estimated during the pilot study. When utilizing web-based surveys, the email
invitation should also contain a link to the survey to enable easy access (Griffis et al. 2003;
Nesbary 2000; Truell 2003; Umbach 2004). Importantly, Umbach (2004, 32) notes, “In mail
surveys, individuals can examine the entire survey and decide whether they want to complete it.
In Web surveys, this information is not available until the respondent accesses the Web site
hosting the survey. Given this difference, the initial letter or email [invitation] plays an
important role in eliciting response.” One widely held myth regarding the use of web-based
surveys is that once an initial E-mail invitation is sent to potential respondents, all the researcher
has to do is sit back and wait for the data to roll in. Like many others (see e.g., Boyer et al. 2001;
Deutskens et al. 2004; Dillman 2000; Klaussen and Jacobs 2001; Schaefer and Dillman 1998;
Shannon and Bradshaw 2002; Simsek and Veiga 2001; Sudman and Blair 1999), our experience
suggests that multiple respondent contacts are essential for maximizing response to web-based
surveys.
If the researcher does not receive a completed survey from the target respondent within two
weeks of cover letter and questionnaire receipt (mail survey), or within one week of E-mail
invitation receipt (web-based survey), a third respondent contact is necessary. Note that the time
17
between contacts can be compressed from approximately two weeks to just one week when
deploying a web-based survey as compared to a mail survey because, as noted previously, the
researcher no longer has to take into account time for in-transit mail (Crawford et al. 2001;
Deutskens et al. 2004; Truell 2003).
When utilizing mail surveys, the third contact entails sending a postcard to target
respondents, which thanks the respondent for agreeing to participate in the study and reminds
him or her to complete the survey (Dillman 2000). An E-mail reminder is used as the third
contact for web-based surveys, which can easily incorporate a link to the online survey
instrument. By including a link to the web-based survey in the E-mail reminder, the online
researcher benefits from combining the mail survey postcard (third) and replacement survey
(fourth) contacts into a single contact (see Figure 2).
Finally, if the targeted respondent has still not completed the mail survey within an additional
two-week timeframe, the fourth contact involves mailing a replacement questionnaire. On the
other hand, it is unnecessary to send a replacement survey during this step of the web-based
survey target respondent solicitation process because as noted above, it was included in the third
contact. A telephone call, in which the respondent is reminded to complete the survey, thereby
serves as the fourth contact when employing a web-based survey. Note that while an additional
E-mail reminder can be sent at virtually no cost when utilizing web-based surveys, repeated
follow-ups may be considered as spam, “thereby irritating or annoying potential respondents
without noticeably increasing response rates” (Deutskens et al. 2004, 23).
18
2.2.3.2. Control Access
For good empirical science, the researcher must carefully control and verify who completes
the survey (Couper 2000; Dillman et al. 1999; Miller 2001; Klaussen and Jacobs 2001; Nesbary
2000; Stanton and Rogelberg 2001). Without appropriate access control, the resulting sample
may not be representative of the research population. Access control is relatively basic when
conducting structured interviews, as the interviewer can readily verify that they are speaking to
the target respondent either face-to-face or by means of the telephone (Dillman 1978). For mail
surveys, access control is obtained by means of the mailing address—only targeted members of
the sample frame are mailed a survey. With regard to web-based surveys, Klaussen and Jacobs
(2001, 716) conclude that the researcher must implement controls, “…to ensure that only those
managers targeted with the survey can respond, and that any duplicate submissions from those
targeted managers are eliminated.” In this case, access control can be achieved by providing
each respondent with a unique password to access the web-based survey and that only allows one
survey submission per respondent (Crawford et al. 2001; Truell 2003; Umbach 2004). Note that
in some cases, such as when the web-based survey is long and/or pertains to a very specific
audience, little motivation exists for a nonsampled individual to participate in the study, so
passive controls will suffice (Stanton and Rogelberg 2001).
2.2.3.3. Ensure Respondent Anonymity
Regardless of the research topic or mode of data collection (structured interview, mail
survey, web-based survey), “guaranteed” respondent anonymity is a survey research best
practice (Crawford et al. 2001; Dillman 2000; Fowler 1988; Schillewaert et al. 1998; Umbach
2004). For example, given respondent privacy concerns, under no circumstances should the E-
mail invitation (second respondent contact in web-based surveys; see Figure 2) be visibly
19
addressed to multiple recipients (Hayslett and Wildemuth 2004). In addition, respondents are
typically assured that only aggregate summaries will be reported, i.e., that no individual names,
companies, or identifiable data will appear in any reports resulting from the study. An additional
means to ensure confidentiality is to inform the respondent that their responses will be captured
in two separate databases: (1) a database that contains some form of a respondent identifier and
the respondent contact information; (2) a database that contains the respondent identifier and
survey responses. In doing so, the data cannot be as readily associated with the respondent
(Fowler 1988). Social exchange theory suggests that assurances of confidentiality not only
cultivates a sense of trust, but also may lower the respondent’s perceived “cost” of their
responses being made public (Porter 2004). Perceived lack of respondent anonymity contributes
to low response rates (Morrel-Samuels 2003; Truell 2003).
2.2.4. Stage 4: Data Analysis
2.2.4.1. Code Data
Data collected by means of structured interviews and mail surveys are typically entered
manually from the source document (e.g., notes from interview, completed survey) into a
database. Manual data entry (coding) errors can result from 1) misreading the data from the
source document or 2) mis-keying the data. According to Forza (2002), coding errors such as
these are typically found in two to four percent of the data. Flynn et al. (1990) suggest
researchers employ experienced data-entry personnel in order to ensure data input accuracy. As
an alternative, interviewers may input the data directly into a database as the respondent
progresses through the face-to-face or telephone interviews.
Use of web-based surveys reduces the frequency of these coding errors because the survey
site can write the data directly to a database upon each respondent’s survey submission. Goldby

20
et al. (2001) assert, “Automatic data dropping can alleviate the time-consuming and potentially
error-prone practice of manual data entry [typical of traditional survey research].” Hence,
automatic data entry found in web-based not only reduces errors, but also reduces data entry
costs (Nesbary 2000).
2.2.4.2. Analyze Nonrespondent Characteristics
Clearly, the target respondent solicitation strategies described above represent one way to
improve response rates and to ultimately combat nonresponse bias. After data collection,
however, it is necessary to identify whether the respondents who completed the survey differ
significantly from those who did not, regardless of data collection mode. Armstrong and
Overton (1977) among others suggest several ways to identify whether nonresponse bias is
present: 1) obtain descriptive statistics from a subsample of nonrespondents; and 2) compare
survey responses from early and late respondents (Armstrong and Overton 1977). In the first
approach, data is collected from a subsample of nonrespondents on characteristics such as
number of employees, sales volume, and market position; nonrespondent data can be obtained
from archival empirical data sources (e.g., Compustat Global database:
http://www.wrds.wharton.upenn.edu) or from follow-up with the actual nonrespondents. Results
from the survey are then compared with the nonrespondent descriptive statistics using ANOVA
tests to determine whether statistical differences exist across the two samples. The second
approach also utilizes ANOVA tests, but in this case, comparisons are made between the “early”
and “late” survey responses to detect whether statistically significant differences are present with
respect to the sample characteristics of interest [see Armstrong and Overton (1977) for details].
21
2.2.4.3. Conduct Preliminary Data Analysis
Prior to confirmatory analyses of the measurement scales and subsequent hypothesis testing,
it is essential that the researcher conduct a preliminary scrutiny of the data, including common
methods variance testing, examination of missing data, identification of outliers, and assessment
of normality (Hair et al. 1995; Podsakoff and Organ 1986). Common methods variance arises
when correlations between variables are a result of the same individual providing the responses
for measures rather than any substantive relationship between the variables (Boyer & Pagell
2000; Pedhazur & Schemlkin 1991; Podsakoff & Organ 1986). Procedural remedies for
reducing the potential for common methods include 1) reverse coding items (Boyer and Pagell
2000) and 2) separating survey questions pertaining to the predictor and criterion variables
(Podsakoff et al. 2003). If common methods bias is identified using a test such as Harman’s one-
factor test (see e.g., Podsakoff and Organ), the effects may be controlled by means of various
partial correlation procedures (see e.g., Lindell and Whitney 2001; Podsakoff et al. 2003).
Missing data is typically a result of two different factors: 1) a systematic event external to the
respondent, such as data entry errors or data collection problems; and/or 2) some action on the
part of the respond ent, such as a refusal to answer or having no opinion (Hair et al. 1995).
Vickery et al. (1993) note that it is often difficult to get financial information from companies
due to the sensitive nature of the data.
Outliers are extreme responses, and can be identified using the procedure outlined in Hair et
al. (1995). One must take special care to thoroughly review potential outliers prior to deleting
these observations from the analysis, as this action puts the generalizability of the study at risk.

22
Finally, the researcher must establish both univariate and multivariate normality prior to
conducting confirmatory factor analyses of the scales. Note that univariate normality is a
necessary but insufficient condition for establishing multivariate normality.
When characteristics such as these are present in the data—substantial common methods
variance, excessive missing data and/or outliers, and a lack of normality—the subsequent study
analysis, results, and interpretation might be biased (Hair et al. 1995; Podsakoff and Organ
1986).
2.2.4.4. Conduct Confirmatory Analyses of Scales and Test Hypotheses
According to Churchill (1979, 65), “A measure is valid when the differences in observed
scores reflect true differences on the characteristic one is attempting to measure and nothing
else…A measure is reliable to the extent that independent but comparable measures of the same
trait or construct of a given object agree.” Confirmatory factor analyses (Bollen 1989) enables
one to establish the reliability (Werts et al. 1974) and the convergent (O’Leary-Kelly and
Vokurka 1998), discriminant (Ahire et al. 1996), and criterion-related (Malhotra and Grover
1998) validity of the measurement scales created during the first stage of the survey research
process; see Menor and Roth (2003) for an overview of the various tests. Use of a calibration
and holdout sample to validate results in conducting these analyses is a survey research best
practice (see e.g., Froehle and Roth 2004).
Many methods are available to the empirical researcher for testing hypotheses. Example
methodologies include multiple and logistic regression analyses, discriminant analysis, cluster
analysis, structural equation modeling, path analysis, canonical correlation analysis,
confirmatory factor analysis, etc. The reader is referred to Hair et al. (1995), Johnson (1998),

23
and Pedhazur and Schmelkin (1991) for an overview of various empirical research
methodologies.
2.2.5. Stage 5: Report Generation
Providing respondents with some form of report that describes the study results (e.g.,
Executive Summary) is clearly a survey research best practice, regardless of the mode of data
collection (Frohlich 2002). In accordance with social exchange theory, participants receive
something tangible in return for their efforts. A hard copy of the report is often mailed to
respondents at the end of a study that utilizes either structured interviews or a mail survey to
collect data. An alternative strategy is to E-mail a soft copy of the report at the conclusion of the
study, which can be implemented with much greater ease and at less expense. Whether the
researcher is collecting data by means of structured interviews, mail surveys, or even web-based
surveys, these “lagged” report generation strategies are necessary when the contents of the report
are based upon responses from the total study sample rather than a partial or pilot sample.
Unlike structured interviews or mail surveys, web-based surveys easily allow for near real-
time or even real-time report generation and display via the web. Given that a partial or pilot
sample of responses is sufficient in generating the report, a report can be provided to each
respondent upon survey completion. If this is the case, then the respondent should be able to
easily save and/or print a copy for future reference. In addition, the researcher should send the
respondent a follow-up E-mail containing a URL where the respondent can access their
individual report at a later date if desired. Going beyond this, a web-based survey can be
programmed such that it provides benchmark data on select questions during the survey
completion process. We caution readers against using this approach, however, as it might trigger
24
the respondent to answer later questions differently than if they had received no feedback, which
subsequently biases the results.
3. Web-Based Survey Best Practices
Nesbary (2000, 28) asserts, “With the advent of electronic survey research techniques…it is
important to ensure that correct and appropriate research methods are employed. New
technologies can cause excitement; however, one must not lose sight of the fact that new does
not always mean better.” Since the mail survey is currently the most common data collection
method in OM survey research (Flynn et al. 1990; Klassen and Jacobs 2001; Rungtusanatham et
al. 2003), we next identify the key ways web-based surveys differ from mail surveys following
the process outlined in Figure 2. Note that we focus our comparative analysis on the
Questionnaire Development and Survey Administration stages in the survey research process, as
well as on data entry, because these are the areas in which main differences occur between the
two self-administered questionnaire techniques.
3.1. Questionnaire Development
3.1.1. Target Population and Sample Frame
Klaussen and Jacobs (2001, 716) assert, “Despite recent improvements in the availability of
the web and e-mail…a number of firms and plants still appear to have not made it widely
available to all levels of management.” However, certain populations, such as executives in
many companies and corporations and members of some professional organizations, generally
have Internet addresses and access (Dillman 2000). For populations such as these, the use of
web-based surveys in OM research might only create minor coverage problems.

25
It is important to note that one often cited benefit for using web-based surveys is that sample
frame error can be minimized or even eliminated by simply obtaining a large sample. A
commonly cited illustration is the WWW User Surveys conducted by Georgia Tech’s Graphic,
Visualization, and Usability Center (http://www.gvu.gatech.edu):
“…Since we use nonrandom sampling and do not explicitly chose a sample, having a large sample makes it less likely that we are systematically excluding large segments of the population. Oversampling is a fairly inexpensive way to add more credibility to a nonrandom Web-based survey” (in Couper 2000, 12).
Unfortunately, a sample obtained with no real regard for whom completes the web-based
survey—even if a large sample is obtained—is synonymous with a convenience sample (Couper
2000; Dillman 2000; Simsek and Veiga 2001; Stanton and Rogelberg 2001). For example,
surveys posted to magazine web sites or listservs often invite all respondents who see or hear of
the survey to submit their responses (Hayslett and Wildemuth 2004). In this case, respondents
who have strong views of the research topic are most likely to respond, which has the potential to
bias the sample (Fowler 1988; Sudman and Blair 1999). Moreover, sampling in this fashion may
exclude significant proportions of the population (Fowler 1988). Nonetheless, non-probability
sampling methods might be a viable option if the OM researcher desires to make preliminary,
exploratory inferences or interpretations for future research (Schillewaert et al. 1998).
3.1.2. Web-Based Survey Instrument
3.1.2.1. Use of Multimedia
Web-based surveys have visual design capabilities beyond those available for any other type
of self-administered questionnaire, such as traditional mail or E-mail surveys (Dillman 2000;
Griffis et al. 2003; Simsek and Veiga 2001; Umbach 2004). Pictures and multiple colors and
shapes can be incorporated into a web survey, allowing for a more professional appearance than

26
that of other methods. In fact, 3D renderings of products, etc.—coupled with 360-degree views
and the ability to zoom in and out—and even video clips can be readily integrated into web-
based surveys (Dahan and Hauser 2002; Deutskens et al. 2004; Tourangeau 2004).
In weighing these multimedia options, however, the researcher must take several
considerations into account. First, while multimedia design features may enhance the
appearance of the survey, extensive use may require a large amount of memory, which in turn
may cause delays and reduce respondent ease of use (Boyer et al. 2001; Couper et al. 2001;
Deutskens et al. 2004; Dillman 2000; Goldby et al. 2001; Miller 2001; Simsek and Veiga 2001).
Professional and technically-oriented respondents such as the ones often targeted in OM
research, however, are likely to have more powerful computers and bandwidth connections that
make taking the survey easier (Miller 2001). Second, the size and type of computer monitor as
well as the resolution and color pallet may affect the appearance of the survey (Dillman 2000;
Miller 2001; Sheenan and Hoy 1999; Truell 2003; Umbach 2004). As a result, the researcher
should test the survey across multiple technical platforms—and in particular at the lowest
common denominator (e.g., laptop and dial-up Internet access)—prior to large-scale
implementation (Dillman et al. 1999).
3.1.2.2. Welcome Screen
Like the cover page of traditional mail surveys, the format of the web-based survey
destination site, or welcome screen, is critical, as it needs to be both instructional and
motivational (Dillman 2000; Umbach 2004). In particular, the welcome screen should concisely
1) summarize the research objectives; 2) show the benefits of participating in the study; and 3)
instruct participants on the action needed for proceeding to the next page. Unlike mail surveys,
however, additional information can be readily incorporated into the welcome screen, without
27
overwhelming the respondent. For example, if a respondent wants to learn more about the
research project, they can simply click on a link(s) that takes him or her to the relevant
documents.
3.1.2.3. Survey-in-Process
There are many important differences in the way the respondent interacts with a web-based
survey as compared to a mail survey. Differences include the 1) page layout; 2) location of
definitions; 3) automation of skip patterns; 4) use of “mandatory” questions; and 5) how answers
are “saved”; and 6) how respondents check or change answers.
First, in terms of the web-based survey page layout, researchers typically have a choice
between a screen-by-screen format, a scroll bar format, or some combination of the two
reflecting a hybrid solution. A screen-by-screen format means that each time the respondent
answers a question they are directed to the next question on a new screen until the survey is
complete. Alternatively, a scroll bar format implies that the survey is designed as a single unit,
in which respondents can go from first to last question in a single screen using the scroll bar.
Both formats have distinct benefits. The screen-by-screen format is generally considered to be a
superior design (Couper et al. 2001; Miller 2001), while the scroll bar format allows respondents
to easily view the survey in its entirety—this is beneficial because it enables respondents to get a
sense of survey length, to readily recheck responses, and to have a feel for where they are in the
survey (Dillman 2000; Umbach 2004).
Second, web-based survey respondents can be provided with definitions essentially at the
time of need, which eases respondent ease of use (Dillman et al. 1999). Because some of the
research terminology might not be as well understood as expected (Collins and Cordon 1997),
pop-up definitions can be offered at individual questions when first used in the survey, which can
28
be activated by simply clicking on the term itself. In contrast, mail surveys typically provide a
glossary of terms at the beginning of the survey.
Third, skip patterns can be programmed into a web-based survey so that when respondents
select a response that requires skipping several questions, they are automatically moved to the
next appropriate question. In doing so, the researcher can customize the path a respondent takes
through the survey (Nesbary 2000; Sheenan and Hoy 1999; Tourangeau 2004; Umbach 2004).
Griffis et al. (2003, 250) conclude, “Electronic surveys can adapt based upon responses to
preceding questions to, in essence, screen the respondent. This capability approximates benefits
typically associated with guided interviews.” Unlike mail surveys, skip patterns can be
constructed in a web-based survey so as to be “invisible” to the respondent (Dillman 2000). As a
result, unnecessary confusion is eliminated.
Fourth, while Dillman (2000) states that respondents should never be forced to provide a
substantive answer prior to moving to the next question, many other researchers advocate the use
of mandatory questions in web surveys (e.g., Tourangeau 2004). One should keep the number of
mandatory questions to a minimum, however, because at times, respondents are unable to select
a response or might even object to a question (Dillman 2000; Gaddis 1998). An alternative—and
less confrontational—way to increase item response rate is to provide the respondent with a
friendly reminder to respond to unanswered questions at the end of the survey, with links to the
appropriate questions (Gaddis 1998).
Fifth, a respondent is, at times, unable to complete a survey in one sitting. This situation
typically arises when 1) the survey is long; 2) some questions—like company background
questions—require respondents to obtain appropriate responses from other sources, which might
take time to gather; and/or 3) more senior managers, who generally have a multitude of meetings

29
and other interruptions such as phone calls, complete the survey. The completion of a paper
survey across multiple sessions presents no real problem in terms of saving answers because
pencil- and pen-based responses are readily “saved” in real-time. On the other hand, enabling a
respondent to “pick up where they left off” when completing a web-based survey across multiple
sessions calls for careful survey design (Crawford et al. 2001; Gaddis 1998; Klaussen and Jacobs
2001; Morrel-Samuels 2003). In many cases, respondents are provided with a unique password
for accessing the survey (see section 2.2.3.2.); hence, some survey designs enable respondents to
simply login again using their password to continue with the survey at their convenience, without
losing past answers.
Sixth, the web-based survey must allow respondents to check or change previous answers as
long as they have not submitted the final survey page (Morrel-Samuels 2003). Whether
changing a response selected during the current session or a previous session, the respondent
should be able to navigate to the previously answered question and view or alter his or her
response. Gaddis (1998) notes, “Just as [in] a mail-in survey [the respondent] would have the
option of erasing a response, a well-designed online survey should allow respondents the option
to erase or clear answers.”
3.1.2.4. Conclusion Screen
Similar to a well-designed mail survey, the survey should include a conclusion page that
reiterates how the information will be used and thanks respondents for their time (Gaddis 1998).
The conclusion page should also provide respondents with information regarding how they
will/can obtain the results of the study. Finally, the survey conclusion page should provide
respondents with the researcher’s contact information in case they have any questions or
comments.
30
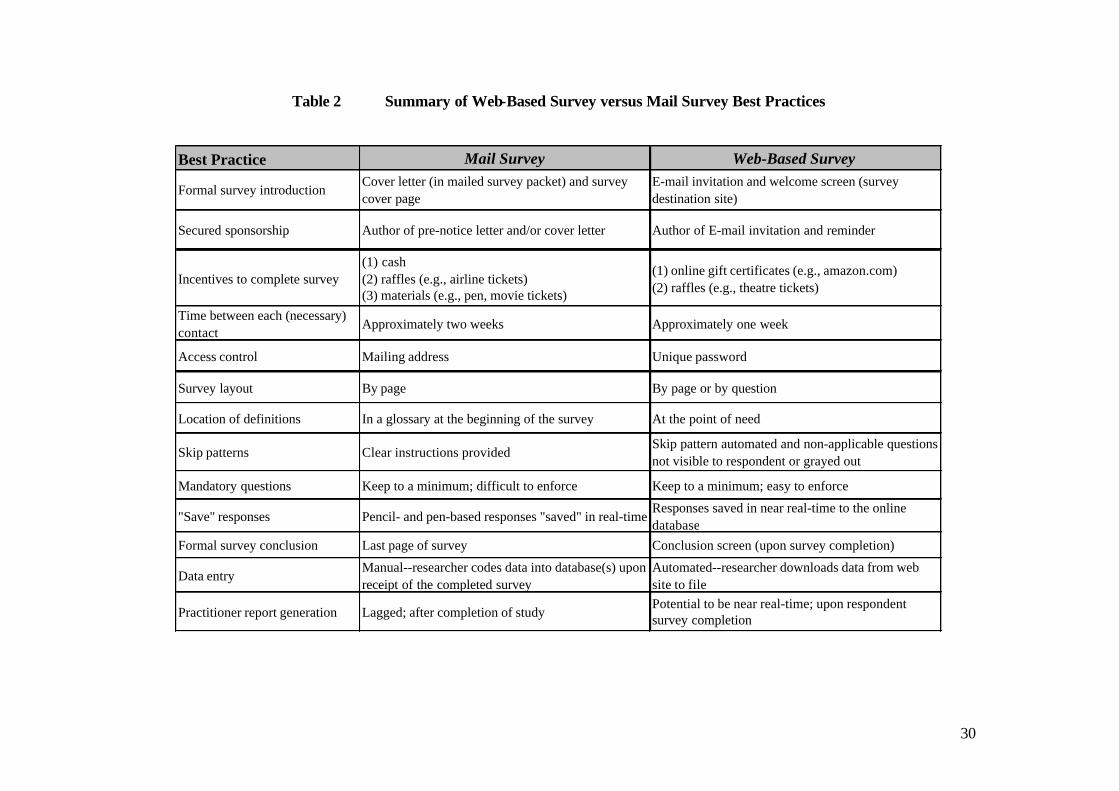
Table 2 Summary of Web-Based Survey versus Mail Survey Best Practices
Best Practice Mail Survey Web-Based Survey
Formal survey introductionCover letter (in mailed survey packet) and survey cover page
E-mail invitation and welcome screen (survey destination site)
Secured sponsorship Author of pre-notice letter and/or cover letter Author of E-mail invitation and reminder
Incentives to complete survey(1) cash(2) raffles (e.g., airline tickets)(3) materials (e.g., pen, movie tickets)
(1) online gift certificates (e.g., amazon.com)(2) raffles (e.g., theatre tickets)
Time between each (necessary) contact
Approximately two weeks Approximately one week
Access control Mailing address Unique password
Survey layout By page By page or by question
Location of definitions In a glossary at the beginning of the survey At the point of need
Skip patterns Clear instructions providedSkip pattern automated and non-applicable questions not visible to respondent or grayed out
Mandatory questions Keep to a minimum; difficult to enforce Keep to a minimum; easy to enforce
"Save" responses Pencil- and pen-based responses "saved" in real-timeResponses saved in near real-time to the online database
Formal survey conclusion Last page of survey Conclusion screen (upon survey completion)
Data entryManual--researcher codes data into database(s) upon receipt of the completed survey
Automated--researcher downloads data from web site to file
Practitioner report generation Lagged; after completion of studyPotential to be near real-time; upon respondent survey completion

31
3.1.3. Pilot Test Instrument
Hayslett and Wildemuth (2004, 90) caution researchers to “find expert consultation on the
technical aspects of the survey and conduct a thorough as possible pre-test on an electronic
survey as on a paper instrument…Due to inadequate testing of the electronic instrument for the
current study, a large number of responses to the Web survey were lost…Researchers should be
sure that they have anticipated as many technical issues as possible.” Hence, in addition to
reviewing questions, for example (see section 2.2.2.2.), the automated data entry procedure of
the web-based survey must be tested extensively both before, during, and after pilot testing to
verify that the data is being captured accurately, completely, and consistently (Fowler 1988).
For instance, researchers must take care to ensure that all default answers are set to “no
response” to ensure that unanswered questions are coded properly, i.e., as missing data instead of
as ‘0’ (Gaddis 1998).
3.2 Web-Based Survey Administration
3.2.1. Target Respondent Solicitation Strategy
3.2.1.1. Incentives
Porter and Whitcomb (2003, 579) conclude that
“…it is not entirely clear if the techniques used to increase response rates in paper and telephone surveys will directly translate to web surveys…understanding which techniques increase response rates in web surveys is increasingly important. Researchers are faced with decreasing response rates in surveys, as well as increased competition with marketers and spammers on the Internet, for the cooperation of respondents…Without such knowledge, web surveys may become less useful as a tool for survey research.”
For example, one of the most effective means to increase the response rate in the offline world is
to include a $1, $2 or even $5 or $10 token benefit with the mailing of the initial survey
(Cobanoglu and Cobanoglu 2003; Deutskens et al. 2004; Porter and Whitcomb 2004). In this
32
case, targeted respondents are more inclined to participate in the study based on the “norm of
reciprocity” (Porter 2004). This norm suggests that because the researcher offers a benefit or
favor, the targeted respondent should provide a reciprocal benefit (completing the survey) in
return. Until services that allow the user to send small (and large) amounts of money via E-mail
(e.g., PayPal; http://www.paypal.com) become ubiquitous, this type of incentive cannot be
readily transferred to a virtual questionnaire.
Use of online gift certificates (e.g., amazon.com) as an incentive to increase web-based
survey response rates has met with some success (Rosenzweig 2002; Froehl and Roth 2003).
Other incentives include lotteries (every respondent is entered into a drawing held at the end of
the study) for items such as theatre tickets, DVD players or online grocery gift certificates
(Cobanoglu and Cobanoglu 2003; Delaney-Klinger et al. 2003; Deutskens et al. 2004; Simsek
and Veiga 2001). The reader is cautioned, however, that post-payme nt, or payment conditional
on completing the survey, makes the incentive appear as compensation rather than as a token
benefit. Porter (2004, 13) concludes,
“…the incentive does not appear as a gift, so the survey recipient does not feel as if a favor or benefit has been granted by the survey sender; thus the norm of reciprocity is not invoked. Because the incentive is now viewed as pure compensation and because even postpaid incentives are invariably quite small in value, the amount of incentive is not sufficient to compensate for the time and effort involved (for most individuals).”
The jury is still out regarding the effect of making donations (e.g., American Cancer Society,
Amnesty International) in the name of the respondent on web-based survey response rates, but
this incentive has had limited success in the offline world (Deutskens et al. 2004; Dillman 2000).
Unlike monetary incentives, a “sense of scarcity” as a means for improving survey response
rates translates well from mail to web-based surveys. For example, asking the respondent to
complete the survey within the next five business days promotes a sense of scarcity. In this case,
33
people are apt to view a limited timeframe as a scarce opportunity rather than a common
opportunity, and may be more inclined to comply with the request (Porter 2004; Porter and
Whitcomb 2003).
3.2.1.2. Sponsorship
Mail and web-based survey response rates are also typically increased when sponsorship is
secured from an external party (e.g., company, industry consortium, etc.) related
to/representative of the sample frame. In this case, the response rate is higher given name
recognition and/or a strong sense of obligation to help the membership/community. Moreover,
Porter (2004) concludes that targeted respondents are more likely to complete the survey when
the request for participation comes from an authority that is viewed as legitimate. In mail
surveys, this request for participation occurs often during the first and second contacts in the
form of the pre-notice letter and cover letter, respectively (see Figure 2). Alternatively, when
deploying a web-based survey, the request for participation from the study sponsor typically
occurs in the E-mail invitation (second contact) and E-mail reminder (third contact) since it is
unlikely that a member of the sponsoring organization will be involved with contacting
respondents by telephone (see Figure 2). However, with study sponsorship, the researcher has
the potential to, at times, bypass the telephone invitation (first contact) altogether when using a
web-based survey since an “unsolicited” E-mail invitation can be sent to target respondents
without eliciting any significant antagonism toward the researcher, thereby saving both time and
money.
There may be a downside associated with study sponsorship, regardless of survey data
collection mode, however, that the researcher should be aware of. If heavily involved with
survey implementation, the sponsoring organization may place restrictions on what the
34
researcher can and can’t do. For example, the sponsor may limit the number and/or style of
questions that are to be included in the survey.
3.2.2. Access Control
Access control for web-based surveys is not as straightforward as it is for mail surveys, in
which only targeted members of the sample frame are mailed a survey. In some cases, the
researcher simply creates a unique password for each targeted respondent in order to control who
can access the web-based survey. This password is shared with the respondent either during the
telephone (first contact) or E-mail invitation (second contact); see Figure 2. In other cases, a
login screen is utilized to verify basic demographic information about the target respondent.
Upon submission of this demographic information, each targeted respondent receives a (system-
created or researcher-created) unique password for accessing the web-based survey (Crawford et
al. 2001; Truell 2003; Umbach 2004). Note that a well-designed mail survey typically places
demographic questions near the end of the survey given their personal nature. By comparison,
online respondents seem to be less sensitive to answering demographic questions up-front
because they are accustomed to filling out this information on the web (Bosnjak and Tuten
2001).
3.2.3. Respondent Anonymity
According to Dillman (2000, 369), threat of employer eavesdropping is a potential threat to
respondent anonymity in web-based surveys that does not typically arise in mail surveys:
“[Web-based surveys] shift confidentiality concerns from what the researcher promises to whether an employer or anyone else who controls the respondent’s Internet access is able to see the questionnaire responses. For many and perhaps most survey topics, confidentiality is not a big concern, but for others, for example, employee satisfaction surveys, it may become a critical factor that determines whether people will respond…”
35
Yet another potential threat to perceived respondent confidentiality occurs when the researcher
uses a web survey design site (e.g., SurveyMonkey: http://www.surveymonkey.com,
Zoomerang: http://www.zoomerang.com) in lieu of a custom-developed web-based survey .
While the researcher must clearly inform and assure the respondent that the data is being
downloaded to a secured database in both cases, we suspect that special care must be taken to put
the respondent at ease when utilizing web survey design site tools because the hosting site
receives more traffic and the survey title is often visible to anyone accessing the site.
3.3. Data Entry
When utilizing web-based surveys, care should be taken to ensure that each respondent’s
answer choices are exported to a secured database. In addition to the benefits highlighted in
section 2.2.4.1, automated data entry also enables the researcher to know who has (or has not)
completed the web-based survey in near real-time (Truell 2003). As a result, unnecessary
follow-up contacts to respondents with their completed survey “in the mail” can be eliminated
(Hayslett and Wildemuth 2004). Moreover, this information can be used to assess the
effectiveness of the (1) welcome screen in enticing target respondents to request a password to
participate in the study; and the (2) survey in maintaining respondents’ interest by means of
calculating the percentage of completed surveys (Griffis et al. 2003). Griffis et al. (2003, 250)
conclude, “Knowledge of where respondents lost interest in the survey provides important clues
regarding ways to improve survey design beyond the pre-testing stage.”

36
4. Web-Based Survey Design Tools
Multiple tools exist for designing web-based surveys, including (1) web publishing software;
(2) web survey design software; and (3) web survey design sites (Cobanoglu and Cobanoglu
2003; see Table 3). Web publishing software tools such as Microsoft FrontPage
(http://www.microsoft.com/office/frontpage/) or Macromedia Dreamweaver
(http://www.macromedia.com/software/dreamweaver/) enable the user to create, build, and
manage visually appealing, highly-customized websites. Academic institutions typically have
licensing agreements to use one or more of these web publishing software tools.
Examples of software designed specifically for the purpose of creating web-based surveys—
web survey design software—include ClassApps’ SelectSurveyASP
(http://www.classapps.com/selectSurvey/ASPOverview.asp), Perseus’ SurveySolutions
(http://www.perseus.com/survey/software/index.html), and Prezza Technologies’ Ultimate
Survey (http://www.prezzatech.com/UltimateSurvey-surveysoftware.asp). Similar to web
publishing software tools, licenses for web survey software design tools are typically obtained at
the enterprise level. When using web publishing and web survey software design tools, the
survey and associated database are hosted locally and are therefore subject to local network
conditions (e.g., subject to your business school/university network conditions).
Alternatively, the survey website is hosted remotely when web survey design tools like
SurveyMonkey (http://www.surveymonkey.com), MarketTools’ Zoomerang
(http://www.zoomerang.com), and WebSurveyor (http://www.websurveyor.com) are utilized.
While data is collected on the survey provider’s (e.g., MarketTools, Inc.) servers, the data can be
easily exported/downloaded to the user’s computer. Licenses for these easy-to-use web survey
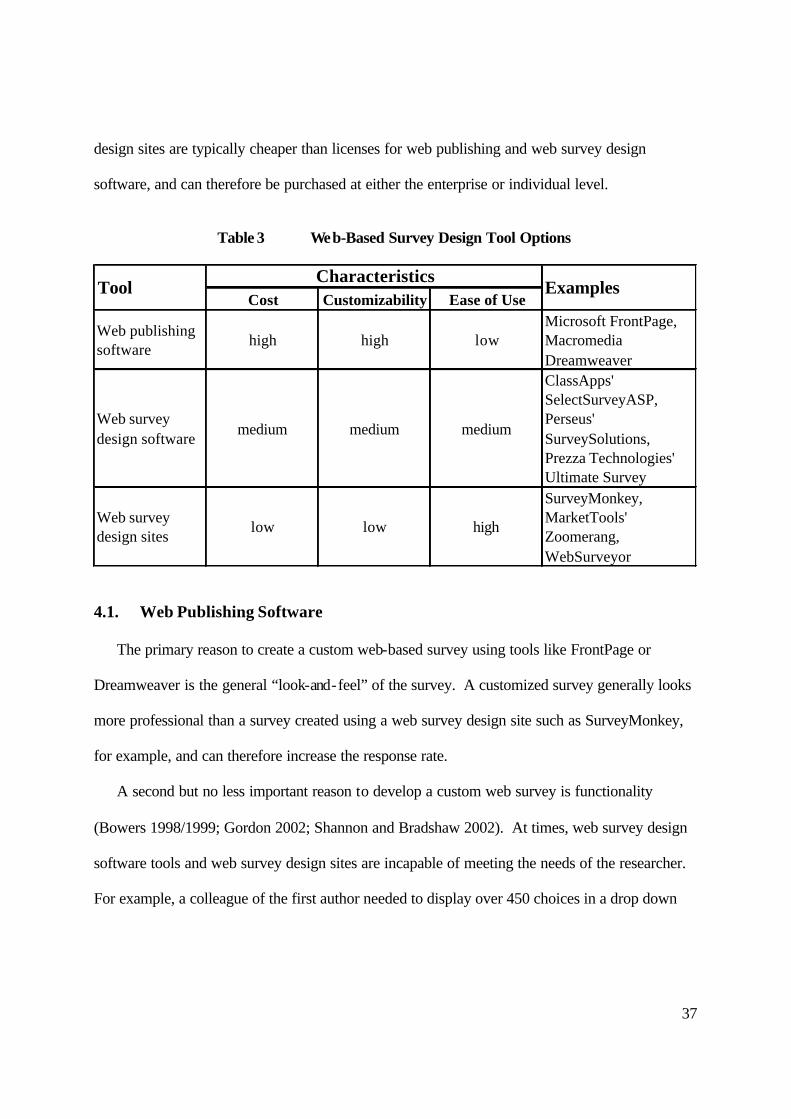
37
design sites are typically cheaper than licenses for web publishing and web survey design
software, and can therefore be purchased at either the enterprise or individual level.
Table 3 Web-Based Survey Design Tool Options
Cost Customizability Ease of Use
Web publishing software
high high lowMicrosoft FrontPage, Macromedia Dreamweaver
Web survey design software
medium medium medium
ClassApps' SelectSurveyASP, Perseus' SurveySolutions, Prezza Technologies' Ultimate Survey
Web survey design sites
low low high
SurveyMonkey, MarketTools' Zoomerang, WebSurveyor
CharacteristicsTool Examples
4.1. Web Publishing Software
The primary reason to create a custom web-based survey using tools like FrontPage or
Dreamweaver is the general “look-and-feel” of the survey. A customized survey generally looks
more professional than a survey created using a web survey design site such as SurveyMonkey,
for example, and can therefore increase the response rate.
A second but no less important reason to develop a custom web survey is functionality
(Bowers 1998/1999; Gordon 2002; Shannon and Bradshaw 2002). At times, web survey design
software tools and web survey design sites are incapable of meeting the needs of the researcher.
For example, a colleague of the first author needed to display over 450 choices in a drop down
38
menu. Because the desired number of response choices exceeded the number offered by these
tools at the time of his study, the researcher was forced to develop a custom web-based survey.
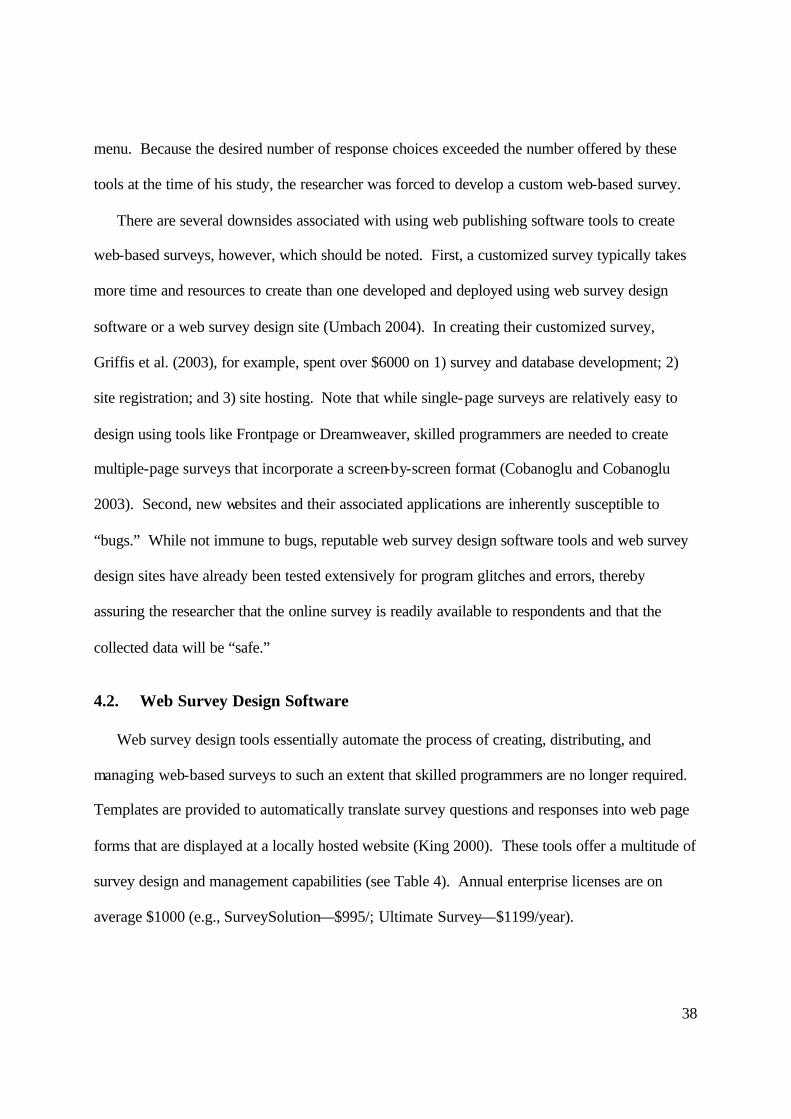
There are several downsides associated with using web publishing software tools to create
web-based surveys, however, which should be noted. First, a customized survey typically takes
more time and resources to create than one developed and deployed using web survey design
software or a web survey design site (Umbach 2004). In creating their customized survey,
Griffis et al. (2003), for example, spent over $6000 on 1) survey and database development; 2)
site registration; and 3) site hosting. Note that while single-page surveys are relatively easy to
design using tools like Frontpage or Dreamweaver, skilled programmers are needed to create
multiple-page surveys that incorporate a screen-by-screen format (Cobanoglu and Cobanoglu
2003). Second, new websites and their associated applications are inherently susceptible to
“bugs.” While not immune to bugs, reputable web survey design software tools and web survey
design sites have already been tested extensively for program glitches and errors, thereby
assuring the researcher that the online survey is readily available to respondents and that the
collected data will be “safe.”
4.2. Web Survey Design Software
Web survey design tools essentially automate the process of creating, distributing, and
managing web-based surveys to such an extent that skilled programmers are no longer required.
Templates are provided to automatically translate survey questions and responses into web page
forms that are displayed at a locally hosted website (King 2000). These tools offer a multitude of
survey design and management capabilities (see Table 4). Annual enterprise licenses are on
average $1000 (e.g., SurveySolution—$995/; Ultimate Survey—$1199/year).
39
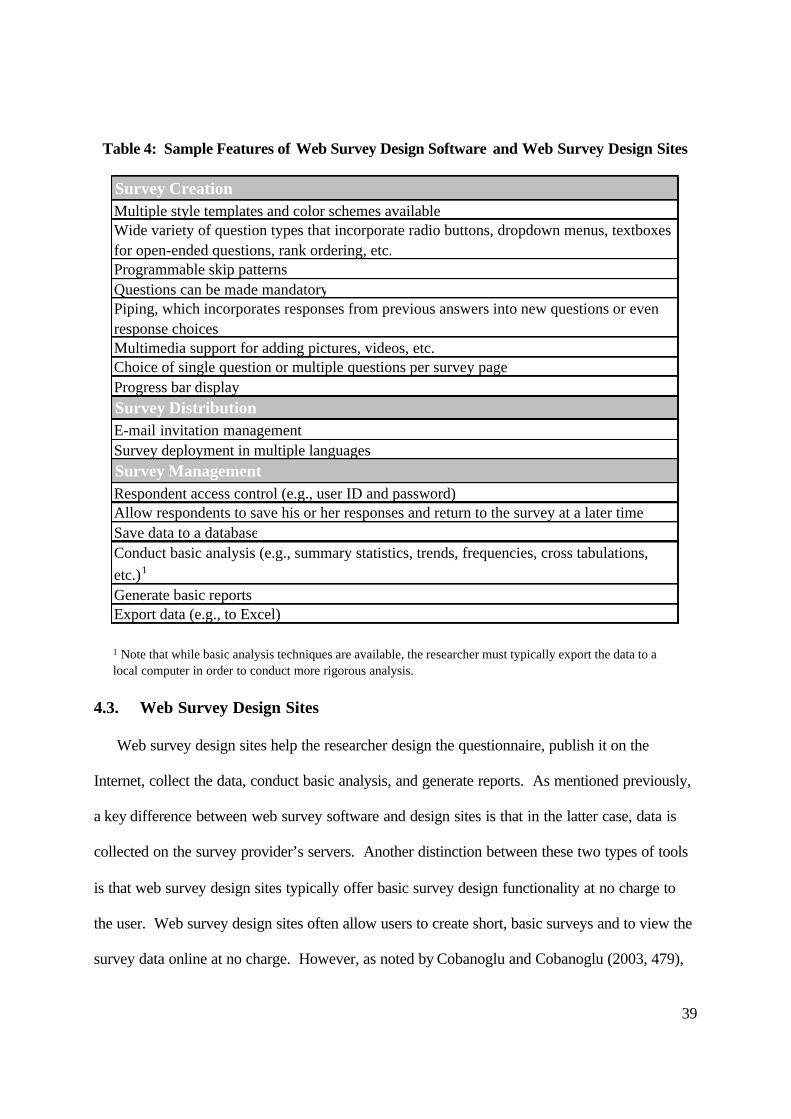
Table 4: Sample Features of Web Survey Design Software and Web Survey Design Sites
Survey CreationMultiple style templates and color schemes availableWide variety of question types that incorporate radio buttons, dropdown menus, textboxes for open-ended questions, rank ordering, etc.Programmable skip patternsQuestions can be made mandatoryPiping, which incorporates responses from previous answers into new questions or even response choices Multimedia support for adding pictures, videos, etc.Choice of single question or multiple questions per survey pageProgress bar displaySurvey DistributionE-mail invitation managementSurvey deployment in multiple languagesSurvey ManagementRespondent access control (e.g., user ID and password)Allow respondents to save his or her responses and return to the survey at a later timeSave data to a databaseConduct basic analysis (e.g., summary statistics, trends, frequencies, cross tabulations, etc.)1
Generate basic reportsExport data (e.g., to Excel)
1 Note that while basic analysis techniques are available, the researcher must typically export the data to a local computer in order to conduct more rigorous analysis.
4.3. Web Survey Design Sites
Web survey design sites help the researcher design the questionnaire, publish it on the
Internet, collect the data, conduct basic analysis, and generate reports. As mentioned previously,
a key difference between web survey software and design sites is that in the latter case, data is
collected on the survey provider’s servers. Another distinction between these two types of tools
is that web survey design sites typically offer basic survey design functionality at no charge to
the user. Web survey design sites often allow users to create short, basic surveys and to view the
survey data online at no charge. However, as noted by Cobanoglu and Cobanoglu (2003, 479),

40
“Even though these websites usually offer this service free of charge, they may place a banner on
the survey website, which may distract respondents are therefore create bias.” If a longer and
more complex survey is required—which is often the case—advanced survey features like those
shown in Table 4 can be accessed from the site, but for a fee (e.g., SurveyMonkey charges users
approximately $19.99 per month).
4.4. Illustrative Case Studies
Care should be taken to strike the right balance between powerful functionality (e.g., web
publishing software) and easy-to-use tools (e.g., web survey design sites); see Table 3. As a
tangible example, we illustrate two versions of a web-based survey—a customized survey, which
we refer to as the edarwinism survey (http://www.edarwinism.com), and a survey designed using
SurveyMonkey—in the context of an OM study titled “Navigating B2B Marketspaces” (see
Rosenzweig 2002 for study details).
4.4.1. Study Background
In the “Navigating B2B Marketspaces” project, we sought to test and validate a path linking
operational competencies, competitive capabilities, customer satisfaction, and profitability in the
context of B2B marketspaces. The research population consisted of all sellers currently using a
B2B marketspace to interact with customer organizations by supplying direct goods (i.e., not
indirect goods/maintenance, repair and operating supplies) and services (e.g., collaborative
product design). The targeted survey respondents were senior supply chain or e-business
managers working directly with customers of the primary B2B marketspace, particularly in
supplying products and services. We targeted senior managers because they were expected to
have a more complete understanding than would lower-level managers of how the primary B2B

41
marketspace affects the business (Fink 1995; Malhotra and Grover 1998; Miller and Roth 1994;
Stratman and Roth 2002).
In order to address our research questions, we crafted forty questions consisting of over one
hundred and eighty-five separate data elements. We employed designers at adcSTUDIO
(http://www.adcstudio.com)—who provide expertise in web development for a wide range of
project types and business initiatives—to transform our questions into a highly customized
survey, i.e., the edarwinism survey. Data for the study were collected over a period of six weeks,
from the beginning of June to mid-July 2002. Note that our data was collected over a period of
six weeks while data collected using mail surveys takes approximately eight to nine weeks to
complete (Fowler 1988). A total of 50 surveys were returned for a response rate of 29.8 percent,
which is in line with past OM empirical research (see e.g., Frohlich 2002).
Umbach (2004, 28) asserts, “The design [of web-based surveys] should reflect the
purpose of the survey and should be tailored to the population under study.” Based upon our
sample frame and targeted respondents, we deemed it necessary to develop a very professional-
looking survey and research report. We reasoned that technically savvy, senior managers would
be more inclined to respond to a web-based survey that was carefully customized to our research
project. Along these lines, if a survey is longer than four or five pages, as our survey is, then the
researcher must carefully craft strategies in order to trigger a higher response rate (Frohlich
2002). While longer surveys are more comprehensive, shorter surveys typically have higher
response rates. We suspect that our meticulously designed custom survey triggered executives to
respond, despite the relatively large effort required to complete the survey.
42
Because our research population and subsequent sample frame targeted sellers utilizing Internet -
based technologies, use of a web survey did not contribute any additional sample frame error to
the study.
Since the questions included in the edarwinism survey are business-specific and not employee-
specific, use of a web survey did not contribute any real threat to perceived respondent
anonymity.
We offered edarwinism survey respondents an Executive Summary of our overall research
findings and an individual, customized report that captured his or her business’s unique strengths
and weaknesses for competing in B2B marketspaces. It was our belief that offering respondents
a benchmark composite of their B2B-related business, analogous to a Myers-Briggs profile,
would increase the response rate (Boyer et al. 2001; Gaddis 1998; Klaussen and Jacobs 2001).
As noted by Stanton and Rogelberg (2001, 205), one way to boost response rates is to provide
the respondent with “immediate general or personalized feedback concerning their research
participation...” Since these two reports contained statistics that were calculated using the
responses from the total sample, we E-mailed the reports to respondents at the conclusion of the
study. Hence, we did not offer any incentives at this stage of the field survey solicitation process.
(talk about Amazon gift cards)…
Following Dillman (2000), the welcome screen of the edarwinism survey contained bullet
points that explained the objectives of the study and respondent benefits (see Figure 2). To enter
the edarwinism survey, respondents were directed to click on “Take Survey.”
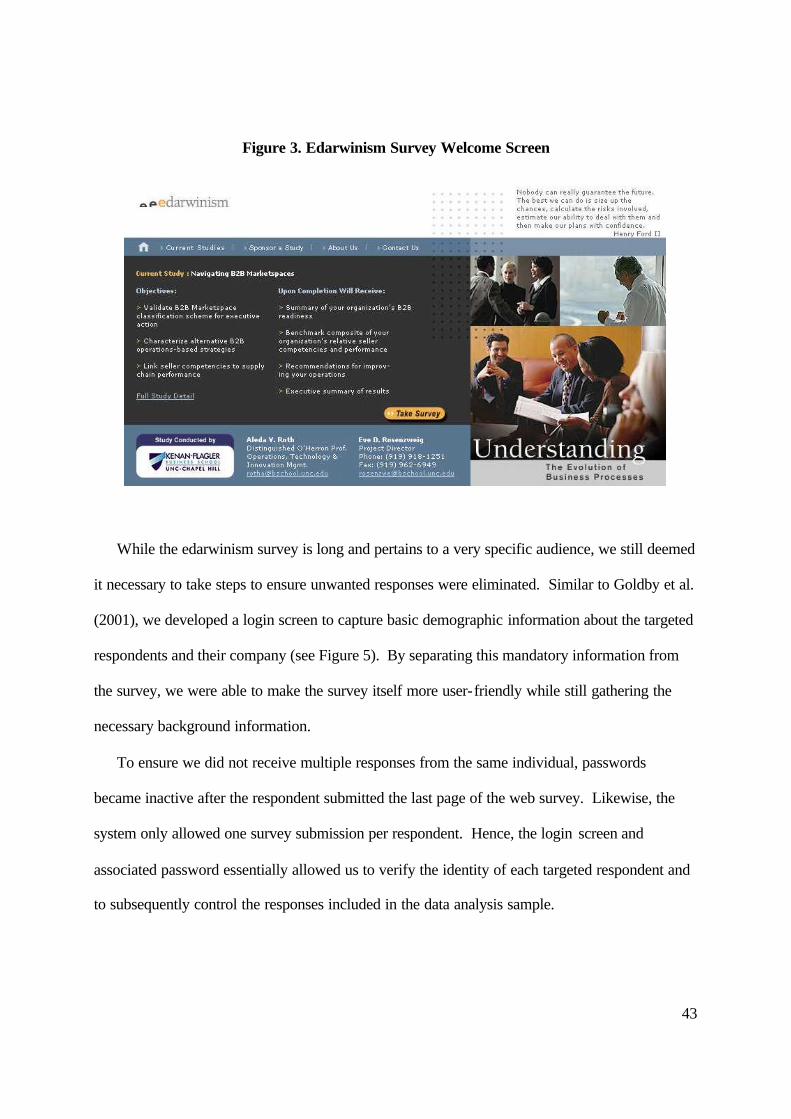
43
Figure 3. Edarwinism Survey Welcome Screen
While the edarwinism survey is long and pertains to a very specific audience, we still deemed
it necessary to take steps to ensure unwanted responses were eliminated. Similar to Goldby et al.
(2001), we developed a login screen to capture basic demographic information about the targeted
respondents and their company (see Figure 5). By separating this mandatory information from
the survey, we were able to make the survey itself more user-friendly while still gathering the
necessary background information.
To ensure we did not receive multiple responses from the same individual, passwords
became inactive after the respondent submitted the last page of the web survey. Likewise, the
system only allowed one survey submission per respondent. Hence, the login screen and
associated password essentially allowed us to verify the identity of each targeted respondent and
to subsequently control the responses included in the data analysis sample.

44
Figure 4 edarwinism Survey Login
The scroll bar format enables the respondent to view the survey in its entirety, similar to a
mail survey, but the screen-by-screen format is generally considered to be more aesthetically
pleasing. A hybrid solution that incorporates both formats and an accompanying progress bar
allows the researcher to obtain much of both benefits. In order to capture the benefits associated
with both methods, the edarwinism survey offered a hybrid solution by combining screen-by-
screen and scroll bar formats. Specifically, the edarwinism survey was divided into five broad
sections, covering eleven pages. Following Fowler (1988), questions pertaining to
performance—considered to be “sensitive”—were contained in the latter sections of the survey,

45
i.e., sections four and five. Multiple questions comprised each survey page; within each of the
eleven pages of the edarwinism survey, respondents were able to scroll between questions.
Respondents simply clicked on “Submit” at the bottom of each page in order for the next set of
questions to appear.
Figure 5 Web-Based Survey Layout
With this hybrid design, respondents were able to easily view the entire survey. We used a
progress bar at the top of each survey page to ensure that respondents were able to estimate
where they were in the completion process (see Figure 3) (Crawford et al. 2001; Truell 2003;
Umbach 2004). Dillman (2000, 373) concludes, “a sense of progress can be provided in an
46
effort to avoid people quitting when they are only a few questions from the end.” Note that the
progress bar also facilitated movement between the survey pages—clicking on a page number in
the progress bar directed the respondent to the actual survey page (Morrel-Samuels 2003).
For example, we required respondents to answer the first survey question, which asks
respondents to identify their organization’s primary B2B marketspace. Because respondents
were instructed to answer the remaining survey questions with respect to this response choice, all
subsequent responses would have been meaningless if the first question went unanswered.
For the remaining survey questions that went unanswered, we provided the respondent with a
friendly reminder at the end of the survey with links to the appropriate unanswered questions:
“The following questions were not fully answered. At this time, you may still revisit them and
answer them, or click the Proceed button to complete the survey.” We suspect that this design
choice helped increase the item completion rate in a relatively non-confrontational manner, i.e.,
respondents were reminded, but not forced, to respond to unanswered questions (Gaddis 1998).
5. Summary and Conclusions
Researchers can be more creative now—mixed modes (e.g., Enno used face-to-face interviews
and a web survey) and flexibility to choose modes, but need to watch out for response bias. The
enticement of the WWW as a survey research tool may be appealing to those who have limited
experience in conducting survey research. Couper (2000, 1), for example, concludes
“Researchers get access to undreamed numbers of respondents at dramatically lower costs than
traditional methods.” But for the very reasons that web-based survey usage makes data
collection somewhat easier than traditional paper surveys, the threat of respondent survey fatigue
is becoming more and more an issue.

47
Clearly, a lot of careful planning is required to conduct rigorous survey research, with or
without the WWW as the means by which the data is collected. Contrary to popular beliefs,
much of the up-front research design work when using web-based surveys does not go away.
For instance, appropriate sample frames and strict sampling control are still necessary for
generating valid and reliable inferences about the population from which the sample is surveyed
(Simsek and Veiga 2001). Moreover, the technology itself adds a layer of complexity to the
research process that many investigators have not previously encountered (Dillman et al. 1999;
Miller 2001; Stanton and Rogelberg 2001). As noted by Umbach (2004, 24), “Although it is
likely that most researchers will save money with Web surveys, they must also consider the
human labor costs involved in conducting a Web survey, many of which are difficult to
calculate. The costs of building the Web form, managing e-mail addresses, sending invitation
and reminder e-mails, and maintaining computer networks cannot be overlooked.” As a
discipline, we must be able to identify good survey research design if we hope to maintain and
perhaps even improve managerial response rates.
However, “The fixed costs of paper surveys appear low relative to the cost of commercially
developing a website for electronic data collection. However…the variable costs appear to favor
the electronic methods. Paper survey instruments must be physically produced, assembled, and
distributed for each wave of contact. In contrast, electronic mail can be distributed at a
negligible price per message” (Griffis et al. 2003, 241). Note: this assumes no telephone call: 2
email contacts and a follow-up mail postcard only. “The costs for the Internet study are
comprised largely of fixed costs associated with the development of the web-based survey

48
instrument. Additional contacts to potential respondents would cost virtually nothing, and
keeping the website open longer to collect those responses costs $35 per month. The cost
structure of the mail survey is very different. The primary costs associated with the mail survey
are variable in nature. Printing, stuffing, and mailing costs are all variable based on the number
of surveys produc ed and mailed…In the current study, 1,538 contacts represent the break-even
point between these two methods. All other things constant, the Internet survey becomes a more
cost-effective method when the number of contacts exceeds this count…the cost per response
decreases [for the web survey] as the sample size rises, while the cost per response remains
relatively constant for the mail survey” (Griffis et al. 2003, 247). Web surveys also reach target
respondents in far-flung geographic locations at a faster pace than traditional mail surveys
(Cobanoglu and Conanoglu 2003).
Note that the increased costs associated with the telephone invitation (first contact) are
somewhat offset by the decreased distribution costs associated with the E-mail invitation (second
contact)—the printing and postage costs connected with mail surveys are eliminated (Dillman
2000; Klaussen and Jacobs 2001; Miller 2001; Shannon and Bradshaw 2002; Sheenan and Hoy
1999; Simsek and Viega 2001).
In the context of a research illustration, this paper compares and contrast best practices
associated with the deployment of traditional and web-based surveys. Beyond these survey
research best practices, many design options are now available due to the WWW, and as a result,
some key tradeoffs exist. In developing our web-based survey roadmap of design choices, we
drew not only from recent literature, but also from the knowledge of experts in the field who
49
specialize in developing custom web-based surveys. Taken together, we provide some practical
recommendations for the successful implementation of web-based surveys that can help guide
colleagues in future research endeavors.
“…web survey response rates will depend very much on…the ability of the researcher to
conduct a well-designed electronic survey…web surveys can yield large response rates, but only
after careful consideration of the survey population and design of the survey instrument” (Porter
2004, 10).
“Every survey involves a number of decisions that have the potential to enhance or detract
from the accuracy (or precision) of survey estimates. Generally, the decisions that would lead to
‘better’ data involve more money, time, or other resources. Thus the design of a survey involves
a set of decisions to optimize the use of resources” (Fowler 1988, 15).
Potential for cyber panels in OM business-to-business research? ”…we are likely to see
huge panels of people who register by providing extensive background information and then
continue to participate in research for free Internet services…The motivation for such cyber
panels will be a factor that we have already noted; the increasing interest in highly targeted
populations as companies move toward focused forms of marketing. Research companies will
be able to screen these panels rapidly for respondents who meet very exacting requirements”
(Sudman and Blair 1999, 276). Of course this will require researchers to employ a probability
sampling technique (e.g., random sampling) to select people from the panel for inclusion in the
particular study (Fowler 1988).
“The most common [survey research] design is cross-sectional in which information is
collected at one point in time from a sample chosen to represent the population. The lack of a
temporal dimension makes it difficult to establish causality, but the design is appropriate to test

50
differences in population subsets. In contrast, longitudinal designs are appropriate for studying
phenomenon that change (e.g., the impact of MRP implementation on work design over time) by
collecting data in the same organization at two points or more over time. These designs are
difficult to implement, but can provide greater confidence regarding causality” (Malhotra and
Grover 1998, 409-410).
“Web and e-mail surveys have been used quite extensively in market research and customer
service. The results of these surveys have provided useful data for businesses in planning and
marketing strategies. Web and e-mail surveys have also made inroads into academic and
government research” (Nesbary 2000, 66). The report on ways to “felp bridge the gap between
traditional survey research methods and the emerging discipline of web-based survey research”
(Nesbary 2000):
o “Understand how web-based surveys differ from conventional surveys (basic survey
design regarding each mode is discussed)”
o “Know the strengths and weaknesses of web surveys”
o “Provide guidance in constructing and administering a web survey (‘how to’ guide with
respect to constructing web surveys)”
Acknowledgement
We gratefully acknowledge Todd Neal, Chris Andreola, and the adcSTUDIO team, who were invaluable in transforming the paper-based survey into a professional web-based survey.

51
References
Ahire, S. L., D. Y. Golhar, M. A. Waller. 1996. Development and validation of TQM
implementation constructs. Decision Sciences 27(1) 23-56.
Anderson, J. C., M. Rungtusanatham, R. Schroeder, S. Deveraj. 1995. A path analytic model of
a theory of quality management underlying the Deming method: Preliminary empirical
findings. Decision Sciences 26(5) 637-658.
Armstrong, J. S., T. S. Overton. 1977. Estimating non-response bias in mail surveys. Journal of
Marketing Research 14 396-402.
Bollen, K. A. 1989. Structural Equations with Latent Variables. John Wiley & Sons, Inc., New
York, NY.
Bosnjak, M. M., T. L. Tuten. 2001. Classifying response behaviors in web-based surveys.
Journal of Computer-Mediated Communication 6(3) April. Available at
http://www.ascusc.org/jcmc/vol6/issue3/boznjak.html.
Boudreau, J., W. Hopp, J. O. McClain, L. J. Thomas. 2003. Manufacturing & Service
Operations Management 5(3) 179-202.
Bowers, D. K. 1998/1999. FAQs on online research. Marketing Research 10(4) 45-48.
Boyer, K. K., J. R. Olson, R. J. Calantone, E. C. Jackson. 2002. Print versus electronic surveys:
A comparison of two data collection methodologies. Journal of Operations Management
20(4) 357-373.
Boyer, K. K., J. R. Olson, E. C. Jackson. 2001. Electronic surveys: Advantages and
disadvantages over traditional print surveys. Decision Line 32(4) 4-7.

52
Boyer, K. K., M. Pagell. 2000. Measurement issues in empirical research: Improving measures
of operations strategy and advanced manufacturing technology. Journal of Operations
Management 18(3) 361-374.
Buffa, E. S. 1980. Research in operations management. Journal of Operations Management
1(1) 1-7.
Chase, R. B. 1980. A classification and evaluation of research in operations management.
Journal of Operations Management 1(1) 9-14.
Churchill, G. A. 1979. A paradigm for developing better measures of marketing constructs.
Journal of Marketing Research 16 64-73.
Clarke, I. 2001. Extreme response style in cross-cultural research. International Marketing
Review 18(3) 301-325.
Cobanoglu, C., N. Cobanoglu. 2003. The effect of incentives in web surveys: Application and
ethical considerations. International Journal of Market Research 45(4) 475-488.
Cobanoglu, C., B. Warde, P. J. Moreo. 2001. A comparison of mail, fax and web-based survey
methods. International Journal of Market Research 43(4) 441-452.
Collins, R. S., C. Cordon. 1997. Survey methodology in manufacturing strategy and practice
research. International Journal of Operations & Production Management 17(7) 687-694.
Couper, M. P. 2000. Web-surveys: A review of issues and approaches. Public Opinion
Quarterly 64(4) 464-494.
Couper, M. P., M. W. Traugott, M. J. Lamias. 2001. Web survey design and administration.
Public Opinion Quarterly 65(2) 230-253.
Crawford, S. D., M. P. Couper, M. J. Lamias. 2001. Web surveys: Perceptions of burden.
Social Science Computer Review 19(2) 146-162.
53
Creswell, J. W. 1994. Research Design: Quantitative and Qualitative Approaches. Sage
Publications, Thousand Oaks, CA.
Daft, R. L., R. H. Lengel. 1986. Organizational information requirements, media richness and
struc tural design. Management Science 32(5) 554-571.
Daft, R. L., R. H. Lengel, L. K. Trevino. 1987. Message equivocality, media selection, and
manager performance: Implications for information systems. MIS Quarterly 11(3) 355-366.
Dahan, E. J. R. Hauser. 2002. The virtual customer. Journal of Production and Innovation
Management 19(5) 332-353.
Deal, K. 2003. Do-it yourself Internet surveys. Marketing Research 15(2) 40-42.
Deutskens, E., K. D. Ruyter, M. Wetzels, P. Oosterveld. 2004. Response rate and response
quality of Internet-based surveys: An experimental study. Marketing Letters 15(1) 21-36.
Delaney-Klinger, K., K. K. Boyer, M. Frohlich. 2003. The return of online grocery shopping: A
comparative analysis of Webvan and Tesco’s operational methods. TQM Magazine 15(3)
187-196.
Dillman, D. A. 1978. Mail and Telephone Surveys: The Total Design Method . John Wiley &
Sons, Inc., New York, NY.
Dillman, D. A. 2000. Mail and Internet Surveys: The Tailored Design Method. John Wiley &
Sons, Inc., New York, NY.
Dillman, D. A., R. D. Tortora, D. Bowker. 1999. Principles for constructing web surveys.
Working paper, Social and Economic Sciences Research Center, Washington State
University, Pullman, WA.
Edwards, J. 1998. Interviewing. Notes provided in BUSI 308 class.
Fink, A. 1995. How to Ask Survey Questions. Sage Publications, Inc., Thousand Oaks, CA.

54
Flynn, B. B., S. Sakakibara, R. G. Schroeder, K. A. Bates, J. E. Flynn 1990. Empirical research
methods in Operations Management. Journal of Operations Management 9(2) 250-284.
Flynn, B. B., R. G. Schroeder, S. Sakakibara 1994. A framework for quality management
research and an associated measurement instrument. Journal of Operations Management
11(4) 339-366
Forza, C. 2002. Survey research in operations management: A process-based perspective.
International Journal of Operations and Production Management 22(2) 152-194.
Fowler, F. J., 1988. Survey Research Methods. Sage Publications, Newbury Park, CA.
Froehle, C., A. V. Roth. 2004. New measurement scales for evaluating perceptions of the
technology-mediated customer service experience. Journal of Operations Management
22(1) 1-21.
Frohlich, M. 2002. Techniques for improving response rates in OM survey research. Journal of
Operations Management 20(1) 53-62.
Frohlich, M., R. Westbrook. 2001. Arcs of integration: An international study of supply chain
strategies. Journal of Operations Management 19(2) 185-200.
Gaddis, S. E. 1998. How to design online surveys. Training & Development 52 (6) 67-71.
Goldby, T. J., K. Savitskie, T. P. Stank, S. K. Vickery. 2001. Web-based surveys: Reaching
potential respondents on-line. Decision Line 32(2) 4-6.
Gordon, A., 2002. SurveyMonkey.com—Web-based survey and evaluation system
http://www.SurveyMonkey.com. The Internet and Higher Education 5 83-87.
Griffis, S. E., T. J. Goldsby, M. Cooper. 2003. Web-based and mail surveys: A comparison of
response, data, and cost. Journal of Business Logistics 24(2) 237-258.

55
Hair, J. F., Jr., R. E. Anderson, R. L. Tatham, W. C. Black. 1995. Multivariate Data Analysis.
Prentice-Hall, Upper Saddle River, NJ.
Hayslett, M. M., B. M. Wildemuth. 2004. Pixels or pencils? The relative effectiveness of web-
based versus paper surveys. Library & Information Science Research 26 73-93.
Hensley, R. L. 1999. A review of operations management studies using scale development
techniques. Journal of Operations Management 17(3) 343-358.
International Service Study (ISS). 1997.
Johnson, D. E. 1998. Applied Multivariate Methods for Data Analysts. Brooks/Cole Publishing
Company, Pacific Grove, CA.
Kahn, R. L., C. F. Cannell. 1957. The Dynamics of Interviewing. Wiley, New York, NY.
King, N. 2000. What are they thinking? PC Magazine 19(3) 163-178.
Klaussen, R., J. Jacobs. 2001. Experimental comparison of web, electronic and mail survey
technologies in operations management. Journal of Operations Management 19(6) 713-728.
Lindell, M. K., D. J. Whitney. 2001. Accounting for common method variance in cross-sectional
research designs. Journal of Applied Psychology 86(1) 114-121.
Malhotra, M., V. Grover. 1998. An assessment of survey research in POM: From constructs to
theory. Journal of Operations Management 16(4) 407-425.
Menor, L., A. V. Roth. 2003. Fuzzy front end paper…
Menor, L., A. V. Roth, C. Mason. 2001. Agility in retail banking: A numerical taxonomy of
strategic service groups. Manufacturing and Service Operations Management 3(4) 273-292.
Miller, J. G., A. V. Roth. 1994. A taxonomy of manufacturing strategies. Management Science
40(3) 285-304.

56
Miller, T. W. 2001. Make the call: Online results are a mixed bag. Marketing News 35(20) 30-
35.
Moore, G. C., I. Benbasat. 1991. Development of an instrument to measure the perceptions of
adopting an information technology innovation. Information Systems Research 2(2) 192-
222.
Morrel-Samuels, P. 2003. Web surveys’ hidden hazards. Harvard Business Review 81(7) 16-17.
Nesbary, D. K. 2000. Survey Research and the World Wide Web. Allyn & Bacon, Needham
Heights, MA.
O’Leary-Kelly, S. W., R. J. Vokurka. 1998. The empirical assessment of construct validity.
Journal of Operations Management 16(4) 387-405.
Palmer, 2002.
Pedhazur, E. J., L. P. Schmelkin. 1991. Measurement, Design and Analysis: An Integrated
Approach. Lawrence Erlbaum Associates, Inc., Hillsdale, NJ.
Podsakoff, P. M., S. B. MacKenzie, J. Lee, N. P. Podsakoff. 2003. Common methods biases in
behavioral research: A critical review of the literature and recommended remedies. Journal
of Applied Psychology 88(5) 879-903.
Podsakoff, P. M., D. W. Organ. 1986. Self-reports in organizational research: Problems and
prospects. Journal of Management 12(4) 531-544.
Porter, S. R. 2004. Raising response rates: What works? New Directions for Institutional
Research 121 5-21.
Porter, S. R., M. E. Whitcomb. 2004. Understanding the effect of prizes on response rates. New
Directions for Institutional Research 121 5-21.
57
Porter, S. R., M. E. Whitcomb. 2003. The impact of contact type on web survey response rates.
Public Opinion Quarterly 67 579-588.
Rosenzweig, E. D. 2002. Navigating business-to-business (B2B) marketspaces: An empirical
investigation of seller competence and performance. Ph.D. dissertation, Kenan-Flagler
Business School, The University of North Carolina, Chapel Hill, NC.
Rosenzweig, E. D., A. V. Roth, J. Dean, Jr. 2003. The influence of an integration strategy on
competitive capabilities and business performance: An exploratory study of consumer
products manufacturers. Journal of Operations Management 21(4) 437-456.
Rungtusanatham, M. J., T. Y. Choi, D. G. Hollingworth, Z. Wu, C. Forza. 2003. Survey
research in operations management: Historical analysis. Journal of Operations Management
21 475-488.
Ryan, A. M., M. J. Schmit. 1996. An assessment of organizational climate and p-e fit: A tool for
organizational change. International Journal of Organizational Analysis 4(1) 75-95.
Schaefer, D. R., D. A. Dillman. 1998. Development of a standard E-mail methodology: Results
of an experiment. Public Opinion Quarterly 62(3) 378-397.
Schillewaert, N., F. Langerak, T. Duhamel. 1998. Non-probability sampling for WWW
surveys: A comparison of methods. Journal of the Market Research Society 40(4) 307-322.
Shannon, D. M., C. C. Bradshaw. 2002. A comparison of response rate, response time, and
costs of mail and electronic surveys. Journal of Experimental Education 70(2) 179-192.
Sheehan, K. B., M. G. Hoy. 1999. Using E-mail to survey Internet users in the United States:
Methodology and assessment. Journal of Computer-Mediated Communication 4(3) March.
Available at http://www.ascusc.org/jcmc/vol4/issue3/sheenan.html.
58
Simsek, Z., J. F. Veiga. 2001. A primer on Internet organizational surveys. Organizational
Research Methods 4(3) 218-235.
Stanton, J. M., S. G. Rogelberg. 2001. Using Internet/Intranet web pages to collect
organizational research data. Organizational Research Methods 4(3) 200-217.
Stratman, J., A. V. Roth. 2002. Enterprise resource planning (ERP) competence constructs:
Two-stage multi- item scale development and validation. Decision Sciences 33(4) 601-628.
Sudman, S., E. Blair. 1999. Sampling in the twenty-first century. Academy of Marketing
Science 27(2) 269-277.
Swamidass, P. M. 1991. Empirical science: New frontier in operations management research.
Academy of Management Review 16(4) 793-814.
Swamidass, P. M., W. T. Newell. 1987. Manufacturing strategy, environmental uncertainty and
performance: A path analytic model. Management Science 33(4) 509-524.
Tourangeau, R. 2004. Survey research and societal change. Annual Rev. Psychol. 55 775-801.
Truell, A. D. 2003. Use of Internet tools for survey research. Information, Technology,
Learning, and Performance Journal 21(1) 31-37.
Umbach, P. 2004. Web surveys: Best practices. New Directions for Institutional Research 121
23-38.
Vickery, S. K., C, Droge, R. E. Markland. 1993. Production competence and business strategy:
Do they affect business performance? Decision Sciences 24(2) 435-455.
Vickery, S. K., C. Droge, T. P. Stank, T. J. Goldsby, R. E. Markland. 2004. The performance
implications of media richness in a business-to-business service environment: Direct versus
indirect effects. Management Science 50(8) 1106-1119.
59
Vogt, P. W. 1993. Dictionary of Statistics and Methodology: A Nontechnical Guide for the
Social Sciences. Sage Publications, Newbury Park, CA.
Voss, C. A., A. V. Roth, E. D. Rosenzweig, K. Blackmon, R. B. Chase. 2004. A tale of two
countries’ conservatism, service quality, and feedback on customer satisfaction. Journal of
Service Research 6(3) 212-230.
Werts, C. E., R. L. Linn, K. G. Joreskog. 1974. Interclass reliability estimates: Testing structural
assumptions. Educational and Psychological Measurement 34(1) 25-33.