draft ripdes permit ri0000191
TRANSCRIPT

PN 21-07
RHODE ISLAND DEPARTMENT OF ENVIRONMENTAL MANAGEMENT OFFICE OF WATER RESOURCES
PERMITS SECTION 235 PROMENADE STREET
PROVIDENCE, RHODE ISLAND 02908-5767
PUBLIC NOTICE OF PROPOSED PERMIT ACTION UNDER THE RHODE ISLAND POLLUTANT DISCHARGE ELIMINATION SYSTEM (RIPDES) PROGRAM WHICH REGULATES DISCHARGES INTO THE WATERS OF THE STATE UNDER CHAPTER 46-12 OF THE RHODE ISLAND GENERAL LAWS OF 1956, AS AMENDED.
DATE OF NOTICE: October 15, 2021
PUBLIC NOTICE NUMBER: PN 21-07
DRAFT RIPDES PERMIT
RIPDES PERMIT NUMBER: RI0000191
NAME AND MAILING ADDRESS OF APPLICANT:
Kenyon Industries, Incorporated 36 Sherman Avenue
Kenyon, Rhode Island 02836
NAME AND ADDRESS OF FACILITY WHERE DISCHARGE OCCURS:
Kenyon Industries, Incorporated 36 Sherman Avenue
Kenyon, Rhode Island 02836
RECEIVING WATER: Pawcatuck River (WBID: RI00008039R-18B)
RECEIVING WATER CLASSIFICATION: B1
The facility, which is the source of the wastewater discharge, is located in the Towns of Richmond and Charlestown and is engaged in the manufacturing of natural and synthetic textile products. The Rhode Island Department of Environmental Management (DEM) last issued the facility’s RIPDES Permit in 2010. The permit authorizes the discharge from three (3) outfalls: Outfall 001A (Outlet from the second aeration lagoon), Outfall 002A (Non-contact cooling water), and Outfall 004A (Water from under the floor of the Greige Room). All of the above referenced outfalls discharge to the Pawcatuck River.
The Draft Permit and/or Fact Sheet have been updated to modify effluent limitations and/or monitoring requirements for BOD5, TSS, Sulfide, Total Chromium, Total Phenols, Total Ammonia, Copper, Aluminum, Nickel, Zinc, Lead, Cadmium, Silver, and Whole Effluent Toxicity. Effluent monitoring and limitations have also been established for Hexavalent Chromium and Phenol. A new outfall, Outfall

PN 21-07
004A, has also been established and authorizes the discharge of groundwater and floodwater diverted from the facility. The permit also requires the submission of a Phosphorus and Nitrogen Removal Engineering Report within three (3) years from the effective date of the permit. Monitoring and reporting requirements have been updated to comply with the U.S. Environmental Protection Agency’s NPDES Electronic Reporting Rule and the NPDES Sufficiently Sensitive Test Methods and Reporting Rule. The DEM anticipates entering into a Consent Agreement, subsequent to issuance of this permit, which will establish enforceable compliance schedules to achieve compliance with the new and more stringent permit limits. The DEM has determined that the proposed permit complies with the antidegradation provisions of the Rhode Island Water Quality Regulations and that existing uses will be maintained and protected.
FURTHER INFORMATION:
A Fact Sheet (describing the type of facility and significant factual, legal and policy questions considered in these permit actions) may be obtained at no cost by emailing or calling DEM as noted below:
Max Maher Environmental Engineer I
Rhode Island Department of Environmental Management Office of Water Resources
235 Promenade Street Providence, Rhode Island 02908-5767
(401) 222-4700 ext. 2777201e-mail: [email protected]
The administrative record containing all documents relating to these permit actions is on file and may be inspected, by appointment, at the DEM's Providence office mentioned above between 8:30 a.m. and 4:00 p.m., Monday through Friday, except holidays.
PUBLIC COMMENT AND REQUEST FOR PUBLIC HEARING:
Pursuant to Chapter 42-17.4 of the Rhode Island General Laws a public hearing has been scheduled to consider this permit if requested. Requests for a Public Hearing must be submitted to the attention of Max Maher as indicated above. Notice should be taken that if DEM receives a request from twenty-five (25) people, a governmental agency or subdivision, or an association having no less than twenty-five (25) members on or before 4:00 PM on November 15, 2021, a public hearing will be held at the following time and place:
5:00 PM Thursday, November 18, 2021 Room 280
235 Promenade Street Providence, Rhode Island 02908
Interested persons should contact DEM to confirm if a hearing will be held at the time and location noted above.
235 Promenade Street is accessible to individuals who are handicapped. If communication assistance (readers/interpreters/captioners) is needed, or any other accommodation to ensure equal participation,


Kenyon 2021 Public Notice Draft Permit
AUTHORIZATION TO DISCHARGE UNDER THE RHODE ISLAND POLLUTANT DISCHARGE ELIMINATION SYSTEM In compliance with the provisions of Chapter 46-12 of the Rhode Island General Laws, as amended, the
Kenyon Industries, Incorporated 36 Sherman Avenue
Kenyon, Rhode Island 02836 is authorized to discharge from a facility located at
36 Sherman Avenue Kenyon, Rhode Island 02836
to receiving waters named
Pawcatuck River (WBID: RI00008039R-18B)
in accordance with effluent limitations, monitoring requirements and other conditions set forth herein. This permit shall become effective on __________________. This permit and the authorization to discharge expire at midnight, five (5) years from the effective date. This permit supersedes the permit issued on July 20, 2010. This permit consists of 23 pages in Part I including effluent limitations, monitoring requirements, etc. and 10 pages in Part II including General Conditions. Signed this ______ day of ______________ 2021.
DRAFT Angelo S. Liberti, P.E., Chief of Surface Water Protection Office of Water Resources Rhode Island Department of Environmental Management Providence, Rhode Island

Permit No. RI0000191 Page 2 of 23
Kenyon 2021 Public Notice Draft Permit
A. EFFLUENT LIMITATIONS AND MONITORING REQUIREMENTS
1. During the period beginning on the effective date and lasting through permit expiration, the permittee is authorized to discharge from outfall serial number 001A. (Outlet from the second aeration lagoon)
Such discharges shall be limited and monitored by the permittee as specified below:
Effluent Discharge Limitations Monitoring Requirement Characteristic Quantity - lbs./day Concentration - specify units Average Maximum Average Average Maximum Measurement Sample Monthly Daily Monthly Weekly Daily Frequency Type *(Minimum) *(Average) *(Maximum) Flow 0.49 MGD --- MGD Continuous Recorder
Production¹ --- --- 1/Day Calculated
BOD5 251 502 2/Week 24-Hr. Comp.
COD 3062 6125 2/Month 24-Hr. Comp.
TSS 676 1353 2/Month 24-Hr. Comp.
Sulfide 7.6 15.2 2/Month 24-Hr. Comp.
pH² (6.0 S.U.) (9.0 S.U.) 2/Week 3 Grabs
Chromium, Total 2.28 4.56 2/Month3 24-Hr. Comp.
Chromium, Hexavalent 105 ug/l 149 ug/l 2/Month3 24-Hr. Comp.
Phenols4 1.90 3.80 1/Week Grab
The limits on this page shall be invoked when the permittee’s total average monthly production is greater than 68,000 pounds of cloth per discharge day. See also Section I.A.18.
--- Signifies a parameter which must be monitored and data must be reported; no limit has been established at this time.
* Values in parentheses ( ) are to be reported as Minimum/Maximum for the reporting period.
¹ Production (the quantity of fabric processed) shall be reported based on the number of calendar days rather than the number of production days.
² Compliance with these limitations shall be determined by taking a minimum of three (3) grab samples over the day with a minimum of three (3) hours between grabs.
3 Samples for Total Chromium and Hexavalent Chromium shall be taken at the same time two times per month. If the results of twelve (12) consecutive months of monitoring show effluent concentrations of Hexavalent Chromium below the applicable minimum detection limit from Part I.D, then the permittee is no longer required to continue sampling for Hexavalent Chromium.
4 Phenols shall mean total phenols as measured by the procedure listed in 40 CFR Part 136.
Samples taken in compliance with the monitoring requirements specified above shall be taken Monday-Friday (Sunday – Saturday for flow) at the following location: Outfall 001A.
Permit No. RI0000191 Page 3 of 23
Kenyon 2021 Public Notice Draft Permit
A. EFFLUENT LIMITATIONS AND MONITORING REQUIREMENTS
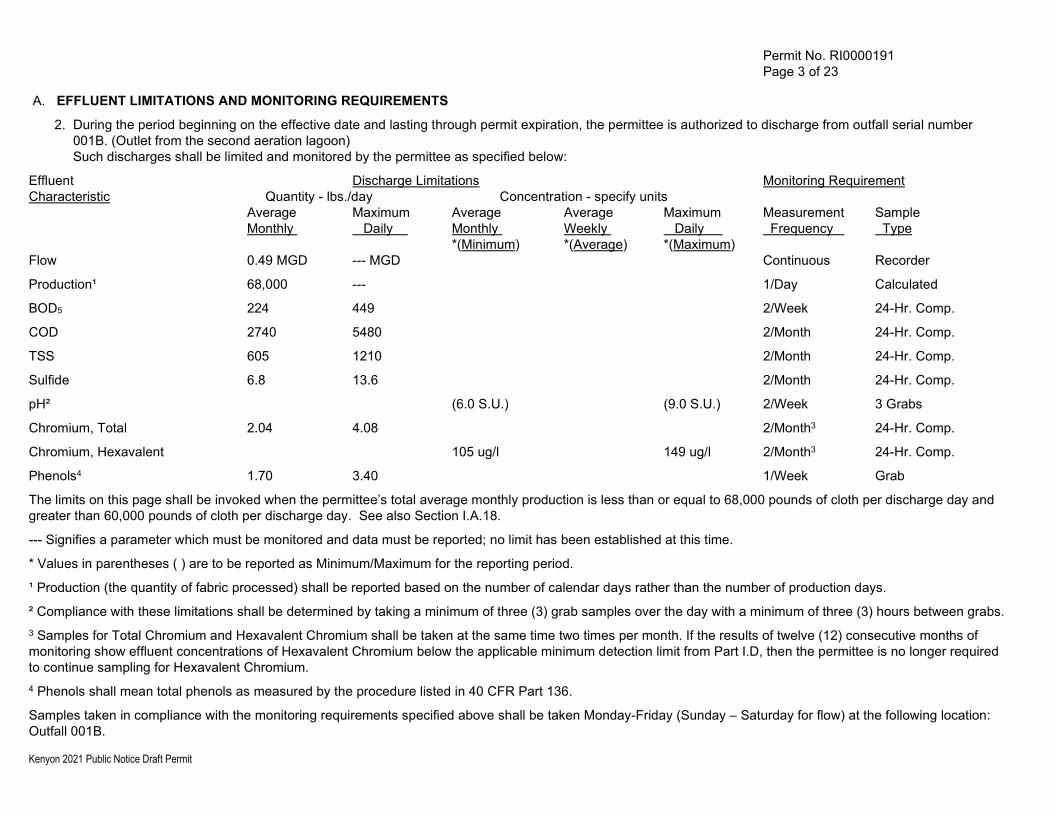
2. During the period beginning on the effective date and lasting through permit expiration, the permittee is authorized to discharge from outfall serial number 001B. (Outlet from the second aeration lagoon)
Such discharges shall be limited and monitored by the permittee as specified below:
Effluent Discharge Limitations Monitoring Requirement Characteristic Quantity - lbs./day Concentration - specify units Average Maximum Average Average Maximum Measurement Sample Monthly Daily Monthly Weekly Daily Frequency Type *(Minimum) *(Average) *(Maximum) Flow 0.49 MGD --- MGD Continuous Recorder
Production¹ 68,000 --- 1/Day Calculated
BOD5 224 449 2/Week 24-Hr. Comp.
COD 2740 5480 2/Month 24-Hr. Comp.
TSS 605 1210 2/Month 24-Hr. Comp.
Sulfide 6.8 13.6 2/Month 24-Hr. Comp.
pH² (6.0 S.U.) (9.0 S.U.) 2/Week 3 Grabs
Chromium, Total 2.04 4.08 2/Month3 24-Hr. Comp.
Chromium, Hexavalent 105 ug/l 149 ug/l 2/Month3 24-Hr. Comp.
Phenols4 1.70 3.40 1/Week Grab
The limits on this page shall be invoked when the permittee’s total average monthly production is less than or equal to 68,000 pounds of cloth per discharge day and greater than 60,000 pounds of cloth per discharge day. See also Section I.A.18.
--- Signifies a parameter which must be monitored and data must be reported; no limit has been established at this time.
* Values in parentheses ( ) are to be reported as Minimum/Maximum for the reporting period.
¹ Production (the quantity of fabric processed) shall be reported based on the number of calendar days rather than the number of production days.
² Compliance with these limitations shall be determined by taking a minimum of three (3) grab samples over the day with a minimum of three (3) hours between grabs.
3 Samples for Total Chromium and Hexavalent Chromium shall be taken at the same time two times per month. If the results of twelve (12) consecutive months of monitoring show effluent concentrations of Hexavalent Chromium below the applicable minimum detection limit from Part I.D, then the permittee is no longer required to continue sampling for Hexavalent Chromium.
4 Phenols shall mean total phenols as measured by the procedure listed in 40 CFR Part 136.
Samples taken in compliance with the monitoring requirements specified above shall be taken Monday-Friday (Sunday – Saturday for flow) at the following location: Outfall 001B.

Permit No. RI0000191 Page 4 of 23
Kenyon 2021 Public Notice Draft Permit
A. EFFLUENT LIMITATIONS AND MONITORING REQUIREMENTS
3. During the period beginning on the effective date and lasting through permit expiration, the permittee is authorized to discharge from outfall serial number 001C. (Outlet from the second aeration lagoon)
Such discharges shall be limited and monitored by the permittee as specified below:
Effluent Discharge Limitations Monitoring Requirement Characteristic Quantity - lbs./day Concentration - specify units Average Maximum Average Average Maximum Measurement Sample Monthly Daily Monthly Weekly Daily Frequency Type *(Minimum) *(Average) *(Maximum) Flow 0.49 MGD --- MGD Continuous Recorder
Production¹ 60,000 --- 1/Day Calculated
BOD5 198 396 2/Week 24-Hr. Comp.
COD 2418 4836 2/Month 24-Hr. Comp.
TSS 534 1068 2/Month 24-Hr. Comp.
Sulfide 6.0 12.0 2/Month 24-Hr. Comp.
pH² (6.0 S.U.) (9.0 S.U.) 2/Week 3 Grabs
Chromium, Total 1.80 3.60 2/Month3 24-Hr. Comp.
Chromium, Hexavalent 105 ug/l 149 ug/l 2/Month3 24-Hr. Comp.
Phenols4 1.50 3.00 1/Week Grab
The limits on this page shall be invoked when the permittee’s total average monthly production is less than or equal to 60,000 pounds of cloth per discharge day and greater than 52,000 pounds of cloth per discharge day. See also Section I.A.18.
--- Signifies a parameter which must be monitored and data must be reported; no limit has been established at this time.
* Values in parentheses ( ) are to be reported as Minimum/Maximum for the reporting period.
¹ Production (the quantity of fabric processed) shall be reported based on the number of calendar days rather than the number of production days.
² Compliance with these limitations shall be determined by taking a minimum of three (3) grab samples over the day with a minimum of three (3) hours between grabs.
3 Samples for Total Chromium and Hexavalent Chromium shall be taken at the same time two times per month. If the results of twelve (12) consecutive months of monitoring show effluent concentrations of Hexavalent Chromium below the applicable minimum detection limit from Part I.D, then the permittee is no longer required to continue sampling for Hexavalent Chromium.
4 Phenols shall mean total phenols as measured by the procedure listed in 40 CFR part 136.
Samples taken in compliance with the monitoring requirements specified above shall be taken Monday-Friday (Sunday – Saturday for flow) at the following location: Outfall 001C.

Permit No. RI0000191 Page 5 of 23
Kenyon 2021 Public Notice Draft Permit
A. EFFLUENT LIMITATIONS AND MONITORING REQUIREMENTS
4. During the period beginning on the effective date and lasting through permit expiration, the permittee is authorized to discharge from outfall serial number 001D. (Outlet from the second aeration lagoon)
Such discharges shall be limited and monitored by the permittee as specified below:
Effluent Discharge Limitations Monitoring Requirement Characteristic Quantity - lbs./day Concentration - specify units Average Maximum Average Average Maximum Measurement Sample Monthly Daily Monthly Weekly Daily Frequency Type *(Minimum) *(Average) *(Maximum) Flow 0.49 MGD --- MGD Continuous Recorder
Production¹ 52,000 --- 1/Day Calculated
BOD5 172 343 2/Week 24-Hr. Comp.
COD 2096 4191 2/Month 24-Hr. Comp.
TSS 463 926 2/Month 24-Hr. Comp.
Sulfide 5.2 10.4 2/Month 24-Hr. Comp.
pH² (6.0 S.U.) (9.0 S.U.) 2/Week 3 Grabs
Chromium, Total 1.56 3.12 2/Month3 24-Hr. Comp.
Chromium, Hexavalent 105 ug/l 149 ug/l 2/Month3 24-Hr. Comp.
Phenols4 1.30 2.60 1/Week Grab
The limits on this page shall be invoked when the permittee’s total average monthly production is less than or equal to 52,000 pounds of cloth per discharge day and greater than 44,000 pounds of cloth per discharge day. See also Section I.A.18.
--- Signifies a parameter which must be monitored and data must be reported; no limit has been established at this time.
* Values in parentheses ( ) are to be reported as Minimum/Maximum for the reporting period.
¹ Production (the quantity of fabric processed) shall be reported based on the number of calendar days rather than the number of production days.
² Compliance with these limitations shall be determined by taking a minimum of three (3) grab samples over the day with a minimum of three (3) hours between grabs.
3 Samples for Total Chromium and Hexavalent Chromium shall be taken at the same time two times per month. If the results of twelve (12) consecutive months of monitoring show effluent concentrations of Hexavalent Chromium below the applicable minimum detection limit from Part I.D, then the permittee is no longer required to continue sampling for Hexavalent Chromium.
4 Phenols shall mean total phenols as measured by the procedure listed in 40 CFR part 136.
Samples taken in compliance with the monitoring requirements specified above shall be taken Monday-Friday (Sunday – Saturday for flow) at the following location: Outfall 001D.

Permit No. RI0000191 Page 6 of 23
Kenyon 2021 Public Notice Draft Permit
A. EFFLUENT LIMITATIONS AND MONITORING REQUIREMENTS
5. During the period beginning on the effective date and lasting through permit expiration, the permittee is authorized to discharge from outfall serial number 001E. (Outlet from the second aeration lagoon)
Such discharges shall be limited and monitored by the permittee as specified below:
Effluent Discharge Limitations Monitoring Requirement Characteristic Quantity - lbs./day Concentration - specify units Average Maximum Average Average Maximum Measurement Sample Monthly Daily Monthly Weekly Daily Frequency Type *(Minimum) *(Average) *(Maximum) Flow 0.49 MGD --- MGD Continuous Recorder
Production¹ 44,000 --- 1/Day Calculated
BOD5 145 290 2/Week 24-Hr. Comp.
COD 1773 3546 2/Month 24-Hr. Comp.
TSS 392 783 2/Month 24-Hr. Comp.
Sulfide 4.4 8.8 2/Month 24-Hr. Comp.
pH² (6.0 S.U.) (9.0 S.U.) 2/Week 3 Grabs
Chromium, Total 1.32 2.64 2/Month3 24-Hr. Comp.
Chromium, Hexavalent 105 ug/l 149 ug/l 2/Month3 24-Hr. Comp.
Phenols4 1.10 2.20 1/Week Grab
The limits on this page shall be invoked when the permittee’s total average monthly production is less than or equal to 44,000 pounds of cloth per discharge day and greater than 36,000 pounds of cloth per discharge day. See also Section I.A.18.
--- Signifies a parameter which must be monitored and data must be reported; no limit has been established at this time.
* Values in parentheses ( ) are to be reported as Minimum/Maximum for the reporting period.
¹ Production (the quantity of fabric processed) shall be reported based on the number of calendar days rather than the number of production days.
² Compliance with these limitations shall be determined by taking a minimum of three (3) grab samples over the day with a minimum of three (3) hours between grabs.
3 Samples for Total Chromium and Hexavalent Chromium shall be taken at the same time two times per month. If the results of twelve (12) consecutive months of monitoring show effluent concentrations of Hexavalent Chromium below the applicable minimum detection limit from Part I.D, then the permittee is no longer required to continue sampling for Hexavalent Chromium.
4 Phenols shall mean total phenols as measured by the procedure listed in 40 CFR part 136.
Samples taken in compliance with the monitoring requirements specified above shall be taken Monday-Friday (Sunday – Saturday for flow) at the following location: Outfall 001E.

Permit No. RI0000191 Page 7 of 23
Kenyon 2021 Public Notice Draft Permit
A. EFFLUENT LIMITATIONS AND MONITORING REQUIREMENTS
6. During the period beginning on the effective date and lasting through permit expiration, the permittee is authorized to discharge from outfall serial number 001F. (Outlet from the second aeration lagoon)
Such discharges shall be limited and monitored by the permittee as specified below:
Effluent Discharge Limitations Monitoring Requirement Characteristic Quantity - lbs./day Concentration - specify units Average Maximum Average Average Maximum Measurement Sample Monthly Daily Monthly Weekly Daily Frequency Type *(Minimum) *(Average) *(Maximum) Flow 0.49 MGD --- MGD Continuous Recorder
Production¹ 36,000 --- 1/Day Calculated
BOD5 119 238 2/Week 24-Hr. Comp.
COD 1451 2902 2/Month 24-Hr. Comp.
TSS 320 641 2/Month 24-Hr. Comp.
Sulfide 3.6 7.2 2/Month 24-Hr. Comp.
pH² (6.0 S.U.) (9.0 S.U.) 2/Week 3 Grabs
Chromium, Total 1.08 2.16 2/Month3 24-Hr. Comp.
Chromium, Hexavalent 105 ug/l 149 ug/l 2/Month3 24-Hr. Comp.
Phenols4 0.90 1.80 1/Week Grab
The limits on this page shall be invoked when the permittee’s total average monthly production is less than or equal to 36,000 pounds of cloth per discharge day and greater than 28,000 pounds of cloth per discharge day. See also Section I.A.18.
--- Signifies a parameter which must be monitored and data must be reported; no limit has been established at this time.
* Values in parentheses ( ) are to be reported as Minimum/Maximum for the reporting period.
¹ Production (the quantity of fabric processed) shall be reported based on the number of calendar days rather than the number of production days.
² Compliance with these limitations shall be determined by taking a minimum of three (3) grab samples over the day with a minimum of three (3) hours between grabs.
3 Samples for Total Chromium and Hexavalent Chromium shall be taken at the same time two times per month. If the results of twelve (12) consecutive months of monitoring show effluent concentrations of Hexavalent Chromium below the applicable minimum detection limit from Part I.D, then the permittee is no longer required to continue sampling for Hexavalent Chromium.
4 Phenols shall mean total phenols as measured by the procedure listed in 40 CFR part 136.
Samples taken in compliance with the monitoring requirements specified above shall be taken Monday-Friday (Sunday – Saturday for flow) at the following location: Outfall 001F.

Permit No. RI0000191 Page 8 of 23
Kenyon 2021 Public Notice Draft Permit
A. EFFLUENT LIMITATIONS AND MONITORING REQUIREMENTS
7. During the period beginning on the effective date and lasting through permit expiration, the permittee is authorized to discharge from outfall serial number 001G. (Outlet from the second aeration lagoon)
Such discharges shall be limited and monitored by the permittee as specified below:
Effluent Discharge Limitations Monitoring Requirement Characteristic Quantity - lbs./day Concentration - specify units Average Maximum Average Average Maximum Measurement Sample Monthly Daily Monthly Weekly Daily Frequency Type *(Minimum) *(Average) *(Maximum) Flow 0.49 MGD --- MGD Continuous Recorder
Production¹ 28,000 -- 1/Day Calculated
BOD5 92 185 2/Week 24-Hr. Comp.
COD 1128 2257 2/Month 24-Hr. Comp.
TSS 249 498 2/Month 24-Hr. Comp.
Sulfide 2.8 5.6 2/Month 24-Hr. Comp.
pH² (6.0 S.U.) (9.0 S.U.) 2/Week 3 Grabs
Chromium, Total 0.84 1.68 2/Month3 24-Hr. Comp.
Chromium, Hexavalent 105 ug/l 149 ug/l 2/Month3 24-Hr. Comp.
Phenols4 0.70 1.40 1/Week Grab
The limits on this page shall be invoked when the permittee’s total average monthly production is less than or equal to 28,000 pounds of cloth per discharge day. See also Section I.A.18.
--- Signifies a parameter which must be monitored and data must be reported; no limit has been established at this time.
* Values in parentheses ( ) are to be reported as Minimum/Maximum for the reporting period.
¹ Production (the quantity of fabric processed) shall be reported based on the number of calendar days rather than the number of production days.
² Compliance with these limitations shall be determined by taking a minimum of three (3) grab samples over the day with a minimum of three (3) hours between grabs.
3 Samples for Total Chromium and Hexavalent Chromium shall be taken at the same time two times per month. If the results of twelve (12) consecutive months of monitoring show effluent concentrations of Hexavalent Chromium below the applicable minimum detection limit from Part I.D, then the permittee is no longer required to continue sampling for Hexavalent Chromium.
4 Phenols shall mean total phenols as measured by the procedure listed in 40 CFR part 136.
Samples taken in compliance with the monitoring requirements specified above shall be taken Monday-Friday (Sunday – Saturday for flow) at the following location: Outfall 001G.

Permit No. RI0000191 Page 9 of 23
Kenyon 2021 Public Notice Draft Permit
A. EFFLUENT LIMITATIONS AND MONITORING REQUIREMENTS 8. During the period beginning on the effective date and lasting through permit expiration, the permittee is authorized to discharge from outfall serial number
001A. (Outlet from the second aeration lagoon) Such discharges shall be monitored by the permittee as specified below: Effluent Discharge Limitations Monitoring Requirement Characteristic Quantity - lbs. per day Concentration - specify units Average Maximum Average Average Maximum Measurement Sample Monthly Daily Monthly Weekly Daily Frequency Type Copper , Total 39.19 ug/l 54.28 ug/l 1/Week 24-Hr. Comp. Phenol1 51 ug/l 2300 ug/l 1/Quarter 24-Hr. Comp. Aluminum, Total 797 ug/l 6874 ug/l 1/Quarter 24-Hr. Comp. Nickel, Total --- ug/l --- ug/l 1/Quarter 24-Hr. Comp. Zinc, Total --- ug/l --- ug/l 1/Quarter 24-Hr. Comp. Lead, Total --- ug/l --- ug/l 1/Quarter 24-Hr. Comp. Cadmium, Total --- ug/l --- ug/l 1/Quarter 24-Hr. Comp. Silver, Total --- ug/l --- ug/l 1/Quarter 24-Hr. Comp. The limits on this page apply during all production tiers. See also Section I.A.18. --- signifies a parameter which must be monitored and data must be reported; no limit has been established at this time. 1 Phenol shall mean the parameter with CAS Number 108-95-2 whose approved analytical methods are established in Table IC.100 of 40 CFR §136.3
Samples taken in compliance with the monitoring requirements specified above shall be taken Monday through Friday at the following locations: Outfall 001A.

Permit No. RI0000191 Page 10 of 23
Kenyon 2021 Public Notice Draft Permit
A. EFFLUENT LIMITATIONS AND MONITORING REQUIREMENTS 9. During the period beginning on the effective date and lasting through permit expiration, the permittee is authorized to discharge from outfall serial number
001A. (Outlet from the second aeration lagoon) Such discharges shall be monitored by the permittee as specified below: Effluent Discharge Limitations Monitoring Requirement Characteristic Quantity - lbs. per day Concentration - specify units Average Maximum Average Average Maximum Measurement Sample Monthly Daily Monthly Weekly Daily Frequency Type Phosphorus, Total (Nov. – March) --- mg/l --- mg/l 1/Quarter 24-Hr. Comp. (April – Oct.) --- mg/l --- mg/l 1/Month 24-Hr. Comp. Nitrate, Total (as N) (Nov. – April) --- mg/l --- mg/l 1/Quarter 24-Hr. Comp. (May – Oct.) --- mg/l --- mg/l 1/Month 24-Hr. Comp. Nitrite, Total (as N) (Nov. – April) --- mg/l --- mg/l 1/Quarter 24-Hr. Comp. (May – Oct.) --- mg/l --- mg/l 1/Month 24-Hr. Comp. TKN (as N) (Nov. – April) --- mg/l --- mg/l 1/Quarter 24-Hr. Comp. (May – Oct.) --- mg/l --- mg/l 1/Month 24-Hr. Comp. Nitrogen, Total (Total Nitrate + Total Nitrite + TKN, as N) (Nov. – April) --- mg/l --- mg/l 1/Quarter 24-Hr. Comp. (May – Oct.) --- mg/l --- mg/l 1/Month 24-Hr. Comp. Ammonia, Total (as N) (Nov. – April) 145 mg/l 834 mg/l 1/Month 24-Hr. Comp. (May– Oct) 68.4 mg/l 429 mg/l 1/Month 24-Hr. Comp. The limits on this page apply during all production tiers. See also Section I.A.18. --- signifies a parameter which must be monitored and data must be reported; no limit has been established at this time.

Permit No. RI0000191 Page 11 of 23
Kenyon 2021 Public Notice Draft Permit
Samples taken in compliance with the monitoring requirements specified above shall be taken Monday through Friday at the following locations: Outfall 001A. A. EFFLUENT LIMITATIONS AND MONITORING REQUIREMENTS 10. During the period beginning on the effective date and lasting through permit expiration, the permittee is authorized to discharge from outfall serial number
001A. (Outlet from the second aeration lagoon) Such discharges shall be monitored by the permittee as specified below: Effluent Discharge Limitations Monitoring Requirement Characteristic Quantity - lbs. per day Concentration - specify units Average Maximum Average Average Maximum Measurement Sample Monthly Daily Monthly Weekly Daily Frequency Type Ceriodaphnia Sp. LC50¹ 50% 1/Quarter 24-Hr. Comp. or Greater Pimephales promelas 55% 1/Quarter 24-Hr. Comp. LC50¹ or Greater The limits on this page apply during all production tiers. See also Section I.A.18. ¹ LC50 is defined as the concentration of wastewater that causes mortality to 50% of the test organisms. Samples taken in compliance with the monitoring requirements specified above shall be taken at the following locations: Outfall 001A in accordance with I.B. of the permit.

Permit No. RI0000191 Page 12 of 23
Kenyon 2021 Public Notice Draft Permit
A. EFFLUENT LIMITATIONS AND MONITORING REQUIREMENTS 11. During the period beginning on the effective date and lasting through permit expiration, the permittee is authorized to discharge from outfall serial number
002A. (Non-contact cooling water) Such discharges shall be limited and monitored by the permittee as specified below: Effluent Discharge Limitations Monitoring Requirement Characteristic Quantity - lbs./day Concentration - specify units Average Maximum Average Average Maximum Measurement Sample Monthly Daily Monthly Weekly Daily Frequency Type *(Minimum) *(Average) *(Maximum) Flow 0.12 MGD 1/Month Estimate Temperature (Intake)¹ ---°F 1/Month 8 Grabs Temperature¹ 80°F 1/Month 8 Grabs pH¹ (--- S.U.) (--- S.U.) 1/Month 8 Grabs --- Signifies a parameter which must be monitored and data must be reported; no limit has been established at this time. ¹ Eight grab samples shall be taken on the same day, equally spaced through the scheduled workday. * Values in parentheses ( ) are to be reported as Minimum/Maximum for the reporting period. Samples taken in compliance with the monitoring requirements specified above shall be taken at the following locations: Outfall 002A

Permit No. RI0000191 Page 13 of 23
Kenyon 2021 Public Notice Draft Permit
A. EFFLUENT LIMITATIONS AND MONITORING REQUIREMENTS 12. During the period beginning on the effective date and lasting through permit expiration, the permittee is authorized to discharge from outfall serial number
004A. (Water from under the floor of the Greige Room) Such discharges shall be limited and monitored by the permittee as specified below: Effluent Discharge Limitations Monitoring Requirement Characteristic Quantity - lbs./day Concentration - specify units Average Maximum Average Average Maximum Measurement Sample Monthly Daily Monthly Weekly Daily Frequency Type *(Minimum) *(Average) *(Maximum) Flow --- MGD --- MGD 1/Month Estimate/Recorder1
Tetrachloroethylene --- ug/l --- ug/l 1/Month2 Grab Trichloroethylene --- ug/l --- ug/l 1/Month2 Grab Trans-dichloroethylene --- ug/l --- ug/l 1/Month2 Grab Vinyl Chloride --- ug/l --- ug/l 1/Month2 Grab --- Signifies a parameter which must be monitored and data must be reported; no limit has been established at this time. 1Within one (1) year of the effective date for this permit, the permittee shall install a flowmeter for measuring the amount of water discharged from Outfall 004A. See Part I.A. 19. 2Monitoring for the above pollutants shall only be required when the gage height of the Pawcatuck River upstream of the Kenyon facility is less than two feet at the time of the discharge. Samples taken in compliance with the monitoring requirements specified above shall be taken at the following locations: Outfall 004A

PART I Permit No. RI0000191 Page 14 of 23
Kenyon 2021 Public Notice Draft Permit
13. a. The effluent shall not cause the receiving water to have a pH less than 6.5 S.U. nor greater than 9.0 S.U. standard units at any time unless these pH values in the receiving water are exceeded due to natural causes.
b. The discharge shall not cause visible discoloration of the receiving waters.
c. The effluent shall contain neither a visible oil sheen, foam, nor floating solids at any time.
14. All existing manufacturing, commercial, mining, and silvicultural dischargers must notify
the Director as soon as they know or have reason to believe: a. That any activity has occurred or will occur which would result in the discharge,
on a routine or frequent basis, of any toxic pollutant which is not limited in the permit, if that discharge will exceed the highest of the following "notification levels":
(1) One hundred micrograms per liter (100 ug/l);
(2) Two hundred micrograms per liter (200 ug/l) for acrolein and acrylonitrile; five hundred micrograms per liter (500 ug/l) for 2,4-dinitrophenol and for 2-methyl-4,6-dinitro-phenol; and one milligram per liter (1 mg/l) for antimony;
(3) Five (5) times the maximum concentration value reported for that
pollutant in the permit application in accordance with 40 C.F.R. §122.21(g)(7);
(4) Any other notification level established by the Director in accordance with
40 C.F.R. §122.44(f) and Rhode Island Regulations.
b. That any activity has occurred or will occur which would result in the discharge, on a non-routine or infrequent basis, of any toxic pollutant which is not limited in the permit, if that discharge will exceed the highest of the following "notification levels":
(1) Five hundred micrograms per liter (500 ug/l); (2) One milligram per liter (1 mg/l) for antimony;
(3) Ten (10) times the maximum concentration value reported for that pollutant in the permit application in accordance with 40 C.F.R. §122.21(g)(7); or
(4) Any other notification level established by the Director in accordance with
40 C.F.R. §122.44(f) and Rhode Island Regulations.
c. That they have begun or expect to begin to use or manufacture as an intermediate or final product or by-product any toxic pollutant which was not reported in the permit application.
15. The permittee shall analyze its effluent from outfall 001 annually for the EPA Priority
Pollutants as listed in 40 CFR 122, Appendix D, Tables II and III. The results of these analyses shall be submitted to the Department of Environmental Management by January 15th of each year for the previous calendar year’s sample. If the priority pollutant scan is to be used to satisfy part I.B.8, the scan must be submitted with the 3rd quarter bioassay by

PART I Permit No. RI0000191 Page 15 of 23
Kenyon 2021 Public Notice Draft Permit
October 15th. All sampling and analysis shall be done in accordance with EPA Regulations, including 40 CFR, Part 136; grab and composite samples shall be taken as appropriate.
16. This permit serves as the State's Water Quality Certificate for the discharges described
herein. 17. The permittee is not authorized to use chemical additives in the cooling water. The
permittee shall obtain Department approval before the use of any additive(s) in the cooling water.
18. The permittee shall record the production of the facility as regulated under 40 CFR, Part
910.42/410.43 (b), (c), and (d) monthly through inventory control calculations. The data shall be summarized and reported annually by January 15th of the following year.
19. The permittee shall install a flowmeter, with a totalizer, for measuring the amount of water
discharged from under the floor of the greige room (Outfall 004) and submit a report identifying the type of meter installed and the date installation was complete to the DEM within one (1) year from the effective date of this permit.
20. Within three (3) years of the effective date of this permit, the permittee shall submit to the
DEM an Engineering Report evaluating the permittee’s ability to remove Total Phosphorus and Total Nitrogen from its effluent to the maximum extent practicable using existing equipment and/or chemical addition. At minimum, the Engineering Report shall consider:
a. The equipment available at the facility which can be used to remove nitrogen (e.g., through cycling of aeration and/or creating anoxic zones) and phosphorus (e.g., through dosing chemicals); b. The extent to which chemicals can be dosed while meeting all other effluent limitations;
c. Alternative chemicals available to the permittee for phosphorus removal and the feasibility of using these chemicals in existing treatment processes; d. The extent to which the existing treatment equipment/processes could be modified to increase nitrogen and phosphorus removal, and; e. The technical and economic factors associated with:
i. any facility upgrades required; ii. procurement and long-term storage of chemicals; iii. energy required; iv. impacts on sludge generation and disposal.
The Engineering Report shall be subject to DEM review and approval. Any deficiency in the report will be identified by the DEM in writing and appropriate revisions to the Engineering Report shall be submitted to the DEM within thirty (30) days of notice of the deficiency, unless a longer timeframe is specified.
B. BIOMONITORING REQUIREMENTS AND INTERPRETATION OF RESULTS 1. General Beginning on the effective date of the permit, the permittee shall perform eight (8) acute
toxicity tests per year on samples collected from discharge outfall 001A. The permittee shall conduct the tests during dry weather periods (no rain within 48 hours prior to or during sampling unless approved by RIDEM) according to the following test frequency and

PART I Permit No. RI0000191 Page 16 of 23
Kenyon 2021 Public Notice Draft Permit
protocols. Acute toxicity data shall be reported as outlined in Part I.B.9. The State may require additional screening, range finding, definitive acute or chronic bioassays as deemed necessary based on the results of the initial bioassays required herein. Indications of toxicity could result in requiring a Toxicity Reduction Evaluation (TRE) to investigate the causes and to identify corrective actions necessary to eliminate or reduce toxicity to an acceptable level.
2. Test Frequency For four (4) sampling events, (one each calendar quarter) the permittee will conduct 48
hour acute definitive toxicity tests on the two species listed below, for a total of eight acute toxicity tests per year. This requirement entails performing two-species testing as follows:
Species Test Type Frequency Two Species Test (Four Times Annually) Daphnids Definitive 48-Hour Quarterly (Ceriodaphnia dubia) Acute Static (LC50) OR (Daphnia pulex) Fathead Minnows Definitive 48-Hour Quarterly (Pimephales promelas) Acute Static (LC50)
A sampling event is defined as three 24-hour composites collected over the seven-day test period (see Part I.B.4).
3. Testing Methods
Toxicity testing shall be conducted in accordance with the protocols listed in 40 CFR Part 136.
4. Sample Collection For each sampling event a 24-hour flow proportioned composite final effluent sample shall
be collected during a dry weather (no rain 48 hours prior to or during sampling unless approved by RIDEM). For each sampling event, the effluent samples shall be collected on days 0, 3 and 5 of the 7-day exposure period. The first sample is used for test initiation, Day 1, and for test solution renewal on Day 2. The second sample would be used for test solution renewal on Days 3 and 4. The third sample would be used for test solution renewal on Days 5, 6 and 7.
To eliminate the problem of potential rainfall interference during the five-day sampling
period for the chronic tests, the permittee shall collect enough sample on Day 0 to properly store and use one-third on both Days 3 and 5 if rain has occurred since Day 0. In addition, if no rainfall has occurred since Day 3, enough sample shall also be collected on Day 3 to use for Day 5 if necessary.
In the laboratory, the initial sample (Day 0) will be split into two (2) subsamples, after
thorough mixing, for the following: A: Chemical Analysis B: Acute Toxicity Testing

PART I Permit No. RI0000191 Page 17 of 23
Kenyon 2021 Public Notice Draft Permit
Day 3 and 5 samples will be held until test completion. If either the Day 3 or 5 renewal sample is of sufficient potency to cause lethality to 50% or more test organisms in any of the dilutions for either species, then a chemical analysis shall be performed on the appropriate sample(s) as well.
All samples held overnight shall be refrigerated at 4oC. 5. Dilution Water Dilution water used for freshwater acute toxicity analyses should be of sufficient quality to
meet minimum acceptability of test results (see parts I.B.6 and I.B.7). For both species, natural freshwater shall be used as the dilution water. This water shall be collected from the Wood River at the Skunk Hill Road Bridge. If this natural freshwater diluent is found to be, or suspected to be toxic or unreliable, an alternate or laboratory source of water of known quality with a hardness and pH similar to that of the receiving water may be substituted AFTER RECEIVING WRITTEN APPROVAL FROM RIDEM.
6. Effluent Toxicity Test Conditions for the Daphnids (Ceriodaphnia dubia and Daphnia pulex)1
Test conditions are required to be complaint with 40 CFR 136 using the following efflluent concentrations:
Six (6) dilutions plus a control: 100%, 85%, 75%, 50%, 25%, 12.5%, and 0% effluent. 7. Effluent Toxicity Conditions for the Fathead Minnow (Pimephales promelas)1
Test conditions are required to be complaint with 40 CFR 136 using the following efflluent concentrations:
Six (6) dilutions plus a control: 100%, 85%, 75%, 55%, 25%, 12.5%, and 0% effluent. 8. Chemical Analysis The following chemical analysis shall be performed for every two-species sampling event. Saline Detection Parameter Effluent Diluent Limit (mg/l) Hardness X X 0.5 Alkalinity X X 2.0 pH X X --- Specific Conductance X X --- Total Solids and Suspended X X --- Solids Ammonia X X 0.1 Total Organic Carbon X 0.5 Total Phenols X 0.05
PART I Permit No. RI0000191 Page 18 of 23
Kenyon 2021 Public Notice Draft Permit
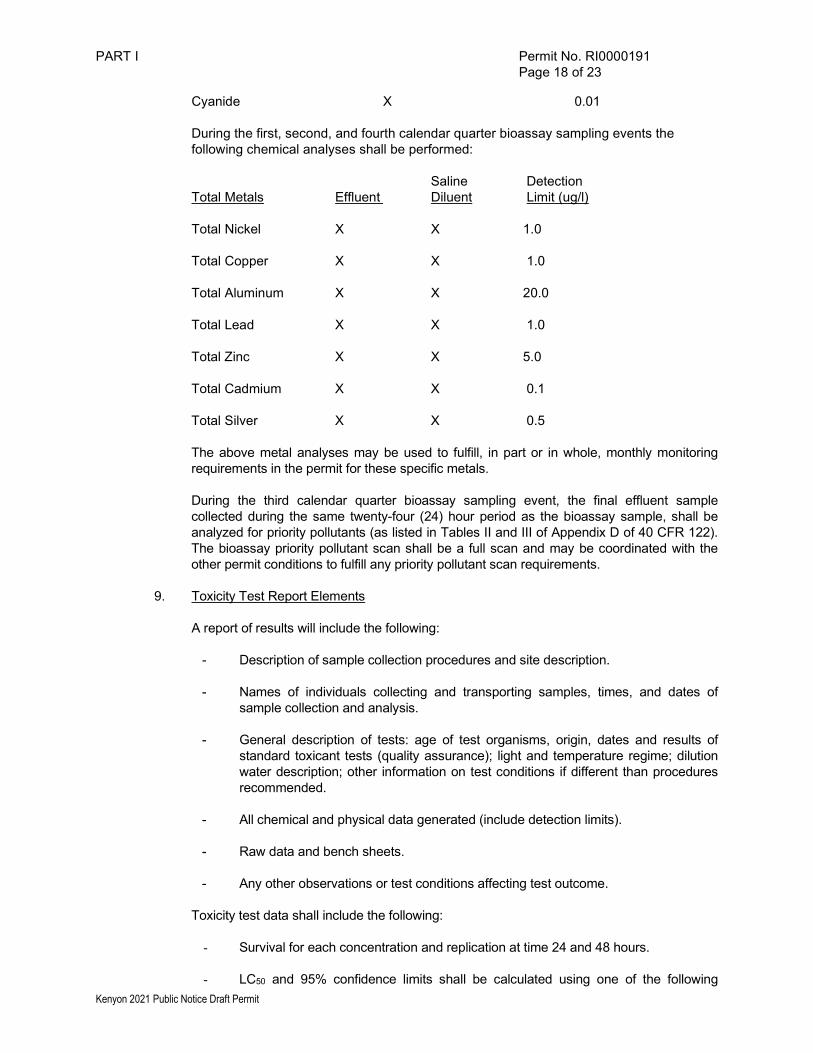
Cyanide X 0.01 During the first, second, and fourth calendar quarter bioassay sampling events the
following chemical analyses shall be performed: Saline Detection Total Metals Effluent Diluent Limit (ug/l) Total Nickel X X 1.0 Total Copper X X 1.0 Total Aluminum X X 20.0 Total Lead X X 1.0 Total Zinc X X 5.0 Total Cadmium X X 0.1 Total Silver X X 0.5 The above metal analyses may be used to fulfill, in part or in whole, monthly monitoring
requirements in the permit for these specific metals. During the third calendar quarter bioassay sampling event, the final effluent sample
collected during the same twenty-four (24) hour period as the bioassay sample, shall be analyzed for priority pollutants (as listed in Tables II and III of Appendix D of 40 CFR 122). The bioassay priority pollutant scan shall be a full scan and may be coordinated with the other permit conditions to fulfill any priority pollutant scan requirements.
9. Toxicity Test Report Elements A report of results will include the following: - Description of sample collection procedures and site description. - Names of individuals collecting and transporting samples, times, and dates of
sample collection and analysis. - General description of tests: age of test organisms, origin, dates and results of
standard toxicant tests (quality assurance); light and temperature regime; dilution water description; other information on test conditions if different than procedures recommended.
- All chemical and physical data generated (include detection limits). - Raw data and bench sheets. - Any other observations or test conditions affecting test outcome. Toxicity test data shall include the following:
- Survival for each concentration and replication at time 24 and 48 hours.
- LC50 and 95% confidence limits shall be calculated using one of the following

PART I Permit No. RI0000191 Page 19 of 23
Kenyon 2021 Public Notice Draft Permit
methods in order of preference: Probit, Trimmed Spearman Karber, Moving Average Angle, or the graphical method. All printouts (along with the name of the program, the date, and the author(s)) and graphical displays must be submitted. When data is analyzed by hand, worksheets should be submitted. The report shall also include the No Observed Acute Effect Level (NOAEL) which is defined as the highest concentration of the effluent (in % effluent) in which 90% or more of the test animals survive.
- The Probit, Trimmed Spearman Karber, and Moving Average Angle methods of
analyses can only be used when mortality of some of the test organisms are observed in at least two (2) of the (percent effluent) concentrations tested (i.e., partial mortality). If a test results in a 100% survival and 100% mortality in adjacent treatments ("all or nothing" effect), an LC50 may be estimated using the graphical method.
10. Reporting of Bioassay Testing Bioassay Testing shall be reported as follows: Quarter Testing Report Due Results Submitted to be Performed No Later Than on DMR for January 1 - March 31 April 15 March April 1 - June 30 July 15 June July 1 - September 30 October 15 September October 1 - December 31 January 15 December Bioassay testing following the protocol described herein shall commence during the first
quarter after the effective date of this permit. A signed copy of these, and all other reports required herein, shall be submitted
electronically in accordance with Part I.E.2.b. C. OPERATION AND MAINTENANCE Operation and maintenance of the treatment system shall be in compliance with the General
Requirements of Part II and the following terms and conditions: 1. Maintenance Staff The permittee shall provide an adequate staff to carry out the operation, maintenance,
repair, and testing functions required to ensure compliance with the terms and conditions of this permit.
2. Sludge The permittee shall conform and adhere to all conditions, practices and regulations as
contained in the State of Rhode Island Solid Waste Management Facilities and Organic Waste Management Facilities (250-RICR-140-05-1).
D. DETECTION LIMITS The permittee shall assure that all wastewater testing required by this permit, is performed in
conformance with the method detection limits listed below, and the following terms and conditions:
1. All analyses of parameters under this permit must comply with the National Pollutant Discharge

PART I Permit No. RI0000191 Page 20 of 23
Kenyon 2021 Public Notice Draft Permit
Elimination System (NPDES): Use of Sufficiently Sensitive Test Methods for Permit Applications and Reporting rule. Only sufficiently sensitive test methods may be used for analyses of parameters under this permit. The permittee shall assure that all testing required by this permit is performed in accordance with 40 CFR Part 136, EPA approved analysis techniques, quality assurance procedures and quality control procedures shall be followed for all reports required to be submitted under the Rhode Island Pollutant Discharge Elimination System (RIPDES) program. These procedures are described in "Methods for the Determination of Metals in Environmental Samples" (EPA/600/4-91/010) and "Methods for Chemical Analysis of Water and Wastes" (EPA/600/4-79/020).
If after conducting the complete Method of Standard Additions analysis, the laboratory is unable to determine a valid result, the laboratory shall report “could not be analyzed”. Documentation supporting this claim shall be maintained onsite. If valid analytical results are repeatedly unobtainable, DEM may require that the permittee determine a method detection limit (MDL) for their effluent or sludge as outlined in 40 CFR Part 136, Appendix B.
2. When calculating sample averages for reporting on discharge monitoring reports (DMRs): a. “could not be analyzed” data shall be excluded and shall not be considered as a failure to
comply with the permit sampling requirements.
b. Results reported as less than the MDL shall be reported as zeros in accordance with the DEM’s DMR Instructions.
Therefore, all sample results shall be reported as: an actual value, “could not be analyzed”, or zero. The effluent or sludge specific MDL must be calculated using the methods outlined in 40 CFR Part 136, Appendix B. Samples which have been diluted to ensure that the sample concentration will be within the linear dynamic range shall not be diluted to the extent that the analyte is not detected. If this should occur the analysis shall be repeated using a lower degree of dilution.

PART I Permit No. RI0000191 Page 21 of 23
Kenyon 2021 Public Notice Draft Permit
LIST OF TOXIC POLLUTANTS The following list of toxic pollutants has been designated pursuant to Section 307(a)(1) of the Clean Water Act. The Method Detection Limits (MDLs) represent the required Rhode Island MDLs. Volatiles - EPA Method 624 MDL ug/l (ppb) 1V acrolein 10.0 2V acrylonitrile 5.0 3V benzene 1.0 5V bromoform 1.0 6V carbon tetrachloride 1.0 7V chlorobenzene 1.0 8V chlorodibromomethane 1.0 9V chloroethane 1.0 10V 2-chloroethylvinyl ether 5.0 11V chloroform 1.0 12V dichlorobromomethane 1.0 14V 1,1-dichloroethane 1.0 15V 1,2-dichloroethane 1.0 16V 1,1-dichloroethylene 1.0 17V 1,2-dichloropropane 1.0 18V 1,3-dichloropropylene 1.0 19V ethylbenzene 1.0 20V methyl bromide 1.0 21V methyl chloride 1.0 22V methylene chloride 1.0 23V 1,1,2,2-tetrachloroethane 1.0 24V tetrachloroethylene 1.0 25V toluene 1.0 26V 1,2-trans-dichloroethylene 1.0 27V 1,1,1-trichloroethane 1.0 28V 1,1,2-trichloroethane 1.0 29V trichloroethylene 1.0 31V vinyl chloride 1.0 Acid Compounds - EPA Method 625 MDL ug/l (ppb) 1A 2-chlorophenol 1.0 2A 2,4-dichlorophenol 1.0 3A 2,4-dimethylphenol 1.0 4A 4,6-dinitro-o-cresol 1.0 5A 2,4-dinitrophenol 2.0 6A 2-nitrophenol 1.0 7A 4-nitrophenol 1.0 8A p-chloro-m-cresol 2.0 9A pentachlorophenol 1.0 10A phenol 1.0 11A 2,4,6-trichlorophenol 1.0 Pesticides - EPA Method 608 MDL ug/l (ppb) 1P aldrin 0.059 2P alpha-BHC 0.058 3P beta-BHC 0.043 4P gamma-BHC 0.048 5P delta-BHC 0.034 6P chlordane 0.211 7P 4,4'-DDT 0.251 8P 4,4'-DDE 0.049 9P 4,4'-DDD 0.139 10P dieldrin 0.082 11P alpha-endosulfan 0.031 12P beta-endosulfan 0.036 13P endosulfan sulfate 0.109 14P endrin 0.050 15P endrin aldehyde 0.062 16P heptachlor 0.029
17P heptachlor epoxide 0.040 Pesticides - EPA Method 608 MDL ug/l (ppb) 18P PCB-1242 0.289 19P PCB-1254 0.298 20P PCB-1221 0.723 21P PCB-1232 0.387 22P PCB-1248 0.283 23P PCB-1260 0.222 24P PCB-1016 0.494 25P toxaphene 1.670 Base/Neutral - EPA Method 625 MDL ug/l (ppb) 1B acenaphthene * 1.0 2B acenaphthylene * 1.0 3B anthracene * 1.0 4B benzidine 4.0 5B benzo(a)anthracene * 2.0 6B benzo(a)pyrene * 2.0 7B 3,4-benzofluoranthene * 1.0 8B benzo(ghi)perylene * 2.0 9B benzo(k)fluoranthene * 2.0 10B bis(2-chloroethoxy)methane 2.0 11B bis(2-chloroethyl)ether 1.0 12B bis(2-chloroisopropyl)ether 1.0 13B bis(2-ethylhexyl)phthalate 1.0 14B 4-bromophenyl phenyl ether 1.0 15B butylbenzyl phthalate 1.0 16B 2-chloronaphthalene 1.0 17B 4-chlorophenyl phenyl ether 1.0 18B chrysene * 1.0 19B dibenzo (a,h)anthracene * 2.0 20B 1,2-dichlorobenzene 1.0 21B 1,3-dichlorobenzene 1.0 22B 1,4-dichlorobenzene 1.0 23B 3,3'-dichlorobenzidine 2.0 24B diethyl phthalate 1.0 25B dimethyl phthalate 1.0 26B di-n-butyl phthalate 1.0 27B 2,4-dinitrotoluene 2.0 28B 2,6-dinitrotoluene 2.0 29B di-n-octyl phthalate 1.0 30B 1,2-diphenylhydrazine 1.0 (as azobenzene) 31B fluoranthene * 1.0 32B fluorene * 1.0 33B hexachlorobenzene 1.0 34B hexachlorobutadiene 1.0 35B hexachlorocyclopentadiene 2.0 36B hexachloroethane 1.0 37B indeno(1,2,3-cd)pyrene * 2.0 38B isophorone 1.0 39B naphthalene * 1.0 40B nitrobenzene 1.0 41B N-nitrosodimethylamine 1.0 42B N-nitrosodi-n-propylamine 1.0 43B N-nitrosodiphenylamine 1.0 44B phenanthrene * 1.0 45B pyrene * 1.0 46B 1,2,4-trichlorobenzene 1.0

PART I Permit No. RI0000191 Page 22 of 23
Kenyon 2021 Public Notice Draft Permit
OTHER TOXIC POLLUTANTS MDL ug/l (ppb) Antimony, Total 3.0 Arsenic, Total 1.0 Beryllium, Total 0.2 Cadmium, Total 0.1 Chromium, Total 1.0 Chromium, Hexavalent 20.0 Copper, Total 1.0 Lead, Total 1.0
Mercury, Total 0.2 Nickel, Total 1.0 Selenium, Total 2.0 Silver, Total 0.5 Thallium, Total 1.0 Zinc, Total 5.0 Asbestos ** Cyanide, Total 10.0 Phenols, Total 50.0 TCDD ** MTBE (Methyl Tert Butyl Ether) 1.0 Aluminum, Total 20.0 * Polynuclear Aromatic Hydrocarbons ** No Rhode Island Department of Environmental Management (RIDEM) MDL NOTE: The MDL for a given analyte may vary with the type of sample. MDLs which are determined in reagent water may be lower than those determined in wastewater due to fewer matrix interferences. Wastewater is variable in composition and may therefore contain substances (interferents) that could affect MDLs for some analytes of interest. Variability in instrument performance can also lead to inconsistencies in determinations of MDLs. To help verify the absence of matrix or chemical interference the analyst is required to complete specific quality control procedures. For the metals analyses listed above the analyst must withdraw from the sample two equal aliquots; to one aliquot add a known amount of analyte, and then dilute both to the same volume and analyze. The unspiked aliquot multiplied by the dilution factor should be compared to the original. Agreement of the results within 10% indicates the absence of interference. Comparison of the actual signal from the spiked aliquot to the expected response from the analyte in an aqueous standard should help confirm the finding from the dilution analysis. (Methods for Chemical Analysis of Water and Wastes EPA-600/4-79/020). For Methods 624 and 625 the laboratory must on an ongoing basis, spike at least 5% of the samples from each sample site being monitored. For laboratories analyzing 1 to 20 samples per month, at least one spiked sample per month is required. The spike should be at the discharge permit limit or 1 to 5 times higher than the background concentration determined in Section 8.3.2, whichever concentration would be larger. (40 CFR Part 136 Appendix B Method 624 and 625 subparts 8.3.1 and 8.3.11).

PART I Permit No. RI0000191 Page 23 of 23
Kenyon 2021 Public Notice Draft Permit
E. MONITORING AND REPORTING
1. Monitoring
All monitoring required by this permit shall be done in accordance with sampling and analytical testing procedures specified in Federal Regulations (40 CFR Part 136).
2. Submittal of DMRs Using NetDMR
a. The Permittee shall continue to submit its monthly monitoring data via
Discharge Monitoring Reports (DMRs) to DEM no later than the 15th day of the month electronically using NetDMR. When the permittee submits DMRs using NetDMR, it is not required to submit hard copies of DMRs to DEM.
b. Submittal of Reports as NetDMR Attachments
Unless otherwise specified in this permit, the permittee must submit electronic copies of documents in NetDMR that are directly related to the DMR. These include the following:
• DMR Cover Letters • Below Detection Limit summary tables • Analytical Data Summary Tables • Bioassay Reports
c. Submittal of Reports in Hard Copy Form
The following notifications and reports shall be submitted as hard copy with a cover letter describing the submission. These reports shall be signed and dated originals submitted to DEM.
• Written notifications required under Part II • Notice of unauthorized discharges • Priority Pollutant Scan results for Outfall 001A • Annual Production Reports (See Part I.A.18) • Flowmeter Installation Report (See Part I.A.19) • Phosphorus/Nitrogen Removal Engineering Report (See Part
I.A.20) This information shall be submitted to DEM at the following address:
Rhodes Island Department of Environmental Management RIPDES Program
235 Promenade Street Providence, Rhode Island 02908
d. Verbal Reports and Verbal Notifications
Any verbal reports or verbal notifications, if required in Parts I and/or II of this permit, shall be made to the DEM. This includes verbal reports and notifications which require reporting within 24 hours. (See Part II(l)(5) General Requirements for 24-hour reporting) verbal reports and verbal notifications shall be made to DEM at (401) 222-4700 or (401) 222-3070 at night.

Page 1 of 10
PART II
TABLE OF CONTENTS
GENERAL REQUIREMENTS
(a) Duty to Comply
(b) Duty to Reapply
(c) Need to Halt or Reduce Not a Defense
(d) Duty to Mitigate
(e) Proper Operation and Maintenance
(f) Permit Actions
(g) Property Rights
(h) Duty to Provide Information
(i) Inspection and Entry
(j) Monitoring and Records
(k) Signatory Requirements
(l) Reporting Requirements
(m) Bypass
(n) Upset
(o) Change in Discharge
(p) Removed Substances
(q) Power Failures
(r) Availability of Reports
(s) State Laws
(t) Other Laws
(u) Severability
(v) Reopener Clause
(w) Confidentiality of Information
(x) Best Management Practices
(y) Right of Appeal
DEFINITIONS
Revised 1/28/20

Page 2 of 10
GENERAL REQUIREMENTS
(a) Duty to Comply
The permittee must comply with all conditions of this permit. Any permit noncompliance
constitutes a violation of Chapter 46-12 of the Rhode Island General Laws and the Clean Water
Act (CWA) and is grounds for enforcement action; for permit termination, revocation and
reissuance, or modification; or for denial of a permit renewal application.
(1) The permittee shall comply with effluent standards or prohibitions established under
Section 307(a) of the CWA for toxic pollutants within the time provided in the regulations
that establish these standards or prohibitions, even if the permit has not yet been modified
to incorporate the requirement.
(2) The CWA provides that any person who violates a permit condition implementing
Sections 301, 302, 306, 307, 308, 318, or 405 of the CWA is subject to a civil penalty not
to exceed $10,000 per day of such violation. Any person who willfully or negligently
violates permit conditions implementing Sections 301, 302, 306, 307 or 308 of the Act is
subject to a fine of not less than $2,500 nor more than $25,000 per day of violation, or by
imprisonment of not more than 1 year, or both.
(3) Chapter 46-12 of the Rhode Island General Laws provides that any person who violates a
permit condition is subject to a civil penalty of not more than $5,000 per day of such
violation. Any person who willfully or negligently violates a permit condition is subject
to a criminal penalty of not more than $10,000 per day of such violation and
imprisonment for not more than 30 days, or both. Any person who knowingly makes any
false statement in connection with the permit is subject to a criminal penalty of not more
than $5,000 for each instance of violation or by imprisonment for not more than 30 days,
or both.
(b) Duty to Reapply
If the permittee wishes to continue an activity regulated by this permit after the expiration date
of this permit, the permittee must apply for and obtain a new permit. The permittee shall submit
a new application at least 180 days before the expiration date of the existing permit, unless
permission for a later date has been granted by the Director. (The Director shall not grant
permission for applications to be submitted later than the expiration date of the existing permit.)
(c) Need to Halt or Reduce Not a Defense
It shall not be a defense for a permittee in an enforcement action that it would have been
necessary to halt or reduce the permitted activity in order to maintain compliance with the
conditions of this permit.
(d) Duty to Mitigate
The permittee shall take all reasonable steps to minimize or prevent any discharge in violation of
this permit which has a reasonable likelihood of adversely affecting human health or the
environment.

Page 3 of 10
(e) Proper Operation and Maintenance
The permittee shall at all times properly operate and maintain all facilities and systems of
treatment and control (and related appurtenances) which are installed or used by the permittee to
achieve compliance with the conditions of this permit. Proper operation and maintenance also
includes adequate laboratory controls and appropriate quality assurance procedures, and, where
applicable, compliance with DEM "Rules and Regulations Pertaining to the Operation and
Maintenance of Wastewater Treatment Facilities" and "Rules and Regulations Pertaining to the
Disposal and Utilization of Wastewater Treatment Facility Sludge." This provision requires the
operation of back-up or auxiliary facilities or similar systems only when the operation is
necessary to achieve compliance with the conditions of the permit.
(f) Permit Actions
This permit may be modified, revoked and reissued, or terminated for cause, including but not
limited to: (1) Violation of any terms or conditions of this permit; (2) Obtaining this permit by
misrepresentation or failure to disclose all relevant facts; or (3) A change in any conditions that
requires either a temporary or permanent reduction or elimination of the authorized discharge.
The filing of a request by the permittee for a permit modification, revocation and reissuance, or
termination or a notification of planned changes or anticipated noncompliance, does not stay any
permit condition.
(g) Property Rights
This permit does not convey any property rights of any sort, or any exclusive privilege.
(h) Duty to Provide Information
The permittee shall furnish to the Director, within a reasonable time, any information which the
Director may request to determine whether cause exists for modifying, revoking and reissuing,
or terminating this permit, or to determine compliance with this permit. The permittee shall also
furnish to the Director, upon request, copies of records required to be kept by this permit.
(i) Inspection and Entry
The permittee shall allow the Director, or an authorized representative, upon the presentation of
credentials and other documents as may be required by law, to:
(1) Enter upon the permittee's premises where a regulated facility or activity is located or
conducted, or where records must be kept under the conditions of this permit;
(2) Have access to and copy, at reasonable times any records that must be kept under the
conditions of this permit;
(3) Inspect at reasonable times any facilities, equipment (including monitoring and control
equipment), practices or operations regulated or required under this permit; and

Page 4 of 10
(4) Sample or monitor any substances or parameters at any location, at reasonable times, for
the purposes of assuring permit compliance or as otherwise authorized by the CWA or
Rhode Island law.
(j) Monitoring and Records
(1) Samples and measurements taken for the purpose of monitoring shall be representative of
the volume and nature of the discharge over the sampling and reporting period.
(2) The permittee shall retain records of all monitoring information, including all calibration
and maintenance records and all original strip chart recordings from continuous
monitoring instrumentation, copies of all reports required by this permit, and records of
all data used to complete the application for this permit, for a period of at least 5 years
from the date of the sample, measurement, report or application. This period may be
extended by request of the Director at any time.
(3) Records of monitoring information shall include:
(i) The date, exact place, and time of sampling or measurements;
(ii) The individual(s) who performed the sampling or measurements;
(iii) The date(s) analyses were performed;
(iv) The individual(s) who performed the analyses;
(v) The analytical techniques or methods used; and
(vi) The results of such analyses.
(4) Monitoring must be conducted according to test procedures approved under 40 CFR Part
136 and applicable Rhode Island regulations, unless other test procedures have been
specified in this permit.
(5) The CWA provides that any person who falsifies, tampers with, or knowingly renders
inaccurate, any monitoring device or method required to be maintained under this permit
shall upon conviction, be punished by a fine of not more than $10,000 per violation or by
imprisonment for not more than 6 months per violation or by both. Chapter 46-12 of the
Rhode Island General Laws also provides that such acts are subject to a fine of not more
than $5,000 per violation, or by imprisonment for not more than 30 days per violation, or
by both.
(6) Monitoring results must be reported on a Discharge Monitoring Report (DMR).
(7) If the permittee monitors any pollutant more frequently than required by the permit, using
test procedures approved under 40 CFR Part 136, applicable State regulations, or as
specified in the permit, the results of this monitoring shall be included in the calculation
and reporting of the data submitted in the DMR.

Page 5 of 10
(k) Signatory Requirement
All applications, reports, or information submitted to the Director shall be signed and certified in
accordance with 250-RICR-150-10-1.12 of the Rhode Island Pollutant Discharge Elimination
System (RIPDES) Regulations. Rhode Island General Laws, Chapter 46-12 provides that any
person who knowingly makes any false statement, representation, or certification in any record
or other document submitted or required to be maintained under this permit, including
monitoring reports or reports of compliance or noncompliance shall, upon conviction, be
punished by a fine of not more than $5,000 per violation, or by imprisonment for not more than
30 days per violation, or by both.
(l) Reporting Requirements
(1) Planned changes. The permittee shall give notice to the Director as soon as possible of
any planned physical alterations or additions to the permitted facility.
(2) Anticipated noncompliance. The permittee shall give advance notice to the Director of
any planned changes in the permitted facility or activity which may result in
noncompliance with the permit requirements.
(3) Transfers. This permit is not transferable to any person except after written notice to the
Director. The Director may require modification or revocation and reissuance of the
permit to change the name of the permittee and incorporate such other requirements as
may be necessary under State and Federal law.
(4) Monitoring reports. Monitoring results shall be reported at the intervals specified
elsewhere in this permit.
(5) Twenty-four hour reporting. The permittee shall immediately report any noncompliance
which may endanger health or the environment by calling DEM at (401) 222-4700 or
(401) 222-3070 at night.
A written submission shall also be provided within five (5) days of the time the permittee
becomes aware of the circumstances. The written submission shall contain a description
of the noncompliance and its cause; the period of noncompliance, including exact dates
and times, and if the noncompliance has not been corrected, the anticipated time it is
expected to continue; and steps taken or planned to reduce, eliminate, and prevent
reoccurrence of the noncompliance.
The following information must be reported immediately:
(i) Any unanticipated bypass which causes a violation of any effluent limitation in the
permit; or
(ii) Any upset which causes a violation of any effluent limitation in the permit; or
(iii) Any violation of a maximum daily discharge limitation for any of the pollutants
specifically listed by the Director in the permit.
The Director may waive the written report on a case-by-case basis if the oral report has
been received within 24 hours.

Page 6 of 10
(6) Other noncompliance. The permittee shall report all instances of noncompliance not
reported under paragraphs (1), (2), and (5), of this section, at the time monitoring reports
are submitted. The reports shall contain the information required in paragraph (l)(5) of
the section.
(7) Other information. Where the permittee becomes aware that it failed to submit any
relevant facts in a permit application, or submitted incorrect information in a permit
application or in any report to the Director, they shall promptly submit such facts or
information.
(m) Bypass
"Bypass" means the intentional diversion of waste streams from any portion of a treatment
facility.
(1) Bypass not exceeding limitations. The permittee may allow any bypass to occur which
does not cause effluent limitations to be exceeded, but only if it also is for essential
maintenance to assure efficient operation. These bypasses are not subject to the
provisions of paragraphs (2) and (3) of this section.
(2) Notice.
(i) Anticipated bypass. If the permittee knows in advance of the need for a bypass, it
shall submit prior notice, if possible at least ten (10) days before the date of the
bypass.
(ii) Unanticipated bypass. The permittee shall submit notice of an unanticipated
bypass as required in 250-RICR-150-10-1.14(R) of the RIPDES Regulations.
(3) Prohibition of bypass.
(i) Bypass is prohibited, and the Director may take enforcement action against a
permittee for bypass, unless:
(A) Bypass was unavoidable to prevent loss of life, personal injury, or severe
property damage, where "severe property damage" means substantial
physical damage to property, damage to the treatment facilities which causes
them to become inoperable, or substantial and permanent loss of natural
resources which can reasonably be expected to occur in the absence of a
bypass. Severe property damage does not mean economic loss caused by
delays in production;
(B) There were no feasible alternatives to the bypass, such as the use of auxiliary
treatment facilities, retention of untreated wastes, or maintenance during
normal periods of equipment downtime. This condition is not satisfied if
adequate backup equipment should have been installed in the exercise of
reasonable engineering judgment to prevent a bypass which occurred during
normal periods of equipment downtime or preventive maintenance; and
(C) The permittee submitted notices as required under paragraph (2) of this
section.
Page 7 of 10
(ii) The Director may approve an anticipated bypass, after considering its adverse
effects, if the Director determines that it will meet the three conditions listed above
in paragraph (3)(i) of this section.
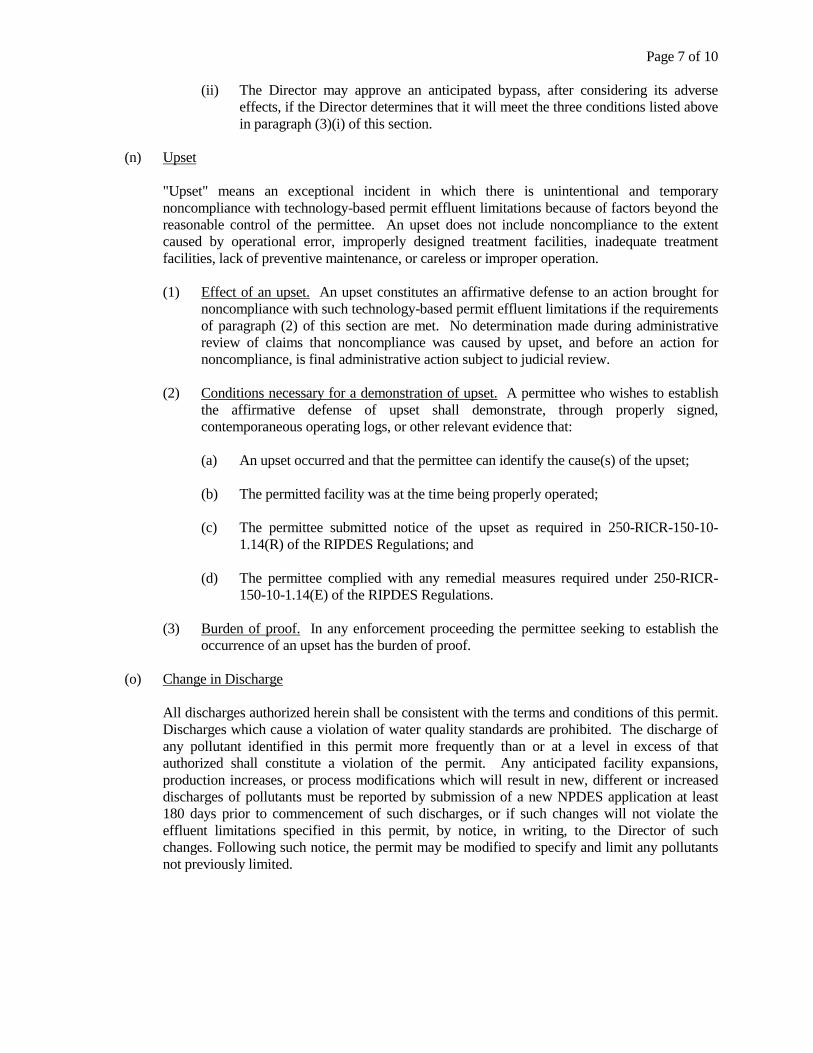
(n) Upset
"Upset" means an exceptional incident in which there is unintentional and temporary
noncompliance with technology-based permit effluent limitations because of factors beyond the
reasonable control of the permittee. An upset does not include noncompliance to the extent
caused by operational error, improperly designed treatment facilities, inadequate treatment
facilities, lack of preventive maintenance, or careless or improper operation.
(1) Effect of an upset. An upset constitutes an affirmative defense to an action brought for
noncompliance with such technology-based permit effluent limitations if the requirements
of paragraph (2) of this section are met. No determination made during administrative
review of claims that noncompliance was caused by upset, and before an action for
noncompliance, is final administrative action subject to judicial review.
(2) Conditions necessary for a demonstration of upset. A permittee who wishes to establish
the affirmative defense of upset shall demonstrate, through properly signed,
contemporaneous operating logs, or other relevant evidence that:
(a) An upset occurred and that the permittee can identify the cause(s) of the upset;
(b) The permitted facility was at the time being properly operated;
(c) The permittee submitted notice of the upset as required in 250-RICR-150-10-
1.14(R) of the RIPDES Regulations; and
(d) The permittee complied with any remedial measures required under 250-RICR-
150-10-1.14(E) of the RIPDES Regulations.
(3) Burden of proof. In any enforcement proceeding the permittee seeking to establish the
occurrence of an upset has the burden of proof.
(o) Change in Discharge
All discharges authorized herein shall be consistent with the terms and conditions of this permit.
Discharges which cause a violation of water quality standards are prohibited. The discharge of
any pollutant identified in this permit more frequently than or at a level in excess of that
authorized shall constitute a violation of the permit. Any anticipated facility expansions,
production increases, or process modifications which will result in new, different or increased
discharges of pollutants must be reported by submission of a new NPDES application at least
180 days prior to commencement of such discharges, or if such changes will not violate the
effluent limitations specified in this permit, by notice, in writing, to the Director of such
changes. Following such notice, the permit may be modified to specify and limit any pollutants
not previously limited.

Page 8 of 10
Until such modification is effective, any new or increased discharge in excess of permit limits or
not specifically authorized by the permit constitutes a violation.
(p) Removed Substances
Solids, sludges, filter backwash, or other pollutants removed in the course of treatment or control
of wastewaters shall be disposed of in a manner consistent with applicable Federal and State
laws and regulations including, but not limited to the CWA and the Federal Resource
Conservation and Recovery Act, 42 U.S.C. §§6901 et seq., Rhode Island General Laws,
Chapters 46-12, 23-19.1 and regulations promulgated thereunder.
(q) Power Failures
In order to maintain compliance with the effluent limitation and prohibitions of this permit, the
permittee shall either:
In accordance with the Schedule of Compliance contained in Part I, provide
an alternative power source sufficient to operate the wastewater control
facilities;
or if such alternative power source is not in existence, and no date for its implementation appears
in Part I,
Halt reduce or otherwise control production and/or all discharges upon the
reduction, loss, or failure of the primary source of power to the wastewater
control facilities.
(r) Availability of Reports
Except for data determined to be confidential under paragraph (w) below, all reports prepared in
accordance with the terms of this permit shall be available for public inspection at the DEM, 235
Promenade Street, Providence, Rhode Island 02908. As required by the CWA, effluent data
shall not be considered confidential. Knowingly making any false statement on any such report
may result in the imposition of criminal penalties as provided for in Section 309 of the CWA
and under Section 46-12-14 of the Rhode Island General Laws.
(s) State Laws
Nothing in this permit shall be construed to preclude the institution of any legal action or relieve
the permittee from any responsibilities, liabilities, or penalties established pursuant to any
applicable State law.
(t) Other Laws
The issuance of a permit does not authorize any injury to persons or property or invasion of
other private rights, nor does it relieve the permittee of its obligation to comply with any other
applicable Federal, State, and local laws and regulations.

Page 9 of 10
(u) Severability
The provisions of this permit are severable, and if any provision of this permit, or the application
of any provision of this permit to any circumstance, is held invalid, the application of such
provision to other circumstances, and the remainder of this permit, shall not be affected thereby.
(v) Reopener Clause
The Director reserves the right to make appropriate revisions to this permit in order to
incorporate any appropriate effluent limitations, schedules of compliance, or other provisions
which may be authorized under the CWA or State law. In accordance with 250-RICR-150-10-
1.16 and 250-RICR-150-10-1.24 of the RIPDES Regulations, if any effluent standard or
prohibition, or water quality standard is promulgated under the CWA or under State law which
is more stringent than any limitation on the pollutant in the permit, or controls a pollutant not
limited in the permit, then the Director may promptly reopen the permit and modify or revoke
and reissue the permit to conform to the applicable standard.
(w) Confidentiality of Information
(1) Any information submitted to DEM pursuant to these regulations may be claimed as
confidential by the submitter. Any such claim must be asserted at the time of submission
in the manner prescribed on the application form or instructions or, in the case of other
submissions, by stamping the words "confidential business information" on each page
containing such information. If no claim is made at the time of submission, DEM may
make the information available to the pubic without further notice.
(2) Claims of confidentiality for the following information will be denied:
(i) The name and address of any permit applicant or permittee;
(ii) Permit applications, permits and any attachments thereto; and
(iii) NPDES effluent data.
(x) Best Management Practices
The permittee shall adopt Best Management Practices (BMP) to control or abate the discharge of
toxic pollutants and hazardous substances associated with or ancillary to the industrial
manufacturing or treatment process and the Director may request the submission of a BMP plan
where the Director determines that a permittee's practices may contribute significant amounts of
such pollutants to waters of the State.
(y) Right of Appeal
Within thirty (30) days of receipt of notice of a final permit decision, the permittee or any
interested person may submit a request to the Director for an adjudicatory hearing to reconsider
or contest that decision. The request for a hearing must conform to the requirements of 250-
RICR-150-10-1.50 of the RIPDES Regulations.

Page 10 of 10
DEFINITIONS
1. For purposes of this permit, those definitions contained in the RIPDES Regulations and the
Rhode Island Pretreatment Regulations shall apply.
2. The following abbreviations, when used, are defined below.
cu. M/day or M3/day cubic meters per day
mg/l milligrams per liter
ug/l micrograms per liter
lbs/day pounds per day
kg/day kilograms per day
Temp. oC temperature in degrees Centigrade
Temp. oF temperature in degrees Fahrenheit
Turb. turbidity measured by the Nephelometric
Method (NTU)
TNFR or TSS total nonfilterable residue or total
suspended solids
DO dissolved oxygen
BOD five-day biochemical oxygen demand unless
otherwise specified
TKN total Kjeldahl nitrogen as nitrogen
Total N total nitrogen
NH3-N ammonia nitrogen as nitrogen
Total P total phosphorus
COD chemical oxygen demand
TOC total organic carbon
Surfactant surface-active agent
pH a measure of the hydrogen ion concentration
PCB polychlorinated biphenyl
CFS cubic feet per second
MGD million gallons per day
Oil & Grease Freon extractable material
Total Coliform total coliform bacteria
Fecal Coliform total fecal coliform bacteria
ml/l milliliter(s) per liter
NO3-N nitrate nitrogen as nitrogen
NO2-N nitrite nitrogen as nitrogen
NO3-NO2 combined nitrate and nitrite nitrogen as nitrogen
C12 total residual chlorine

Page i of ii
RHODE ISLAND DEPARTMENT OF ENVIRONMENTAL MANAGEMENT OFFICE OF WATER RESOURCES
235 PROMENADE STREET PROVIDENCE, RHODE ISLAND 02908-5767
FACT SHEET RHODE ISLAND POLLUTANT DISCHARGE ELIMINATION SYSTEM (RIPDES) PERMIT TO DISCHARGE TO WATERS OF THE STATE RIPDES PERMIT NO. RI0000191 NAME AND ADDRESS OF APPLICANT:
Kenyon Industries, Incorporated 36 Sherman Avenue
Kenyon, Rhode Island 02832 NAME AND ADDRESS OF FACILITY WHERE DISCHARGE OCCURS:
Kenyon Industries, Incorporated
36 Sherman Avenue Kenyon, Rhode Island 02832
RECEIVING WATER: Pawcatuck River (Waterbody ID RI0008039R-18B) CLASSIFICATION: B1

Page ii of ii
Kenyon Draft Permit Table of Contents
FACT SHEET ................................................................................................................................................. i
I. Proposed Action, Type of Facility, and Discharge Location ............................................................ 1
II. Description of Discharge .................................................................................................................. 1
III. Permit and Administrative Compliance Order Limitations and Conditions ...................................... 1
IV. Permit Basis and Explanation of Effluent Limitation Derivation ....................................................... 1 Facility Description ........................................................................................................................... 1 Receiving Water Description ............................................................................................................ 1 Permit Limit Development ................................................................................................................ 2 Technology-Based Effluent Limitations............................................................................................ 2 Water Quality-Based Permit Limitations .......................................................................................... 6
Phenols Limits ................................................................................................................... 10 Chromium Limits ............................................................................................................... 10 pH Limits ........................................................................................................................... 12
WET Limits ..................................................................................................................................... 12 Nutrients ......................................................................................................................................... 14
Phosphorus ....................................................................................................................... 15 Nitrogen ............................................................................................................................. 17
Sludge .......................................................................................................................................... 17 Non-Contact Cooling Water Limits ................................................................................................. 17 Groundwater/Stormwater Discharge .............................................................................................. 17 Antibacksliding ............................................................................................................................... 18 Antidegradation .............................................................................................................................. 18 Final Permit Limits .......................................................................................................................... 20
V. Comment Period, Hearing Requests, and Procedures for Final Decisions ................................... 22
VI. DEM Contact .................................................................................................................................. 22 ATTACHMENTS ............................................................................................................................ 23
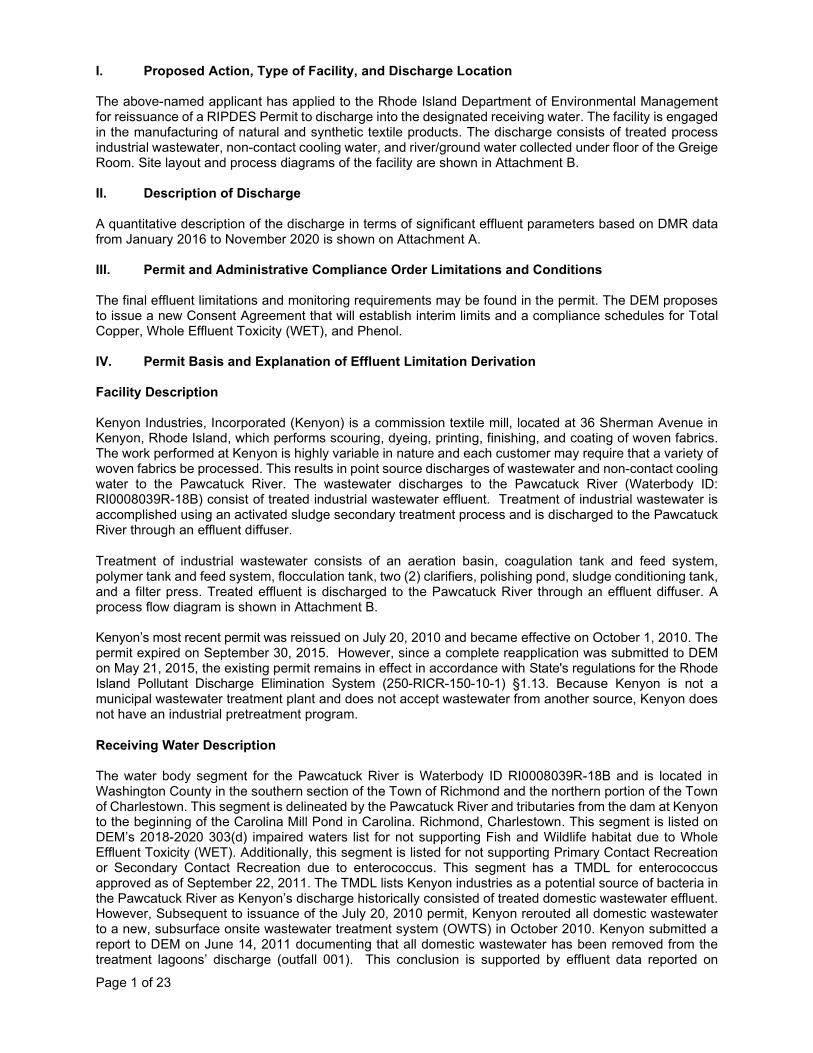
Page 1 of 23
I. Proposed Action, Type of Facility, and Discharge Location
The above-named applicant has applied to the Rhode Island Department of Environmental Management for reissuance of a RIPDES Permit to discharge into the designated receiving water. The facility is engaged in the manufacturing of natural and synthetic textile products. The discharge consists of treated process industrial wastewater, non-contact cooling water, and river/ground water collected under floor of the Greige Room. Site layout and process diagrams of the facility are shown in Attachment B. II. Description of Discharge
A quantitative description of the discharge in terms of significant effluent parameters based on DMR data from January 2016 to November 2020 is shown on Attachment A. III. Permit and Administrative Compliance Order Limitations and Conditions
The final effluent limitations and monitoring requirements may be found in the permit. The DEM proposes to issue a new Consent Agreement that will establish interim limits and a compliance schedules for Total Copper, Whole Effluent Toxicity (WET), and Phenol. IV. Permit Basis and Explanation of Effluent Limitation Derivation Facility Description
Kenyon Industries, Incorporated (Kenyon) is a commission textile mill, located at 36 Sherman Avenue in Kenyon, Rhode Island, which performs scouring, dyeing, printing, finishing, and coating of woven fabrics. The work performed at Kenyon is highly variable in nature and each customer may require that a variety of woven fabrics be processed. This results in point source discharges of wastewater and non-contact cooling water to the Pawcatuck River. The wastewater discharges to the Pawcatuck River (Waterbody ID: RI0008039R-18B) consist of treated industrial wastewater effluent. Treatment of industrial wastewater is accomplished using an activated sludge secondary treatment process and is discharged to the Pawcatuck River through an effluent diffuser.
Treatment of industrial wastewater consists of an aeration basin, coagulation tank and feed system, polymer tank and feed system, flocculation tank, two (2) clarifiers, polishing pond, sludge conditioning tank, and a filter press. Treated effluent is discharged to the Pawcatuck River through an effluent diffuser. A process flow diagram is shown in Attachment B. Kenyon’s most recent permit was reissued on July 20, 2010 and became effective on October 1, 2010. The permit expired on September 30, 2015. However, since a complete reapplication was submitted to DEM on May 21, 2015, the existing permit remains in effect in accordance with State's regulations for the Rhode Island Pollutant Discharge Elimination System (250-RICR-150-10-1) §1.13. Because Kenyon is not a municipal wastewater treatment plant and does not accept wastewater from another source, Kenyon does not have an industrial pretreatment program.
Receiving Water Description The water body segment for the Pawcatuck River is Waterbody ID RI0008039R-18B and is located in Washington County in the southern section of the Town of Richmond and the northern portion of the Town of Charlestown. This segment is delineated by the Pawcatuck River and tributaries from the dam at Kenyon to the beginning of the Carolina Mill Pond in Carolina. Richmond, Charlestown. This segment is listed on DEM’s 2018-2020 303(d) impaired waters list for not supporting Fish and Wildlife habitat due to Whole Effluent Toxicity (WET). Additionally, this segment is listed for not supporting Primary Contact Recreation or Secondary Contact Recreation due to enterococcus. This segment has a TMDL for enterococcus approved as of September 22, 2011. The TMDL lists Kenyon industries as a potential source of bacteria in the Pawcatuck River as Kenyon’s discharge historically consisted of treated domestic wastewater effluent. However, Subsequent to issuance of the July 20, 2010 permit, Kenyon rerouted all domestic wastewater to a new, subsurface onsite wastewater treatment system (OWTS) in October 2010. Kenyon submitted a report to DEM on June 14, 2011 documenting that all domestic wastewater has been removed from the treatment lagoons’ discharge (outfall 001). This conclusion is supported by effluent data reported on
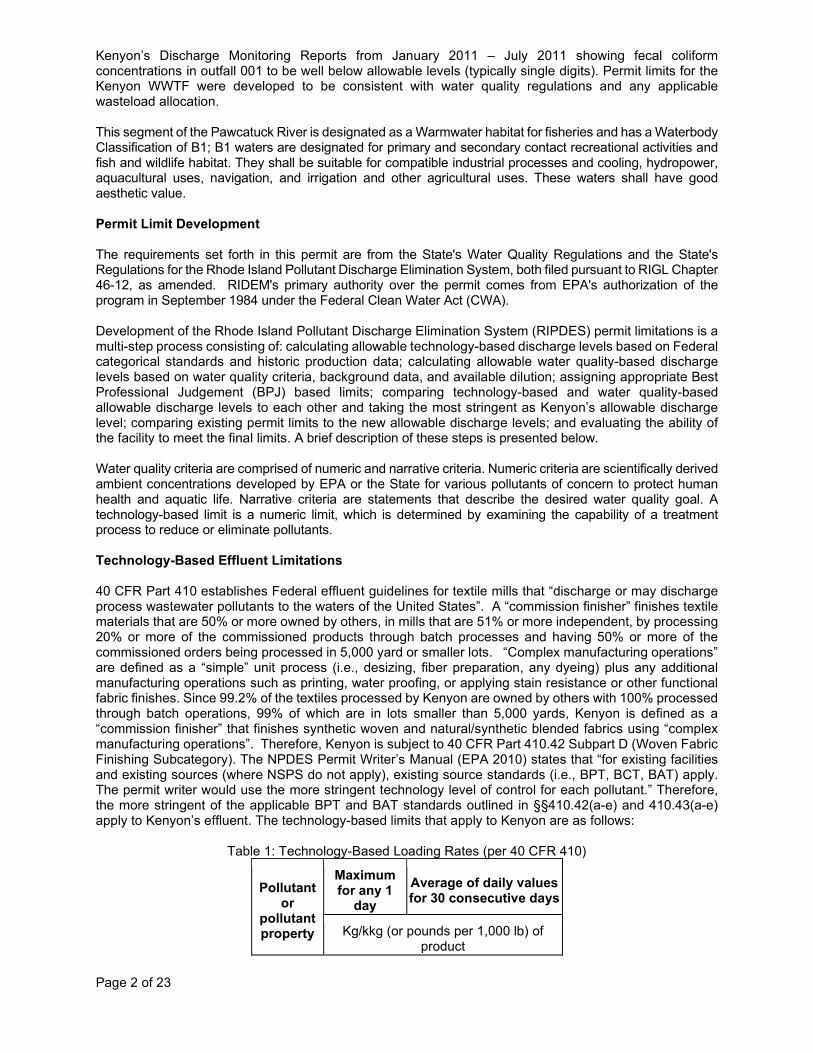
Page 2 of 23
Kenyon’s Discharge Monitoring Reports from January 2011 – July 2011 showing fecal coliform concentrations in outfall 001 to be well below allowable levels (typically single digits). Permit limits for the Kenyon WWTF were developed to be consistent with water quality regulations and any applicable wasteload allocation. This segment of the Pawcatuck River is designated as a Warmwater habitat for fisheries and has a Waterbody Classification of B1; B1 waters are designated for primary and secondary contact recreational activities and fish and wildlife habitat. They shall be suitable for compatible industrial processes and cooling, hydropower, aquacultural uses, navigation, and irrigation and other agricultural uses. These waters shall have good aesthetic value. Permit Limit Development The requirements set forth in this permit are from the State's Water Quality Regulations and the State's Regulations for the Rhode Island Pollutant Discharge Elimination System, both filed pursuant to RIGL Chapter 46-12, as amended. RIDEM's primary authority over the permit comes from EPA's authorization of the program in September 1984 under the Federal Clean Water Act (CWA). Development of the Rhode Island Pollutant Discharge Elimination System (RIPDES) permit limitations is a multi-step process consisting of: calculating allowable technology-based discharge levels based on Federal categorical standards and historic production data; calculating allowable water quality-based discharge levels based on water quality criteria, background data, and available dilution; assigning appropriate Best Professional Judgement (BPJ) based limits; comparing technology-based and water quality-based allowable discharge levels to each other and taking the most stringent as Kenyon’s allowable discharge level; comparing existing permit limits to the new allowable discharge levels; and evaluating the ability of the facility to meet the final limits. A brief description of these steps is presented below.
Water quality criteria are comprised of numeric and narrative criteria. Numeric criteria are scientifically derived ambient concentrations developed by EPA or the State for various pollutants of concern to protect human health and aquatic life. Narrative criteria are statements that describe the desired water quality goal. A technology-based limit is a numeric limit, which is determined by examining the capability of a treatment process to reduce or eliminate pollutants.
Technology-Based Effluent Limitations 40 CFR Part 410 establishes Federal effluent guidelines for textile mills that “discharge or may discharge process wastewater pollutants to the waters of the United States”. A “commission finisher” finishes textile materials that are 50% or more owned by others, in mills that are 51% or more independent, by processing 20% or more of the commissioned products through batch processes and having 50% or more of the commissioned orders being processed in 5,000 yard or smaller lots. “Complex manufacturing operations” are defined as a “simple” unit process (i.e., desizing, fiber preparation, any dyeing) plus any additional manufacturing operations such as printing, water proofing, or applying stain resistance or other functional fabric finishes. Since 99.2% of the textiles processed by Kenyon are owned by others with 100% processed through batch operations, 99% of which are in lots smaller than 5,000 yards, Kenyon is defined as a “commission finisher” that finishes synthetic woven and natural/synthetic blended fabrics using “complex manufacturing operations”. Therefore, Kenyon is subject to 40 CFR Part 410.42 Subpart D (Woven Fabric Finishing Subcategory). The NPDES Permit Writer’s Manual (EPA 2010) states that “for existing facilities and existing sources (where NSPS do not apply), existing source standards (i.e., BPT, BCT, BAT) apply. The permit writer would use the more stringent technology level of control for each pollutant.” Therefore, the more stringent of the applicable BPT and BAT standards outlined in §§410.42(a-e) and 410.43(a-e) apply to Kenyon’s effluent. The technology-based limits that apply to Kenyon are as follows:
Table 1: Technology-Based Loading Rates (per 40 CFR 410)
Pollutant or
pollutant property
Maximum for any 1
day Average of daily values for 30 consecutive days
Kg/kkg (or pounds per 1,000 lb) of product

Page 3 of 23
BOD5 6.6 3.3
COD See Below See Below
TSS 17.8 8.9
Sulfide 0.20 0.10
Phenols 0.10 0.05
Total Chromium 0.10 0.05
pH 6.0 s.u. - 9.0 s.u. The Woven Fabric Finishing Subcategory, as established in §§410.42(b-d) and 410.43(b-d), has different technology-based effluent limitations (TBELs) for chemical oxygen demand (COD) depending on the fabric prepared, types of unit operations used, and complexity of the manufacturing operations. Kenyon has historically produced textiles that meet the descriptions in paragraphs (b), (c), and (d) of the above-referenced sections. According to the NPDES Permit Writer’s Manual, “when a facility is subject to effluent guidelines for two or more processes in a subcategory to effluent guidelines from two or more categories or subcategories, the permit writer must apply each of the applicable effluent guidelines to derive TBELs.” The Manual further states that in the case where individual wastewater streams regulated by effluent guidelines are combined during or before treatment, as is the case for Kenyon, “the permit writer combines the allowable pollutant loadings from each set of requirements or from each set of effluent guidelines to arrive at a single TBEL for the facility using a building block approach.” Moreover, according to the 1974 Development Document for Effluent Limitations Guidelines and New Source Performance Standards for the Textile Mills Point Source Category, when combinations of the different woven fabric classifications occur, “a prorated approach will be taken to establish the allowable residual COD level.” To determine an appropriate COD TBEL for Kenyon, DEM analyzed historic production data based on each subcategory in Part 410 Subpart D:
Table 2: 2016-2020 40 CFR 410.42 Kenyon Production Categories
40 CFR 410.42(b)
% of Annual Total
40 CFR 410.42(c)
% of Annual Total
40 CFR 410.42(d)
% of Annual Total
Total (yards)
2016 2,419,831 9.56 22,855,985 90.34 24,502 0.10 25,300,318 2017 2,802,818 10.27 24,411,068 89.47 70,723 0.26 27,284,609 2018 2,505,723 9.83 22,936,313 90.01 40,577 0.16 25,482,613 2019 2,899,162 12.28 20,662,172 87.51 48,577 0.21 23,609,911 2020 2,110,869 10.73 16,969,670 86.28 587,317 2.99 19,667,856
Category Total 12,738,403 107,835,208 771,696 121,345,307
% of total 10.50 88.87 0.64
Based on the above production data from 2016-2020, it was determined that an appropriate measure of actual production for Kenyon is 10.50% for 40 CFR 410.42(b), 89.0% for 40 CFR 410.42(c), and 0.5% for 40 CFR 410.42(d). Accordingly, the COD Monthly Average and Daily Maximum TBEL for Kenyon was calculated as follows: Maximum Daily:
60 +20.0(10.50) + 40(89.0) + 60(0.50)
100= 98.0
𝑘𝑘𝑘𝑘𝑘𝑘𝑘𝑘𝑘𝑘
(𝑜𝑜𝑜𝑜 𝑙𝑙𝑙𝑙𝑙𝑙 𝑝𝑝𝑝𝑝𝑜𝑜 1,000 𝑙𝑙𝑙𝑙𝑙𝑙 𝑝𝑝𝑜𝑜𝑜𝑜𝑝𝑝𝑝𝑝𝑝𝑝𝑝𝑝)
Average Monthly:
30 + 10.0(10.50) + 20(89.0) + 30(0.50)
100= 49
𝑘𝑘𝑘𝑘𝑘𝑘𝑘𝑘𝑘𝑘
(𝑜𝑜𝑜𝑜 𝑙𝑙𝑙𝑙𝑙𝑙 𝑝𝑝𝑝𝑝𝑜𝑜 1,000 𝑙𝑙𝑙𝑙𝑙𝑙 𝑝𝑝𝑜𝑜𝑜𝑜𝑝𝑝𝑝𝑝𝑝𝑝𝑝𝑝)

Page 4 of 23
The additional COD allocation based on most of Kenyon’s production being finishing of textiles according to 40 CFR 410.42(c) is consistent with the Textile Mills Point Source Category Effluent Guidelines. According to the Development Document for the Effluent Guidelines: “In the woven fabric finishing subcategory, at mills where complex processing operations (printing, water-proofing and application of functional finishes in addition to dyeing and fiber preparation) are performed, wastewaters are discharged that are higher in volume and have higher BOD5, COD, and TSS raw waste loads than at mills where simple operations (dyeing and fiber preparation) are performed.” Therefore, the higher COD limits better account for the higher strength wastewater being treated. Antibacksliding requirements, found at Section 402(o) of the Clean Water Act, prohibit the relaxation of effluent limits by using a technology-based effluent limitation that is based on an effluent guideline that is less stringent. Therefore, the effluent limitations found in Table 1 and the calculated limit for COD were compared to the pollutant discharge rates used to determine limits in the previous permit. The pollutant discharge rates from the previous permit are outlined in the table below:
Table 3: Pollutant Discharge Rates from 2010 Permit Parameter Maximum for any
1 day (lbs/1000 lbs)
Average of daily values for 30 consecutive days
(lbs/1000 lbs) BOD5 10.3 5.2 COD 80.6 40.3 TSS 18.9 13.9 Sulfide 0.21 0.10 Phenols 0.05 0.025 Total Chromium 0.06 0.03 pH 6.0 s.u. – 9.0 s.u.
Some of the effluent limitations from 40 CFR Part 410 – Subpart D were less stringent than the comparable limit established in the previous permit. Since the Clean Water Act prevents backsliding for TBELs established in a previous permit, the previous permit limit was used for COD, Phenol, and Total Chromium. The final pollutant discharge rates used to determine technology-based limits is outlined in the table below:
Table 4: Pollutant Discharge Rates for Current Permit Parameter Maximum for any
1 day (lbs/1000 lbs)
Average of daily values for 30 consecutive days
(lbs/1000 lbs) BOD5 6.6 3.3 COD 80.6 40.3 TSS 17.8 8.9 Sulfide 0.20 0.10 Phenols 0.05 0.025 Total Chromium 0.06 0.03 pH 6.0 s.u. - 9.0 s.u.
§1.18(B)(2) of the Regulations for the Rhode Island Pollutant Discharge Elimination System (RIPDES Regulations), requires that “calculation of any permit limitations, standards, or prohibitions which are based on production (or other measure of operation) shall be based not upon the design production capacity but rather upon a reasonable measure of actual production of the facility…” Therefore, since the technology-based limits listed above are based on production, the technology based allowable discharge levels must be based on a reasonable measure of actual production. It is important to note that, according to the EPA guidance document entitled Guidance Manual for the Use of Production Based Pretreatment Standards, and the Combined Wastestream Formula, the production rate should be based on the production per discharge day rather than production per production day. Since Kenyon discharges seven (7) days per week the production per discharge day is equivalent to the production per calendar day. This is what the previous permit required to be reported on Discharge Monitoring Reports (DMRs). Therefore, the production values reported on the DMRs are those that were used to calculate limits. Table 5 includes the annual average production in lbs/day for each of the past five (5) years.

Page 5 of 23
Table 5: Average Monthly Production (2016-2020) Production
Year Annual Monthly Average (lbs/d)
2016 48055 2017 49708 2018 47869 2019 44055 2020 40137
Based on the historic production data, it was determined that tiers at 28,000 lbs/day, 36,000 lbs/day, 44,000 lbs/day, 52,000 lbs/day, 60,000 lbs/day, and 68,000 lbs/day, which were the production tiers used in the previous permit, are appropriate. Using the technology-based effluent limits from Table 4 and the above-mentioned production tiers, the following technology-based allowable discharge levels were calculated:
Table 6a: TBELs @ >68,000 lbs/day Average Monthly Rate Parameter Maximum for any
1 day (lbs/day)
Average of daily values for 30 consecutive days
(lbs/day) BOD5 502 251 COD 6,125 3,062 TSS 1,353 676 Sulfide 15.2 7.6 Phenols 3.80 1.9 Total Chromium 4.56 2.28 pH 6.0 s.u. - 9.0 s.u.
Table 6b: TBELs @ 68,000 lbs/day Average Monthly Rate
Parameter Maximum for any 1 day
(lbs/day)
Average of daily values for 30 consecutive days
(lbs/day) BOD5 449 224 COD 5,480 2,740 TSS 1,210 605 Sulfide 13.6 6.8 Phenols 3.40 1.7 Total Chromium 4.08 2.04 pH 6.0 s.u. - 9.0 s.u.
Table 6c: TBELs @ 60,000 lbs/day Average Monthly Rate
Parameter Maximum for any 1 day
(lbs/day)
Average of daily values for 30 consecutive days
(lbs/day) BOD5 396 198 COD 4,836 2,418 TSS 1068 534 Sulfide 12.0 6.0 Phenols 3.0 1.5 Total Chromium 3.6 1.8 pH 6.0 s.u. - 9.0 s.u.
Table 6d: TBELs @ 52,000 lbs/day Average Monthly Rate
Parameter Maximum for any 1 day
(lbs/day)
Average of daily values for 30 consecutive days
(lbs/day) BOD5 343 172 COD 4,191 2,096 TSS 926 463

Page 6 of 23
Sulfide 10.4 5.2 Phenols 2.6 1.3 Total Chromium 3.12 1.56 pH 6.0 s.u. - 9.0 s.u.
Table 6e: TBELs @ 44,000 lbs/day Average Monthly Rate
Parameter Maximum for any 1 day
(lbs/day)
Average of daily values for 30 consecutive days
(lbs/day) BOD5 290 145 COD 3,546 1,773 TSS 783 391.6 Sulfide 8.8 4.4 Phenols 2.2 1.1 Total Chromium 2.64 1.32 pH 6.0 s.u. - 9.0 s.u.
Table 6f: TBELs @ 36,000 lbs/day Average Monthly Rate
Parameter Maximum for any 1 day
(lbs/day)
Average of daily values for 30 consecutive days
(lbs/day) BOD5 238 119 COD 2,902 1,451 TSS 641 320 Sulfide 7.2 3.6 Phenols 1.8 0.9 Total Chromium 2.16 1.08 pH 6.0 s.u. - 9.0 s.u.
Table 6g: TBELs @ 28,000 lbs/day Average Monthly Rate Parameter Maximum for any
1 day (lbs/day)
Average of daily values for 30 consecutive days
(lbs/day) BOD5 185 92 COD 2,257 1,128 TSS 498 249 Sulfide 5.6 2.8 Phenols 1.4 0.7 Total Chromium 1.68 0.84 pH 6.0 s.u. - 9.0 s.u.
Water Quality-Based Permit Limitations The allowable effluent limitations were established based on acute and chronic aquatic life criteria and human health criteria using the following: available instream dilution; an allocation factor; and background concentrations when available and/or appropriate. The aquatic life and human health criteria are specified in the Rhode Island Water Quality Regulations. Aquatic life criteria have been established to ensure the protection and propagation of aquatic life while human health criteria represent the pollutant levels that would not result in a significant risk to public health from ingestion of aquatic organisms. The more stringent of the two criteria was then used in establishing allowable effluent limitations. Details concerning the calculation of potential permit limitations, selection of factors, which influence their calculation, and the selection of final permit limitations are included below or in the attached documents. CWA section 301(b)(1)(C) requires that permits include any effluent limitations necessary to meet water quality standards. The waterbody segment is a Class B1 warm freshwater according to the Rhode Island Water Quality Regulations. These waters are designated for primary and secondary contact recreational activities and fish and wildlife habitat. They shall be suitable for compatible industrial processes and cooling, hydropower, aquacultural uses, navigation, and irrigation and other agricultural uses. These waters shall

Page 7 of 23
have good aesthetic value. Primary contact recreational activities may be impacted due to pathogens from approved wastewater discharges. The NPDES Permit Writer’s Manual states that when characterizing the effluent and receiving water the permit writer should first identify pollutants of concern in the effluent, which include: pollutants with applicable TBELs, pollutants with a wasteload allocation from a TMDL, pollutants identified as needing WQBELs in the previous permit, pollutants identified as present in the effluent through monitoring, and pollutants otherwise expected to be present in the discharge. The pollutants of concern and any applicable water quality criteria for the pollutant were identified based on these categories:
Table 7: Pollutants of Concern in Kenyon’s effluent
Pollutant of Concern Why a Pollutant of Concern? Applicable Water Quality Criteria
BOD5 Applicable TBEL No -- Dissolved Oxygen Criteria
COD Applicable TBEL No -- Dissolved Oxygen Criteria
TSS Applicable TBEL No Sulfide Applicable TBEL No Phenols Applicable TBEL No
Total Chromium Applicable TBEL Yes – Cr(III) and Cr(VI) pH Applicable TBEL Yes
Ammonia WQBEL in previous permit Yes Copper WQBEL in previous permit Yes Lead WQBEL in previous permit Yes
Cadmium WQBEL in previous permit Yes Silver WQBEL in previous permit Yes Nickel WQBEL in previous permit Yes
Aluminum WQBEL in previous permit Yes Zinc WQBEL in previous permit Yes
Total Residual Chlorine WQBEL in previous permit Yes Fecal Coliform WQBEL in previous permit Yes
Ceriodaphnia LC50 WQBEL in previous permit Yes -- Narrative Criteria §1.10(D)(1)
Pimphales LC50 WQBEL in previous permit Yes -- Narrative Criteria §1.10(D)(1)
Total Phosphorus Present through monitoring Yes -- Narrative Nutrient Criteria
Nitrate Present through monitoring Yes -- Narrative Nutrient Criteria
Nitrite Present through monitoring Yes -- Narrative Nutrient Criteria
TKN Present through monitoring Yes -- Narrative Nutrient Criteria
Total Nitrogen Present through monitoring Yes -- Narrative Nutrient Criteria
Antimony Present through monitoring - PPS Yes bis(2-ethylhexyl)phthalate Present through monitoring - PPS Yes
Phenol Present through monitoring - PPS Yes Chlorobenzene Present through monitoring - Application Data Yes
Oil & Grease Present through monitoring - Application Data Yes -- Narrative Criteria §1.10(D)(1)
Sulfate Present through monitoring - Application Data No Cobalt Present through monitoring - Application Data No

Page 8 of 23
Iron Present through monitoring - Application Data Yes
Color Present through monitoring - Application Data Yes -- Narrative Criteria §1.10(D)(1)
Fluoride Present through monitoring - Application Data No The Pawcatuck River has a completed TMDL for Enterococcus. However, Kenyon disconnected the sanitary wastewater source from their treatment system train in 2010, and now only discharges treated process wastewater and non-contact cooling water to surface waters. Therefore, there is no reasonable potential for the Kenyon discharge to cause an excursion above a water quality standard for bacteria, and bacteria limits are not required in the permit. RIPDES Regulations at §1.16(A)(5)(b) state that effluent limitations “must control all pollutants or pollutant parameters (either conventional, nonconventional, or toxic pollutants) which the Department determines are or may be discharged at a level which will cause, have the reasonable potential to cause, or contribute to an excursion above any State water quality standard, including State narrative criteria for water quality.” Therefore, it was determined whether the Kenyon discharge has a reasonable potential to cause or contribute to an excursion above any State water quality standard for the pollutants of concern with an applicable water quality criterion. To make this determination, DEM compares the discharge concentration for the pollutant to the applicable water quality criterion. If the discharge concentration, found in discharge monitoring reports, priority pollutant scans, and application data, is greater than or equal to half of the applicable water quality-based permit limit, then DEM determines that there is reasonable potential for the discharge to cause or contribute to an excursion above the State water quality standard and assigns effluent limits for that pollutant. §§1.10(C)(1) and 1.10(C)(2) of the Water Quality Regulations describes the flows used to determine compliance with human health and aquatic life criteria. Freshwater human health criteria use the harmonic mean flow as the design flow. The harmonic mean flow is a long-term mean flow value calculated by dividing the number of daily flows analyzed by the sum of the reciprocals of those daily flows. Aquatic life criteria shall not be exceeded at or above the lowest average 7 consecutive day low flow with an average recurrence frequency of once in 10 years (7Q10). In accordance with the RIPDES 7Q10 Policy, revised December 2019, the 7Q10 flow for the Pawcatuck River at Kenyon Industries was compared to the USGS gage on the Pawcatuck River at Kenyon, RI (USGS Station Number 01117430). This station became active in 2007, just prior to the previous permit’s reissuance. Due to the gage’s proximity to Kenyon’s discharge, the 7Q10 for the Pawcatuck River at the gage was applied directly to the dilution factor calculation, where:
Drainage Area for the Gauge = 72.7 square miles 7Q10 for the Gauge = 7.928 cubic feet per second (cfs)
Using the upstream 7Q10 river flow of 7.928 cfs (for aquatic life criteria) and a mean harmonic flow of 54.104 cfs (for human health criteria) the appropriate dilution factors were determined. A 2013 wastewater Treatment Plant Upgrade Engineering Report noted that the facility’s highest average specific water usage is 6.9 gal/lb of production. At a maximum monthly average production rate of 70,000 lbs/day and the specific water usage of 6.9 gal/lbs, the average monthly flow rate was calculated to be 0.49 MGD. This was determined to be a reasonable measure of actual production in accordance with §1.18(B)(2) of the RIPDES Regulations. Using the permitted flow of 0.49 MGD (0.758 cfs), a water quality dilution factor of 11.457 for acute and chronic criteria and a human health dilution factor of 72.359 were calculated using the following equation:
DF = QD + QU
QD Where: DF = Dilution Factor QD = Design Flow QU = Flow upstream of the Facility (Receiving Water Flow)
An exception to these dilution factors was made for Ammonia limitations. Ammonia removal is strongly dependent on temperature (nitrification rate decreases as temperature decreases). Since Ammonia does not bioaccumulate or accumulate in sediment, seasonal dilution factors and historical pH and temperature

Page 9 of 23
background data were used to determine the appropriate Ammonia limitations. A winter 7Q10 river flow of 16.142 cfs was used to yield a dilution factor of 22.289 and a summer 7Q10 of 7.928 cfs used to give a dilution factor of 11.457. Based on the above dilution factors and the freshwater aquatic life and non-Class A human health criteria, from the Rhode Island Water Quality Regulations, allowable discharge concentrations were established using 80% allocation for pollutants without background data, 90% allocation for pollutants with background data, and 100% allocation of total residual chlorine (TRC) due to the fact that Chlorine is not expected to be found in ambient water and it is a non-conservative pollutant. Using the above dilution factors and hardness, the allowable discharge limits were calculated as follows:
a) Background concentration unknown or available data is impacted by sources that have not yet achieved water quality-based limits.
𝐿𝐿𝐿𝐿𝐿𝐿𝐿𝐿𝑝𝑝 = (𝐷𝐷𝐷𝐷) ∗ (𝐶𝐶𝑜𝑜𝐿𝐿𝑝𝑝𝑝𝑝𝑜𝑜𝐿𝐿𝐶𝐶) ∗ (80%)
Where: DF = acute or chronic dilution factor, as appropriate Note: The right side of this formula is divided by the appropriate metals translator when this formula is used to calculate limits for metals.
b) Using available background concentration data
𝐿𝐿𝐿𝐿𝐿𝐿𝐿𝐿𝑝𝑝 = (𝐷𝐷𝐷𝐷) ∗ (𝐶𝐶𝑜𝑜𝐿𝐿𝑝𝑝𝑝𝑝𝑜𝑜𝐿𝐿𝐶𝐶) ∗ 90% − (𝐵𝐵𝐶𝐶𝑝𝑝𝑘𝑘𝑘𝑘𝑜𝑜𝑜𝑜𝑝𝑝𝐵𝐵𝑝𝑝) ∗ (𝐷𝐷𝐷𝐷 − 1)
Where: DF = acute or chronic dilution factor, as appropriate Note: The right side of this formula is divided by the appropriate metals translator when this formula is used to calculate limits for metals. All limits were calculated using 80% allocation, due to a lack of background data. Reference Attachment D for calculations of allowable limits based on Aquatic Life and Human Health Criteria. The formulas and data noted above were applied with the following exceptions:
I. Pollutants that, based on the acute and chronic dilution factors, have a higher allowable chronic limit than allowable acute limit. For this situation, both the "Monthly Average" and "Daily Maximum" limits were set at the allowable acute limit.
II. Total residual chlorine. The limits for total residual chlorine (TRC) were established in
accordance with the RIDEM Effluent Disinfection Policy. The "Monthly Average" and "Daily Maximum" were based on a 100% allocation, a zero background concentration, and the appropriate dilution factor(s). The 100% allocation factor for TRC was used due to the non-conservative nature of chlorine and the improbability of the receiving water having a detectable background TRC concentration.
III. Pollutants with water quality-based monthly average limits in the previous RIPDES permit. The
relaxation of monthly average limits from the previous permit was restricted in accordance with the antibacksliding provisions of the Clean Water Act and the Policy on the Implementation of the Antidegradation Provisions of the Rhode Island Water Quality Regulations.
In accordance with 40 CFR Part 122.4(d)(1)(iii), it is only necessary to establish limitations for those pollutants in the discharge which have the reasonable potential to cause or contribute to the exceedance of the in-stream criteria. In order to evaluate the need for permit limitations, the allowable discharge levels (permit limits) were compared to Discharge Monitoring Report (DMR) data, Priority Pollutant Scan data, and data provided in the permit application. An assessment was made to determine if limits were necessary, using the data collected from 2016-2020. Based on the discharge data, it was determined that the discharge has a reasonable potential to cause or contribute to excursions above the State Water Quality criteria for Copper, Phenol, Aluminum, and Ammonia. Therefore, water quality-based effluent limits for each of these
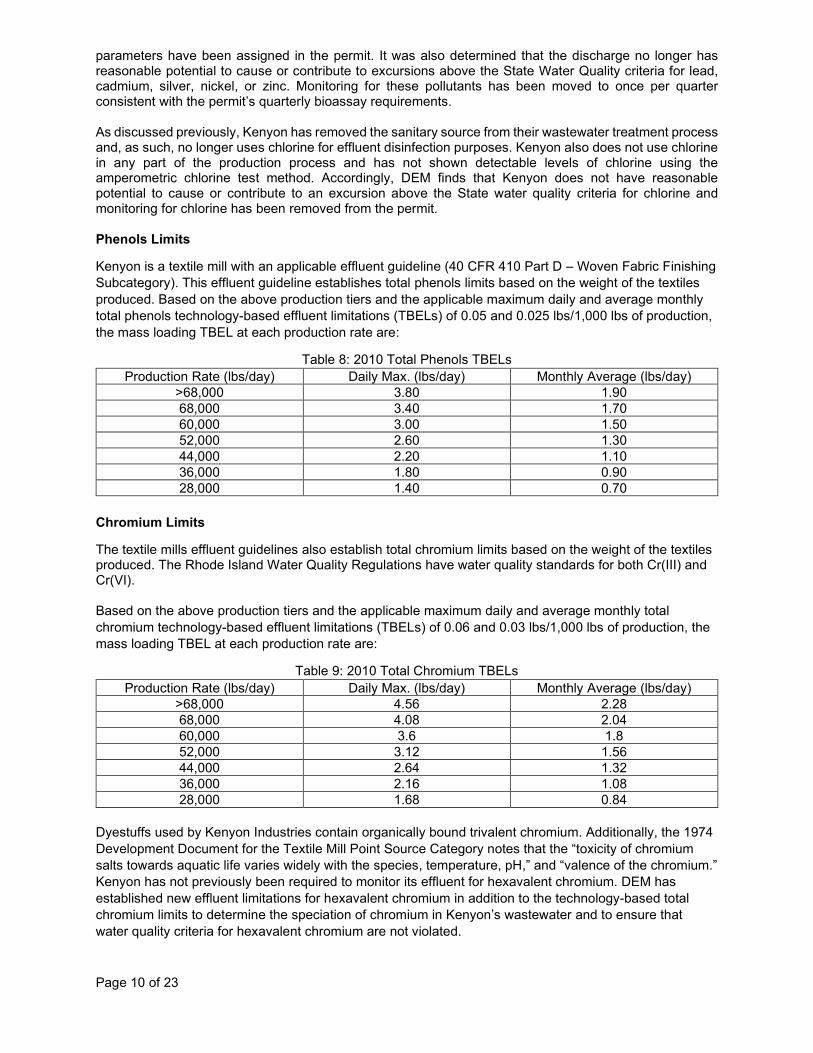
Page 10 of 23
parameters have been assigned in the permit. It was also determined that the discharge no longer has reasonable potential to cause or contribute to excursions above the State Water Quality criteria for lead, cadmium, silver, nickel, or zinc. Monitoring for these pollutants has been moved to once per quarter consistent with the permit’s quarterly bioassay requirements. As discussed previously, Kenyon has removed the sanitary source from their wastewater treatment process and, as such, no longer uses chlorine for effluent disinfection purposes. Kenyon also does not use chlorine in any part of the production process and has not shown detectable levels of chlorine using the amperometric chlorine test method. Accordingly, DEM finds that Kenyon does not have reasonable potential to cause or contribute to an excursion above the State water quality criteria for chlorine and monitoring for chlorine has been removed from the permit. Phenols Limits
Kenyon is a textile mill with an applicable effluent guideline (40 CFR 410 Part D – Woven Fabric Finishing Subcategory). This effluent guideline establishes total phenols limits based on the weight of the textiles produced. Based on the above production tiers and the applicable maximum daily and average monthly total phenols technology-based effluent limitations (TBELs) of 0.05 and 0.025 lbs/1,000 lbs of production, the mass loading TBEL at each production rate are:
Table 8: 2010 Total Phenols TBELs Production Rate (lbs/day) Daily Max. (lbs/day) Monthly Average (lbs/day)
>68,000 3.80 1.90 68,000 3.40 1.70 60,000 3.00 1.50 52,000 2.60 1.30 44,000 2.20 1.10 36,000 1.80 0.90 28,000 1.40 0.70
Chromium Limits
The textile mills effluent guidelines also establish total chromium limits based on the weight of the textiles produced. The Rhode Island Water Quality Regulations have water quality standards for both Cr(III) and Cr(VI). Based on the above production tiers and the applicable maximum daily and average monthly total chromium technology-based effluent limitations (TBELs) of 0.06 and 0.03 lbs/1,000 lbs of production, the mass loading TBEL at each production rate are:
Table 9: 2010 Total Chromium TBELs Production Rate (lbs/day) Daily Max. (lbs/day) Monthly Average (lbs/day)
>68,000 4.56 2.28 68,000 4.08 2.04 60,000 3.6 1.8 52,000 3.12 1.56 44,000 2.64 1.32 36,000 2.16 1.08 28,000 1.68 0.84
Dyestuffs used by Kenyon Industries contain organically bound trivalent chromium. Additionally, the 1974 Development Document for the Textile Mill Point Source Category notes that the “toxicity of chromium salts towards aquatic life varies widely with the species, temperature, pH,” and “valence of the chromium.” Kenyon has not previously been required to monitor its effluent for hexavalent chromium. DEM has established new effluent limitations for hexavalent chromium in addition to the technology-based total chromium limits to determine the speciation of chromium in Kenyon’s wastewater and to ensure that water quality criteria for hexavalent chromium are not violated.

Page 11 of 23
For Cr(III), consistent with Part §1.26(K) of the Rhode Island Water Quality Regulations, the acute and chronic criteria were calculated as 269.734 and 35.086 µg/L, respectively. The acute and chronic metals translators are 0.316 and 0.86, respectively. The maximum daily and average monthly limitations for Cr(III) are calculated:
𝐷𝐷𝐶𝐶𝐿𝐿𝑙𝑙𝐷𝐷 𝑀𝑀𝐶𝐶𝑀𝑀.𝐿𝐿𝐿𝐿𝐿𝐿𝐿𝐿𝑝𝑝 = (80%) ∗ (11.457) ∗ (269.734 µ𝑘𝑘/𝐿𝐿)
0.316= 7823.50 µ𝑘𝑘/𝐿𝐿
𝑀𝑀𝑜𝑜𝐵𝐵𝑝𝑝ℎ𝑙𝑙𝐷𝐷 𝐴𝐴𝐴𝐴𝑘𝑘. 𝐿𝐿𝐿𝐿𝐿𝐿𝐿𝐿𝑝𝑝 = (80%) ∗ (11.457) ∗ (35.086 µ𝑘𝑘/𝐿𝐿)
0.86= 373.94 µ𝑘𝑘/𝐿𝐿
Because the historic total chromium discharge concentration is less than 50% of the calculated water quality-based permit limit for Cr(III), there is no reasonable potential for the Kenyon discharge to cause or contribute to an excursion above the water quality standard to Cr(III).
The Cr(VI) limits are calculated using the following equations:
𝐷𝐷𝐶𝐶𝐿𝐿𝑙𝑙𝐷𝐷 𝑀𝑀𝐶𝐶𝑀𝑀. 𝐿𝐿𝐿𝐿𝐿𝐿𝐿𝐿𝑝𝑝 = (80%) ∗ (11.457) ∗ (16 µ𝑘𝑘/𝐿𝐿)
0.982= 149.33 µ𝑘𝑘/𝐿𝐿
𝑀𝑀𝑜𝑜𝐵𝐵𝑝𝑝ℎ𝑙𝑙𝐷𝐷 𝐴𝐴𝐴𝐴𝑘𝑘. 𝐿𝐿𝐿𝐿𝐿𝐿𝐿𝐿𝑝𝑝 = (80%) ∗ (11.457) ∗ (11 µ𝑘𝑘/𝐿𝐿)
0.962= 104.80 µ𝑘𝑘/𝐿𝐿
As mentioned previously, the above-calculated Cr(VI) limits were established in the permit. Below is a table summarizing the effluent limitations and reporting requirements for chromium at each production tier:
Table 10: Final Chromium Limits for Kenyon
Production Rate Parameter
Quantity – lbs./day Concentration - µg/L Frequency Sample
Type Avg. Monthly
Max. Daily
Avg. Monthly
Max. Daily
>68,000 lbs
Chromium, Total 2.28 4.56 2/Month 24-Hr.
Comp.
Chromium, Hexavalent 105 149 2/Month 24-Hr.
Comp.
68,000 lbs
Chromium, Total 2.04 4.08 2/Month 24-Hr.
Comp.
Chromium, Hexavalent 105 149 2/Month 24-Hr.
Comp.
60,000 lbs
Chromium, Total 1.80 3.60 2/Month 24-Hr.
Comp.
Chromium, Hexavalent 105 149 2/Month 24-Hr.
Comp.
52,000 lbs
Chromium, Total 1.56 3.12 2/Month 24-Hr.
Comp.
Chromium, Hexavalent 105 149 2/Month 24-Hr.
Comp.
44,000 lbs
Chromium, Total 1.32 2.64 2/Month 24-Hr.
Comp.
Chromium, Hexavalent 105 149 2/Month 24-Hr.
Comp.
36,000 lbs Chromium, Total 1.08 2.16 2/Month 24-Hr.
Comp.

Page 12 of 23
Chromium, Hexavalent 105 149 2/Month 24-Hr.
Comp.
28,000 lbs
Chromium, Total 0.84 1.68 2/Month 24-Hr.
Comp.
Chromium, Hexavalent 105 149 2/Month 24-Hr.
Comp.
The samples for Total Chromium and Hexavalent Chromium shall be taken together two times per month. The permit also includes a condition which states that if the results of twelve consecutive months of monitoring show effluent concentrations of hexavalent chromium below the specified detection limit, then the permittee is no longer required to continue sampling for hexavalent chromium.
pH Limits
The permit includes a narrative condition for pH, found in Part I.A.13.a, that the discharge shall not cause the pH of the receiving water to be below 6.5 or above 9.0 standard units (S.U.). This condition is based on the Rhode Island Water Quality Regulations §1.10(D)(1) Class Specific Criteria for Freshwaters, which states that the pH of freshwaters shall be between 6.5 and 9.0 S.U.
The technology-based effluent limitations for woven textiles set out in 40 CFR Part 410 Subpart D require Kenyon’s effluent pH to be between 6.0 and 9.0 S.U. Accordingly, the pH of the discharge from Outfall 001 must be monitored and shall not be below 6.0 S.U. or above 9.0 S.U. Kenyon must also report the minimum and maximum pH of the discharge from Outfall 002 on a monthly basis.
WET Limits According to the Rhode Island Water Quality Regulations at §1.10(D)(1), freshwaters shall not contain chemical constituents “in concentrations or combinations that could be harmful to humans or fish and wildlife for the most sensitive and governing water class use.” §1.10(B)(1) also states that “all waters shall be free of pollutants in concentration or combinations” that “adversely affect the composition of fish and wildlife,” adversely affect the physical, chemical, or biological integrity of the habitat,” “interfere with the propagation of fish and wildlife,” and “adversely alter the life cycle functions, uses, processes and activities of fish and wildlife.” Moreover, Section 101(a)(3) of the Clean Water Act states that “it is the national policy that the discharge of toxic pollutants in toxic amounts be prohibited.” Whole Effluent Toxicity (WET) tests measure the degree of response of exposed aquatic test organisms to an effluent. WET testing is a valuable way to measure the toxic effects of a discharge with multiple toxic pollutants present, such as the Kenyon effluent, thereby more accurately determining if the discharge meets water quality standards for toxicity. DEM has previously determined that the Kenyon effluent has a reasonable potential to cause or contribute to an excursion above the State water quality criterion for toxicity. Accordingly, DEM has established WET limits for the Kenyon discharge. EPA’s Technical Support Document for Water Quality-Based Toxics Control (TSD) provides procedural recommendations and guidance for controlling adverse water quality impacts caused by toxic discharges to surface waters. As explained in the TSD, for toxic pollutants, many waste load allocations (WLAs) used to develop effluent limits have two outputs: an acute requirement and a chronic requirement. To develop Kenyon’s WLAs for WET, DEM calculated the following:
𝑊𝑊𝐿𝐿𝐴𝐴 =[𝑊𝑊𝑊𝑊𝐶𝐶 ∗ (𝑊𝑊𝑒𝑒 + 𝑊𝑊𝑠𝑠) − 𝑊𝑊𝑠𝑠 ∗ 𝐶𝐶𝑠𝑠]
𝑊𝑊𝑒𝑒
Where: Qe = The effluent flow, or Kenyon’s design flow (0.758 cfs) Qs = Receiving water flow (7.928 cfs @ 7Q10) Cs = Background concentration (assumed zero for toxicity)
WQC = Applicable Water Quality Criteria. For Acute Toxicity, EPA recommends a standard of 0.3 TUa. For Chronic Toxicity, EPA recommends a standard of 1.0 TUc.
Based on the above, the acute and chronic WLAs were calculated:
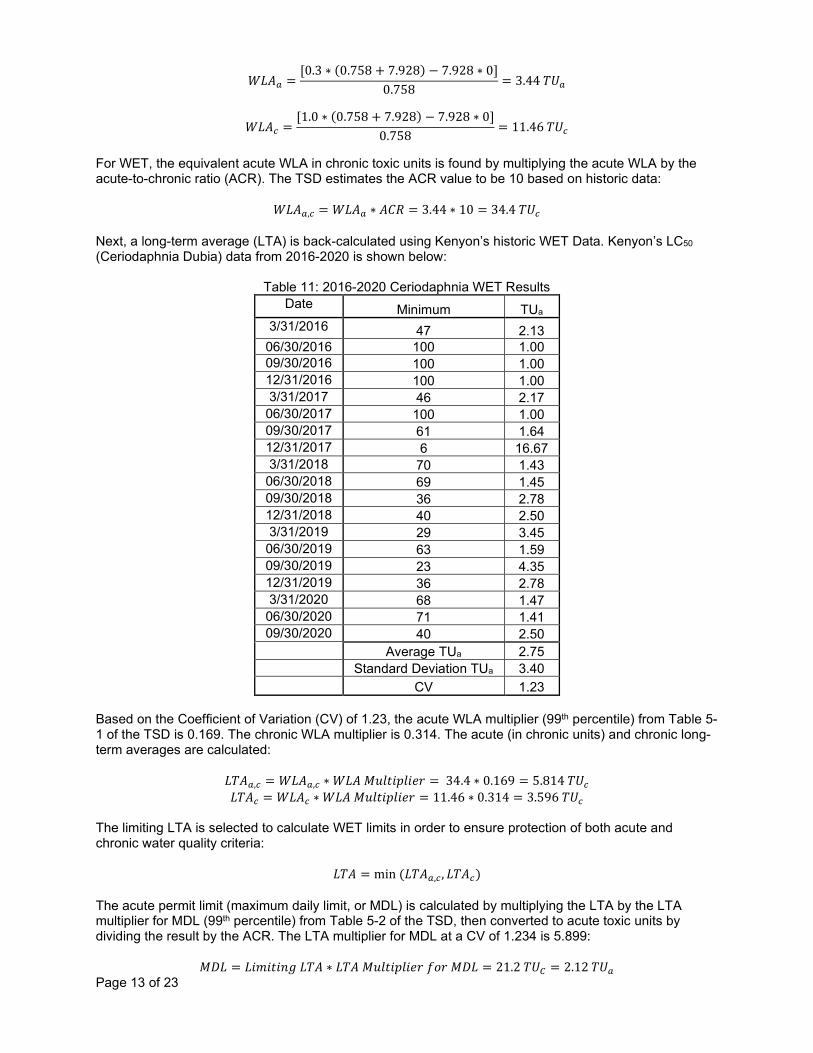
Page 13 of 23
𝑊𝑊𝐿𝐿𝐴𝐴𝑎𝑎 =[0.3 ∗ (0.758 + 7.928) − 7.928 ∗ 0]
0.758= 3.44 𝑇𝑇𝑇𝑇𝑎𝑎
𝑊𝑊𝐿𝐿𝐴𝐴𝑐𝑐 =[1.0 ∗ (0.758 + 7.928) − 7.928 ∗ 0]
0.758= 11.46 𝑇𝑇𝑇𝑇𝑐𝑐
For WET, the equivalent acute WLA in chronic toxic units is found by multiplying the acute WLA by the acute-to-chronic ratio (ACR). The TSD estimates the ACR value to be 10 based on historic data:
𝑊𝑊𝐿𝐿𝐴𝐴𝑎𝑎,𝑐𝑐 = 𝑊𝑊𝐿𝐿𝐴𝐴𝑎𝑎 ∗ 𝐴𝐴𝐶𝐶𝐴𝐴 = 3.44 ∗ 10 = 34.4 𝑇𝑇𝑇𝑇𝑐𝑐 Next, a long-term average (LTA) is back-calculated using Kenyon’s historic WET Data. Kenyon’s LC50 (Ceriodaphnia Dubia) data from 2016-2020 is shown below:
Table 11: 2016-2020 Ceriodaphnia WET Results Date Minimum TUa
3/31/2016 47 2.13 06/30/2016 100 1.00 09/30/2016 100 1.00 12/31/2016 100 1.00 3/31/2017 46 2.17 06/30/2017 100 1.00 09/30/2017 61 1.64 12/31/2017 6 16.67 3/31/2018 70 1.43 06/30/2018 69 1.45 09/30/2018 36 2.78 12/31/2018 40 2.50 3/31/2019 29 3.45 06/30/2019 63 1.59 09/30/2019 23 4.35 12/31/2019 36 2.78 3/31/2020 68 1.47 06/30/2020 71 1.41 09/30/2020 40 2.50
Average TUa 2.75 Standard Deviation TUa 3.40 CV 1.23
Based on the Coefficient of Variation (CV) of 1.23, the acute WLA multiplier (99th percentile) from Table 5-1 of the TSD is 0.169. The chronic WLA multiplier is 0.314. The acute (in chronic units) and chronic long-term averages are calculated:
𝐿𝐿𝑇𝑇𝐴𝐴𝑎𝑎,𝑐𝑐 = 𝑊𝑊𝐿𝐿𝐴𝐴𝑎𝑎,𝑐𝑐 ∗ 𝑊𝑊𝐿𝐿𝐴𝐴 𝑀𝑀𝑝𝑝𝑙𝑙𝑝𝑝𝐿𝐿𝑝𝑝𝑙𝑙𝐿𝐿𝑝𝑝𝑜𝑜 = 34.4 ∗ 0.169 = 5.814 𝑇𝑇𝑇𝑇𝑐𝑐 𝐿𝐿𝑇𝑇𝐴𝐴𝑐𝑐 = 𝑊𝑊𝐿𝐿𝐴𝐴𝑐𝑐 ∗ 𝑊𝑊𝐿𝐿𝐴𝐴 𝑀𝑀𝑝𝑝𝑙𝑙𝑝𝑝𝐿𝐿𝑝𝑝𝑙𝑙𝐿𝐿𝑝𝑝𝑜𝑜 = 11.46 ∗ 0.314 = 3.596 𝑇𝑇𝑇𝑇𝑐𝑐
The limiting LTA is selected to calculate WET limits in order to ensure protection of both acute and chronic water quality criteria:
𝐿𝐿𝑇𝑇𝐴𝐴 = min (𝐿𝐿𝑇𝑇𝐴𝐴𝑎𝑎,𝑐𝑐 , 𝐿𝐿𝑇𝑇𝐴𝐴𝑐𝑐) The acute permit limit (maximum daily limit, or MDL) is calculated by multiplying the LTA by the LTA multiplier for MDL (99th percentile) from Table 5-2 of the TSD, then converted to acute toxic units by dividing the result by the ACR. The LTA multiplier for MDL at a CV of 1.234 is 5.899:
𝑀𝑀𝐷𝐷𝐿𝐿 = 𝐿𝐿𝐿𝐿𝐿𝐿𝐿𝐿𝑝𝑝𝐿𝐿𝐵𝐵𝑘𝑘 𝐿𝐿𝑇𝑇𝐴𝐴 ∗ 𝐿𝐿𝑇𝑇𝐴𝐴 𝑀𝑀𝑝𝑝𝑙𝑙𝑝𝑝𝐿𝐿𝑝𝑝𝑙𝑙𝐿𝐿𝑝𝑝𝑜𝑜 𝑓𝑓𝑜𝑜𝑜𝑜 𝑀𝑀𝐷𝐷𝐿𝐿 = 21.2 𝑇𝑇𝑇𝑇𝐶𝐶 = 2.12 𝑇𝑇𝑇𝑇𝑎𝑎

Page 14 of 23
Since a toxic unit is the inverse of the sample fraction, the reciprocal of the MDL is multiplied by 100 to obtain the LC50 (Ceriodaphnia Dubia) limit:
𝐿𝐿𝐶𝐶50 =1
2.12 𝑇𝑇𝑇𝑇𝑎𝑎∗ 100 = 47.14% ≈ 50%
The same analysis was performed using the Pimephales promelas WET testing data.
Table 12: 2016-2020 Pimphales WET Results Date Minimum TUa
3/31/2016 31 3.23 6/30/2016 70 1.43 9/30/2016 79 1.27 12/31/2016 100 1.00 3/31/2017 100 1.00 6/30/2017 100 1.00 9/30/2017 100 1.00 12/31/2017 100 1.00 3/31/2018 100 1.00 6/30/2018 100 1.00 9/30/2018 88 1.14 12/31/2018 100 1.00 3/31/2019 35 2.86 6/30/2019 100 1.00 9/30/2019 36 2.78 12/31/2019 79 1.27 3/31/2020 100 1.00 6/30/2020 100 1.00 9/30/2020 100 1.00
Average TUa 1.37 Standard Deviation TUa 0.70
CV 0.51 Since the WLA is dependent on effluent flow and available dilution, the LTA was calculated with the CV of 0.51 using the LTA multiplier from Table 5-1 of the TSD (99th percentile), which are 0.366 (acute) and 0.574 (chronic):
𝐿𝐿𝑇𝑇𝐴𝐴𝑎𝑎,𝑐𝑐 = 34.4 ∗ 0.366 = 12.59 𝑇𝑇𝑇𝑇𝑐𝑐 𝐿𝐿𝑇𝑇𝐴𝐴𝑐𝑐 = 11.46 ∗ 0.574 = 6.578 𝑇𝑇𝑇𝑇𝑐𝑐
The limiting LTA is LTAc = 6.578 TUc. The MDL is calculated using the LTA Multiplier from Table 5-2 of the TSD (99th percentile), which at the CV of 0.51 is 2.735:
𝑀𝑀𝐷𝐷𝐿𝐿 = 6.578 ∗ 2.735 = 17.99 𝑇𝑇𝑇𝑇𝑐𝑐 = 1.799 𝑇𝑇𝑇𝑇𝑎𝑎 The LC50 is then calculated:
𝐿𝐿𝐶𝐶50 = 1
1.799∗ 100 = 55.56% ≈ 55%
DEM’s 2018-2020 Final 303(d) List states that the Pawcatuck River is not supporting the Fish and Wildlife habitat designated used due to Whole Effluent Toxicity. The WET limits established in this permit shall ensure that the waterbody supports the designated use.
Nutrients

Page 15 of 23
Kenyon’s previous permit required monitoring for Total Nitrogen and Total Phosphorus. Part §1.10(D)(1) of the Rhode Island Water Quality Regulations states that nutrients shall not be present in freshwaters “in such concentration that would impair any usages assigned to said Class, or cause undesirable or nuisance aquatic species associated with cultural eutrophication.” In freshwater systems, phosphorus is the limiting nutrient and controls the production of aquatic plants and algae in the water. The Pawcatuck River which receives the Kenyon discharge (Waterbody ID RI0008039R-18B) is a Class B1 freshwater according to the Rhode Island Water Quality Regulations. Class B1 waters “are designated for primary and secondary contact recreational activities and fish and wildlife habitat. They shall be suitable for compatible industrial processes and cooling, hydropower, aquacultural uses, navigation, and irrigation and other agricultural uses. These waters shall have good aesthetic value.”
Phosphorus
Compliance Evaluation
In addition to the general freshwater nutrient criteria, the Rhode Island Water Quality Regulations at §1.10(D)(1) state that “phosphates shall be removed from existing discharges to the extent that such removal is or may become technically and reasonable feasible.” In textile wastewaters, dyebath effluents containing phosphate buffers are the main source of phosphorus1. Kenyon’s average monthly effluent concentration for phosphorus is 13.75 mg/L from 2016-2020 as shown in Attachment A. In April of 2016, after the treatment plant had been upgraded to an activated sludge secondary treatment process, Kenyon began using a polyaluminum chloride (PAC) coagulant along with a cationic polymer to remove fine colloidal solids that were interfering with the nitrification process (converting ammonia into nitrite, then nitrate). To improve settling of solids, Kenyon also dosed an anionic polymer beginning in September 2016. The use of PAC and the anionic polymer was discontinued in December 2016. During this time, effluent concentrations of phosphorus were significantly lower than the average concentration from 2016-2020:
Table 13: Kenyon 2016 Total Phosphorus Effluent Data Date Monthly Average (mg/L)
05/31/2016 3.8 06/30/2016 2.9 07/31/2016 2.1 08/31/2016 1.8 09/30/2016 6.9 10/31/2016 1.8 11/30/2016 6.5 12/31/2016 3.5
According to EPA’s Nutrient Control Design Manual, various forms of polyaluminum chloride (PAC) can be used to chemically precipitate and remove phosphorus from wastewater. Kenyon has shown that lower effluent phosphorus concentrations can be achieved through chemical addition in their treatment process. During this time, however, Kenyon also saw violations of their monthly average and daily maximum Aluminum limits (1774 µg/L and 15297 µg/L in the previous permit, respectively) due to the addition of PAC:
Table 14: Kenyon 2016 Aluminum Effluent Data
Date Monthly Average (µg/L)
Daily Maximum (µg/L)
06/30/2016 3568 8450 09/30/2016 4029 16200 12/31/2016 25267 33400
The Whole Effluent Toxicity Data during this time is shown below:
Table 15: Kenyon 2016 WET Data Date LC50 C. Dubia LC50 Pimphales
1Delée W., O’Neill C., Hawkes F.R. and Pinheiro H.M., Anaerobic treatment of textile effluents: A review, J. Chem. Technol. Biotechnol., 73, 323-335 (1998)
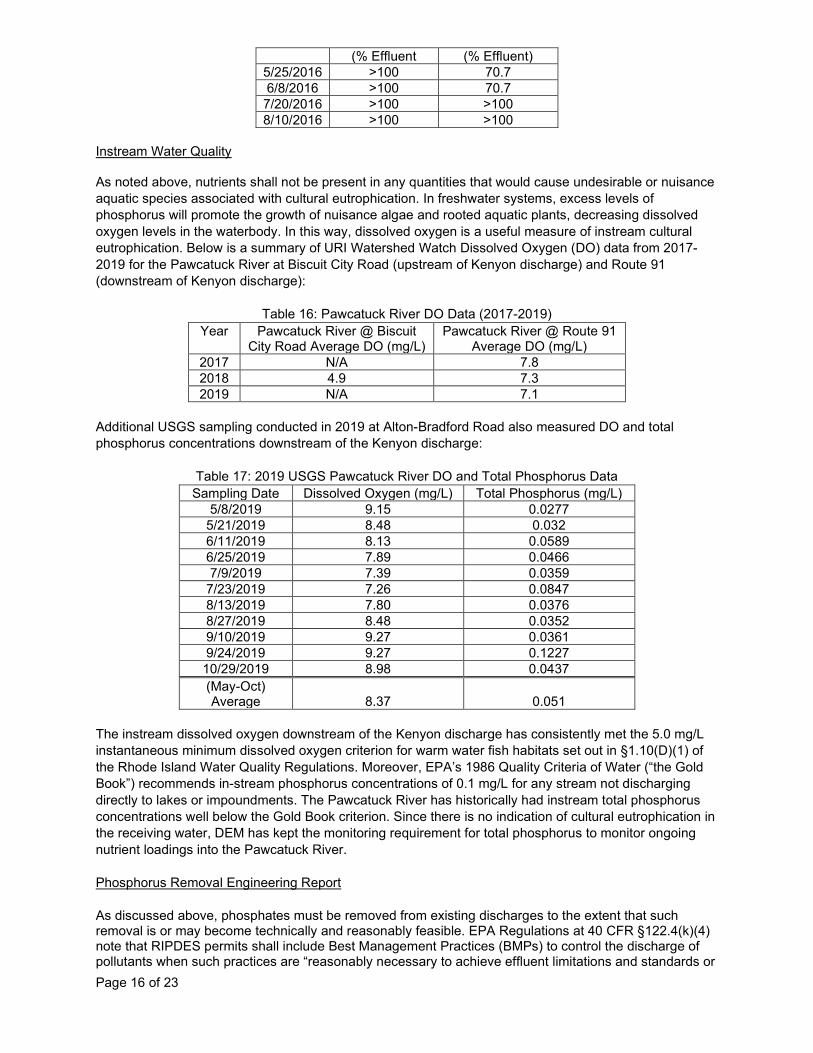
Page 16 of 23
(% Effluent (% Effluent) 5/25/2016 >100 70.7 6/8/2016 >100 70.7 7/20/2016 >100 >100 8/10/2016 >100 >100
Instream Water Quality As noted above, nutrients shall not be present in any quantities that would cause undesirable or nuisance aquatic species associated with cultural eutrophication. In freshwater systems, excess levels of phosphorus will promote the growth of nuisance algae and rooted aquatic plants, decreasing dissolved oxygen levels in the waterbody. In this way, dissolved oxygen is a useful measure of instream cultural eutrophication. Below is a summary of URI Watershed Watch Dissolved Oxygen (DO) data from 2017-2019 for the Pawcatuck River at Biscuit City Road (upstream of Kenyon discharge) and Route 91 (downstream of Kenyon discharge):
Table 16: Pawcatuck River DO Data (2017-2019) Year Pawcatuck River @ Biscuit
City Road Average DO (mg/L) Pawcatuck River @ Route 91
Average DO (mg/L) 2017 N/A 7.8 2018 4.9 7.3 2019 N/A 7.1
Additional USGS sampling conducted in 2019 at Alton-Bradford Road also measured DO and total phosphorus concentrations downstream of the Kenyon discharge:
Table 17: 2019 USGS Pawcatuck River DO and Total Phosphorus Data Sampling Date Dissolved Oxygen (mg/L) Total Phosphorus (mg/L)
5/8/2019 9.15 0.0277 5/21/2019 8.48 0.032 6/11/2019 8.13 0.0589 6/25/2019 7.89 0.0466 7/9/2019 7.39 0.0359
7/23/2019 7.26 0.0847 8/13/2019 7.80 0.0376 8/27/2019 8.48 0.0352 9/10/2019 9.27 0.0361 9/24/2019 9.27 0.1227 10/29/2019 8.98 0.0437 (May-Oct) Average 8.37 0.051
The instream dissolved oxygen downstream of the Kenyon discharge has consistently met the 5.0 mg/L instantaneous minimum dissolved oxygen criterion for warm water fish habitats set out in §1.10(D)(1) of the Rhode Island Water Quality Regulations. Moreover, EPA’s 1986 Quality Criteria of Water (“the Gold Book”) recommends in-stream phosphorus concentrations of 0.1 mg/L for any stream not discharging directly to lakes or impoundments. The Pawcatuck River has historically had instream total phosphorus concentrations well below the Gold Book criterion. Since there is no indication of cultural eutrophication in the receiving water, DEM has kept the monitoring requirement for total phosphorus to monitor ongoing nutrient loadings into the Pawcatuck River. Phosphorus Removal Engineering Report As discussed above, phosphates must be removed from existing discharges to the extent that such removal is or may become technically and reasonably feasible. EPA Regulations at 40 CFR §122.4(k)(4) note that RIPDES permits shall include Best Management Practices (BMPs) to control the discharge of pollutants when such practices are “reasonably necessary to achieve effluent limitations and standards or

Page 17 of 23
to carry out the purposes and intent of the CWA.” The 2016 effluent data has shown that lower concentrations of total phosphorus are achievable in the Kenyon discharge through chemical addition in the treatment process. Since the Water Quality Regulations require Kenyon to remove phosphates from existing discharges to the extent that it is reasonably and technically feasible, Part I.A.20 of the permit requires Kenyon to submit an Engineering Report which evaluates Kenyon’s ability to remove phosphorus from the effluent using chemical addition without resulting in exceedances of any other permit limits. The results of the Engineering Report will be used to determine appropriate phosphorus BMPs for the Kenyon facility. Nitrogen
In saltwater systems, nitrogen is the limiting nutrient and controls the growth of aquatic plants and algae. The Pawcatuck River (which receives the Kenyon discharge) is 31 miles long and drains approximately 70,000 acres of land in southern Rhode Island and eastern Connecticut, ending in the estuarine Tidal Pawcatuck River and Little Narragansett Bay. The Tidal Pawcatuck River (RI0008038E-01A) is identified in the 2018-2020 DEM Section 303(d) List as not supporting the Fish and Wildlife Habitat due to low dissolved oxygen. A Total Maximum Daily Load (TMDL) for this impairment is scheduled to be completed in 2023. The 2018-2020 Impaired Waters Report notes that “RIDEM, in partnership with CT Department of Energy and Environmental Protection, will also undertake efforts to further characterize existing nutrient related conditions in the Tidal Pawcatuck River and Little Narragansett Bay, and work towards development of TMDLs, as relevant and resources allow. RIDEM and CT DEEP will look to collaborate with US EPA and others in this effort.” The TMDL, once completed, will identify the maximum amount of nitrogen that can be received by the watershed while still meeting water quality standards. This permit includes monitoring for the nitrogen components (i.e., nitrate, nitrite, TKN, and ammonia) to ensure that adequate data is collected to assist in the completion of the TMDL. Sludge The previous permit required Kenyon to conform to the conditions and practices in the Rhode Island Sewage Sludge Regulations. Kenyon has since removed the sanitary wastewater source from their wastewater treatment train and now uses an onsite wastewater treatment system (OWTS) for disposal of their domestic wastewater. As such, Kenyon no longer has an Order of Approval for sludge under the Rhode Island Sewage Sludge Regulations. Kenyon is required to follow all applicable rules and regulations for their waste, which is considered a commercial waste under 250-RICR-140-05-1. Non-Contact Cooling Water Limits The Rhode Island Water Quality Regulations establishes freshwater water quality criteria for temperature. This criterion sets the maximum temperature increase as 4oF, and in no case to exceed 83oF. Kenyon discharges non-contact cooling water through outfall 002A. Based on the degree of dilution available at this outfall, it has been determined that the proposed temperature limit of 80oF will be protective of the water quality criteria. Attachment F includes the calculations that were used to verify compliance with the water quality criteria. Groundwater/Stormwater Discharge The permit establishes a new outfall (Outfall 004) for the pumped flow of groundwater and stormwater from under the floor of the Greige Room. Kenyon’s facility is situated in a low-lying area on two sides of the Pawcatuck River between the Towns of Richmond and Charlestown, Rhode Island. As a result, water from the Pawcatuck River can infiltrate the area below the facility, particularly during seasonal high groundwater. A pump located in the “Greige Room” on the Richmond side of the site operates off level controls and serves to pump the accumulated waters from under the floor. Historically, this water that accumulates has been ultimately discharged to the process wastewater treatment system. During periods of heavy rain, floodwater can enter the facility under the floor of the Greige Room and overflow the Ludell sumps. This floodwater, if not diverted out of the facility, can overwhelm the treatment process, resulting in the discharge of untreated process wastewater. Analytical data shows that both the untreated groundwater and floodwater have pollutant concentrations below applicable water quality criteria for B1 freshwaters. Analytical data for this source can be found in Attachment H. RIPDES Regulations at §1.14(F) state that the permittee “shall at all times maintain in good working order

Page 18 of 23
and operate as efficiently as possible all treatment works, facilities, and systems of treatment and control (and related appurtenances) for collection and treatment which are installed or used by the permittee for water pollution control and abatement to achieve compliance with the terms and conditions of the permit.” Moreover, §1.14(B)(2) states that a permittee “shall not achieve any effluent concentration by dilution.” Since the addition of the groundwater discharge to the treatment facility reduces the strength of process wastewater and increases the hydraulic load of the treatment plant, reducing the efficiency of the approved treatment train, and because the addition of non-process water can reduce effluent concentrations of pollutants via dilution, DEM is establishing a new outfall (Outfall 004A) for the discharge of water from under the floor of the Greige Room. Certain chlorinated hydrocarbons have been detected in monitoring wells at the facility. Accordingly, monitoring requirements for Tetrachloroethylene, Trichloroethylene, Trans-dichloroethylene, and Vinyl Chloride have also been included for this outfall. The monitoring requirements for these compounds shall be effective when the gage height of the Pawcatuck River upstream of the Kenyon facility is less than two feet at the time of discharge to ensure that any pollutant concentrations are representative of groundwater and are not diluted by river water collected under the floor. The permit requires Kenyon to install a flowmeter for measuring the amount of water discharged from under the floor of the Greige Room. This is required in order to monitor the mass loading of any pollutants present in the groundwater to the Pawcatuck River. Antibacksliding
Provided below is a brief introduction to Antibacksliding and Antidegradation; as well as a discussion on how the two policies were used to calculate water quality-based limits.
Antibacksliding restricts the level of relaxation of water quality-based limits from the previous permit. Section 303(d)(4) of the Clean Water Act addresses antibacksliding as the following:
1. Standards not attained – For receiving waters that have not attained the applicable water quality
standards, limits based on a TMDL or WLA can only be revised if the water quality standards will be met. This may be done by (i) determining that the cumulative effect of all such revised limits would assure the attainment of such water quality standards; or (ii) removing the designated use which is not being attained in accordance with regulations under Section 303.
2. Standards attained – For receiving waters achieving or exceeding applicable water quality standards, limits can be relaxed if the revision is consistent with the State’s Antidegradation Policy.
Therefore, in order to determine whether backsliding is permissible, the first question that must be asked is whether or not the receiving water is attaining the water quality standard. The Office has determined the most appropriate evaluation of existing water quality is by calculating pollutant levels, which would result after the consideration of all currently valid RIPDES permit limits or historical discharge data (whichever is greater), background data (when available), and any new information (e.g., dilution factors).
Antidegradation
The DEM’s “Policy on the Implementation of the Antidegradation Provisions of the Rhode Island Water Quality Regulations July 2006” (the Policy) established four tiers of water quality protection:
Tier 1. In all surface waters, existing uses and the level of water quality necessary to protect the existing uses shall be maintained and protected. Tier 2. In waters where the existing water quality criteria exceeds the levels necessary to support the propagation of fish and wildlife and recreation in and on the water, that quality shall be maintained and protected except for insignificant changes in water quality as determined by the Director and in accordance with the Antidegradation Implementation Policy, as amended. In addition, the Director may allow significant degradation, which is determined to be necessary to achieve important economic or social benefits to the State in accordance with the Antidegradation Policy. Tier 2½. Where high quality waters constitute Special Resource Protection Waters SRPWs2, there shall be
2 SRPWs are surface waters identified by the Director as having significant recreational or ecological uses.
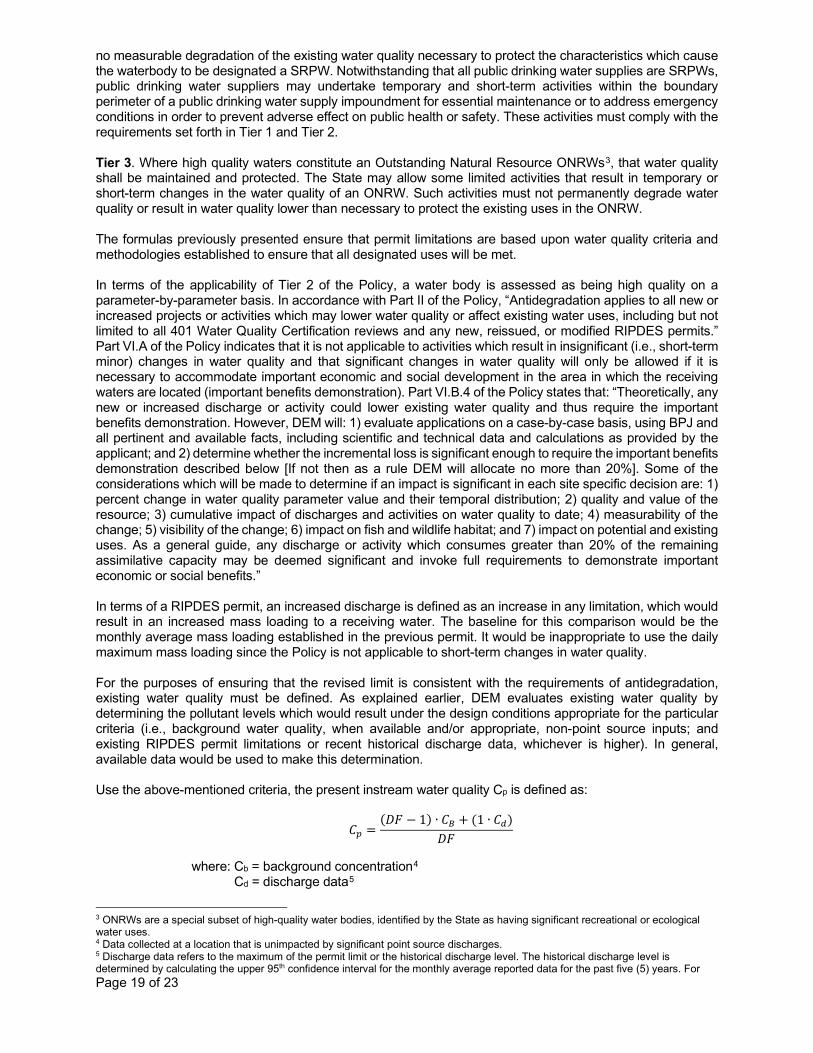
Page 19 of 23
no measurable degradation of the existing water quality necessary to protect the characteristics which cause the waterbody to be designated a SRPW. Notwithstanding that all public drinking water supplies are SRPWs, public drinking water suppliers may undertake temporary and short-term activities within the boundary perimeter of a public drinking water supply impoundment for essential maintenance or to address emergency conditions in order to prevent adverse effect on public health or safety. These activities must comply with the requirements set forth in Tier 1 and Tier 2. Tier 3. Where high quality waters constitute an Outstanding Natural Resource ONRWs3, that water quality shall be maintained and protected. The State may allow some limited activities that result in temporary or short-term changes in the water quality of an ONRW. Such activities must not permanently degrade water quality or result in water quality lower than necessary to protect the existing uses in the ONRW. The formulas previously presented ensure that permit limitations are based upon water quality criteria and methodologies established to ensure that all designated uses will be met. In terms of the applicability of Tier 2 of the Policy, a water body is assessed as being high quality on a parameter-by-parameter basis. In accordance with Part II of the Policy, “Antidegradation applies to all new or increased projects or activities which may lower water quality or affect existing water uses, including but not limited to all 401 Water Quality Certification reviews and any new, reissued, or modified RIPDES permits.” Part VI.A of the Policy indicates that it is not applicable to activities which result in insignificant (i.e., short-term minor) changes in water quality and that significant changes in water quality will only be allowed if it is necessary to accommodate important economic and social development in the area in which the receiving waters are located (important benefits demonstration). Part VI.B.4 of the Policy states that: “Theoretically, any new or increased discharge or activity could lower existing water quality and thus require the important benefits demonstration. However, DEM will: 1) evaluate applications on a case-by-case basis, using BPJ and all pertinent and available facts, including scientific and technical data and calculations as provided by the applicant; and 2) determine whether the incremental loss is significant enough to require the important benefits demonstration described below [If not then as a rule DEM will allocate no more than 20%]. Some of the considerations which will be made to determine if an impact is significant in each site specific decision are: 1) percent change in water quality parameter value and their temporal distribution; 2) quality and value of the resource; 3) cumulative impact of discharges and activities on water quality to date; 4) measurability of the change; 5) visibility of the change; 6) impact on fish and wildlife habitat; and 7) impact on potential and existing uses. As a general guide, any discharge or activity which consumes greater than 20% of the remaining assimilative capacity may be deemed significant and invoke full requirements to demonstrate important economic or social benefits.” In terms of a RIPDES permit, an increased discharge is defined as an increase in any limitation, which would result in an increased mass loading to a receiving water. The baseline for this comparison would be the monthly average mass loading established in the previous permit. It would be inappropriate to use the daily maximum mass loading since the Policy is not applicable to short-term changes in water quality. For the purposes of ensuring that the revised limit is consistent with the requirements of antidegradation, existing water quality must be defined. As explained earlier, DEM evaluates existing water quality by determining the pollutant levels which would result under the design conditions appropriate for the particular criteria (i.e., background water quality, when available and/or appropriate, non-point source inputs; and existing RIPDES permit limitations or recent historical discharge data, whichever is higher). In general, available data would be used to make this determination. Use the above-mentioned criteria, the present instream water quality Cp is defined as:
𝐶𝐶𝑝𝑝 =(𝐷𝐷𝐷𝐷 − 1) ∙ 𝐶𝐶𝐵𝐵 + (1 ∙ 𝐶𝐶𝑑𝑑)
𝐷𝐷𝐷𝐷
where: Cb = background concentration4 Cd = discharge data5
3 ONRWs are a special subset of high-quality water bodies, identified by the State as having significant recreational or ecological water uses. 4 Data collected at a location that is unimpacted by significant point source discharges. 5 Discharge data refers to the maximum of the permit limit or the historical discharge level. The historical discharge level is determined by calculating the upper 95th confidence interval for the monthly average reported data for the past five (5) years. For

Page 20 of 23
DF = dilution factor
In this permit, the monthly average limits for Total Ammonia (May – October and November -- April) was calculated to be higher than the 2010 permit for water quality-based permit limitations. Because this constitutes a relaxation of permit limitations, Antibacksliding and Antidegradation apply. Each of the above-mentioned parameters was evaluated to be consistent with the Department’s Antidegradation policy and relevant regulations. The Antidegradation limit calculations and data are presented in Attachment E of this Fact Sheet. Final Permit Limits Below is a summary of the final permit limits for Kenyon Industries. NOTE: Part I.A of the permit should be referenced for all final permit limitations and other requirements related to monitoring, including sample type. “---” signifies a parameter which must be monitored and data must be reported; no limit has been established at this time.
Production Rate
(lbs/day) Parameter
Monthly Average
(Quantity)
Daily Maximum (Quantity)
Monthly Average (Conc.)
Daily Maximum
(Conc.) Measurement
Frequency Derivation
Outfall 001A (Outlet from Second Aeration Lagoon)
>68,000
BOD5 251 lb/d 502 lb/d 2/Week TBEL COD 3062 lb/d 6125 lb/d 2/Month TBEL TSS 676 lb/d 1353 lb/d 2/Month TBEL
Sulfide 7.6 lb/d 15.2 lb/d 2/Month TBEL pH 6.0 (min.) 9.0 (max.) 2/Week TBEL
Total Chromium 2.28 lb/d 4.56 lb/d 2/Month TBEL Hexavalent Chromium 105 µg/L 149 µg/L 2/Month WQBEL
Phenols 1.90 lb/d 3.80 lb/d 1/Week TBEL
68,000
BOD5 224 lb/d 449 lb/d 2/Week TBEL COD 2740 lb/d 5480 lb/d 2/Month TBEL TSS 605 lb/d 1210 lb/d 2/Month TBEL
Sulfide 6.8 lb/d 13.6 lb/d 2/Month TBEL pH 6.0 (min.) 9.0 (max.) 2/Week TBEL
Total Chromium 2.04 lb/d 4.08 lb/d 2/Month TBEL Hexavalent Chromium 105 µg/L 149 µg/L 2/Month WQBEL
Phenols 1.70 lb/d 3.40 lb/d 1/Week TBEL
60,000
BOD5 198 lb/d 396 lb/d 2/Week TBEL COD 2418 lb/d 4836 lb/d 2/Month TBEL TSS 534 lb/d 1068 lb/d 2/Month TBEL
Sulfide 6.0 lb/d 12.0 lb/d 2/Month TBEL pH 6.0 (min.) 9.0 (max.) 2/Week TBEL
Total Chromium 1.80 lb/d 3.60 lb/d 2/Month TBEL Hexavalent Chromium 105 µg/L 149 µg/L 2/Month WQBEL
Phenols 1.50 lb/d 3.00 lb/d 1/Week TBEL
52,000
BOD5 172 lb/d 343 lb/d 2/Week TBEL COD 2096 lb/d 4191 lb/d 2/Month TBEL TSS 463 lb/d 926 lb/d 2/Month TBEL
Sulfide 5.2 lb/d 10.4 lb/d 2/Month TBEL pH 6.0 (min.) 9.0 (max.) 2/Week TBEL
Total Chromium 1.56 lb/d 3.12 lb/d 2/Month TBEL Hexavalent Chromium 105 µg/L 149 µg/L 2/Month WQBEL
Phenols 1.30 lb/d 2.60 lb/d 1/Week TBEL
44,000 BOD5 145 lb/d 290 lb/d 2/Week TBEL COD 1773 lb/d 3546 lb/d 2/Month TBEL TSS 392 lb/d 783 lb/d 2/Month TBEL
specific cases, changes in treatment efficiency or pretreatment limitations may support the use of an alternative period of time.

Page 21 of 23
Sulfide 4.4 lb/d 8.8 lb/d 2/Month TBEL pH 6.0 (min.) 9.0 (max.) 2/Week TBEL
Total Chromium 1.32 lb/d 2.64 lb/d 2/Month TBEL Hexavalent Chromium 105 µg/L 149 µg/L 2/Month WQBEL
Phenols 1.10 lb/d 2.20 lb/d 1/Week TBEL
36,000
BOD5 119 lb/d 238 lb/d 2/Week TBEL COD 1451 lb/d 2902 lb/d 2/Month TBEL TSS 320 lb/d 641 lb/d 2/Month TBEL
Sulfide 3.6 lb/d 7.2 lb/d 2/Month TBEL pH 6.0 (min.) 9.0 (max.) 2/Week TBEL
Total Chromium 1.08 lb/d 2.16 lb/d 2/Month TBEL Hexavalent Chromium 105 µg/L 149 µg/L 2/Month WQBEL
Phenols 0.90 lb/d 1.80 lb/d 1/Week TBEL
28,000
BOD5 92 lb/d 185 lb/d 2/Week TBEL COD 1128 lb/d 2257 lb/d 2/Month TBEL TSS 249 lb/d 498 lb/d 2/Month TBEL
Sulfide 2.8 lb/d 5.6 lb/d 2/Month TBEL pH 6.0 (min.) 9.0 (max.) 2/Week TBEL
Total Chromium 0.84 lb/d 1.68 lb/d 2/Month TBEL Hexavalent Chromium 105 µg/L 149 µg/L 2/Month WQBEL
Phenols 0.70 lb/d 1.40 lb/d 1/Week TBEL All Flow 0.49 MGD --- MGD Continuous BPJ
All Copper 39.19 µg/L 54.28 µg/L 1/Week WQBEL
All Phenol 51 µg/L 2300 µg/L 1/Quarter WQBEL All Aluminum 797 µg/L 6874 µg/L 1/Quarter WQBEL All Nickel --- µg/L --- µg/L 1/Quarter WQBEL All Zinc --- µg/L --- µg/L 1/Quarter WQBEL All Lead --- µg/L --- µg/L 1/Quarter WQBEL All Cadmium --- µg/L --- µg/L 1/Quarter WQBEL All Silver --- µg/L --- µg/L 1/Quarter WQBEL
All Phosphorus (Nov.- Mar.) --- mg/L --- mg/L 1/Quarter WQBEL
All Phosphorus (Apr.-Oct.) --- mg/L --- mg/L 1/Month WQBEL
All Nitrate (Nov.-Apr.) --- mg/L --- mg/L 1/Quarter WQBEL All Nitrate (May-Oct.) --- mg/L --- mg/L 1/Month WQBEL All Nitrite (Nov.-Apr.) --- mg/L --- mg/L 1/Quarter WQBEL All Nitrite (May-Oct.) --- mg/L --- mg/L 1/Month WQBEL All TKN (Nov.-Apr.) --- mg/L --- mg/L 1/Quarter WQBEL All TKN (May-Oct.) --- mg/L --- mg/L 1/Month WQBEL
All Total Nitrogen (Nov.-Apr.) --- mg/L --- mg/L 1/Quarter WQBEL
All Total Nitrogen (May-Oct.) --- mg/L --- mg/L 1/Month WQBEL
All Ammonia (Nov.-Apr.) 145 mg/L 834 mg/L 1/Month WQBEL All Ammonia (May-Oct.) 68.4 mg/L 429 mg/L 1/Month WQBEL
All Ceriodaphnia Sp. LC50 50% or
Greater 1/Quarter WQBEL
All Pimephales Promelas LC50 55% or
Greater 1/Quarter WQBEL
Outfall 002A (Non-Contact Cooling Water) All Flow 0.12 MGD 1/Month BPJ All Temperature (Intake) ---°F 1/Month WQBEL All Temperature 80°F 1/Month WQBEL All pH --- (min.) --- (max.) 1/Month WQBEL
Outfall 004A (Water from Under the Floor of the Greige Room) All Flow --- MGD --- MGD 1/Month BPJ All Tetrachloro-ethylene --- µg/L --- µg/L 1/Month WQBEL


ATTACHMENTS

ATTACHMENT A – Average Effluent Characteristics 2016-2020
DESCRIPTION OF DISCHARGE: Treated industrial wastewater. DISCHARGE: 001A – Lagoon Discharge
AVERAGE EFFLUENT CHARACTERISTICS AT POINT OF DISCHARGE:
PARAMETER AVERAGE1 MAXIMUM2
FLOW (MGD) 0.32 MGD 0.51 MGD
BOD5 53.54 lbs/day 3 371.00 lbs/day 4
COD 1149.49 lbs/day 3 2219.00 lbs/day 4
TSS 175.96 lbs/day 3 729.00 lbs/day 4
Sulfide 0.16 lbs/day 3 1.84 lbs/day 4
pH 5.6 S.U.(Minimum) 5 6.9 S.U.(Maximum) 6
Chromium (Total) 0.48 lbs/day 3 1.57 lbs/day 4
Phenols 0.17 lbs/day 3 0.71 lbs/day 4
Copper 139.68 µg/l 254.00 µg/l
Lead 0.67 µg/l 1.29 µg/l
Cadmium 0.00 µg/l 0.00 µg/l
Silver 0.00 µg/l 0.00 µg/l
Chlorine 30.79 µg/l 59.83 µg/l
Nickel 10.16 µg/l 11.84 µg/l
Aluminum7 850.27 µg/l 871.93 µg/l
Zinc 44.16 µg/l 46.68 µg/l
Nitrogen, Nitrate 32.85 mg/l 34.85 mg/l
Nitrogen, Nitrite 0.40 mg/l 0.53 mg/l
Nitrogen, Total 65.49 mg/l 67.34 mg/l
Nitrogen, Total Kjeldahl 32.62 mg/l 33.72 mg/l
Nitrogen, Ammonia (May-Oct) 9.57 mg/l 16.01 mg/l (Nov-Apr) 16.23 mg/l 21.96 mg/l
Phosphorus 13.75 mg/l 13.98 mg/l
1Data represents the mean of the monthly average data from January 2016 – November 2020. 2Data represents the mean of the daily maximum data from January 2016 – November 2020. 3Values represent the mean of the monthly average values for outfalls 001A to 001G 4Values represent the maximum of the daily maximum values for outfalls 001A to 001G 5Values represent the minimum value for outfalls 001A to 001G 6Values represent the maximum value for outfalls 001A to 001G 7Values from 2017-2020. Kenyon used a coagulant containing aluminum in their treatment process in 2016.

Whole Effluent Toxicity Testing Results (percent effluent) Species: Ceriodaphnia Dubia Species: Pimephales Promelas
Monitoring Quarter LC50 Result LC50 Result 03/31/2016 =47 % =31 % 06/30/2016 =100 % =70.7 % 09/30/2016 =100 % =79.4 % 12/31/2016 =100 % =100 % 03/31/2017 =16 % =100 % 06/30/2017 =100 % =100 % 09/30/2017 =61.6 % =100 % 12/31/2017 =6.25 % =100 % 03/31/2018 =70.7 % =100 % 06/30/2018 =69.4 % =100 % 09/30/2018 =36.6 % =88.6 % 12/31/2018 =40.6 % =100 % 03/31/2019 =29.7 % =35.2 % 06/30/2019 =63.7 % =100 % 09/30/2019 =23.3 % =36 % 12/31/2019 =36.6 % =79.5 % 03/31/2020 =68.3 % =100 % 06/30/2020 =71.1 % =100 % 09/30/2020 =40.6 % =100 %
DISCHARGE: 002A – Non Contact Cooling Water
AVERAGE EFFLUENT CHARACTERISTICS AT POINT OF DISCHARGE:
PARAMETER AVERAGE1 MAXIMUM2
FLOW (MGD) 0.047 (30DA AVG MGD)
pH 5.8 S.U.(Minimum) 6.9 S.U.(Maximum)
Temperature (Intake) 62.7 deg F 75.2 deg F
Temperature 63.6 deg F 79.5 deg F
1Data represents the mean of the monthly average data from January 2016 – November 2020. 2Data represents the mean of the daily maximum data from January 2016 – November 2020.

ATTACHMENT B Site Plan and Wastewater Treatment Process Flow Diagram


ATTACHMENT C Summary of Applicable Water Quality Based Limits

Water Quality Based Effluent Limits - Freshwater
NOTE: LIMITS BASED ON RI WATER QUALITY CRITERIA 250-RICR-150-05-1 effective 08/19/2018
FACILITY NAME: Kenyon WWTFRIPDES PERMIT #: RI0000191
DISSOLVED ACUTE CHRONIC DESIGN FLOW = 0.490 MGDBACKGROUND METAL METAL = 0.758 CFS
DATA (ug/L) TRANSLATOR TRANSLATOR 7Q10 FLOW = 7.928 CFSALUMINUM NA NA NA 7Q10 (JUNE-OCT) = 7.928 CFS
ARSENIC NA 1 1 7Q10 (NOV-MAY) = 16.142 CFSCADMIUM NA 0.982200908 0.947200908 30Q5 FLOW = 54.104 CFS
CHROMIUM III NA 0.316 0.86 HARMONIC FLOW = 54.104 CFSCHROMIUM VI NA 0.982 0.962
COPPER NA 0.96 0.96
LEAD NA 0.924043201 0.924043201 ACUTE = 11.457MERCURY NA 0.85 0.85 CHRONIC = 11.457
NICKEL NA 0.998 0.997 (MAY-OCT) = 11.457SELENIUM NA NA NA (NOV-APR) = 22.289
SILVER NA 0.85 NA 30Q5 FLOW = 72.359ZINC NA 0.978 0.986 HARMONIC FLOW = 72.359
AMMONIA (as N) NA
NOTE 1: METAL TRANSLATORS FROM RI WATERQUALITY REGS 250-RICR-150-05-1 §1.26(J)(8).
6.6 S.U.40.1 (mg/L as CaCO3)
DILUTION FACTORS
FACILITY SPECIFIC DATA INPUT SHEET
FLOW DATA
USE NA WHEN NO DATA IS AVAILABLE
CALCULATION OF WATER QUALITY BASED NON-CLASS AA FRESHWATER DISCHARGE LIMITS
HARDNESS =pH =
2019 Water Quality Based Limits (Rev 1) Page 1 5/19/2021

Water Quality Based Effluent Limits - Freshwater
FACILITY NAME: Kenyon WWTF RIPDES PERMIT #: RI0000191
Upper 90th% Upper 90th% Acute Criteria 1 Chronic Criteria 2
Temp pH mg/L as N mg/L as N
May 26 6.6 46.8 3.13Jun 26 6.6 46.8 3.13Jul 26 6.6 46.8 3.13Aug 26 6.6 46.8 3.13Sep 26 6.6 46.8 3.13Oct 26 6.6 46.8 3.13Nov 15 6.6 46.8 6.27Dec 15 6.6 46.8 6.27Jan 15 6.6 46.8 6.27Feb 15 6.6 46.8 6.27Mar 15 6.6 46.8 6.27Apr 15 6.6 46.8 6.27
Month
CALCULATION OF WATER QUALITY BASED NON-CLASS AA FRESHWATER DISCHARGE LIMITS
NOTE 1: Criteria based on 250-RICR-150-05-1 §1.26(L)(1)(a) Acute Criteria as Total Ammonia Nitrogen (mg N/L) with Salmonids absentNOTE 2: Criteria based on 250-RICR-150-05-1 §1.26(L)(1)(b) Chronic Criteria for Fish Early Life Stages Present, (mg N/L)
2019 Water Quality Based Limits (Rev 1) Page 2 5/19/2021

Water Quality Based Effluent Limits - Freshwater
FACILITY NAME: Kenyon WWTF RIPDES PERMIT #: RI0000191
HUMAN HEALTHBACKGROUND NON-CLASS A
CHEMICAL NAME CAS # CONCENTRATION CRITERIA(ug/L) (ug/L)
PRIORITY POLLUTANTS:TOXIC METALS AND CYANIDEANTIMONY 7440360 NA 640ARSENIC (limits are total recoverable) 7440382 NA 1.4ASBESTOS 1332214 NABERYLLIUM 7440417 NACADMIUM (limits are total recoverable) 7440439 NACHROMIUM III (limits are total recoverable) 16065831 NACHROMIUM VI (limits are total recoverable) 18540299 NACOPPER (limits are total recoverable) 7440508 NACYANIDE 57125 NA 140LEAD (limits are total recoverable) 7439921 NAMERCURY (limits are total recoverable) 7439976 NA 0.15NICKEL (limits are total recoverable) 7440020 NA 4600SELENIUM (limits are total recoverable) 7782492 NA 4200SILVER (limits are total recoverable) 7440224 NATHALLIUM 7440280 NA 0.47ZINC (limits are total recoverable) 7440666 NA 26000VOLATILE ORGANIC COMPOUNDSACROLEIN 107028 NA 290ACRYLONITRILE 107131 NA 2.5BENZENE 71432 NA 510BROMOFORM 75252 NA 1400CARBON TETRACHLORIDE 56235 NA 16CHLOROBENZENE 108907 NA 1600CHLORODIBROMOMETHANE 124481 NA 130CHLOROFORM 67663 NA 4700DICHLOROBROMOMETHANE 75274 NA 1701,2DICHLOROETHANE 107062 NA 3701,1DICHLOROETHYLENE 75354 NA 71001,2DICHLOROPROPANE 78875 NA 1501,3DICHLOROPROPYLENE 542756 NA 21ETHYLBENZENE 100414 NA 2100BROMOMETHANE (methyl bromide) 74839 NA 1500CHLOROMETHANE (methyl chloride) 74873 NAMETHYLENE CHLORIDE 75092 NA 59001,1,2,2TETRACHLOROETHANE 79345 NA 40TETRACHLOROETHYLENE 127184 NA 33TOLUENE 108883 NA 150001,2TRANSDICHLOROETHYLENE 156605 NA 100001,1,1TRICHLOROETHANE 71556 NA1,1,2TRICHLOROETHANE 79005 NA 160TRICHLOROETHYLENE 79016 NA 300VINYL CHLORIDE 75014 NA 2.4ACID ORGANIC COMPOUNDS2CHLOROPHENOL 95578 NA 1502,4DICHLOROPHENOL 120832 NA 290
26.579707920.16391634
578874.7958No Criteria
183.3083303
138.929951
1961.39913591.6541651748.57670754128.3158312
531.5941581215.637071329.9549946
No Criteria86831.21937
293.29332869840.8715291200.669564119.1504147
54.07595745302.4587451274.9624955164.9774973
No Criteria9.165416517506.6265519
76.98949875
9.1203794858.30278908220.825851145.82708259
0.549924991
104.8020639.18748526
373.9368877
47.66016589
MONTHLY AVELIMIT(ug/L)
91.6541651781.04247142No Criteria
1.5581208081.261034146
2.92.2
43
36
21410
1311358
3018
32
54.50202718
8.45.933
0.06
24.021098565
NA1
5.20.919502636
0.77
0.170.130321703
1135.08686406
4.104558236
3116.2416164124.437433
FRESHWATERCRITERIACHRONIC
(ug/L)
10150
1986.191742
No Criteria
15.09598015234.044534201.639163454.28004876149.3346887
7.72800522168.74062388
7823.497887
421.60915987.736047697183.3083303
12510.79355
2428.8353773464.527444
506.6265519
26.5797079
13427.3352
No Criteria13244.02687
7286.506131
1182.338731
No Criteria
8248.874866No Criteria
17872.56221
5820.039489
925.7070683
20
No Criteria
No Criteria
14664.66643No Criteria
No Criteria24059.218365315.9415854075.95745
88446.26939
2199.699964
394.1129102
5.314
129
1950
101
2625
1600
9650466240
1445
5900580
0.71744044946
54.05982006
3782.9
23.596010061.4
216.271606920
5.68537684122
450340
7.50.828162445
16269.7340953
(ug/L)
CALCULATION OF WATER QUALITY BASED NON-CLASS AA FRESHWATER DISCHARGE LIMITS
FRESHWATERCRITERIA
ACUTEDAILY MAX
LIMIT(ug/L)
NOTE: METALS CRITERIA ARE EXPRESSED AS DISSOLVED, METALS LIMITS ARE EXPRESSED AS TOTAL
No Criteria 7525.372346
26514651365795
635
900
4271.084097
2019 Water Quality Based Limits (Rev 1) Page 3 5/19/2021

Water Quality Based Effluent Limits - Freshwater
FACILITY NAME: Kenyon WWTF RIPDES PERMIT #: RI0000191
HUMAN HEALTHBACKGROUND NON-CLASS A
CHEMICAL NAME CAS # CONCENTRATION CRITERIA(ug/L) (ug/L)
MONTHLY AVELIMIT(ug/L)
FRESHWATERCRITERIACHRONIC
(ug/L)(ug/L)
CALCULATION OF WATER QUALITY BASED NON-CLASS AA FRESHWATER DISCHARGE LIMITS
FRESHWATERCRITERIA
ACUTEDAILY MAX
LIMIT(ug/L)
NOTE: METALS CRITERIA ARE EXPRESSED AS DISSOLVED, METALS LIMITS ARE EXPRESSED AS TOTAL
2,4DIMETHYLPHENOL 105679 NA 8504,6DINITRO2METHYL PHENOL 534521 NA 2802,4DINITROPHENOL 51285 NA 53004NITROPHENOL 88755 NAPENTACHLOROPHENOL 87865 NA 30PHENOL 108952 NA 17000002,4,6TRICHLOROPHENOL 88062 NA 24BASE NEUTRAL COMPUNDSACENAPHTHENE 83329 NA 990ANTHRACENE 120127 NA 40000BENZIDINE 92875 NA 0.002POLYCYCLIC AROMATIC HYDROCARBONS NA 0.18BIS(2CHLOROETHYL)ETHER 111444 NA 5.3BIS(2CHLOROISOPROPYL)ETHER 108601 NA 65000BIS(2ETHYLHEXYL)PHTHALATE 117817 NA 22BUTYL BENZYL PHTHALATE 85687 NA 19002CHLORONAPHTHALENE 91587 NA 16001,2DICHLOROBENZENE 95501 NA 13001,3DICHLOROBENZENE 541731 NA 9601,4DICHLOROBENZENE 106467 NA 1903,3DICHLOROBENZIDENE 91941 NA 0.28DIETHYL PHTHALATE 84662 NA 44000DIMETHYL PHTHALATE 131113 NA 1100000DI-n-BUTYL PHTHALATE 84742 NA 45002,4DINITROTOLUENE 121142 NA 341,2DIPHENYLHYDRAZINE 122667 NA 2FLUORANTHENE 206440 NA 140FLUORENE 86737 NA 5300HEXACHLOROBENZENE 118741 NA 0.0029HEXACHLOROBUTADIENE 87683 NA 180HEXACHLOROCYCLOPENTADIENE 77474 NA 1100HEXACHLOROETHANE 67721 NA 33ISOPHORONE 78591 NA 9600NAPHTHALENE 91203 NANITROBENZENE 98953 NA 690N-NITROSODIMETHYLAMINE 62759 NA 30N-NITROSODI-N-PROPYLAMINE 621647 NA 5.1N-NITROSODIPHENYLAMINE 86306 NA 60PYRENE 129000 NA 40001,2,4trichlorobenzene 120821 NA 70PESTICIDES/PCBsALDRIN 309002 NA 0.0005Alpha BHC 319846 NA 0.049Beta BHC 319857 NA 0.17Gamma BHC (Lindane) 58899 NA 1.8CHLORDANE 57749 NA 0.00814,4DDT 50293 NA 0.0022
0.0394112910.009165417
0.028943742.8364865
9.840871529104.1974632
295.226145959.57520736
15.58120808231549.9183
1191.50414723.83008295274.96249551736.624387
0.16787369110419.746320.07332333210.08195817
339.1204111
311.62416162.8412791240.32783268
260493.6581
79.739123710.9984998216.20849428531.594158
306.80364183762686.173
17.41429138
16.49774973
3.299549946
17.414291382315499.183
10.41974632
6.324137397No Criteria
0.35985371651.3263325
21.9969996416208.49428
0.00430.001
1.7
30
6.5
0.0081.11302.6
0.314.4
5837
34
1.88.7
12
1.2
0.0392621245.6
0.36
1.9
2.4
0.69284.127912No Criteria
971.5341508
146.64666432300.5195460.46904448No Criteria
No CriteriaNo Criteria
No Criteria779.060404
No Criteria
3574.512442724.0679049
779.060404
No Criteria5086.806167
15122.9372523875.91003No Criteria513.263325
3.207895781No CriteriaNo Criteria
1823.917887
53617.68663449.1054094
2685.46704No Criteria
No CriteriaNo Criteria
No CriteriaNo Criteria
27.49624955
687.4062388
10.0819581721.996999648.707145692
0.115774959
12373.31231054.022899
109.98499821.9
306803.6418
4958501151350
7939056
106
31
0.051175468
2605
25116
85
85555
No Criteria
No Criteria 92619.96733
199128.315831214206.3956
1650
155014
No Criteria
0.35
293
75
3
0.952.41.1
2019 Water Quality Based Limits (Rev 1) Page 4 5/19/2021

Water Quality Based Effluent Limits - Freshwater
FACILITY NAME: Kenyon WWTF RIPDES PERMIT #: RI0000191
HUMAN HEALTHBACKGROUND NON-CLASS A
CHEMICAL NAME CAS # CONCENTRATION CRITERIA(ug/L) (ug/L)
MONTHLY AVELIMIT(ug/L)
FRESHWATERCRITERIACHRONIC
(ug/L)(ug/L)
CALCULATION OF WATER QUALITY BASED NON-CLASS AA FRESHWATER DISCHARGE LIMITS
FRESHWATERCRITERIA
ACUTEDAILY MAX
LIMIT(ug/L)
NOTE: METALS CRITERIA ARE EXPRESSED AS DISSOLVED, METALS LIMITS ARE EXPRESSED AS TOTAL
4,4DDE 72559 NA 0.00224,4DDD 72548 NA 0.0031DIELDRIN 60571 NA 0.00054ENDOSULFAN (alpha) 959988 NA 89ENDOSULFAN (beta) 33213659 NA 89ENDOSULFAN (sulfate) 1031078 NA 89ENDRIN 72208 NA 0.06ENDRIN ALDEHYDE 7421934 NA 0.3HEPTACHLOR 76448 NA 0.00079HEPTACHLOR EPOXIDE 1024573 NA 0.00039POLYCHLORINATED BIPHENYLS3 1336363 NA 0.000642,3,7,8TCDD (Dioxin) 1746016 NA 0.000000051TOXAPHENE 8001352 NA 0.0028TRIBUTYLTIN NANON PRIORITY POLLUTANTS:OTHER SUBSTANCESALUMINUM (limits are total recoverable) 7429905 NAAMMONIA as N(winter/summer) 7664417 NA 46.8 46.8 834515.1322 428941.493 6.27 3.13 111803.6299 28687.75374BROMOPHENYL PHENYL ETHER NACHLORIDE 16887006 NACHLORINE 7782505 NA4CHLORO2METHYLPHENOL NA1CHLORONAPHTHALENE NA4CHLOROPHENOL 106489 NA2,4DICHLORO6METHYLPHENOL NA1,1DICHLOROPROPANE NA1,3DICHLOROPROPANE 142289 NA2,3DINITROTOLUENE NA2,4DINITRO6METHYL PHENOL NAIRON 7439896 NApentachlorobenzene 608935 NAPENTACHLOROETHANE NA1,2,3,5tetrachlorobenzene NA1,1,1,2TETRACHLOROETHANE 630206 NA2,3,4,6TETRACHLOROPHENOL 58902 NA2,3,5,6TETRACHLOROPHENOL NA2,4,5TRICHLOROPHENOL 95954 NA2,4,6TRINITROPHENOL 88062 NAXYLENE 1330207 NA
861.5491526
65.07445727
1.4664666431.7414291384.674362424
201.6391634
3.3912041112.383008295
2.56631662573.32333214
9165.416517
16.4977497339.411291024.399399928238.300829561.40829067
0.001833083
797.391237
126.02447712.932933286
3.666166607
0.659909989
2108045.799
0.0348285830.0225761170.0370479872.95226E-06
0.0312592390.513263325
0.32995499517.36624387
0.1273524550.179451187
94
0.26
0.288
0.16
1000
0.190.51
227.1
4.30.4826
0.376.7
0.4
0.014
0.0002
87
0.072
0.036
0.00380.0038
0.0560.056
No Criteria
No Criteria
2942.0987023317.880779119.1504147
109.9849982No Criteria
38815.53895210.804579977.906040464.15791562
133 1219.000397 3 27.49624955
155.8120808
10540.22899
4235
321
78.5
2777.121205
2.016391634 0.056 0.513263325
6.690754058
4.766016589No Criteria0.78822582
164.9774973
6874.062388
2.016391634
201.63916341759.759971
No Criteria4.766016589
4.216091598
No Criteria 5151.985683
0.52
2.199699964No Criteria
22
36213
303
18
1150
1712
0.52
980
0.73
750
0.46
23
860000
1580
192
0.22
0.086
0.22
0.321.8
8982.108187
0.24
7882258.205 230000
733.2333214137.4812478217.6786423 1119
2019 Water Quality Based Limits (Rev 1) Page 5 5/19/2021

Water Quality Based Effluent Limits - Freshwater
FACILITY NAME: Kenyon WWTF RIPDES PERMIT #: RI0000191
DAILY MAX MONTHLY AVE DAILY MAX MONTHLY AVECHEMICAL NAME CAS# LIMIT LIMIT CHEMICAL NAME CAS# LIMIT LIMIT
(ug/L) (ug/L) (ug/L) (ug/L)
PRIORITY POLLUTANTS: TETRACHLOROETHYLENE 127184 2199.70 48.58TOXIC METALS AND CYANIDE TOLUENE 108883 5820.04 128.32ANTIMONY 7440360 4124.44 91.65 1,2TRANSDICHLOROETHYLENE 156605 No Criteria 578874.80ARSENIC, TOTAL 7440382 3116.24 81.04 1,1,1TRICHLOROETHANE 71556 No Criteria 0.00000ASBESTOS 1332214 No Criteria 0.00000 1,1,2TRICHLOROETHANE 79005 8248.87 183.31BERYLLIUM 7440417 68.74 1.56 TRICHLOROETHYLENE 79016 17872.56 394.11CADMIUM, TOTAL 7440439 7.73 1.26103 VINYL CHLORIDE 75014 No Criteria 138.93CHROMIUM III, TOTAL 16065831 7823.50 373.94 ACID ORGANIC COMPOUNDSCHROMIUM VI, TOTAL 18540299 149.33 104.80 2CHLOROPHENOL 95578 1182.34 26.58COPPER, TOTAL 7440508 54.28 39.19 2,4DICHLOROPHENOL 120832 925.71 20.16CYANIDE 57125 201.64 47.66 2,4DIMETHYLPHENOL 105679 971.53 22.00LEAD, TOTAL 7439921 234.04 9.12 4,6DINITRO2METHYL PHENOL 534521 No Criteria 16208.49MERCURY, TOTAL 7439976 15.10 8.30 2,4DINITROPHENOL 51285 284.13 6.32NICKEL, TOTAL 7440020 1986.19 220.83 4NITROPHENOL 88755 No Criteria 0.00000SELENIUM, TOTAL 7782492 183.31 45.83 PENTACHLOROPHENOL 87865 0.47 0.35985SILVER, TOTAL 7440224 7.74 No Criteria PHENOL 108952 2300.52 51.33THALLIUM 7440280 421.61 9.17 2,4,6TRICHLOROPHENOL 88062 146.65 3.30ZINC, TOTAL 7440666 506.63 506.63 BASE NEUTRAL COMPUNDSVOLATILE ORGANIC COMPOUNDS ACENAPHTHENE 83329 779.06 17.41ACROLEIN 107028 26.58 0.54992 ANTHRACENE 120127 No Criteria 2315499.18ACRYLONITRILE 107131 3464.53 76.99 BENZIDINE 92875 No Criteria 0.11577BENZENE 71432 2428.84 54.08 PAHs No Criteria 10.42BROMOFORM 75252 13427.34 302.46 BIS(2CHLOROETHYL)ETHER 111444 No Criteria 306.80CARBON TETRACHLORIDE 56235 12510.79 274.96 BIS(2CHLOROISOPROPYL)ETHER 108601 No Criteria 3762686.17CHLOROBENZENE 108907 7286.51 164.98 BIS(2ETHYLHEXYL)PHTHALATE 117817 5086.81 109.98CHLORODIBROMOMETHANE 124481 No Criteria 7525.37 BUTYL BENZYL PHTHALATE 85687 779.06 17.41CHLOROFORM 67663 13244.03 293.29 2CHLORONAPHTHALENE 91587 No Criteria 92619.97DICHLOROBROMOMETHANE 75274 No Criteria 9840.87 1,2DICHLOROBENZENE 95501 724.07 16.501,2DICHLOROETHANE 107062 54075.96 1200.67 1,3DICHLOROBENZENE 541731 3574.51 79.741,1DICHLOROETHYLENE 75354 5315.94 119.15 1,4DICHLOROBENZENE 106467 513.26 11.001,2DICHLOROPROPANE 78875 24059.22 531.59 3,3DICHLOROBENZIDENE 91941 No Criteria 16.211,3DICHLOROPROPYLENE 542756 No Criteria 1215.64 DIETHYL PHTHALATE 84662 23875.91 531.59ETHYLBENZENE 100414 14664.67 329.95 DIMETHYL PHTHALATE 131113 15122.94 339.12BROMOMETHANE (methyl bromide) 74839 No Criteria 86831.22 DI-n-BUTYL PHTHALATE 84742 No Criteria 260493.66CHLOROMETHANE (methyl chloride) 74873 No Criteria 0.00000 2,4DINITROTOLUENE 121142 14206.40 311.62METHYLENE CHLORIDE 75092 88446.27 1961.40 1,2DIPHENYLHYDRAZINE 122667 128.32 2.841,1,2,2TETRACHLOROETHANE 79345 4271.08 91.65 FLUORANTHENE 206440 1823.92 40.33FLUORENE 86737 No Criteria 306803.64 NON PRIORITY POLLUTANTS:HEXACHLOROBENZENE 118741 No Criteria 0.16787 OTHER SUBSTANCES
CALCULATION OF WATER QUALITY BASED NON-CLASS AA FRESHWATER DISCHARGE LIMITS
2019 Water Quality Based Limits (Rev 1) Page 6 5/19/2021
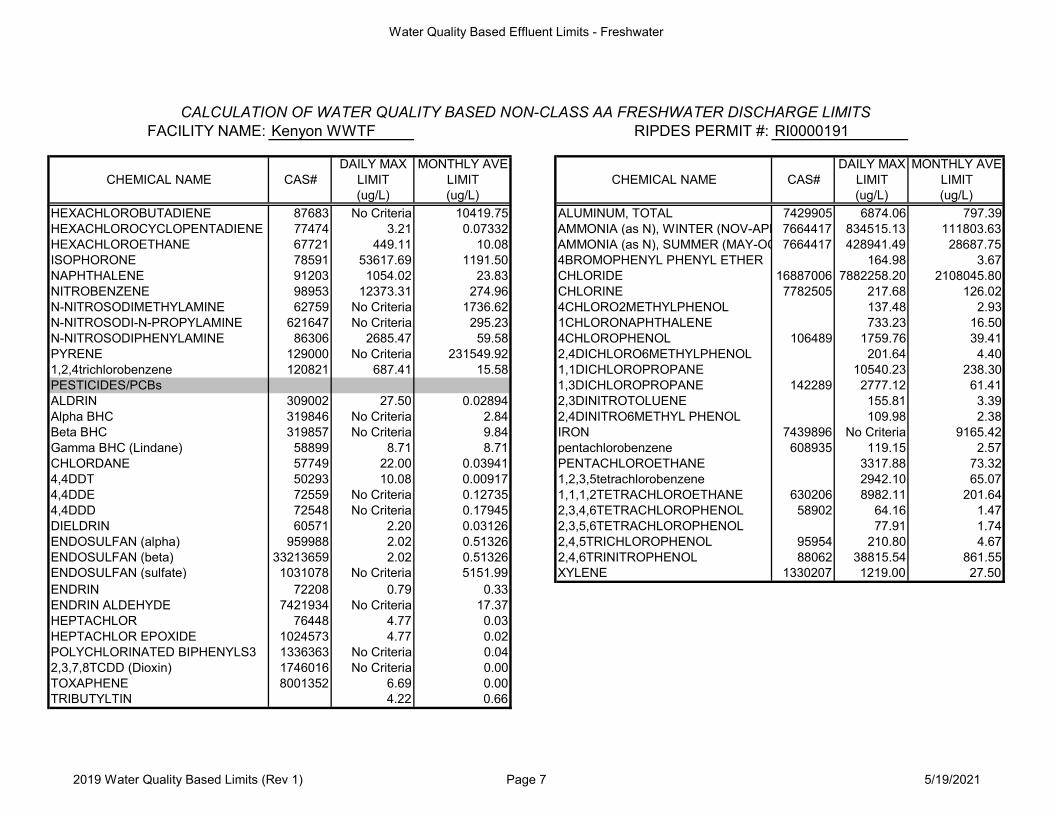
Water Quality Based Effluent Limits - Freshwater
FACILITY NAME: Kenyon WWTF RIPDES PERMIT #: RI0000191
DAILY MAX MONTHLY AVE DAILY MAX MONTHLY AVECHEMICAL NAME CAS# LIMIT LIMIT CHEMICAL NAME CAS# LIMIT LIMIT
(ug/L) (ug/L) (ug/L) (ug/L)
CALCULATION OF WATER QUALITY BASED NON-CLASS AA FRESHWATER DISCHARGE LIMITS
HEXACHLOROBUTADIENE 87683 No Criteria 10419.75 ALUMINUM, TOTAL 7429905 6874.06 797.39HEXACHLOROCYCLOPENTADIENE 77474 3.21 0.07332 AMMONIA (as N), WINTER (NOV-APR) 7664417 834515.13 111803.63HEXACHLOROETHANE 67721 449.11 10.08 AMMONIA (as N), SUMMER (MAY-OCT) 7664417 428941.49 28687.75ISOPHORONE 78591 53617.69 1191.50 4BROMOPHENYL PHENYL ETHER 164.98 3.67NAPHTHALENE 91203 1054.02 23.83 CHLORIDE 16887006 7882258.20 2108045.80NITROBENZENE 98953 12373.31 274.96 CHLORINE 7782505 217.68 126.02N-NITROSODIMETHYLAMINE 62759 No Criteria 1736.62 4CHLORO2METHYLPHENOL 137.48 2.93N-NITROSODI-N-PROPYLAMINE 621647 No Criteria 295.23 1CHLORONAPHTHALENE 733.23 16.50N-NITROSODIPHENYLAMINE 86306 2685.47 59.58 4CHLOROPHENOL 106489 1759.76 39.41PYRENE 129000 No Criteria 231549.92 2,4DICHLORO6METHYLPHENOL 201.64 4.401,2,4trichlorobenzene 120821 687.41 15.58 1,1DICHLOROPROPANE 10540.23 238.30PESTICIDES/PCBs 1,3DICHLOROPROPANE 142289 2777.12 61.41ALDRIN 309002 27.50 0.02894 2,3DINITROTOLUENE 155.81 3.39Alpha BHC 319846 No Criteria 2.84 2,4DINITRO6METHYL PHENOL 109.98 2.38Beta BHC 319857 No Criteria 9.84 IRON 7439896 No Criteria 9165.42Gamma BHC (Lindane) 58899 8.71 8.71 pentachlorobenzene 608935 119.15 2.57CHLORDANE 57749 22.00 0.03941 PENTACHLOROETHANE 3317.88 73.324,4DDT 50293 10.08 0.00917 1,2,3,5tetrachlorobenzene 2942.10 65.074,4DDE 72559 No Criteria 0.12735 1,1,1,2TETRACHLOROETHANE 630206 8982.11 201.644,4DDD 72548 No Criteria 0.17945 2,3,4,6TETRACHLOROPHENOL 58902 64.16 1.47DIELDRIN 60571 2.20 0.03126 2,3,5,6TETRACHLOROPHENOL 77.91 1.74ENDOSULFAN (alpha) 959988 2.02 0.51326 2,4,5TRICHLOROPHENOL 95954 210.80 4.67ENDOSULFAN (beta) 33213659 2.02 0.51326 2,4,6TRINITROPHENOL 88062 38815.54 861.55ENDOSULFAN (sulfate) 1031078 No Criteria 5151.99 XYLENE 1330207 1219.00 27.50ENDRIN 72208 0.79 0.33ENDRIN ALDEHYDE 7421934 No Criteria 17.37HEPTACHLOR 76448 4.77 0.03HEPTACHLOR EPOXIDE 1024573 4.77 0.02POLYCHLORINATED BIPHENYLS3 1336363 No Criteria 0.042,3,7,8TCDD (Dioxin) 1746016 No Criteria 0.00TOXAPHENE 8001352 6.69 0.00TRIBUTYLTIN 4.22 0.66
2019 Water Quality Based Limits (Rev 1) Page 7 5/19/2021

ATTACHMENT D Comparison of Allowable Limits with Discharge Monitoring Report Data, Permit
Application Data, and Annual Priority Pollutant Scan Data

Facility Name: Kenyon IndustriesRIPDES Permit #: RI0000191
Outfall #: 001ANOTE: METALS LIMITS ARE TOTAL METALS
Parameter CAS #
Daily Max Monthly Ave Max Ave Max Ave Daily Max Monthly Ave Daily Max Monthly Ave
PRIORITY POLLUTANTS:
TOXIC METALS AND CYANIDE
ANTIMONY 7440360 4124 91.7 18 11.8 No
ARSENIC, TOTAL 7440382 3116 81.0 No
ASBESTOS 1332214 No Criteria 0 No
BERYLLIUM 7440417 68.7 1.56 No
CADMIUM, TOTAL 7440439 7.73 1.26 0 0 No
CHROMIUM III, TOTAL 16065831 7823 373.9 141.43 128.29 7823.50 373.94 No
CHROMIUM VI, TOTAL 18540299 149.3 104.8 141.43 128.29 149.33 104.80 No
COPPER, TOTAL 7440508 54.3 39.2 220 178.4 165.45 139.68 54.28 39.19 YES
CYANIDE 57125 201.6 47.7 No
LEAD, TOTAL 7439921 234.0 9.12 1.29 0.67 No
MERCURY, TOTAL 7439976 15.1 8.3 No
NICKEL, TOTAL 7440020 1986 220.8 9 6.2 11.84 10.15 No
SELENIUM, TOTAL 7782492 183.3 45.8 No
SILVER, TOTAL 7440224 7.7 No Criteria 0 0 No
THALLIUM 7440280 421.6 9.2 No
ZINC, TOTAL 7440666 506.6 506.6 73 44 46.68 44.16 No
VOLATILE ORGANIC COMPOUNDS
ACROLEIN 107028 26.58 0.550 No
ACRYLONITRILE 107131 3464.53 77.0 No
BENZENE 71432 2428.84 54.1 No
BROMOFORM 75252 13427.34 302.5 No
CARBON TETRACHLORIDE 56235 12510.79 275.0 No
CHLOROBENZENE 108907 7286.51 165.0 0.67 No
CHLORODIBROMOMETHANE 124481 No Criteria 7525.4 No
CHLOROFORM 67663 13244.03 293.3 No
DICHLOROBROMOMETHANE 75274 No Criteria 9840.9 No
1,2DICHLOROETHANE 107062 54075.96 1200.7 No
1,1DICHLOROETHYLENE 75354 5315.94 119.2 No
1,2DICHLOROPROPANE 78875 24059.22 531.6 No
1,3DICHLOROPROPYLENE 542756 No Criteria 1215.6 No
ETHYLBENZENE 100414 14664.67 330.0 No
BROMOMETHANE (methyl bromide) 74839 No Criteria 86831.2 No
CHLOROMETHANE (methyl chloride) 74873 No Criteria 0.000000000 No
METHYLENE CHLORIDE 75092 88446.27 1961 No
1,1,2,2TETRACHLOROETHANE 79345 4271.08 91.7 No
FLUORENE 86737 No Criteria 306804 No
HEXACHLOROBENZENE 118741 No Criteria 0.168 No
HEXACHLOROBUTADIENE 87683 No Criteria 10419.7 No
HEXACHLOROCYCLOPENTADIENE 77474 3.21 0.073 No
HEXACHLOROETHANE 67721 449.11 10.1 No
ISOPHORONE 78591 53617.69 1191.5 No
NAPHTHALENE 91203 1054.02 23.8 No
NITROBENZENE 98953 12373.31 275.0 No
N-NITROSODIMETHYLAMINE 62759 No Criteria 1736.6 No
N-NITROSODI-N-PROPYLAMINE 621647 No Criteria 295.2 No
N-NITROSODIPHENYLAMINE 86306 2685.47 59.58 No
PYRENE 129000 No Criteria 231550 No
1,2,4trichlorobenzene 120821 687.41 15.58 No
PESTICIDES/PCBs
ALDRIN 309002 27.50 0.0289 No
Alpha BHC 319846 No Criteria 2.84 No
Beta BHC 319857 No Criteria 9.84 No
Gamma BHC (Lindane) 58899 8.71 8.71 No
CHLORDANE 57749 22.00 0.039 No
4,4DDT 50293 10.08 0.009 No
4,4DDE 72559 No Criteria 0.127 No
4,4DDD 72548 No Criteria 0.179 No
DIELDRIN 60571 2.20 0.031 No
ENDOSULFAN (alpha) 959988 2.02 0.513 No
ENDOSULFAN (beta) 33213659 2.02 0.513 No
ENDOSULFAN (sulfate) 1031078 No Criteria 5151.99 No
ENDRIN 72208 0.79 0.33 No
ENDRIN ALDEHYDE 7421934 No Criteria 17.37 No
HEPTACHLOR 76448 4.77 0.0348286 No
HEPTACHLOR EPOXIDE 1024573 4.77 0.0225761 No
POLYCHLORINATED BIPHENYLS 1336363 No Criteria 0.0370480 No
PCB-1242 53469219 No
PCB-1254 11097691 No
PCB-1221 11104282 No
PCB-1232 11141165 No
PCB-1248 12672296 No
PCB-1260 11096825 No
PCB-1016 12674112 No
2,3,7,8TCDD (Dioxin) 1746016 No Criteria 0.00000295 No
TOXAPHENE 8001352 6.69 0.001833 No
TRIBUTYLTIN 688733 4.22 0.66 No
TETRACHLOROETHYLENE 127184 2199.70 48.58 No
TOLUENE 108883 5820.04 128.32 No
1,2TRANSDICHLOROETHYLENE 156605 No Criteria 578874.80 No
1,1,1TRICHLOROETHANE 71556 No Criteria 0.00 No
1,1,2TRICHLOROETHANE 79005 8248.87 183.31 No
TRICHLOROETHYLENE 79016 17872.56 394.11 No
VINYL CHLORIDE 75014 No Criteria 138.93 No
ACID ORGANIC COMPOUNDS
2CHLOROPHENOL 95578 1182.34 26.58 No
2,4DICHLOROPHENOL 120832 925.71 20.16 No
2,4DIMETHYLPHENOL 105679 971.53 22.00 No
4,6DINITRO2METHYL PHENOL 534521 No Criteria 16208.49 No
2,4DINITROPHENOL 51285 284.13 6.32 No
Reasonable Potential (Yes/No)
Based on WQ Criteria
Priority Pollutant Scan Data (ug/l)
2016-2020
Potential WQ BasedAve. DMR Data Effluent (ug/L)
2016-2020
Permit Application Data (ug/L)
Permit Limits (ug/L) 5/21/2015
Concentration Limits (ug/L)
2019RIPDES SumKenyon PN Page 1 of 2
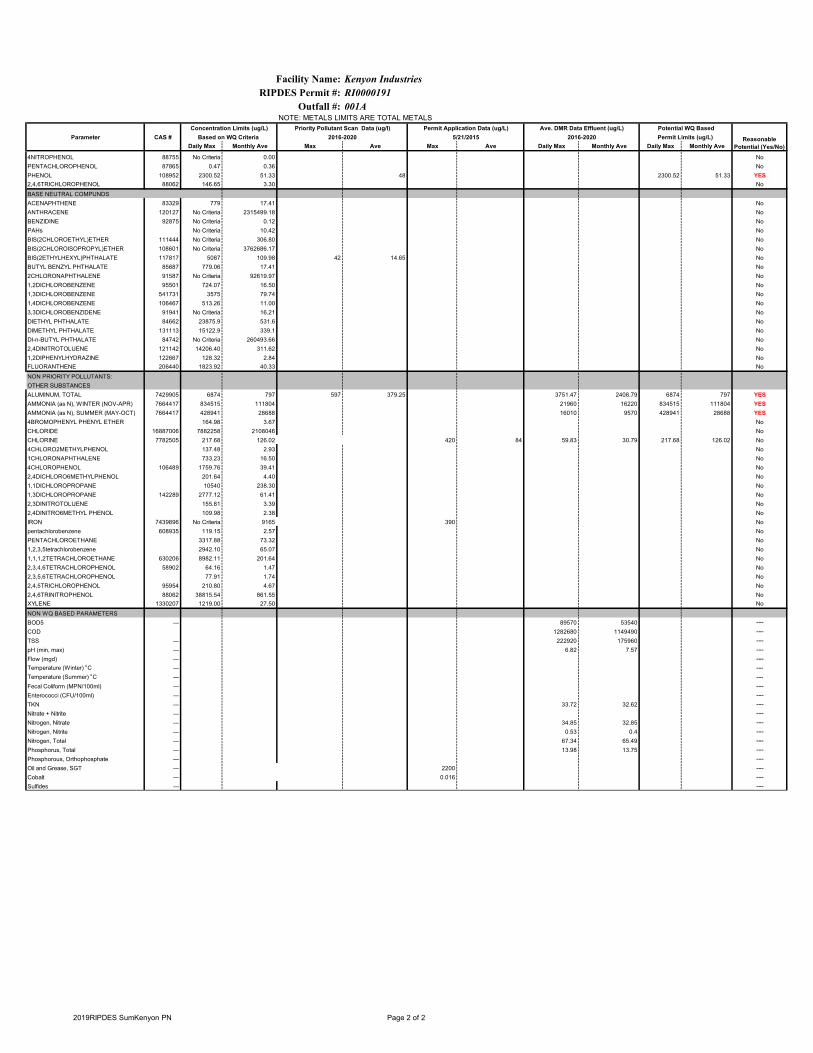
Facility Name: Kenyon IndustriesRIPDES Permit #: RI0000191
Outfall #: 001ANOTE: METALS LIMITS ARE TOTAL METALS
Parameter CAS #
Daily Max Monthly Ave Max Ave Max Ave Daily Max Monthly Ave Daily Max Monthly AveReasonable
Potential (Yes/No)
Based on WQ Criteria
Priority Pollutant Scan Data (ug/l)
2016-2020
Potential WQ BasedAve. DMR Data Effluent (ug/L)
2016-2020
Permit Application Data (ug/L)
Permit Limits (ug/L) 5/21/2015
Concentration Limits (ug/L)
4NITROPHENOL 88755 No Criteria 0.00 No
PENTACHLOROPHENOL 87865 0.47 0.36 No
PHENOL 108952 2300.52 51.33 48 2300.52 51.33 YES
2,4,6TRICHLOROPHENOL 88062 146.65 3.30 No
BASE NEUTRAL COMPUNDS
ACENAPHTHENE 83329 779 17.41 No
ANTHRACENE 120127 No Criteria 2315499.18 No
BENZIDINE 92875 No Criteria 0.12 No
PAHs No Criteria 10.42 No
BIS(2CHLOROETHYL)ETHER 111444 No Criteria 306.80 No
BIS(2CHLOROISOPROPYL)ETHER 108601 No Criteria 3762686.17 No
BIS(2ETHYLHEXYL)PHTHALATE 117817 5087 109.98 42 14.65 No
BUTYL BENZYL PHTHALATE 85687 779.06 17.41 No
2CHLORONAPHTHALENE 91587 No Criteria 92619.97 No
1,2DICHLOROBENZENE 95501 724.07 16.50 No
1,3DICHLOROBENZENE 541731 3575 79.74 No
1,4DICHLOROBENZENE 106467 513.26 11.00 No
3,3DICHLOROBENZIDENE 91941 No Criteria 16.21 No
DIETHYL PHTHALATE 84662 23875.9 531.6 No
DIMETHYL PHTHALATE 131113 15122.9 339.1 No
DI-n-BUTYL PHTHALATE 84742 No Criteria 260493.66 No
2,4DINITROTOLUENE 121142 14206.40 311.62 No
1,2DIPHENYLHYDRAZINE 122667 128.32 2.84 No
FLUORANTHENE 206440 1823.92 40.33 No
NON PRIORITY POLLUTANTS:
OTHER SUBSTANCES
ALUMINUM, TOTAL 7429905 6874 797 597 379.25 3751.47 2408.79 6874 797 YES
AMMONIA (as N), WINTER (NOV-APR) 7664417 834515 111804 21960 16220 834515 111804 YES
AMMONIA (as N), SUMMER (MAY-OCT) 7664417 428941 28688 16010 9570 428941 28688 YES
4BROMOPHENYL PHENYL ETHER 164.98 3.67 No
CHLORIDE 16887006 7882258 2108046 No
CHLORINE 7782505 217.68 126.02 420 84 59.83 30.79 217.68 126.02 No
4CHLORO2METHYLPHENOL 137.48 2.93 No
1CHLORONAPHTHALENE 733.23 16.50 No
4CHLOROPHENOL 106489 1759.76 39.41 No
2,4DICHLORO6METHYLPHENOL 201.64 4.40 No
1,1DICHLOROPROPANE 10540 238.30 No
1,3DICHLOROPROPANE 142289 2777.12 61.41 No
2,3DINITROTOLUENE 155.81 3.39 No
2,4DINITRO6METHYL PHENOL 109.98 2.38 No
IRON 7439896 No Criteria 9165 390 No
pentachlorobenzene 608935 119.15 2.57 No
PENTACHLOROETHANE 3317.88 73.32 No
1,2,3,5tetrachlorobenzene 2942.10 65.07 No
1,1,1,2TETRACHLOROETHANE 630206 8982.11 201.64 No
2,3,4,6TETRACHLOROPHENOL 58902 64.16 1.47 No
2,3,5,6TETRACHLOROPHENOL 77.91 1.74 No
2,4,5TRICHLOROPHENOL 95954 210.80 4.67 No
2,4,6TRINITROPHENOL 88062 38815.54 861.55 No
XYLENE 1330207 1219.00 27.50 No
NON WQ BASED PARAMETERS
BOD5 --- 89570 53540 ---COD 1282680 1149490 ---TSS --- 222920 175960 ---pH (min, max) --- 6.82 7.57 ---Flow (mgd) --- ---Temperature (Winter) oC --- ---Temperature (Summer) oC --- ---Fecal Coliform (MPN/100ml) --- ---Enterococci (CFU/100ml) --- ---TKN --- 33.72 32.62 ---Nitrate + Nitrite --- ---Nitrogen, Nitrate --- 34.85 32.85 ---Nitrogen, Nitrite --- 0.53 0.4 ---Nitrogen, Total --- 67.34 65.49 ---Phosphorus, Total --- 13.98 13.75 ---Phosphorous, Orthophosphate --- ---Oil and Grease, SGT --- 2200 ---Cobalt --- 0.016 ---Sulfides --- ---
2019RIPDES SumKenyon PN Page 2 of 2

ATTACHMENT E Ammonia Antidegradation Calculations

Facility : Kenyon IndustriesParameter : AMMONIA (Nov-Apr)
Input required data (use N/A when data is not available):
Chronic Metals Translator : N/APrevious monthly average limit (Total) : 145000 ug/L
Historical discharge concentration (Total) : 16000 ug/LWaterbody background concentration (Dissolved) : 0 ug/L
Facility chronic dilution factor : 22.289 xChronic criteria (Dissolved) : 6270 ug/L
Remaining Assimilative Capacity to be Allocated : 0 %
Note:
Determine existing water quality:
Cp = = 6505.451119 ug/L
DF = Chronic Dilution Factor Cb = Background Data (Dissolved)Cd = Maximum of Historical Data or Previous Monthly LimitMT = Metals Translator (Use RI Conversion Factor if Site-Specific is Unavailable)
Since the resulting instream concentration is greater than the chronic criteria, the water body is not attaining and the chronic criteria should be used to develop permit limits.
Calculation of the new chronic permit limit:
Crac = Ccriteria - Cp = Waterbody Not Attaining ug/L
Proposed Limit = (Cp + %*Crac)*DF - (DF-1)*Cb = Waterbody Not Attaining ug/L DissolvedProposed Limit = (Proposed Dissolved Limit/MT) = Waterbody Not Attaining ug/L Total
Traditional Limit = XXX ug/L
The Remaning Assimilative Capacity (Crac) is less than or equal to zero.Therefore, use the antidegradation permit limit.
Chronic limit = 0 ug/L
Calculation of the new acute permit limit:
Acute Limit = XXX ug/L
Final Limits:
MONTHLY AVERAGE PERMIT LIMIT : 0 ug/L
(DF - 1)*Cb + 1*(Cd*MT)DF
0% of the remaining assimilative capacity was allocated because Kenyon has historically discharged ammonia at levels well below the permit limit.
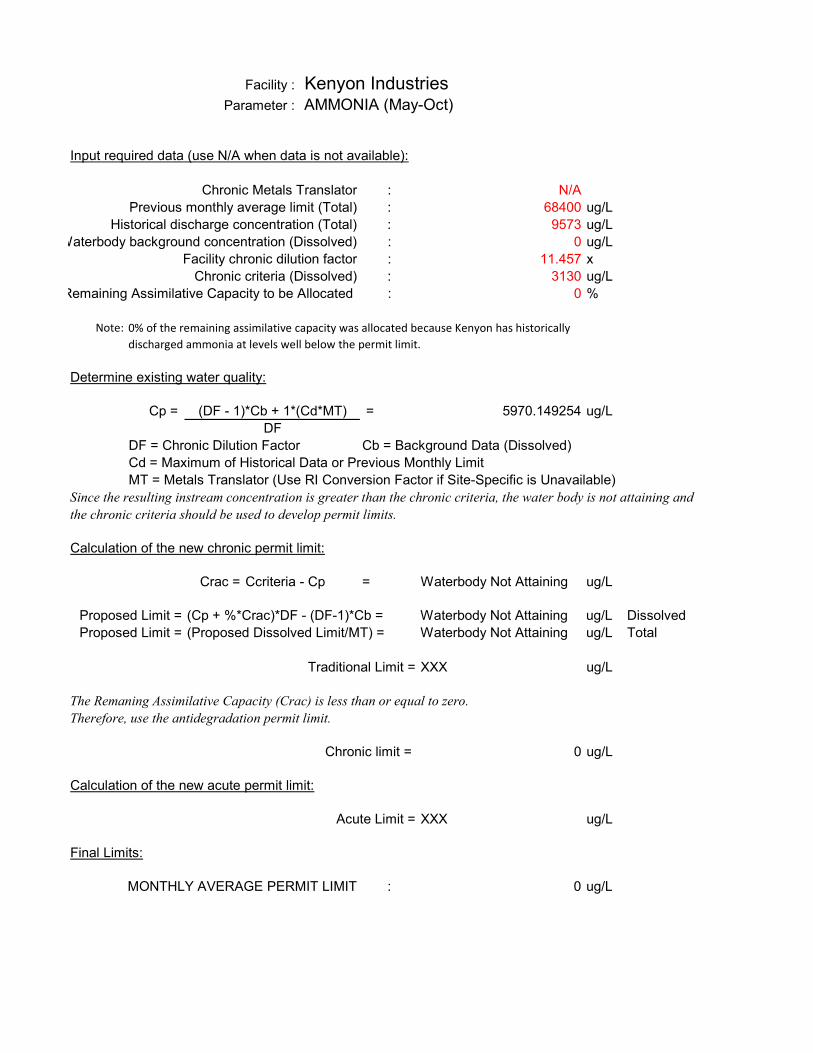
Facility : Kenyon IndustriesParameter : AMMONIA (May-Oct)
Input required data (use N/A when data is not available):
Chronic Metals Translator : N/APrevious monthly average limit (Total) : 68400 ug/L
Historical discharge concentration (Total) : 9573 ug/LWaterbody background concentration (Dissolved) : 0 ug/L
Facility chronic dilution factor : 11.457 xChronic criteria (Dissolved) : 3130 ug/L
Remaining Assimilative Capacity to be Allocated : 0 %
Note:
Determine existing water quality:
Cp = = 5970.149254 ug/L
DF = Chronic Dilution Factor Cb = Background Data (Dissolved)Cd = Maximum of Historical Data or Previous Monthly LimitMT = Metals Translator (Use RI Conversion Factor if Site-Specific is Unavailable)
Since the resulting instream concentration is greater than the chronic criteria, the water body is not attaining and the chronic criteria should be used to develop permit limits.
Calculation of the new chronic permit limit:
Crac = Ccriteria - Cp = Waterbody Not Attaining ug/L
Proposed Limit = (Cp + %*Crac)*DF - (DF-1)*Cb = Waterbody Not Attaining ug/L DissolvedProposed Limit = (Proposed Dissolved Limit/MT) = Waterbody Not Attaining ug/L Total
Traditional Limit = XXX ug/L
The Remaning Assimilative Capacity (Crac) is less than or equal to zero.Therefore, use the antidegradation permit limit.
Chronic limit = 0 ug/L
Calculation of the new acute permit limit:
Acute Limit = XXX ug/L
Final Limits:
MONTHLY AVERAGE PERMIT LIMIT : 0 ug/L
0% of the remaining assimilative capacity was allocated because Kenyon has historically discharged ammonia at levels well below the permit limit.
(DF - 1)*Cb + 1*(Cd*MT)DF

ATTACHMENT F Non-Contact Cooling Water Calculations
Outfall 002A
Flow: Receiving Water – Pawcatuck River 7Q10 @ Kenyon = 7.928 cfs = 5.124 MGD Outfall 002A – Daily Maximum Limit = 0.12 MGD Temperature: Outfall 002A – Temperature Limit = 80°F Instream Temperature – Summer = 78.8°F Instream Temperature – Winter = 36°F Water Quality Limits: Net Instream Temperature change = 4.0°F Max Instream Temperature = 83°F Heat Balance (Assuming constant Density and Heat Capacity):
𝑊𝑊𝑚𝑚𝑎𝑎𝑚𝑚(𝑇𝑇𝑙𝑙𝑙𝑙𝑚𝑚𝑙𝑙𝑙𝑙) + 𝑊𝑊7𝑄𝑄10(𝑇𝑇𝑙𝑙𝑖𝑖𝑙𝑙𝑙𝑙𝑙𝑙𝑎𝑎𝑙𝑙) = �𝑊𝑊𝑚𝑚𝑎𝑎𝑚𝑚 + 𝑊𝑊7𝑄𝑄10�(𝑇𝑇𝑙𝑙𝑖𝑖𝑙𝑙𝑙𝑙𝑙𝑙𝑎𝑎𝑙𝑙 + ∆𝑇𝑇) Where: Qmax = Daily Maximum Limit at Outfall 002A Q7Q10 = Low Flow for Pawcatuck River Tlimit = Proposed Permit Limit for Temperature Tinitial = Instream Ambient Temperature ΔT = Net Change in Temperature Case 1 – Summer Months (0.12 MGD)(80°F) + (5.124 MGD)(78.8°F) = (0.12 MGD + 5.124 MGD)(78.8°F + ΔT) ΔT = 0.027°F ≤ 4°F – Proposed Limit Meets Water Quality Regulations.
Tfinal = Tinitial + ΔT = 78.83°F < 83°F – Proposed Limit Meets Water Quality Regulations Case 2 – Winter Months
(0.12 MGD)(80°F) + (5.124 MGD)(36°F) = (0.12 MGD + 5.124 MGD)(36°F + ΔT) ΔT = 0.4 ≤ 4°F – Proposed Limit Meets Water Quality Regulations Tfinal = Tinitial + ΔT = 36.43°F < 83°F – Proposed Limit Meets Water Quality Regulations

ATTACHMENT G 2016-2020 Priority Pollutant Scan Data
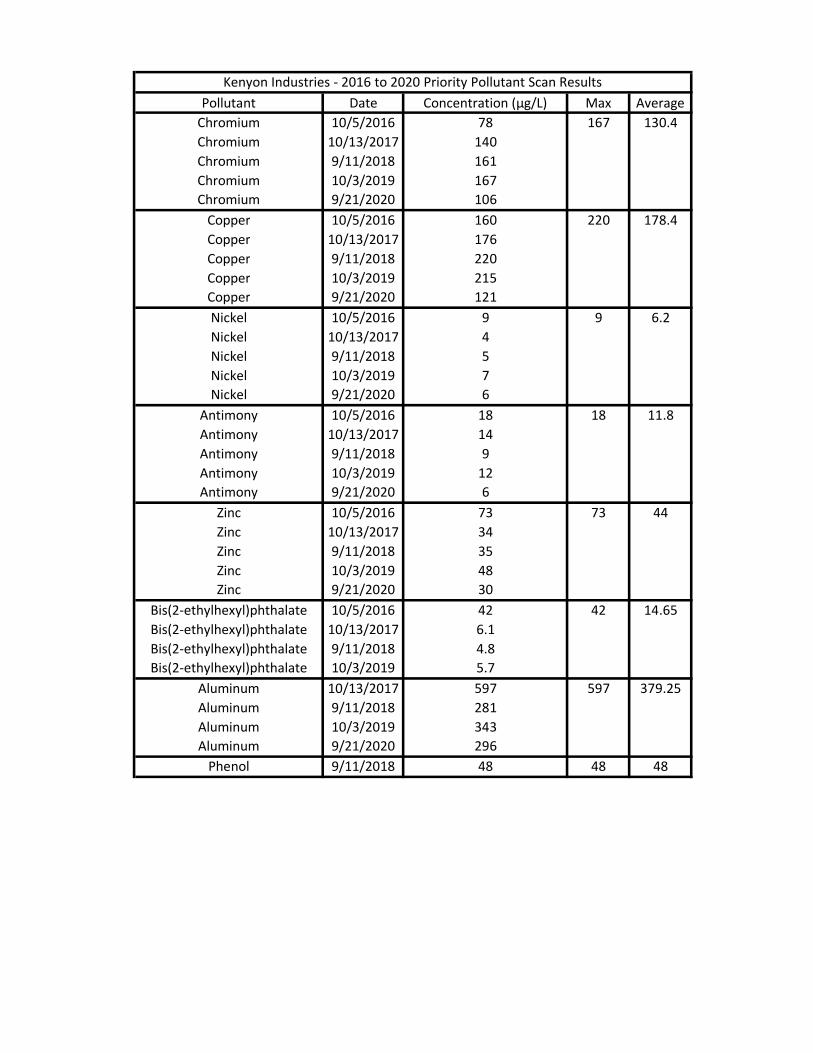
Pollutant Date Concentration (µg/L) Max AverageChromium 10/5/2016 78 167 130.4Chromium 10/13/2017 140Chromium 9/11/2018 161Chromium 10/3/2019 167Chromium 9/21/2020 106
Copper 10/5/2016 160 220 178.4Copper 10/13/2017 176Copper 9/11/2018 220Copper 10/3/2019 215Copper 9/21/2020 121Nickel 10/5/2016 9 9 6.2Nickel 10/13/2017 4Nickel 9/11/2018 5Nickel 10/3/2019 7Nickel 9/21/2020 6
Antimony 10/5/2016 18 18 11.8Antimony 10/13/2017 14Antimony 9/11/2018 9Antimony 10/3/2019 12Antimony 9/21/2020 6
Zinc 10/5/2016 73 73 44Zinc 10/13/2017 34Zinc 9/11/2018 35Zinc 10/3/2019 48Zinc 9/21/2020 30
Bis(2-ethylhexyl)phthalate 10/5/2016 42 42 14.65Bis(2-ethylhexyl)phthalate 10/13/2017 6.1Bis(2-ethylhexyl)phthalate 9/11/2018 4.8Bis(2-ethylhexyl)phthalate 10/3/2019 5.7
Aluminum 10/13/2017 597 597 379.25Aluminum 9/11/2018 281Aluminum 10/3/2019 343Aluminum 9/21/2020 296
Phenol 9/11/2018 48 48 48
Kenyon Industries - 2016 to 2020 Priority Pollutant Scan Results

ATTACHMENT H Analytical Data for Water Under Greige Room Floor

Kenyon Groundwater/Floodwater Bypass DataAnalysis of Water During Flooding
Analyte Sampling Dates6/13-6/14,2013 3/31-4/1,2014 1/21-1/22,2015 Avg. 3/2/18-3/19/18 Avg.
Silver 0 0 0.001 mg/L 0.000333 mg/LAluminum 0.213 0.243 mg/L 0.228 mg/LCadmium 0 0 0 mg/L 0 mg/LChromium 0.001 0 0.104 mg/L 0.035 0.011 0.01 0.012 0.022 0.002 0.007 mg/L 0.010667
Copper 0.017 0.019 0.15 mg/L 0.062 0.0207 0.0303 0.025 0.045 0.004 0.0201 mg/L 0.024183Nickel 0.004 0.004 0.008 mg/L 0.005333 mg/LLead 0.002 0.002 0.008 mg/L 0.004 mg/LZinc 0.023 0 2.23 mg/L 0.751 mg/LCOD 55 32 1540 mg/L 542.3333 35 91 122 235 59 152 mg/L 115.6667BOD 34.9 mg/L 34.9 21 19.2 64.9 39.2 11 mg/L 31.06
Ammonia, as N 0.16 0.25 1.2 mg/L 0.536667 0.47 2.25 3.42 3.84 0.56 12.5 mg/L 3.84Nitrite, as N 0 0.01 0.29 mg/L 0.1 mg/LNitrate, as N 0 0.16 0 mg/L 0.053333 mg/L
Sulfide 0 0 0.11 mg/L 0.036667 mg/LTKN 1.38 0.93 29.6 mg/L 10.63667 mg/L
Phosphorus 0.31 0.15 10.6 mg/L 3.686667 mg/LTSS 0 0 94 mg/L 31.33333 0 5 0 13 0 8.7 mg/L 4.45
Phenolics 0 0 0 mg/L 0 mg/L1,1,1-Trichloroethane 0 0 µg/L 0
1,1,2,2-Tetrachloroethane 0 0 µg/L 01,1,2-Trichloroethance 0 0 µg/L 0
1,1-Dichloroethane 1.2 0 µg/L 0.61,1-Dichloroethene 0 0 µg/L 0
1,2-Dichlorobenzene 0 0 µg/L 01,2-Dichloroethane 0 0 µg/L 0
1,2-Dichloropropane 0 0 µg/L 01,3-Dichlorobenzene 0 0 µg/L 01,4-Dichlorobenzene 0 0 µg/L 0
2-Chloroethyl Vinyl Ether 0 0 µg/L 0Acrolein 0 0 µg/L 0
Acrylonitrile 0 µg/L 0Benzene 0 0 µg/L 0
Bromodichloromethane 0 0 µg/L 0Bromoform 0 0 µg/L 0
Carbon Tetrachloride 0 0 µg/L 0Chlorobenzene 0 0 µg/L 0Chloroethane 0 0 µg/L 0Chloroform 0 0 µg/L 0
Chloromethane 0 0 µg/L 0cis-1,2-Dichloroethene 0 0 µg/L 0cis-1,3-Dichloroethene 0 0 µg/L 0
Dibromochloromethane 0 0 µg/L 0Ethylbenzene 0 0 µg/L 0m&p-Xylene 0 0 µg/L 0
Methyl t-Butyl Ether 0 0 µg/L 0Methylene Chloride 0 0 µg/L 0
o-Xylene 0 0 µg/L 0Tetrachloroethene 0 0 µg/L 0
Toluene 0 0 µg/L 0trans-1,2-Dichloroethene 0 0 µg/L 0
trans-1,3-Dichloropropene 0 0 µg/L 0Trichloroethene 0 0 µg/L 0
Trichlorofluoromethane 0 0 µg/L 0Vinyl Chloride 0 0 µg/L 0
4/29/19-5/2/19
12/11/19-12/20/19
Sampling DatesAnalysis of Water Collecting Under Greige Room Floor
11/16/18-12/7/18
1/2/19-1/10/19
1/21/19-2/4/19