draft integrated development plan 2020/20
TRANSCRIPT
1
DRAFT INTEGRATED DEVELOPMENT PLAN 2020/20
OFFICE CONTACT DETAILS
Physical address: Civic Centre
C/O Joe Slovo and Douwater Road
Overwacht
Postal Address: Lephalale Municipality
Private Bag x136
Lephalale
Telephone Number: 014 763 2193
Facsimile Number: 014 763 5662
Website: www.lephalale.gov.za

2
TABLE OF CONTENTS
(i)Acronyms and abbreviations____________________________________________________________________________8
(ii)Vision, Mission and Values_____________________________________________________________________________10
1. Chapter 1: The Planning Framework______________________________________________________________________11
1.1. Introduction________________________________________________________________________________________11
1.2. Municipal Planning process____________________________________________________________________________12
1.3. Phases and activities of the IDP planning process___________________________________________________________12
1.4. Legislative background and policy imperatives_____________________________________________________________13
1.5. Mechanisms and procedures for alignment and participation_________________________________________________16
1.6. Principles for monitoring of the process plan and amendment of the framework__________________________________17
1.7. Policies and legislative framework_______________________________________________________________________20
1.8. Powers and functions of the municipality__________________________________________________________________29
1.9. IDP process overview__________________________________________________________________________________31
2. Chapter 2: Situational Analysis____________________________________________________________________________36
2.1. Municipal overview___________________________________________________________________________________36
2.2. Executive summary___________________________________________________________________________________36
2.3. Demographics_______________________________________________________________________________________39
3
2.4. Population trends______________________________________________________________________________________39
2.5. Education profile______________________________________________________________________________________41
2.6. Income categories_____________________________________________________________________________________42
2.7. National Development Plan Focus Areas____________________________________________________________________42
2.8. SONA _______________________________________________________________________________________________45
2.9. SOPA _______________________________________________________________________________________________46
3. Chapter 3: Spatial Analysis________________________________________________________________________________47
3.1. Purpose of a Spatial Development Framework________________________________________________________________47
3.2. Planning from the SDF perspective_________________________________________________________________________47
3.3. National Infrastructure Plan______________________________________________________________________________48
3.4. Hierarchy of settlements_________________________________________________________________________________50
3.5. Settlements patterns____________________________________________________________________________________51
3.6. Provincial Growth Points__________________________________________________________________________________52
3.7. Approved proposals on the current development trajectory of the SDA’s___________________________________________53
3.8. Land availability________________________________________________________________________________________60
3.9. Nature reserves and conservancy__________________________________________________________________________60
3.10. Land uses____________________________________________________________________________________________61

4
3.11. Land tenure_________________________________________________________________________________________62
3.12. Land uses and land claims_____________________________________________________________________________62
3.13. Green economy strategy______________________________________________________________________________63
3.14. Green economy goals_________________________________________________________________________________64
4. Chapter 4: Social Economic Analysis________________________________________________________________________70
4.1. Environmental Legislative Framework_____________________________________________________________________70
4.2. Air quality___________________________________________________________________________________________73
4.3. Water quality________________________________________________________________________________________73
4.4. Climate change and global warming______________________________________________________________________74
4.5. Agriculture__________________________________________________________________________________________77
4.6. Waste management__________________________________________________________________________________78
4.7. Refuse removal______________________________________________________________________________________78
4.8. Waste transport and transfer___________________________________________________________________________79
4.9. Waste storage_______________________________________________________________________________________79
4.10. Waste education____________________________________________________________________________________79
4.11. Waste disposal_____________________________________________________________________________________79
4.12. Waste information__________________________________________________________________________________80

5
4.13. Environmental challenges____________________________________________________________________________80
5. Chapter 5: Service Delivery and Infrastructure Development______________‐_____________________________________81
5.1. Water_____________________________________________________________________________________________81
5.2. Bulk water infrastructure______________________________________________________________________________82
5.3. Water availability in rural areas_________________________________________________________________________85
5.4. Sanitation__________________________________________________________________________________________88
5.5. Current status of sanitation in rural______________________________________________________________________89
5.6. Electricity___________________________________________________________________________________________93
5.7. Network overview____________________________________________________________________________________94
5.8. Roads and storm water________________________________________________________________________________97
5.9. Functional Road Hierarchy ________________________________________________________________________________98
5.10. Road network at regional level_________________________________________________________________________98
5.11. Storm water drainage________________________________________________________________________________100
5.12. Public transport_____________________________________________________________________________________101
5.13. Road freight transport________________________________________________________________________________102
5.14. Consumer goods for local consumption___________________________________________________________________105
6. Chapter 6: Local Economic Development____________________________________________________________________105
6
6.1. Economic analysis____________________________________________________________________________________106
6.2. Expanded public works programme______________________________________________________________________108
6.3. Enabling economic infrastructure________________________________________________________________________108
6.4. Economic production__________________________________________________________________________________109
6.5. National energy programme____________________________________________________________________________111
6.6. Localized guidelines for rural development, poverty alleviation and gender equity_________________________________112
6.7. Relationship with Botswana_____________________________________________________________________________114
6.8. Economic potential of Lephalale_________________________________________________________________________115
6.9. Mineral rights________________________________________________________________________________________117
6.10. Tourism____________________________________________________________________________________________120
6.11 Socio‐economic transformation _________________________________________________________________________121
7. Chapter 7: Financial Management and Viability_______________________________________________________________126
7.1. Audit report__________________________________________________________________________________________132
7.2. Audit report finding____________________________________________________________________________________135
8. Chapter 8: Institutional Development and Transformation_______________________________________________________137
8.1. Functions of Municipal Departments_______________________________________________________________________138
8.2. Employment Equity____________________________________________________________________________________144

7
8.3. Good Governance and Public Participation__________________________________________________________________145
8.4. Portfolio Committees___________________________________________________________________________________147
8.5. Oversight Committee___________________________________________________________________________________147
8.6. INTEGRATION
Sector Plans ______________________________________________________________________________________________150
8.7. SWOT Analysis_________________________________________________________________________________________152
8.8. Strategic Objectives_____________________________________________________________________________________154
8.9. Convergence of Agenda 2063, SDG’s, NDP, LDP and IDP________________________________________________________160
9. Chapter 9: Development Strategies, Programmes and Projects___________________________________________________190
10. Chapter 10: Performance Management_____________________________________________________________________228
10.1. Legislation___________________________________________________________________________________________228
10.2. Methodology_________________________________________________________________________________________229
8
(i) Acronyms and Abbreviation
IDP Integrated Development Plan WDM Waterberg District Municipality WDM Waterberg District Model (District‐based Model of Development) NDP National Development plan LDP Limpopo Development Plan PGDS Provincial Growth and Development Strategy NSDP National Spatial Development Perspective CoGHSTA Department of Cooperative Governance Human Settlement and Traditional Affairs MFMA Municipal Finance Management Act, No 56 of 2003 MTEF Medium term Expenditure framework MTSF Medium Term Strategic Framework MDGs Millennium Development Goals SDBIP Service Delivery Budget Implementation Plan PMS Performance Management System ITP Integrated Transport Plan EMP Environmental Management Plan WSDP Water Services Development Plan WSP Water Services Provider MSA Municipal Systems Act, No 32 of 2000 SIP Strategic Infrastructure Project NGO Non‐Governmental Organization CBO Community Based Organization ToR Terms of Reference PPP Public Private Partnership SMME Small, Medium and Macro Enterprises LM Local Municipality CPI Consumer Price Index KPA Key Performance Area KPI Key Performance Indicator
9
LED Local Economic Development EPWP Expanded Public Works Programme DWAS Department of Water Affairs and Sanitation CIP Comprehensive Investment Plan B2B Back to Basic
10
(ii) VISION, MISSION AND VALUES
Vision and Mission statements are the starting points for strategy development. As a rule, vision and mission are determined early on in the strategic planning process. The vision is a statement of what the municipality seeks to achieve. It is directed towards the future and briefly states the Municipality’s purpose, its reason for existence. A vision should express the essential purpose of the Municipality, ideally in one, concise, sentence. This statement should not change – even if the internal and external environmental factors impacting on the Municipality change, unless a major development takes place which changes the purpose of the Municipality’s existence. The vision provides the direction for a Municipality’s strategies, objectives and implementation plans. In fact, vision is that igniting spark that can inspire and energise people to do better. The focus of a vision is to reach out hungrily for the future and drag it into the present. The latest trend in many organisations is to apply the "VIP" approach i.e. "Vision Integrated Performance." Articulating a vision is the soul‐searching activity, where an organisation tries to answer the critical questions like `why are we here' and 'where are we today'? This analysis of the present is essential, because it provides the true picture of today from where we begin the journey towards the future. The vision is a compelling but not controlling force that shows us where we what to be. This document will assist the Lephalale Local Municipality in answering these questions. The long term vision of Lephalale Local Municipality follows: VISION:
“A VIBRANT CITY AND BE THÉ ENERGY HUB” MISSION:
We are committed to Integrated Development, provision of quality, sustainable and affordable service, through financially viable good governance and job creating economic growth.

11
VALUES The Values of Lephalale Local Municipality underpin quality and they are: Value DescriptionCommunity orientation Provide and deliver sustainable services for the whole community.Transparency Invite and encourage public sharing and democratic participation in council’s activities.Commitment Focus and concentrate on council’s core activities in a consistent manner.Integrity Conduct council’s business in a fair, responsible, flexible, equitable and honest manner.Accountability Report regularly to all stakeholders regarding council’s actual performance.Environmental Care With all the development in Lephalale, the municipality will focus on taking care of the environment.Empowerment To be seen to be empowering our people, knowledge is power.Performance orientation Continually evaluates and measure performance against set targetThe description defines the complexities of the existence of Lephalale and clearly articulates the vision for the next 20 years and beyond. Lephalale Local Municipality has been identified by LEGDP as a petrochemical cluster and has attained the status of National Development Node. The coal fields which boast more than 40% of the total coal reserve of South Africa are located in Lephalale. The Waterberg Coal Field is estimated to contain a resource base of 50 billion tons; of which 12.5 billion tons can be mined by opencast method (coal is sufficiently close to surface that it does not require the sinking of a shaft). It is against this background that Lephalale has crafted its vision to become one of the vibrant cities within the Limpopo Province. Hence, we define a city as a relatively large and permanent settlement with complex systems for sanitation, utilities, land usage, housing, and transportation. The concentration of development greatly facilitates interaction between people and businesses, benefiting both parties in the process and improving the quality of lives of the people of Waterberg Region.

12
CHAPTER 1
1. THE PLANNING FRAMEWORK. 1.1. Introduction. The Integrated Development plan (IDP) is a process through which the Municipalities prepare strategic development plans for a five‐year period. An IDP is one of the key instruments for local government to cope with its new developmental role and seeks to arrive at decisions on issues such as Municipal budgets, Land Management, promotion of Local Economic Development and Institutional transformation in a consultative system and strategic manner. In order to ensure that certain minimum quality standards of the IDP review process and proper coordination between and within spheres of Government, Municipalities need to prepare review Process Plan of the IDP and formulate budget for implementation purpose. 1.2 LEPHALALE MUNICIPAL PLANNING PROCESS. Lephalale Municipality council approved in August 2019 its IDP, Budget and PMS Process Plan for the 2019/20 IDP review. This plan was adopted in accordance with sections 28 of the MSA and relevant Legal prescripts have dictated the process followed in reviewing the IDP. The Municipality has a functional IDP Steering Committee consisting of Management, Technical working team and Representatives from Office of the Premier and CoGHSTA to ensure a smooth compilation and implementation of the plan. There is an IDP Representative Forum to ensure community participation by Stakeholders representing various Constituencies. 1.3 PHASES AND ACTIVITIES OF THE IDP PROCESS.
1. Analysis phase: Compilation and reconciling of existing information through community participation and stakeholder involvement and other spheres of government. These involve the Municipality level and spatial analysis of development issues for presentation. In‐depth analysis of priority issues within sector alignment for consolidated results.
2. Strategies phase: Draw up vision statement for determining working objectives for localised strategic and spatial guidelines.
Define resource framework and design financial strategies for creating alternative funding. Establish localised environmental

13
and economic development strategic guidelines. Translate District Strategic workshop results into Local decisions and create conditions and alternatives for public debate and participation.
3. Project phase: Form project task teams for designing project proposal key performance indicators, major activity, time frame
and establish preliminary budget allocation. Set indicators for objectives and involve Provincial and National spheres of Government and other partners. Target group participation in project planning.
4. Integration phase: Screening of draft project proposals linking it with the budget and existing legislation. Integrating spatial
projects and sector programmes. Monitor Integrated Performance Management Systems and Disaster Management Plans as well as other plans. Integrating poverty reduction, gender equity and Local Economic Development programmes.
5. Approval phase: The phase affords opportunities for comments from Public, Provincial/National Government and Horizontal
co‐ordination at District level. Approval by the Representative Forum which serves as an Institutional structure that represents the wishes and will of various stakeholders including but not limited to the community. Final adoption by Municipal Council and compilation of District level summaries of Local IDP’s.
1.4 LEGISLATIVE BACKGROUND AND POLICY IMPERATIVES.
Constitution of the Republic of South Africa, Act 108 of 1996. The constitutional Mandate for Municipalities is that they strive, within their financial and administrative capacity to achieve the objectives and carry out the developmental duties assigned to Local Government. Constitutionally, the objects of the local government are: To provide democratic and accountable government for local communities. To ensure the provision of services in a sustainable manner. To promote social and economic development. To promote a safe and healthy environment and To encourage the involvement of communities and community organizations in matters of local government.

14
Municipal Systems Act, Act 32 of 2000. The act regulates the IDP. It requires the Municipality to undertake developmentally orientated planning so as to ensure that it strives to achieve the objectives of local government set out in Section 152 and 153 of the Constitution. Section 25 (1) requires the Municipal Council, within a prescribed period after the start of its elected term, to adopt a single, inclusive strategic plan for development of the Municipality which: Links, integrates. Coordinates and takes into account proposals for the development of the Municipality; Aligns the resources and capacity of the Municipality with implementation of the plan; Forms the policy framework and general basis on which annual budgets must be based; Complies with the provision of Chapter 5, and Are compatible with the National and provincial department plans and planning requirements binding on the Municipality in
terms of Legislation. Section 26 of the Act further outlines the core components of the integrated development plan of the Municipality. It requires the integrated development plan of the Municipality to reflect: The Municipal council’s vision for the long term development with special emphasis on the most critical development and
internal transformation needs; An assessment of the existing level of development in the Municipality, which must include an identification of communities
which do not have access to basic Municipal services. The Council’s development priorities and objectives for its elected term; The Council’s development strategies which must be aligned with any National or Provincial sector plans and planning
requirements binding on the Municipality in terms of legislation; A special development framework which must include the provision of basic guidelines for land use management system of the
Municipality; The Council’s operational strategies; Applicable disaster management plan; A financial plan, which must include projected budget for at least the next three years, and The key performance indicators and performance targets determined in terms of section 41.

15
Municipal Finance Management Act, Act 56 of 2003. The Municipal Finance Management Act (act 56 of 2003) was promulgated to secure sound and sustainable management of the financial affairs of Municipalities and other institutions in the sphere of local government. The act provides a mandatory provision that relates to finance and performance management. Section 2 of the Act stipulates that the object is to secure sound and sustainable management of the financial affairs of the local government institutions to which this Act applies by establishing norms and standards for: Ensuring transparency, accountability and appropriate lines of responsibility in the fiscal and financial affairs of Municipalities
and Municipal entities; The management of revenues, expenditures, assets and liabilities and the handling of financial dealings, budgetary and financial
planning processes; The coordination of those processes with those of other spheres of government; Borrowing of finance; Supply chain management, and Other financial matters
Lephalale Municipality’s involvement in the budget process is to ensure compliance with the provision of the Municipal Finance Management Act (act 56 of 2003). It is of cardinal importance that the IDP review processes facilitate community participation, provide for ward level information, encourage discussion on priorities and provide an opportunity for feedback. The main strategic outputs of the budget reform are to ensure: Modernising financial management and improving accountability; Multi‐year budgeting; Deepening and improving the budget preparation process, by involving political leadership and community; Ensuring that the IDP and budgets are linked, and that the IDP takes account of budgetary resources, and contain proper capital
and maintenance plans; Improving the in‐year implementation of the budget, and Improving the auditing and performance reporting after the financial year has ended.
16
Traditional Leadership and Governance Framework Amendment Act (Act 41 of 2003). This act makes clear the role of traditional leadership in the democratic and cooperative governance. The Act envisages an active involvement of the traditional leadership in the formulation and the implementation of integrated development plans. Section 4 of the Act provides for the establishment of traditional councils that should: Support Municipalities in the identification of community needs; Facilitate the involvement of the traditional community in the development or amendment of the integrated development plan
of a Municipality in whose area that community resides; Participate in the development of policy and legislation at the local level; and Promote the ideals of cooperative governance, integrated development planning and service delivery to promote indigenous
knowledge systems for sustainable development and disaster management. Section 5 (2) of the Act affirms that any partnership between a Municipality and a traditional council must:
a) Be based on the principles of mutual respect and recognition of the status and roles of the respective parties; b) Be guided by and based on the principles of cooperative governance.
A larger number of the population in the Municipality resides in traditional authority governed areas. To this effect, Lephalale Municipality has a standing commitment and tradition of involving traditional leaders in both the IDP review process and any other developmental matter involving their area of governance. 1.5 MECHANISMS AND PROCEDURES FOR ALIGNMENT AND PARTICIPATION
The existing IDP Representative Forum will continue to be used as a mechanism for community and stakeholder participation. IDP Representative Forum meetings will be held four times per Financial Year at the District level, but however Local Municipalities ward conferences, consultation, Imbizos, and Representatives Forums will be used by both District and Local Municipalities to deepen community and stakeholder participation.
a. Mechanisms and procedures for alignment
Alignment is at two levels, horizontal and vertical. Largely the two levels influence each other. Though one can be done independent from each other, if this is done, a clear picture of what is happening will not be achieved. The strategy that we are going to follow applies to both horizontal alignments between the District and Local Municipalities, and vertical, between the Municipalities, the Province and the National Departments and Parastatals.
17
b. Management of alignment.
For both alignment types, horizontal and vertical, the main responsibility lies with the District Municipality. The role of the IDP Manager at the District level is of utmost importance. IDP unit and external facilitators could be used to support the alignment process. However, the Provincial Department of Local Government and Office of the Premier play an important role as coordinator to ensure alignment above District level and between Districts and Departments within the Province.
c. Functions and context for public participation Four major functions can be aligned with the public participation process namely:
o Needs orientation; o Appropriateness of solutions; o Community ownership; o Empowerment; o Performance Monitoring
In the preparation of the IDP/Budget/PMS, the public participation process has to be institutionalized in order to ensure all residents have an equal right to participate.
d. Mechanisms for participation
i. IDP/Budget/PMS Representatives Forum (RF), Imbizos / Roadshows ii. Various Fora iii. Media iv. Information Booklets
1.6 PRINCIPLES FOR MONITORING OF THE PROCESS PLAN AND AMENDMENT OF THE FRAMEWORK It is expected of the District and all the Local Municipalities to adhere to the timeframes as set out in the programme above. Any Municipality that is not able to meet the deadline should timeously report to the IDP Manager at the District. At the same length, if the District is not going to be able to meet a deadline, the IDP Manager should inform the Municipalities on time. This is the principle that should also be adhered and respected by all Municipalities including the District.

18
In terms of monitoring, Municipalities would be expected to submit and make a presentation to the District Management Committee (MC) which is comprised of all the IDP managers within the District. That is, the IDP managers of Modimolle‐Mookgophong, Bela‐Bela, Mogalakwena, Thabazimbi, and Lephalale municipalities. The DMC will hold its meeting as per the above schedule. ROLES & RESPONSIBILITIES The District Municipality will confirm information of the role players in the IDP/Budget/PMS Process by removing/adding to the list of Stakeholders from the database established in the previous IDP/Budget/PMS Processes. A significant change will relate to details of Councillors and some of the officials. The organizational structures that were utilized during the IDP preparation and previous review processes will be revived for the purpose of this IDP/Budget/PMS Process.
The main roles and responsibilities allocated to each of the role players is set out in the following table:
Executive Mayor
Manage the drafting of the IDP; Assign responsibilities in this regard to the Municipal Manager; Submit the draft Framework Plan and Process Plan to the Council for adoption; Submit the draft IDP to the Council for adoption and approval;
Municipal Manager
Preparation of Framework Plan; Preparation of the Process Plan; Day‐to‐day management and coordination of the IDP process in terms of time, resources and people, and
ensuring: The involvement of all relevant role‐players, especially officials; That the timeframes are being adhered to; That the planning process is horizontally and vertically aligned and complies with national and provincial
requirements; That conditions for participation are provided; and That the outcomes are documented. Chairing the IDP Steering Committee;
19
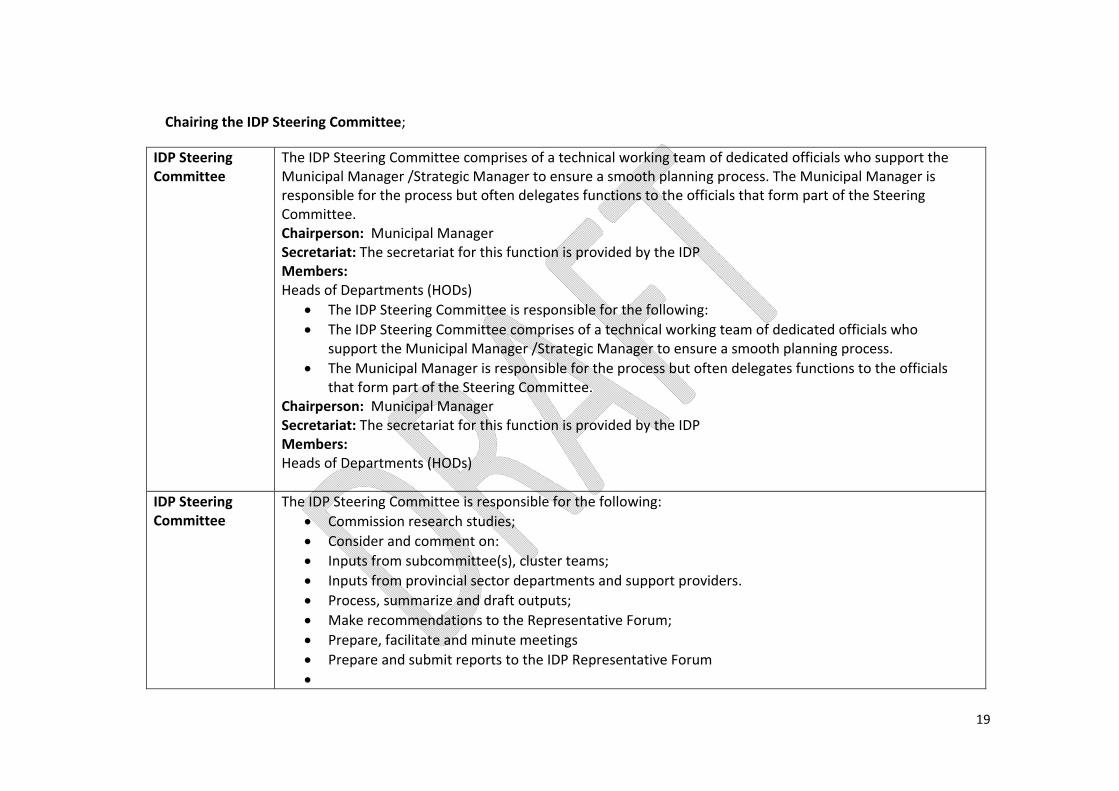
Chairing the IDP Steering Committee;
IDP Steering Committee
The IDP Steering Committee comprises of a technical working team of dedicated officials who support the Municipal Manager /Strategic Manager to ensure a smooth planning process. The Municipal Manager is responsible for the process but often delegates functions to the officials that form part of the Steering Committee. Chairperson: Municipal Manager Secretariat: The secretariat for this function is provided by the IDP Members: Heads of Departments (HODs)
The IDP Steering Committee is responsible for the following: The IDP Steering Committee comprises of a technical working team of dedicated officials who
support the Municipal Manager /Strategic Manager to ensure a smooth planning process. The Municipal Manager is responsible for the process but often delegates functions to the officials
that form part of the Steering Committee. Chairperson: Municipal Manager Secretariat: The secretariat for this function is provided by the IDP Members: Heads of Departments (HODs)
IDP Steering Committee
The IDP Steering Committee is responsible for the following: Commission research studies; Consider and comment on: Inputs from subcommittee(s), cluster teams; Inputs from provincial sector departments and support providers. Process, summarize and draft outputs; Make recommendations to the Representative Forum; Prepare, facilitate and minute meetings Prepare and submit reports to the IDP Representative Forum
20
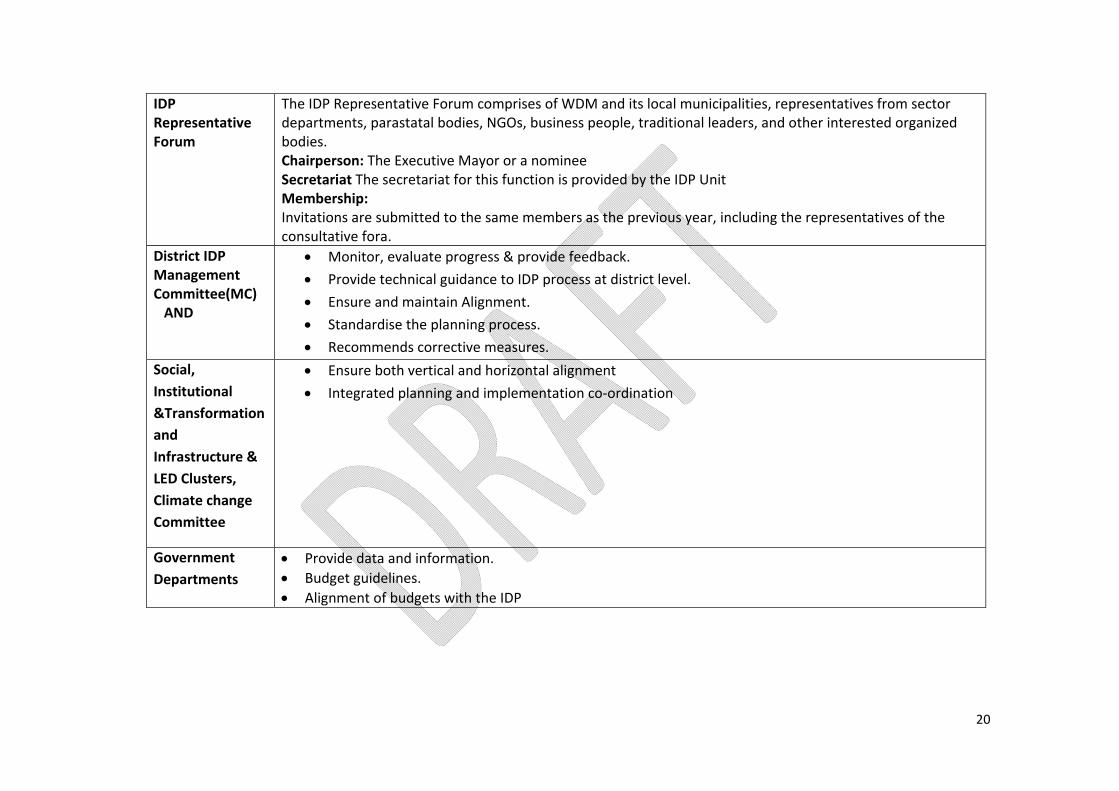
IDP Representative Forum
The IDP Representative Forum comprises of WDM and its local municipalities, representatives from sector departments, parastatal bodies, NGOs, business people, traditional leaders, and other interested organized bodies. Chairperson: The Executive Mayor or a nominee Secretariat The secretariat for this function is provided by the IDP Unit Membership: Invitations are submitted to the same members as the previous year, including the representatives of the consultative fora.
District IDP Management Committee(MC) AND
Monitor, evaluate progress & provide feedback. Provide technical guidance to IDP process at district level. Ensure and maintain Alignment. Standardise the planning process. Recommends corrective measures.
Social, Institutional &Transformation and Infrastructure & LED Clusters, Climate change Committee
Ensure both vertical and horizontal alignment Integrated planning and implementation co‐ordination
Government Departments
Provide data and information. Budget guidelines. Alignment of budgets with the IDP

21
1.7 POLICIES AND LEGISLATIVE FRAMEWORK
BINDING LEGISLATION, POLICIES AND PLANNING REQUIREMENTS AT NATIONAL AND PROVINCIAL LEVEL National Legislation
The Constitution of the Republic of South Africa, (Act 108 of 1996) Local Government
Local Government: Transition Act Second Amendment Act, (Act 97 of 1996) Local Government: Municipal Demarcation Act, (Act 27 of 1998) Local Government: Municipal Structures Act, (Act 117 of 1998) and its amendments. Local Government: Municipal Systems Act, (Act 32 of 2000) Local Government: Municipal Finance Management Act, (Act 56 of 2003) Local Government: Property Rates Act, (Act 6 of 2004) Intergovernmental Relations Framework Act, (Act 13 of 2005) Promotion of Access to Information Act (Act 2 of 2000) White paper on local government, 1998 Towards a policy on integrated development planning, 1998 White paper on municipal service partnership, 2000 Policy framework on municipal international relations, 1999
Finance Division of Revenue Act (Act 1 of 2007) Public Finance Management Act (Act 2 of 1999)
Land and Agriculture Development Facilitation Act, (Act 67 of 1995) Land use management Bill, 2001 White paper on South African land reform, 1997 Green paper on Development and Planning, 1997 White paper on Agriculture, 1995 Communal Land Rights Act, (Act 11 of 2004)
22
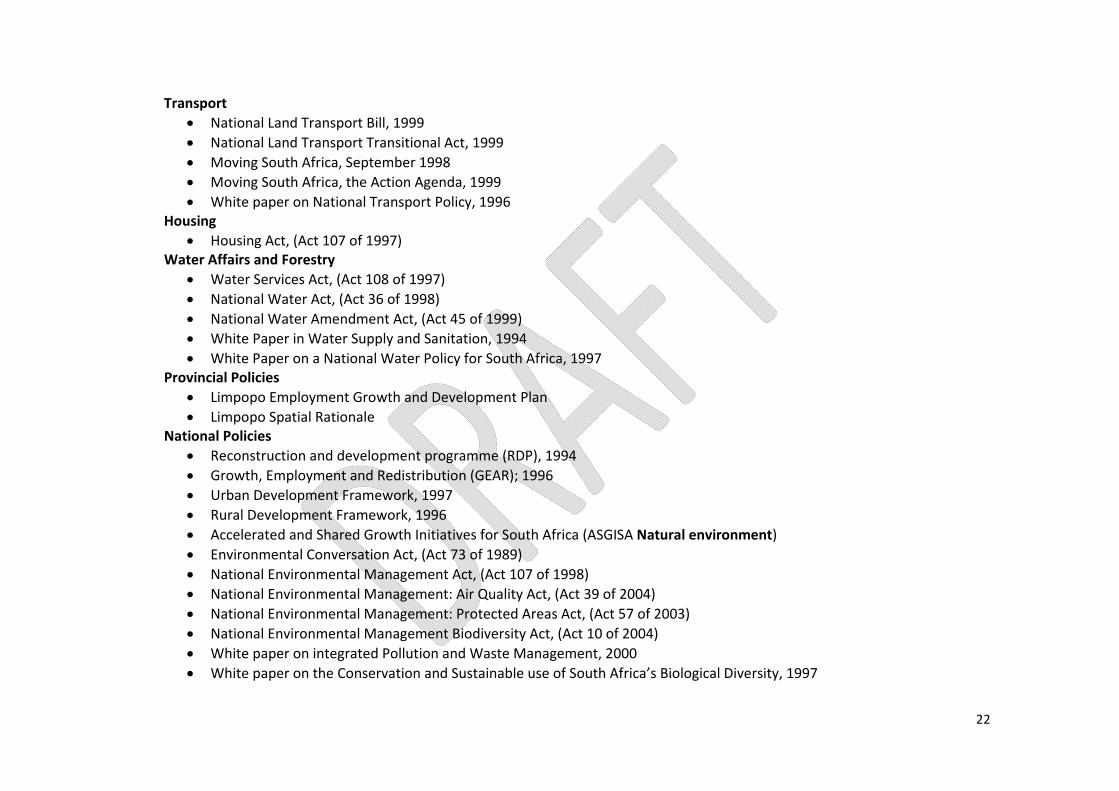
Transport National Land Transport Bill, 1999 National Land Transport Transitional Act, 1999 Moving South Africa, September 1998 Moving South Africa, the Action Agenda, 1999 White paper on National Transport Policy, 1996
Housing Housing Act, (Act 107 of 1997)
Water Affairs and Forestry Water Services Act, (Act 108 of 1997) National Water Act, (Act 36 of 1998) National Water Amendment Act, (Act 45 of 1999) White Paper in Water Supply and Sanitation, 1994 White Paper on a National Water Policy for South Africa, 1997
Provincial Policies Limpopo Employment Growth and Development Plan Limpopo Spatial Rationale
National Policies Reconstruction and development programme (RDP), 1994 Growth, Employment and Redistribution (GEAR); 1996 Urban Development Framework, 1997 Rural Development Framework, 1996 Accelerated and Shared Growth Initiatives for South Africa (ASGISA Natural environment) Environmental Conversation Act, (Act 73 of 1989) National Environmental Management Act, (Act 107 of 1998) National Environmental Management: Air Quality Act, (Act 39 of 2004) National Environmental Management: Protected Areas Act, (Act 57 of 2003) National Environmental Management Biodiversity Act, (Act 10 of 2004) White paper on integrated Pollution and Waste Management, 2000 White paper on the Conservation and Sustainable use of South Africa’s Biological Diversity, 1997
23
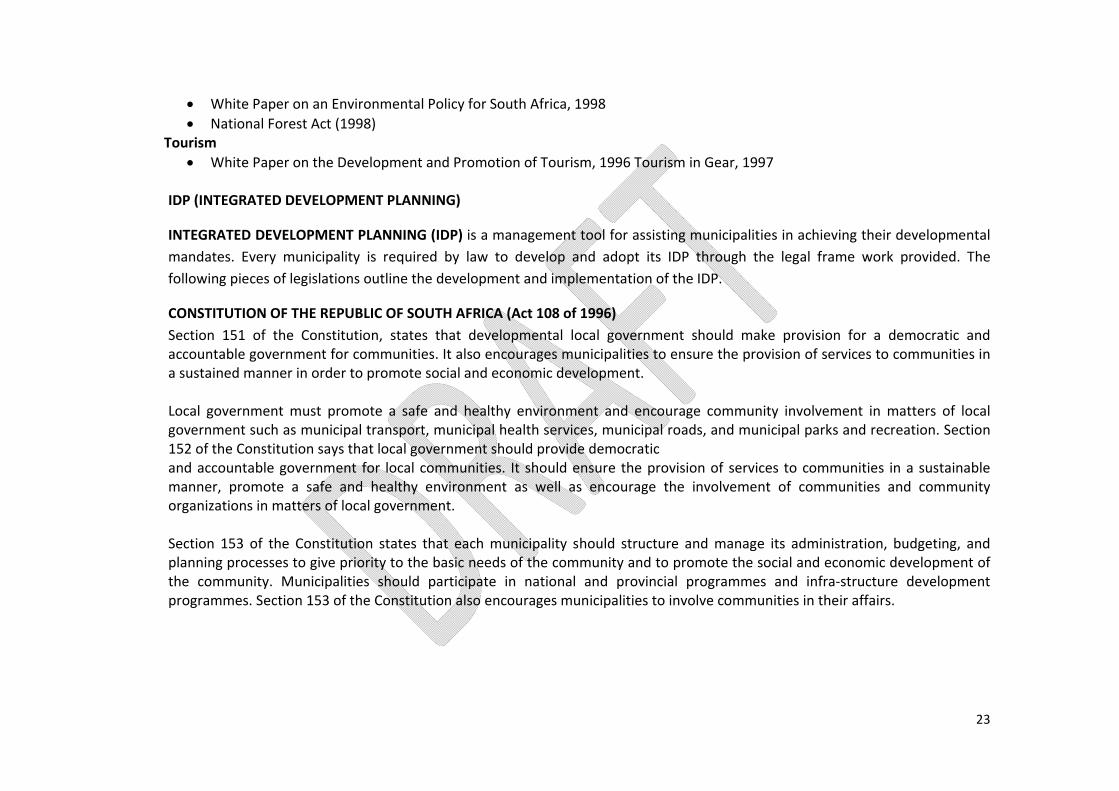
White Paper on an Environmental Policy for South Africa, 1998 National Forest Act (1998)
Tourism White Paper on the Development and Promotion of Tourism, 1996 Tourism in Gear, 1997
IDP (INTEGRATED DEVELOPMENT PLANNING)
INTEGRATED DEVELOPMENT PLANNING (IDP) is a management tool for assisting municipalities in achieving their developmental mandates. Every municipality is required by law to develop and adopt its IDP through the legal frame work provided. The following pieces of legislations outline the development and implementation of the IDP.
CONSTITUTION OF THE REPUBLIC OF SOUTH AFRICA (Act 108 of 1996) Section 151 of the Constitution, states that developmental local government should make provision for a democratic and accountable government for communities. It also encourages municipalities to ensure the provision of services to communities in a sustained manner in order to promote social and economic development. Local government must promote a safe and healthy environment and encourage community involvement in matters of local government such as municipal transport, municipal health services, municipal roads, and municipal parks and recreation. Section 152 of the Constitution says that local government should provide democratic and accountable government for local communities. It should ensure the provision of services to communities in a sustainable manner, promote a safe and healthy environment as well as encourage the involvement of communities and community organizations in matters of local government. Section 153 of the Constitution states that each municipality should structure and manage its administration, budgeting, and planning processes to give priority to the basic needs of the community and to promote the social and economic development of the community. Municipalities should participate in national and provincial programmes and infra‐structure development programmes. Section 153 of the Constitution also encourages municipalities to involve communities in their affairs.

24
WHITE PAPER ON TRANSFORMING PUBLIC SERVICE DELIVERY (BATHO PELE WHITE PAPER OF 1997) The paper flows from the White Paper on the Transformation on Public Service (1995). In terms of the White Paper, transforming service delivery is identified as one of Government’s priority areas. The White Paper is primarily about how public services are provided, and specifically about the efficiency and effectiveness of the way in which services are delivered. It “seeks to introduce a fresh approach to service delivery, an approach which puts pressure on systems, procedures, attitudes and behaviour within the Public Service and reorients them in the customer’s favour, an approach which puts the people first”. The introduction of the concept of Batho Pele, which means putting people first, provides the following eight service delivery principles in an attempt to ensure that the people, as customers to the public institutions, come first. Furthermore, the adoption of the concept “Customer” implies: Listening to their views and taking account of them in making decisions about what services are to be provided; Treating them with consideration and respect; Making sure that the promised level and quality of services is always of the highest standard; and Responding swiftly and sympathetically when standards of service fall below the promised standard.
In giving effect to the notion of treating the recipients of government services as customers, the White Paper articulates that public sector, including the local government sphere, should be governed by the following ethos (principles):
Consultation: citizens should be consulted about the level and quality of the public service they receive and wherever possible,
should be given a choice about the services that are offered; Service Standards: Citizens should be told what level and quality of public services they would receive so that they are aware
of what to expect; Access: All citizens should have equal access to the services to which they are entitled; Courtesy: Citizens should be treated with courtesy and consideration; Information: Citizens should be given full, accurate
information about the public services that are entitled to receive;

25
Openness and transparency: Citizens should be told how the national and provincial departments are run, how much they cost, who is in charge;
Redress: If the promised standard of service is not delivered, citizens should be offered an apology, a full explanation and a speedy and effective remedy,
when complaints are made, citizens should receive a sympathetic, positive response; Value for money: Public services should be provided economically and efficiently in order to give citizens the best possible
value for money.
A.3. WHITE PAPER ON LOCAL GOVERNMENT (1998) The White Paper on Local Government (1998) paper views that Integrated Development Planning as a way of achieving developmental government. The Integrated Development Planning intends to: Align scarce resources around agreed policy objectives; Ensure integration between sectors with local government; Enable alignment between provincial and local government and Ensure transparent interaction between municipalities and residents, making local government accountable (RSA, 1998, 18). The paper establishes a basis for developmental local government, in which, “local government is committed to working with citizens and groups within the community to find sustainable ways to meet their social, economic and material needs and improve the quality of their lives”. It also encourages public consultation on policy formulation and in the monitoring and evaluation of decision – making and implementation.
A.4. MUNICIPAL SYSTEMS ACT (Act 32 of 2000, as amended) The Act regulates the IDP. It requires the municipality to undertake developmentally oriented planning so as to ensure that it strives to achieve the objectives of local government set out in Section 152 and 153 of the Constitution. Section 25 (1) requires the Municipal Council, within a prescribed period after the start of its elected term, to adopt a single, inclusive and strategic plan for the development of the municipality which: Links, integrates, co – ordinates and takes into account proposals for the development of the municipality; Aligns the resources and capacity of the municipality with the implementation of the plan; Forms the policy framework and general basis on which annual budgets must be based;

26
Complies with the provisions of Chapter 5, and Is compatible with the national and provincial department plans and planning requirements binding on the municipality in
terms of legislation. Section 26 of the Act further outlines the core components of the integrated development plan of a municipality. It requires the integrated development plan of the municipality to reflect: The municipal council’s vision for the long term development of the municipality with special emphasis on the municipality’s
most critical development and internal transformation needs; An assessment of the existing level of development in the municipality, which must include an identification of communities
which do not have access to basic municipal services; The council’s development priorities and objectives for its elected term; The council’s development strategies which must be aligned with any national or provincial sector plans and planning
requirements binding on the municipality in terms of the legislations; The council’s development strategies which must be aligned with any national or provincial sector plans and planning
requirements binding on the municipality in terms of the legislations; A spatial development framework which must include the provision of basic guidelines for a land use management system of
the municipality; The council’s operational strategies; Applicable disaster management plan; A financial plan, which must include budget project for at least the next three years, and The key performance indicators and performance targets determined in terms of section 41.
A.5. MUNICIPAL FINANCE MANAGEMENT ACT (ACT 56 OF 2003) The Municipal Finance Management Act (56 of 2003) was promulgated to secure sound and sustainable management of the financial affairs of municipalities and other institutions in the local sphere of government. The Act provides a mandatory provision that relate to financial and performance management. Section 2 of the Act stipulates that the object is to secure sound and sustainable management of the financial affairs of the local government institutions to which this Act applies by establishing norms and standards for:
27
Ensuring transparency, accountability and appropriate lines of responsibility in the fiscal and financial affairs of municipalities and municipal entities; The management of revenues, expenditures, assets and liabilities and the handling of financial dealings, budgetary and
financial planning processes; The coordination of those processes with those of the other spheres of government, Borrowing; Supply chain management; and Other financial matters.
Waterberg District Municipality’s involvement in the budget process is to ensure compliance with the provision of the Municipal Finance Management Act. It is crucial that the IDP review process facilitate community participation, provide ward level information, encourage discussion on priorities and provide an opportunity for feedback.
The main strategic outputs of the budget reform are to ensure: Modernizing financial management and improving accountability; Multi – year budgeting; Deepening and improving the budget preparation process, by involving the political leadership and community; Ensuring that the IDP and budgets are linked, and that the IDP takes account of budgetary resources, and contain proper
capital and maintenance plans; Improving the in – year implementation of the budget; and Improving the auditing and performance reporting after the financial year has ended.
TRADITIONAL LEADERSHIP AND GOVERNANCE FRAMEWORK AMENDMENT ACT (ACT 41 of 2003)
This Act makes clear the role of the traditional leadership in the democratic and co – operative governance. The Act envisages an active involvement of the traditional leadership in the formulation and the implementation of the integrated development plans. Section 4 of the Act provides for the establishment of traditional councils that should:
28
Support municipalities in the identification of community needs; Facilitate the involvement of the traditional community in the development or amendment of the integrated development
plan of a municipality in whose area that community resides; Participate in the development of policy and legislation at the local level; and Promote the ideals of co – operative governance, integrated development planning, sustainable development and service
delivery to promote indigenous knowledge systems for sustainable development and disaster management. Section 5 (2) of the Act affirms that any partnership between a municipality and a traditional council must:
a. Be based on the principles of mutual respect and recognition of the status and roles of the respective parties; and b. Be guided by and based on the principles of co – operative governance.
One village resides in traditional authority governed area. To this effect, Bela Bela Municipality has involved the traditional leader in both the IDP review process and any other developmental matter involving their areas of governance.
INTER – GOVERNMENTAL RELATIONS FRAMEWORK ACT (ACT 13 of 2005) The Act is a response to the limited successes in the alignment efforts among the three spheres of government. The Act creates a framework to support Intergovern‐mental cooperation and coordination as required by the Constitution in its definition of “cooperative governance”. It provides for the obligation of all spheres to participate in the planning processes of the municipality and in turn allow their own planning processes to be influenced by the municipal IDP’s. Municipal IDPs are regarded as important planning frameworks to integrate both the national and provincial programme in specific local area. The municipality is participating in the district – planning forum, district – municipal managers’ forum, district – mayors forum and as well as in the Premier’s Intergovernmental Forum. The participation is aimed at ensuring proper alignment and coordination of local, district and provincial plans. The Act establishes structures and processes that enhance inter – governmental planning and monitoring processes for local, provincial and national spheres of governance.
PERFORMANCE MANAGEMENT SYSTEM A Municipality’s Performance Management System entails a framework that describes and represents how the municipality’s cycle and processes of performance, planning, measurement, review, reporting and improvement will be conducted, organized and managed, including determining the roles of the different role – players.

29
It is critical that Political Leadership, Managers and staff be involved to ensure that the municipality embraces the IDP and its implementation – which is Performance Management in practice. Implementing the processes and systems needed to operationalise the IDP will determine the ultimate success of the municipality. The following needs to be taken into consideration when starting to implement the IDP: Plan for performance by clarifying objectives and outputs to be achieved; Clarify performance expectations by setting standards ant targets for each indicator to assess and evaluate performance in
practice; Monitor, measure, assess and evaluate performance, and Link strategic priorities, goals and objectives agreed in the IDP by:
Enabling staff to understand how their job contributes to the aforementioned; Ensuring resources are directed and used in efficient, effective and economic ways by each person in the municipality; Including communities and other stakeholders; decision – making, monitoring and evaluation; Learning from experience and use it to continuously improve what’s achieved, and maintaining transparency and
accountability and promoting good governance articulated in the Batho Pele principles. 1.8 POWERS AND FUCTIONS OF THE MUNICIPALITY. Lephalale Municipality is authorized to exercise and perform the following powers and functions as set out in schedule 4, part A and B of the Constitution of the Republic of South Africa, act 108 of 1996: Table1.Assessment of powers and functions Service
Authority for the service Description of function performed by Municipality Local
Municipality District Municipality
Air pollution Yes Air pollution control by monitoring the institutions that are more likely to pollute the air
Building regulation Yes Enforcing the national building regulations Bulk supply of Electricity Yes Supply maintain all electricity functions Fire fighting Yes Provide firefighting services

30
Service
Authority for the service Description of function performed by Municipality Local
Municipality District Municipality
Local tourism & LED Yes Provide LED and Tourism enhancement support Municipal planning Yes Forward planning; Land use control; Policy development; GIS Municipal health services Yes Provision of municipal health services through inspections,
investigations and control Municipal public transport Yes Ensure that accessible, safe, adequate and affordable public
transport is provided Municipal roads and storm water
Yes Provision, upgrading and maintenance of roads and storm water systems
Trading regulation Yes By‐law and regulation enforcement Bulk supply of water Yes Provision of potable water Sanitation Yes Provision of hygienic sanitation systems Billboards & the display Yes Regulation, control and display of advertisement and
billboards Cemetery, funeral parlours & crematoria
Yes Provision of graves to the community for internment of deceased
Street cleansing Yes Sweeping streets, picking litter, and emptying of street bins
Noise pollution Yes Control of noise pollutionControl of public nuisance Yes Control of public nuisance and inspection thereof issuing of
notices Control of undertakings that sell liquor to the public
Yes Regulated by liquor Act – custodian SAPS and liquor board
Street trading Yes By‐law and regulation enforcement Licensing & undertakings to sell food to the public
Yes Quality control, Safety and hygiene regulation
Refuse removal, refuse dump & solid waste disposal
Yes Waste collection; waste transport and Landfill management
Public places Yes Maintaining and provision of sports facilities

31
Service
Authority for the service Description of function performed by Municipality Local
Municipality District Municipality
Traffic and parking Yes Enforcement of Road Traffic Act Occupational health & safety No Competency of the Department of labour Municipal parks & recreation Yes Establishment and maintenance of parks Additional Functions Performed Housing No No Department of Cooperative Governance, Housing and
Traditional Affairs as per agreement with the Municipality Library, Arts & Culture No No Department of Sports, Arts and Culture with the Municipality
as per agreement Registering Authority No No Department of Transport with the Municipality as per
agreement MUNICIPAL PRIORITY ISSUES
1. Rational planning to bridge first and second economies and provide adequate land for development. 2. Enhance revenue and financial management. 3. Provide quality and well maintained infrastructural services in all municipal areas. 4. Protect the environment and improve community well‐being. 5. Create a conducive environment for businesses to invest and prosper. 6. Responsible, accountable, effective and efficient corporate governance 7. Capacitate disadvantaged groups. 8. Provide quality and well maintained infrastructural services in all municipal areas. 9. Improve functionality, performance and professionalism.

32
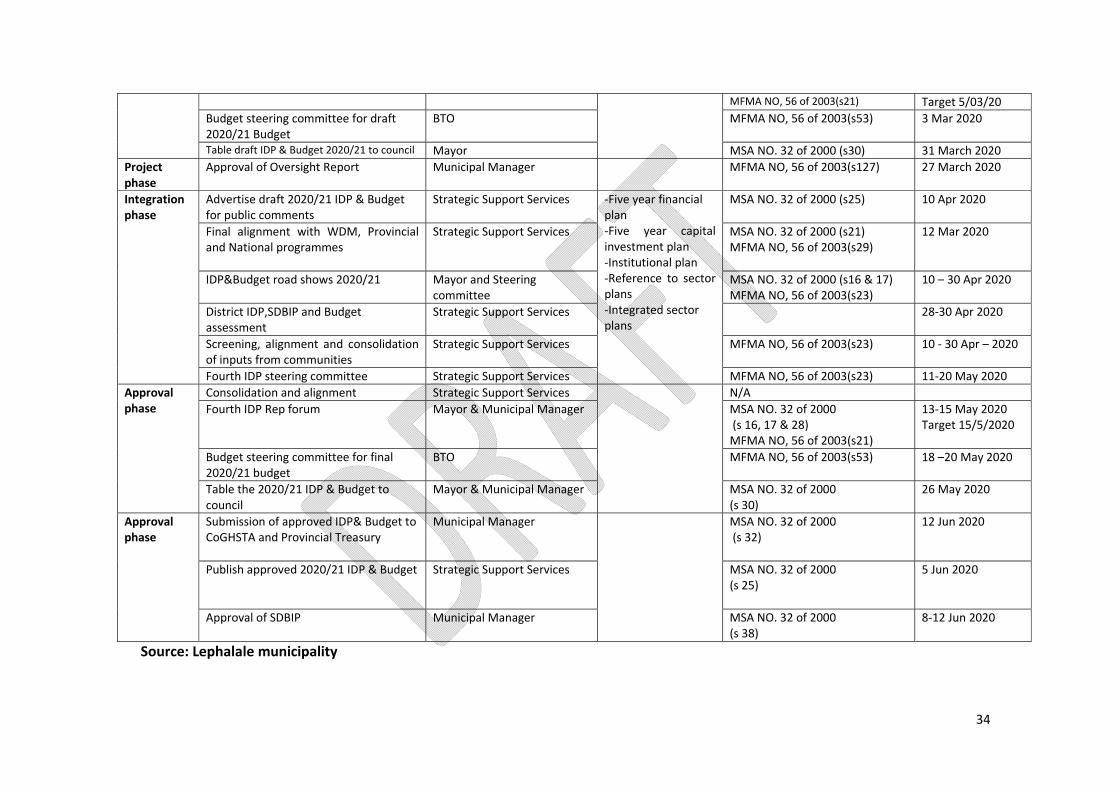
1.9 IDP PROCESS OVERVIEW. The Lephalale Municipality Process Plan is seen as a document that describes how the institution will develop and implement the integrated development plan through budget in its area of jurisdiction. Therefore it will have meaningful bearing on the current IDP document once completed and/ or most importantly, it may lead to the process of the development of a new and all‐inclusive integrated development planning methodology to plan and actualize future development in Lephalale through our budgetary allocations. The Process Plan is thus similar to business plan and deals with the allocation of Municipality capacity and resources in support of and serve as a guideline in terms of which council will carry out its mandate through integrated development planning. Table1.5.IDP/Budget process plan for 2020/21 Financial Year
IDP Phase Deliverables Coordinating/Responsible Department
Output Legislative Requirement Time Frame
Preparation phase
Develop draft 2020/21 IDP, Budget and PMS process plan
Strategic Support Services Approved IDP, Budget and PMS process plan
MSA NO. 32 of 2000 (s27,28,29 and 41) MFMA NO, 56 of 2003(s21)
01 – 31 July 2019
Alignment with WDM framework for IDP
Waterberg District Municipality
MSA NO. 32 of 2000 (s27) MFMA NO. 56 of 2003 (s21)
15 ‐26 July 2019
Advertise draft IDP, Budget & PMS Process Plan
Strategic Support Service MSA NO. 32 of 2000 (s28) 1 – 9 August 2019 9 Aug 2019
First IDP Steering Committee Meeting Strategic Support Services MSA NO. 32 of 2000 (s17 & 28) 15 –23 Aug19 Target 20/8/19
First IDP Rep Forum Meeting Strategic Support Services MSA NO. 32 of 2000 (s16,17and 18) MFMA NO, 56 of 2003(s21)
19 – 23 Aug 2019 Target 21/8/19
Table draft IDP 2020/21 IDP, Budget and PMS process plan to council
Mayor and Municipal Manager
MSA NO. 32 of 2000 (s28)
27 ‐31 July 2019 Target 30/7/2019
Analysis phase
Provincial District engagement session CoGHSTA, OTP and WDM ‐Assessment of existing level of development ‐Priority issues/problems
MFMA NO, 56 of 2003(s21)MSA NO. 32 of 2000 (s29)
26 Sep 2019
Analysisphase
Public engagement/Community based planning session
Strategic Support Services ‐Understanding of courses of priority issues/problems
MSA NO. 32 of 2000 (s16 & 17) 2 – 30 Sept 2019
2nd IDP Steering committee meeting Municipal Manager MSA NO. 32 of 2000 (s17 & 28) 14‐22 Oct 2019

33
‐Information on available resources
Target 22/10/19 2nd IDP Rep Forum Strategic Support Services MSA NO. 32 of 2000 (s16,17and
28) MFMA NO, 56 of 2003(s21) 26 Oct 2019
Strategies phase
Provincial District engagement session CoGHSTA, OTP and WDM ‐Vision (for Municipality) ‐Objective for each priority issue ‐Strategic options and choice of strategy
MFMA NO, 56 of 2003(s21)MSA NO. 32 of 2000 (s29)
8– 19 Nov 2019
Strategic planning session(technical Steering committee)
Strategic Support Services MSA NO. 32 of 2000 (s26) 18 – 29 Nov 2019 Target 17 – 18 Nov 19
Consolidation and alignment with national, provincial and district strategies
Strategic Support Services MSA NO. 32 of 2000 (s26) 2 ‐ 13 Dec 2019
Project phase
Project identification Strategic Support Services ‐Tentative financial framework for projects ‐Identification of projects
N/A 6 – 24 Jan 2020
Project phase
Project identification Strategic Support Services ‐Projects output, targets and location ‐Project related activities and time schedule ‐Cost and budget estimates ‐Performance indicators ‐Information on available resources
N/A 6 – 14 Jan 2020
Task team consultation Strategic Support Services N/A 14 – 20 Jan 2020 Report on the mid‐term performance of the SDBIP
Office of the MM MFMA NO, 56 of 2003(s72)
25 Jan 2020
Table draft annual report to council Office of the MM MFMA NO, 56 of 2003(s127)
29 Jan 2020
Strategic planning session Office of the MM MSA NO. 32 of 2000 (s26) 6 – 14/02/20 Target 10–12/02/20
Mid‐year performance Office of MM MFM NO 56 (s72) 25 Jan 20120 Publicize annual report for public comments
Office of the MM MFMA NO, 56 of 2003(s127) 27 Feb ‐7 Mar 2020
Provincial District engagement session CoGHSTA, OTP and WDM MFMA NO, 56 of 2003(s21) MSA NO. 32 of 2000 (s29)
12 Feb 2020
Community consultation forums on proposed 2020/21 tariffs, indigent credit, credit control and free basic services
BTO MFMA NO, 56 of 2003(s21 & 24)
17 Feb 2020 Target 17 – 20 Feb 2020
IDP Steering committee Municipal Manager MSA NO. 32 of 2000 (s17 & 28)
Target 7/03/2020
Third IDP Rep Forum Mayor & Municipal Manager MSA NO. 32 of 2000 (s 16, 17 & 28)
2‐6/03/2020
34
MFMA NO, 56 of 2003(s21) Target 5/03/20 Budget steering committee for draft 2020/21 Budget
BTO MFMA NO, 56 of 2003(s53) 3 Mar 2020
Table draft IDP & Budget 2020/21 to council Mayor MSA NO. 32 of 2000 (s30) 31 March 2020 Project phase
Approval of Oversight Report Municipal Manager MFMA NO, 56 of 2003(s127) 27 March 2020
Integration phase
Advertise draft 2020/21 IDP & Budget for public comments
Strategic Support Services ‐Five year financial plan ‐Five year capital investment plan ‐Institutional plan ‐Reference to sector plans ‐Integrated sector plans
MSA NO. 32 of 2000 (s25)
10 Apr 2020
Final alignment with WDM, Provincial and National programmes
Strategic Support Services MSA NO. 32 of 2000 (s21)MFMA NO, 56 of 2003(s29)
12 Mar 2020
IDP&Budget road shows 2020/21 Mayor and Steering committee
MSA NO. 32 of 2000 (s16 & 17)MFMA NO, 56 of 2003(s23)
10 – 30 Apr 2020
District IDP,SDBIP and Budget assessment
Strategic Support Services 28‐30 Apr 2020
Screening, alignment and consolidation of inputs from communities
Strategic Support Services MFMA NO, 56 of 2003(s23)
10 ‐ 30 Apr – 2020
Fourth IDP steering committee Strategic Support Services MFMA NO, 56 of 2003(s23) 11‐20 May 2020 Approval phase
Consolidation and alignment Strategic Support Services N/AFourth IDP Rep forum Mayor & Municipal Manager MSA NO. 32 of 2000
(s 16, 17 & 28) MFMA NO, 56 of 2003(s21)
13‐15 May 2020 Target 15/5/2020
Budget steering committee for final 2020/21 budget
BTO MFMA NO, 56 of 2003(s53) 18 –20 May 2020
Table the 2020/21 IDP & Budget to council
Mayor & Municipal Manager MSA NO. 32 of 2000 (s 30)
26 May 2020
Approval phase
Submission of approved IDP& Budget to CoGHSTA and Provincial Treasury
Municipal Manager MSA NO. 32 of 2000 (s 32)
12 Jun 2020
Publish approved 2020/21 IDP & Budget Strategic Support Services MSA NO. 32 of 2000 (s 25)
5 Jun 2020
Approval of SDBIP Municipal Manager MSA NO. 32 of 2000 (s 38)
8‐12 Jun 2020
Source: Lephalale municipality

35
IDP INSTITUTIONAL AND MANAGEMENT ARRANGEMENTS.
The following diagram indicates the organizational structure that was established to ensure the institutionalization of the IDP process, the effective management of the drafting of the IDP and to ensure proper and sufficient stakeholder participation in decision‐making.
DIAGRAM1: INSTITUTIONAL ARRANGEMENTS FOR IDP REVIEW PROCESS
MUNICIPAL MANAGER
IDP STEERING COMMITTEE IDP REP FORUM
INFRASTRUCTURE SERVICES
CORPORATE SUPPORT SERVICE
BUDGET & TREASURY
SOCIAL SERVICES DEVELOPMENT PLANNING
MAYOR/EXECUTIVE COMMITTEE
COUNCIL
STRATEGIC MANAGEMENT
IDP REPRESENTATIVES FORUM: STAKEHOLDERS: TRADITIONAL LEADERS, SECTOR DEPARTMENTS,NGO’S,etc
36
CHAPTER 2 2 SITUATIONAL ANALYSIS
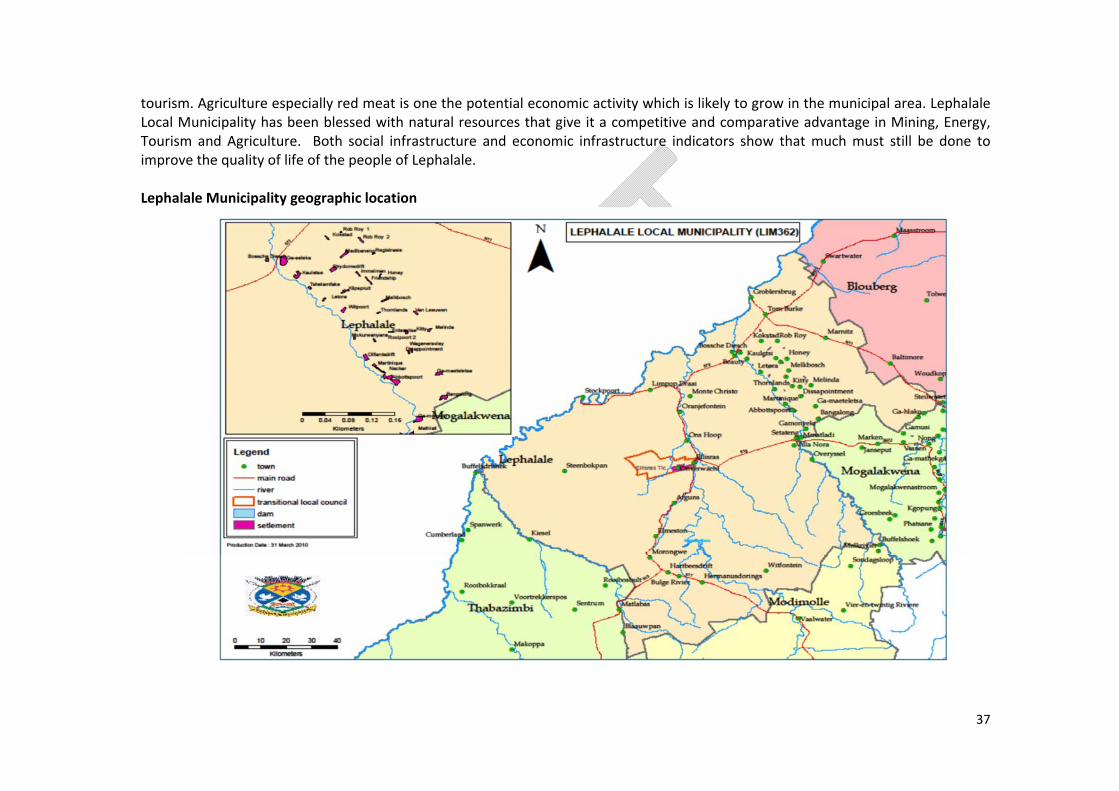
2.1 MUNICIPAL OVERVIEW This section describes the geographical area within which Lephalale Municipality is located within Waterberg District and Limpopo Province at large. In addition this section provides information on demographic profile and the status of service delivery covering the following key performance areas: Spatial development, Environmental issues, Infrastructure investment (service delivery) Local Economic Development, Financial Management, Institutional Management and Public Participation. 2.2 EXECUTIVE SUMMARY. The Municipality is located in the North Western part of Waterberg District of Limpopo Province of the Republic of South Africa. It borders with four Local Municipalities (Blouberg, Modimolle‐Mookgophong, Mogalakwena and Thabazimbi). Its North‐Western border is also part of the International Border between South Africa and Botswana. The Lephalale Municipality is the biggest Municipality in the Limpopo Province (covering 14 000km²). The town of Lephalale is located a mere 280 km from Tshwane and a recognized gateway to Botswana and other Southern African Countries. The town Lephalale (Ellisras/Onverwacht/Marapong) is located approximately 40 km from the border of Botswana. It is situated between 23˚30' and 24˚00' south latitude 27˚30' and 28˚00' east longitude. Lephalale Municipal area’s contribution of mining to GDP is significant at 59.21%. Electricity contributes 11.33% to the GDP and its contribution to the Waterberg electricity sector is at 69.65%. Other sectors that have a significant contribution to the Waterberg GDP per sector include agriculture, mining, and manufacturing. Agriculture (38.85%) is the sector that employs the largest part of the workforce and is followed by community services (15.71%). Nestled at the spur of the Waterberg Mountains, Lephalale is a place of peace and breath‐taking beauty. Discover why Lephalale is called “the heartland of the Waterberg bushveld”. As part of the Waterberg biosphere, Lephalale area is richly blessed with pristine natural beauty and an abundance of fauna and flora. Lephalale offers an infinite variety of scenic contrasts and encompass the unique Waterberg wilderness with its extraordinary beauty which boasts superb vistas, mountain gorges, clear streams and rolling hills. Rich in geological sites and rock art is a strong draw‐card for the region, suggesting its links to many previous generations. Hence, the importance of tourism industry to the economy of the area is likely to continue to grow into the future. This is likely to be related to the hunting and ecotourism industries, but could also be linked to any expansion of the industrial operations and the related business
37
tourism. Agriculture especially red meat is one the potential economic activity which is likely to grow in the municipal area. Lephalale Local Municipality has been blessed with natural resources that give it a competitive and comparative advantage in Mining, Energy, Tourism and Agriculture. Both social infrastructure and economic infrastructure indicators show that much must still be done to improve the quality of life of the people of Lephalale. Lephalale Municipality geographic location
38
2.3 DEMOGRAPHIC OVERVIEW

39
Age and gender profile. Age group 0‐4 5‐9 10‐14 15‐19 20‐24 25‐29 30‐34 35‐39 40‐44 45‐49 50‐54 55‐59 60‐64 65‐69 70‐74 75+ Total
Male 8510 5856 5991 6618 8389 12019 7866 5851 4443 4192 3013 2233 1494 847 399 500 78320
Female 7932 6121 5948 5288 6920 6357 5363 4133 2933 2665 2200 1774 1355 918 834 1181 61919
Total 1644 1197 11939 11906 1530 18376 13229 9983 7376 6857 5213 4006 2849 1765 1233 1681 14024
Percentage
11.9% 8.7% 8.6% 8.7% 10.9% 11.4% 9.7% 7.2% 5.3% 4.9% 3.8% 3.0% 2.2% 1.3% 1.0% 1.2% 100%
Source: Statssa
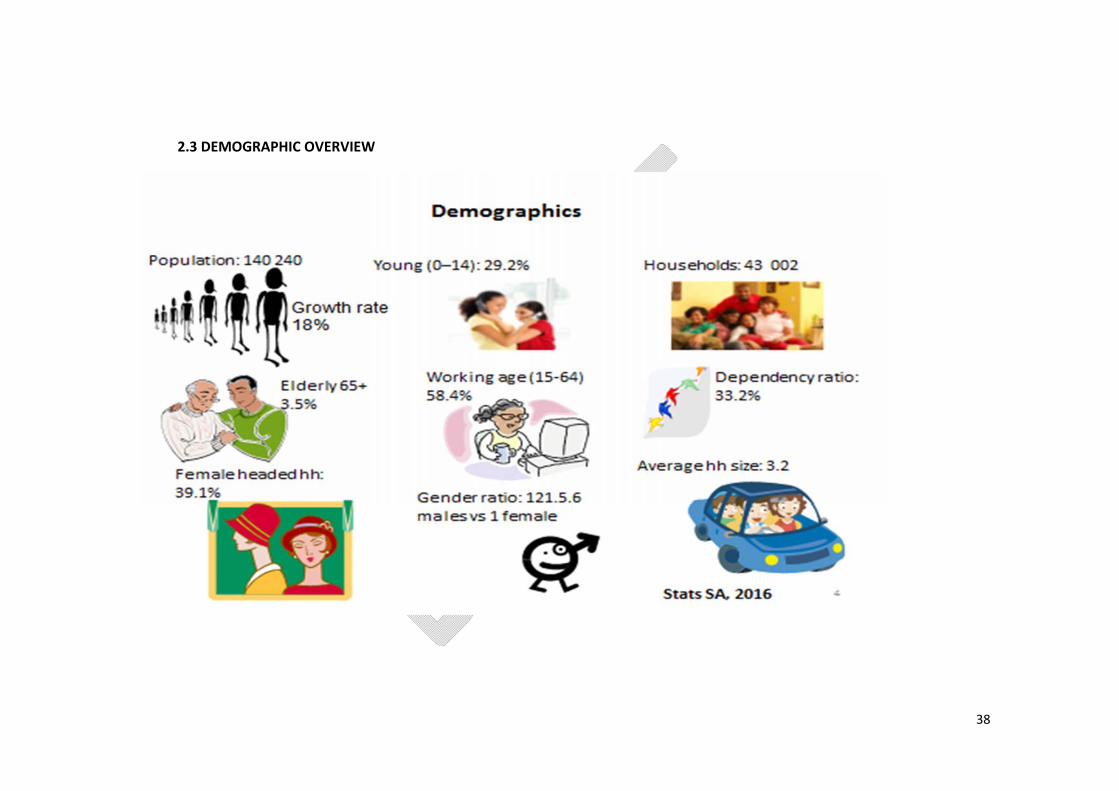
The community survey of 2016 projected a 21.8% in male population compared to 13.5% of females with the overall increase of 18% against 35.8% in 2011. The increase in population may be linked to the skills development centres and job opportunities in the Municipality as a result of the Waterberg coalfield. The community survey suggested a population increase, considerably higher than the provincial growth rate of 0.84% per year for the last five years. The household size has declined from 3.9 in 2011 census to 3.2 in the 2016 community survey. Almost 58.4% of the population is economically active in terms of age. The youth represent 40.7% of the population. 2.4 POPULATION TRENDS Key population statistics
Total Household 43 002 100%
Total Population 140 240 100%
Young (0 – 14) 40 358 29.2%
Working Age 95 103 54.8%

40
Elderly (65+) 5 403 3.5%
Dependency ratio 35 136 33.2%
Sex ratio 121 ‐5. 6 21‐1
Growth rate 2011 – 2016 13.5%
Population density 8 person per km²
Unemployment rate 2016 22.2%
Youth unemployment rate 2016 27%
No schooling aged 20+ 3 769 6.2%
Higher education aged 20+ 12 615 16.4%
Matric aged 20+ 16 579 23.5%
Number of households 43 0002
Number of agricultural households 6 757 22.6%
Average household size 3.2
Female headed households 16 443 39.1%
Formal dwellings 34 610 82.3%
Flush toilet connected to sewer 17 536 41.6%
Piped water inside dwelling 17 390 41.3%
Electricity for lighting 37 602 89.4%
Source: Stats SA

41
2.5 EDUCATION PROFILE. The table below depicts the number of people who had reached each level of education as presented in the 2011 census. Over the years there has been a remarkable decline in the number of people who have not received formal education. The number of people with no schooling has also decreased since 2001 to 2011, whilst those with education higher than grade 12 have increased from 2001 to 2011. Levels of educational attainment. YEAR 1996 2001 2011No schooling 10 479 10 905 6 684Some Primary 6 860 9 661 8 650Completed Primary 2 666 3 228 3 391Some Secondary 10 063 12 111 24 951Grade12/Grade 10 4 477 6 159 16 579Higher 2 059 2 764 7 160Source: Statssa
People with disability State of health Number No difficulty 116 584 Some difficulty 6 500 A lot of difficulty 774 Cannot do at all 251 Do not know 69 Cannot yet be determined 4 651 Unspecified 3 166 Not applicable 8 245 Total 140 240 Source: Statssa
42
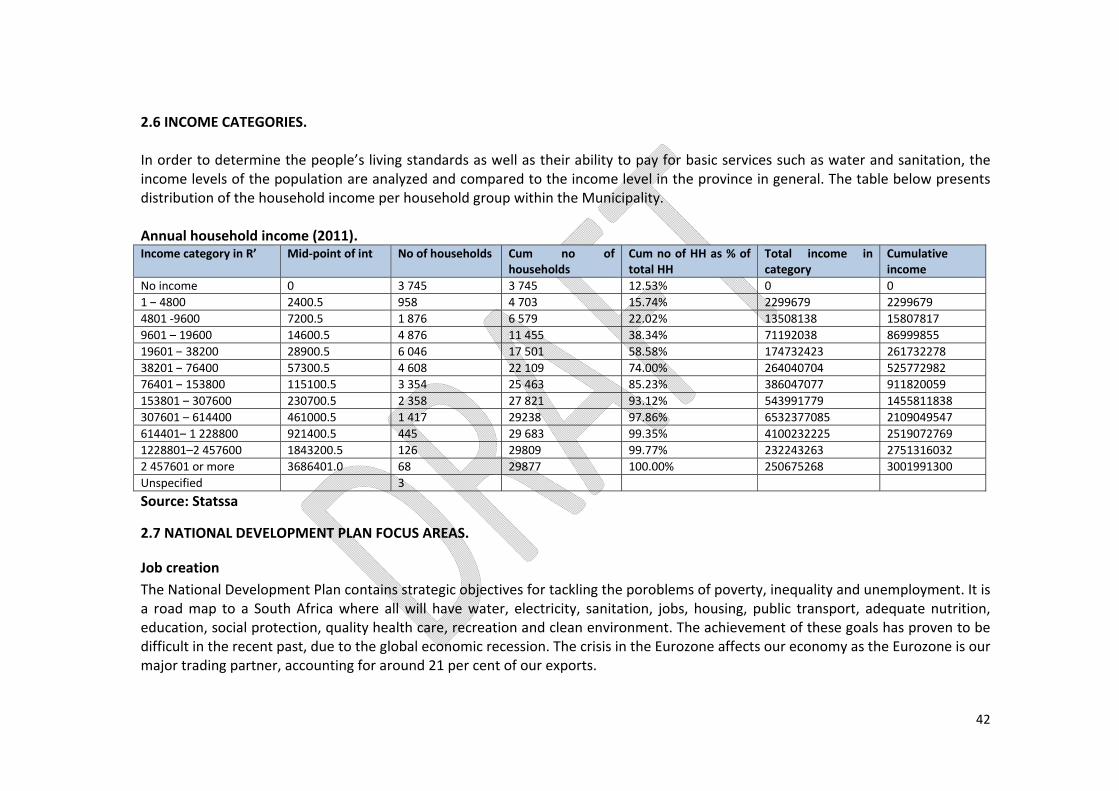
2.6 INCOME CATEGORIES. In order to determine the people’s living standards as well as their ability to pay for basic services such as water and sanitation, the income levels of the population are analyzed and compared to the income level in the province in general. The table below presents distribution of the household income per household group within the Municipality. Annual household income (2011). Income category in R’ Mid‐point of int No of households Cum no of
households Cum no of HH as % of total HH
Total income in category
Cumulative income
No income 0 3 745 3 745 12.53% 0 01 – 4800 2400.5 958 4 703 15.74% 2299679 22996794801 ‐9600 7200.5 1 876 6 579 22.02% 13508138 158078179601 – 19600 14600.5 4 876 11 455 38.34% 71192038 8699985519601 – 38200 28900.5 6 046 17 501 58.58% 174732423 26173227838201 – 76400 57300.5 4 608 22 109 74.00% 264040704 52577298276401 – 153800 115100.5 3 354 25 463 85.23% 386047077 911820059153801 – 307600 230700.5 2 358 27 821 93.12% 543991779 1455811838307601 – 614400 461000.5 1 417 29238 97.86% 6532377085 2109049547614401– 1 228800 921400.5 445 29 683 99.35% 4100232225 25190727691228801–2 457600 1843200.5 126 29809 99.77% 232243263 27513160322 457601 or more 3686401.0 68 29877 100.00% 250675268 3001991300Unspecified 3 Source: Statssa
2.7 NATIONAL DEVELOPMENT PLAN FOCUS AREAS.
Job creation The National Development Plan contains strategic objectives for tackling the poroblems of poverty, inequality and unemployment. It is a road map to a South Africa where all will have water, electricity, sanitation, jobs, housing, public transport, adequate nutrition, education, social protection, quality health care, recreation and clean environment. The achievement of these goals has proven to be difficult in the recent past, due to the global economic recession. The crisis in the Eurozone affects our economy as the Eurozone is our major trading partner, accounting for around 21 per cent of our exports.
43
The National Development Plan proposes to create 11 million jobs by 2030 through: Realising an environment for sustainable employment and inclusive economic growth Promoting employment in labour‐absorbing industries Raising exports and competiveness Strengthening government’s capacity to give leadership to economic development Mobilising all sectors of society around national vision
Improving Infrasrtucture. Investment spending in South Africa fell from an average of almost 30 percent of gross domestic product (GDP) in the early 1980s to about 16 percent by the early 2000s. Public sector investment in economic infrastructure crowds in private investment. Private investment is a function of current and projected growth and profitability. Importantly, it is also a function of mutual trust and confidence in economic policies. In recent years, the public sector has favoured consumption over investment. The government’s 2011 Medium Term Budget Policy Statement acknowledges this and announces a shift in the consumption of expenditure towards investment, which is absolutely necessary.
Transition to a low‐carbon economy. South Africa needs to move away from the unsustainable use of natural resources. As water becomes scarcer, and global policy aims to price in the cost of carbon emmissions, the country needs a coherent plan to use water more sustainably and to emit less carbon. Similar approaches apply to protecting the oceans, soil and wildlife, which are used unsustainably to the detriment of the country’s future. All these needs to be done in a way that increases the ability to employ more labour productively. Changes to energy generation, water conservation and the uses of both are likely to be challenging and potentially disruptive for society. Managing this transition in a way that reduces costs, especially for the poor will require competent institutions, innovative economic instruments, clear and consistent policies, and an educated and understanding electorate.
An inclusive and integrated rural economy. By 2030, South Africa’s rural communities should have greater opportunities to participate fully in the economic, social and political life of the country. These opportunities will need to be underpinned by good quality education, healthcare, transport and other basic services,successful land reform, job creation and rising agricultural production will all contribute to the development of an inclusive rural economy. The economic and social legacy of colonialism and apartheid maen South Africa’s rural ereas are charactised by unusually high levels of porverty and joblessness, with very limited employment in agriculture.

44
Reversing the spatial effects of apartheid. Apartheid left a terrible spacial legacy. Housing policies since 1994, in some intances, have reinforced the spatial devide by placing low‐income housing on the periphery of cities, far from economic activity. Reversing the country’s spatial inheritance, even with sound and sensible policies, is likely to take decades. Settlement parttens should meet the needs and preferences of citizens, taking into account broader social, environmental and economic interests. Travel distances need to be shorter.
Improving the quality of education, training and ennovation. The quality of education for the majority of black leaners remains poor. Poor‐quality education not only denies many learners access to employement, it also affects the earnings potential and career mobility of those who do get jobs, and reduces the dynamism of South African businessess.
Quality health care for all. Long‐term health outcomes are shaped by factors largely outside the health system: lifestyle, nutrition, education, diet, sexual behaviour, exercise, road accidents and the level of voilence. Good health is essential for a productive and fulfilling life. The Diagnostic Report demonstrates the starkly interrelated challenges posed by crumbling health system and a rising disease burden. The public health system must be fixed. While greater use of private care, paid for either by users or health insurance, is part of the solution, it is no substitute for improvement of the public health system. Given the systemic weaknesses in that system today, a root‐and‐ branch effort to improve the quality of care is needed, especially at primary level.
Social protection. Effective social protection and welfare services are an intergral part of our programme for inclusive economic growth and central to the elimination of poverty and reduction of inequality. Social protection plays several roles in a society. Firstly, it sets a floor through which, social solidarity, we deem that no person should live below. At present given, South Africa’s extremes of unemployment and working poverty, many people regularly experience hunger and find it difficult to meet the basic needs of their families. Progressively and through multiple avenues, we seek a society where every one is lifted above this floor. Secondly, it plays an important role in helping households and families manage life’s risks. It also helps ease labour market transitions, thereby contributing towards a more flexible labour market and economic dynamism.
Building safer communities. When people feel unsafe it makes it hader for them to develop their capabilities, persue their personal goals and to take part in social and economic activity. To achieve the goals set out in this plan, South Africans need to feel safe everywhere and have confidence in the criminal justice system to protect them and to act speedily and effectively when required to do so.
45
By 2030, people living in South Africa should feel safe and have no fear of crime. Women, children and all vunerable groups should feel protected. They should have confidence in the criminal justice system to effectively apprehend and prosecute criminals who violate invidual and community safety.
Reforming the Public Service. In many countries plans fail because they are not implemented or because implementation is uneven. There needs to be a uniformity of effort and competence across the entire public service. There is a real risk that South Africa’s national plan could fail because the state is incapable of implementation. There must be a mechanism to remedy the uneven and often poor performance of the public service. A capable state does not materialise by decree, nor can it be legislated or created from conference resolutions. It has to be painstakingly built, brick by brick, institution by institution and sustained and rejuvinated over time. It requires leadership, sound policies, skilled managers and workers, clear lines of accountability, appropriate systems, and consistent and fair application of rules.
Fighting Corruption High corruption levels frustrate society’s ability to operate fairly and efficiently and the state’s ability to deliver on its mandate. In Transparency international’s global corruption survey, South Africa has fallen from 38th place in 2001 to 54th place in 2010, out of 178 countries. Corruption often involves both public and private sector participants. In addition to political will, the fight agianst corruption has to be fought on three fronts: deterrence, prevention and education. Deterrence helps people understand that they are likely to get caught and punished. Prevention is about systems (information, audit and so on) that make it hard to engage in corrupt acts.

46
2.8 2020 STATE OF THE NATION ADDRESS (SONA) 13FEBRUARY
Outcomes: increase generation capacity outside of Eskom finalise the Climate Change Bill, which provides a regulatory framework for the effective management of inevitable climate
change impacts by enhancing adaptive capacity, strengthening resilience and reducing vulnerability to climate change – and identifying new industrial opportunities in the green economy.
fix our public finances reduce government spending, prioritise resources more effectively, and improve the efficiency of our tax system are important
– but insufficient – contributions towards stabilising our public finances.
47
reduce irregular expenditure, by shifting government spending from consumption expenditure to investment in infrastructure, we aim to improve the state of public finances.
establish a sovereign wealth fund as a means to preserve and grow the national endowment of our nation, giving practical meaning to the injunction that the people shall share in the country’s wealth.
ensure that all SOEs are able to fulfil their developmental mandate and be financially sustainable. improve the quality and the relevance of our educational outcomes. student accommodation meaningful skills transfer and higher potential for labour intensive job creation than conventional roads construction methods. create opportunities for youth employment and self‐employment to reduce youth unemployment and creating pathways for young people into the economy by providing shorter, more flexible
courses in specific skills that employers in fast‐growing sectors need.. access to quality, affordable health care development of the District Development Model, a unique form of social compacting that involves the key role players in
every district to unlock development and economic opportunities. support and strengthen the capacity of municipalities as required by Section 154 of the Constitution and provide for the
monitoring and support of municipalities. (District‐based Model of Development, that seeks to take an integrated approach to` service delivery), launched at OR Tambo District Municipality, Ethekwini and Waterberg District Municipality.
2.9 2020 STATE OF THE PROVINCE ADDRESS (SOPA) 25 FEBRUARY There is a thriving economy in Limpopo against the backdrop of several catalytic projects. These include the Musina‐Makhado Special Economic Zones (SEZs), the Tubatsane SEZ, the revitalisation of the industrial parks, and agricultural and mining activities. These projects were piloted to create job opportunists for the youth, stimulate provincial economic growth and strengthen integrations between countries within the SADC region. Under these projects, several plants would be constructed, and it is projected that they would create over 21,000 jobs. The province has attracted a whopping R36.3‐billion in mining investment over the past seven months, despite the temporary closure of some mines and an economic downturn in South Africa. Five mines have committed to continue mining resources in two districts that harbour abundant mineral deposits, Exxaro for coal mining by Lejaja Mine for coal mining in Waterberg were amongst them.
48
Outcomes: expanding access to education and improving quality outcomes unlock the potential of agriculture focus on research and development, land availability and access, finance and partnership models, production, markets and
logistics, capacity building and training. constructing decent school sanitation infrastructure bulk water supply projects and road construction provide schools with ICT equipment reduce the number of qualified audit opinions and increase the number of clean audits, and this requires that issues of
irregular expenditure be dealt with. support the District Development Model initiative which aims to address service delivery and economic development
challenges through the synchronisation of planning across all spheres of government, working alongside social partners such as business and community”. Waterberg District Municipality was one of the municipality whereby the model was launched and piloted under the “One District; One Plan; One Budget; One Approach” theme.
CHAPTER 3 3 SPATIAL ANALYSES
3.1 The purpose of a Spatial Development Framework An SDF is a long term (10‐20 year plan) Development Framework with a vision, goals and objectives expressed spatially through strategies designed to address physical, social and economic defects. It is a Framework that strives to be consistent with Mayoral Development priorities. SDF functions at a Municipal scale and exists in a multi‐disciplinary environment, it is therefore not confined to IDP related projects and programme but integrates and coordinates development proposals and related strategies of all projects and programmes of Sector plans within various Spheres of Government and adjacent Municipalities.
49
3.2 Planning from the SDF perspective SDF is an indicative Framework concerned with growth and development of the Municipality and Local communities. It aims at reversing the legacy of planning that was distorted by apartheid ideologies. It eliminates traces of segregation, fragmentation, inequalities found in Municipal space. SDF is strategic in nature providing a Framework in which area based spatial plans (precinct plans) can be developed to ensure strategies and project initiatives are not generic but specific to deal with development pressures found within a particular Municipal areas. The SDF is a Framework that guides decisions on Land development providing confidence for investment purposes. It does not confer use rights to any property.
SDF restores dignity, creates a sense of place and ownership as it provides communities with a voice and vision on how they will want to see their areas developed. It is a framework driven by needs of the community approved by Municipal Council. SDF empowers communities to contribute ideas and solutions in all matters affecting them and it places accountability to the municipality to deliver services and allow development in a manner that is progressive, coherent and fair.
The SDF within the context of Municipal planning. All human activities have a spatial dimension. Human action impact on space and space helps to shape and direct human action. This dynamic relationship is addressed in a spatial development framework. It is critical that the SDF recognize both the integrated and dynamic nature of development. The need to integrate spatial planning and delivery with other core activities in the Municipality is critical in implementing a sustainable spatial development framework. The focus area includes among others a dual approach on the total area and emphasis is on determining and assessing Municipal wide trends and tendencies with the aim of:
i. Improved spatial functionality across the whole municipal area. ii. Integration with the district and provincial SDFs. iii. Identifying and developing a settlement typology for more detailed spatial planning.
The second focus area is more detailed and localized planning of the agreed settlement typology. This might imply a broad distinction between spatial frameworks for urban and rural components of the Municipality, but the focus remains integration and improved functionality in the local and broader spatial development system.

50
Spatial Planning refers to planning that takes into account the location and connection of people and interventions in space. Spatial planning stimulates a more rational organization and use of urban space, and is important in promoting sustainable development and improving the quality of life. It enables the community to benefit from development, by guiding investments and encouraging prudent use of land and natural resources for development. Effective spatial planning results in:
stable and predictable conditions for investment that is sequenced for optimal impact; clarity for each government sphere and sector of the investment requirements to maximize the opportunities for transforming
people’s lives for the better; efficient development approval process to facilitate economic development and; spatial transformation to reverse undesirable settlement patterns emanating from past practices.
3.3 National Infrastructure Plan The National infrastructure Plan (NIP) seeks to promote:
re‐industrialization through manufacturing of inputs, components and machinery; skills development aimed at critical categories; greening the economy; and empowerment.
The NIP comprises 18 identified Strategic Integrated Projects (SIPs) which integrate more than 150 municipal infrastructure plans into a coherent package. Of specific importance to Limpopo (and Lephalale) are the following1:
SIP 1: Unlocking the northern mineral belt with Waterberg as the catalyst (with an emphasis on investment on heavy haul rail links to Richard’s Bay).
o Unlock mineral resources. o Rail, water pipelines, energy generation and transmission infrastructure. o Thousands of direct jobs across the areas unlocked.

51
o Urban development in Waterberg ‐ first major post‐apartheid new urban centre will be a “green” development project.
o Rail capacity to Mpumalanga and Richards Bay. o Shift from road to rail in Mpumalanga. o Logistics corridor to connect Mpumalanga and Gauteng.
SIP 6: Integrated Municipal Infrastructure Project: Programme to develop capacity to assist Vhembe, Sekhukhune, Capricorn and Mopani district municipalities to address all the infrastructure maintenance backlogs and upgrades required.
SIP 7: Integrated Urban Space and Public Transport Programme: Coordinate planning and implementation of public transport, human settlement, economic and social infrastructure and location decisions into sustainable urban settlements connected by densified transport corridors.
SIP 8: Green energy in support of the South African economy. SIP 9: Electricity generation to support socio‐economic development (including Medupi power station). SIP 11: Increased investment in Agri‐logistics and rural infrastructure. SIP 17: Regional Integration for African cooperation and development. SIP 18: Water and sanitation infrastructure.
3.4 Hierarchy of settlements. The development of nodal system is dependent on the movement of goods and services. In stimulated movement the gap or distance between supply and demand must be bridged. The overcoming of distance is so basic to development that spatial differentiation cannot develop without movement. The demand for commodity from a household living in a remote village and the commodity availability in a business area around town indicate the existence of supply and demand. However, it is of no value if the distance between supply and demand cannot be bridged. Movement is central to nodal development and the extent and ability to generate movement of people goods and services leads to the ability of geographic centers or nodes to specialize and develop. The Spatial Development Framework of the Limpopo province classifies the towns and villages in the First, Second and third order Settlements to accommodate development and investment.
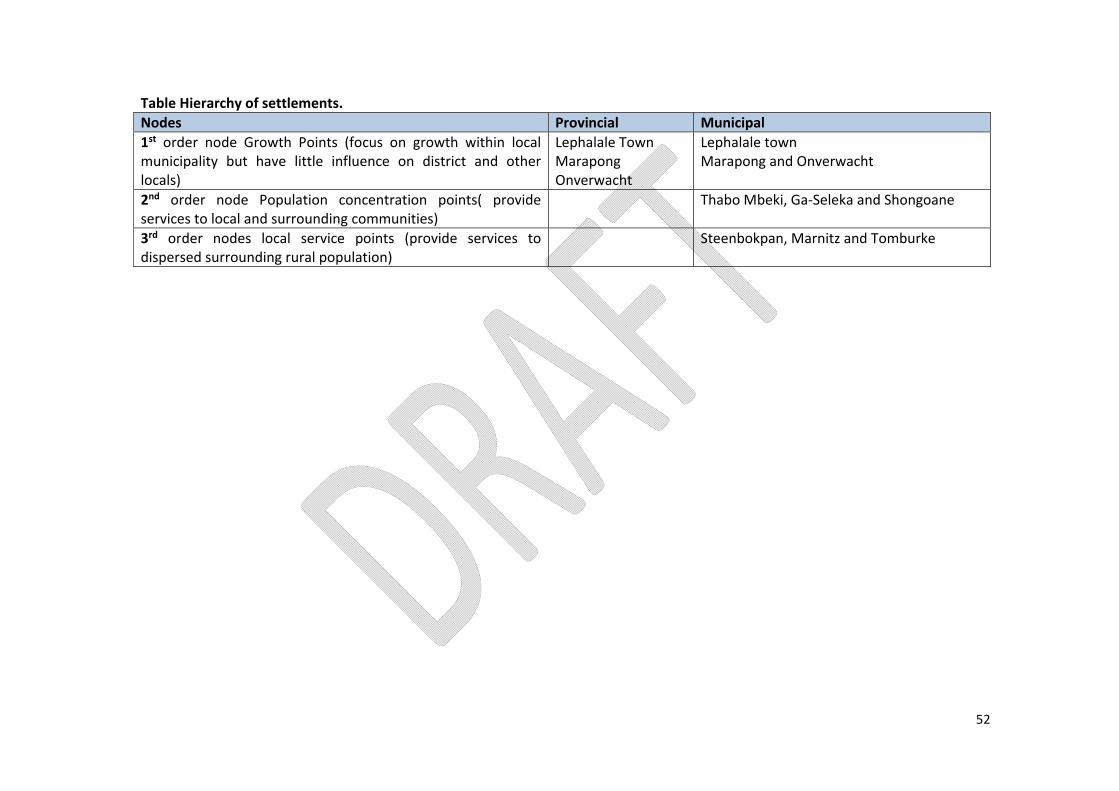
52
Table Hierarchy of settlements. Nodes Provincial Municipal 1st order node Growth Points (focus on growth within local municipality but have little influence on district and other locals)
Lephalale Town Marapong Onverwacht
Lephalale town Marapong and Onverwacht
2nd order node Population concentration points( provide services to local and surrounding communities)
Thabo Mbeki, Ga‐Seleka and Shongoane
3rd order nodes local service points (provide services to dispersed surrounding rural population)
Steenbokpan, Marnitz and Tomburke

53
54
3.5 Settlement Patterns. The settlements found are town, townships, villages, informal settlements and farms. Appraisal of the municipal area indicates a distinctive difference in the spatial pattern of development. Urban areas dominate rural areas. The Municipality is further characterized by a number of smaller villages in a leaner pattern on the eastern part without any economic activity. The land is mainly used for conservation, crop farming, game farming, mining, energy and small portion is used for settlement. Spatial Planning and Land Use Management Act (SPLUMA) No 16 of 2013. The Act provides a framework for spatial planning and land‐use management, specifies the relationship between the spatial planning and land use management system and other kinds of planning, provides for inclusive developmental, equitable and efficient spatial planning at deferent spheres of government, and promotes greater consistency and uniformity in the application procedures and decision‐making by authorities responsible for land‐use decisions and development applications.
3.6 Provincial Growth Point: Lephalale Town Lephalale town with Marapong, Onverwacht and Ellisras as its nodes is classified as a Provincial Growth point (PGP). In terms of the spatial rationale a PGP is the highest order in the hierarchy and therefore also the most important type of growth point. All the PGPs have a sizable economic sector providing jobs to many local residents. They have a regional and some a provincial service delivery function, and usually also a large number of social facilities (e.g. hospitals, tertiary educational institutions). All of them have institutional facilities such as government offices as well as local and/or district municipal offices. The majority of these provincial growth points also have a large number of people. Lephalale town has most of these elements and is a potential national ‘energy hub’. As a result it is a node of national importance. Noting the coal based development pressures and the disjointed nodes within the PGP, the SDF provides for Spatial Development Areas (SDA) and Potential Development Areas (PDA). This is meant to create a special interest in systematically integrating the nodes while also ensuring a framework to address national development imperatives. Spatial development area (SDA) defines areas which can be considered for development at different development junctures of the town. The SDF provides for three such areas and also introduce the notion of sequencing land release for development. Potential development area (PDA) denotes those areas that ordinarily would not be considered for development in the short‐term or prior to full development of the SDA’s, however, are being considered due to national development imperatives.
55
3.7 Approved proposals on the current development trajectory of the (SDA’s)
PDA1 ‐ Groblersbrug border post. The focus would be to serve the farming and agricultural activities in the immediate area as well as to serve as main border post for tourists between South Africa and Botswana.
PDA2 – Areas close to Ellisras/Onverwacht/Marapong Node associated with mining potential. It includes the farms Eendracht, Groothoek, Peerboom and Welgelegen. It represents the area between Marapong and Ellisras/Onverwacht townships.
Although previously identified for mining, the land is located strategically to be used for future residential development in order to ensure integration of the remotely removed Marapong. Its importance from a strategic and spatial planning point of view is very high because it is the only area which will in actuality ensure that Marapong and Ellisras towns are integrated properly in order to ensure that integrated human settlements are created in the future. The development of a mining area between Marapong and Ellisras will create a final “barrier” between these areas where no integration is possible. Note that there are competing land uses in terms of the Groothoek Coal Mining Company which intend to mine in the area.
PDA3 & 4 – Stockpoort border post & proposed border post/node along SL7. These PDA’s have the potential to establish closer links with Botswana and hence also serve the western parts of the study area with focus on the mining and energy generation industry.

56
SDA 1: Spatial Development Area 1. Urban edges and spatial development patterns (medium and long term).
The short and medium term growth management strategies see the vacant proclaimed residential stands being developed as a matter of priority. The municipality should consider NOT approving any new township establishment application until such a time as the majority of the vacant stands have been taken up. The exception to this would be any township establishment in the “Integration zone” (medium term) which promotes integration between Marapong and Onverwacht. In addition, what new township establishment applications are submitted should focus on the ‘old’ Ellisras area, where one enters the town from the Vaalwater Road. This section of town has been most affected by small township establishment applications in the past. The figure below spatially indicates the medium/long term development footprint.
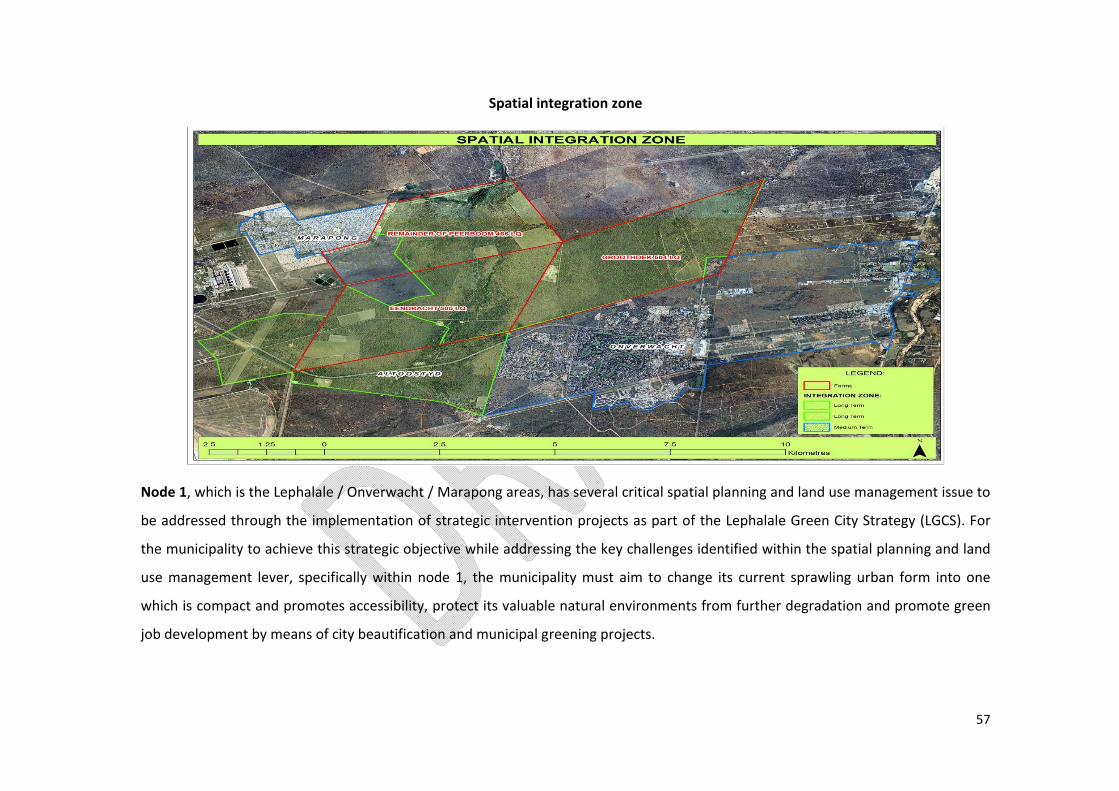
57
Spatial integration zone
Node 1, which is the Lephalale / Onverwacht / Marapong areas, has several critical spatial planning and land use management issue to
be addressed through the implementation of strategic intervention projects as part of the Lephalale Green City Strategy (LGCS). For
the municipality to achieve this strategic objective while addressing the key challenges identified within the spatial planning and land
use management lever, specifically within node 1, the municipality must aim to change its current sprawling urban form into one
which is compact and promotes accessibility, protect its valuable natural environments from further degradation and promote green
job development by means of city beautification and municipal greening projects.

58
Spatial structure, land use composition and urban design analysis
The Lephalale CBD and the Onverwacht Node are consolidated around route D1675/ Nelson Mandela Drive that traverses the town from west to east. The other two nodes are located along the main route that traverses Marapong township – route D2816. As a whole, the activity nodes in the area have a linear structure. Lephalale CBD is predominantly located to the north of route D1675 and along the western side of route R510. The Moloko River has prohibited the CBD from developing along the eastern side of route R510. The Onverwacht Node is located approximately 3km to the west of the CBD, while the access road to Marapong Township is found about 13km further westward. The township is situated about 3km to the east of the road, separated from route D2001 by the Matimba power station. The result of this spatial structure is that Marapong Township is situated about 17km from the Onverwacht Node (by road) and more than 21km from the CBD. The Onverwacht Node also has a linear form. It comprises of a cluster of business activities to the south of route D1675, as well as the town’s light industrial area that lies approximately 600m to the north of the road. To the west of Onverwacht lies the Altoostyd area. Though it is still vacant, its layout makes provision for an activity node. The first node in Marapong Township comprises an existing cluster of non‐residential uses near the town entrance. The second activity node is located in the central parts of the township and comprises a vacant land pocket that was earmarked as the township’s future CBD by the Lephalale SDF. The Urban Design Analysis is based on six typical urban renewal interventions/ ‘aspects’ that have been derived from an extensive literature review of urban design best practice. The six urban design aspects that ‘make a good city’ are namely: Mix and Diversity Land Uses
Promote Compactness; Densification and Inject Housing into Activity Nodes
Promote Accessibility; Invest in the Public Realm and Create a Quality Public Environment

59
Lephalale municipality
SDA 2: Spatial Development Framework for Rural Areas Spatial Development Area 2 this designated area consist of developable land removed from the existing development. Thus, if developed prior designated SDA 1 will only promote the current disjointedness of the town and contribute to urban sprawl. A formal Council resolution will be required to open the area up for development. At least 80% of SDA 1 should be fully developed prior to considering development applications in SD.

60
SDA 3: Spatial Development Area 3. Spatial Development Area 3 has assumed a character of mixed non‐residential land‐use driven by mining and energy. This form part of industrial and mining development zone, development should be encouraged in this area. Developments related to such land‐uses might be considered without linking approvals to the state of development in SDA 1 and 2. It includes Zwartwater 507‐ LQ, Hangklip 508 –LQ and Grootestryd 465‐LQ.
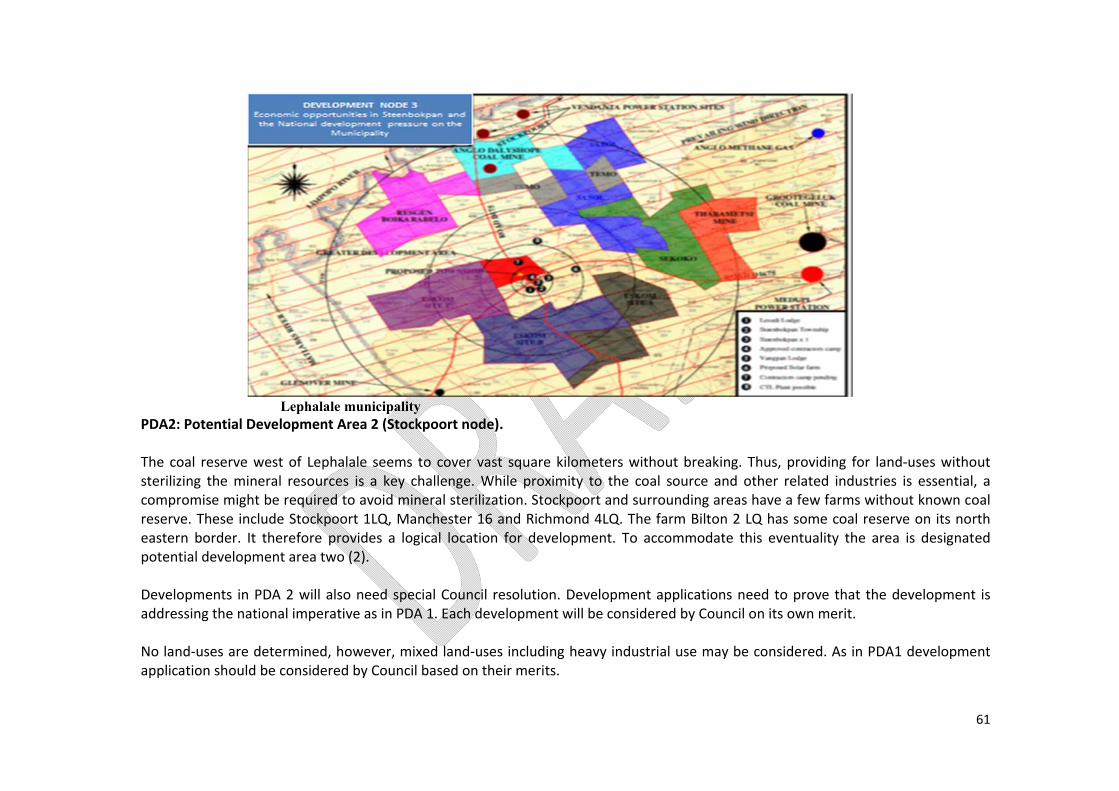
61
Lephalale municipality
PDA2: Potential Development Area 2 (Stockpoort node). The coal reserve west of Lephalale seems to cover vast square kilometers without breaking. Thus, providing for land‐uses without sterilizing the mineral resources is a key challenge. While proximity to the coal source and other related industries is essential, a compromise might be required to avoid mineral sterilization. Stockpoort and surrounding areas have a few farms without known coal reserve. These include Stockpoort 1LQ, Manchester 16 and Richmond 4LQ. The farm Bilton 2 LQ has some coal reserve on its north eastern border. It therefore provides a logical location for development. To accommodate this eventuality the area is designated potential development area two (2). Developments in PDA 2 will also need special Council resolution. Development applications need to prove that the development is addressing the national imperative as in PDA 1. Each development will be considered by Council on its own merit. No land‐uses are determined, however, mixed land‐uses including heavy industrial use may be considered. As in PDA1 development application should be considered by Council based on their merits.

62
3.8 Land availability Within the urban edge the Municipality does not own land with only 9.21% belonging to government, Eskom 13.63%, Exxaro 20.76% and the majority which represents 56.38% currently belongs to private individuals. The vacant planned land parcels exist within the identified development edge and this makes it favourable for infill development approach in order to optimise the use of infrastructure, increase urban densities; promote integration and compacted settlements.
3.9 Nature reserves and conservancy. D’Nyala Nature reserve. The roughly 8 281 ha Reserve is located in the northern Waterberg range nearby the town of Lephalale. Government acquired the Reserve in 1986 to allow for the construction of the Vaalwater Lephalale road (R33). Lephalale is the last end route to Botswana from South Africa along the (shorter) alternative route leading to four border control posts. The R33 provincial road Vaalwater and Lephalale traverses the reserve, dividing it into a western and eastern portion. The reserve’s bushveld plains and broad floodplain areas afford excellent game viewing opportunities, and large specimens of trees including massive baobabs and nyalas add to the scenic value and recreation/tourism resource. Apart from various management tracks, a 37km gravelled game drive route has been developed on the eastern portion of the reserve (east of R33 provincial road), along with two game viewing hides on the floodplain. Mokolo Nature Reserve. The Mokolo Dam situated 50km from Lephalale on the Thabazimbi road (R510) offers excellent boating and fishing opportunities, but visitors are warned that hippos and crocodiles occur in the dam. The Mokolo Dam lies in a picturesque setting within the Provincial Mokolo Dam Nature Reserve and is a popular recreational resort for anglers and the boating fraternity. The Dam has a full supply capacity of 145.4 million cubic metres and currently provides the only formal water storage facility in the Mokolo Catchment. The Dam is characterised by dense wooded mountains and surrounding cliffs. The mountains mainly comprise sandstone. The reserve covers an area of 4 600 hectares which includes the dam surface area of 914 hectares and plays an important role in providing outdoor or recreation, including both land and water orientated activities. The dam supplies water to the town of Lephalale, Matimba power station, Exxaro Colliery and downstream irrigation farmers.

63
LIMPOPO RIVER Limpopo River flow through Botswana, Zimbabwe, South Africa and Mozambique where it empties into the Indian Ocean. It also acts as a boarder which separates South Africa from Zimbabwe on the North for 240 km and South Africa from Botswana on the Northeast for 400 km. Limpopo River gets most of its water from the Olifants River. The water from Limpopo River is used to supply the nearby farms with water. The water in the river flows very slowly.
Future plans around the river can be developed looking at the opportunities to provide water to the Lephalale community. Research and proper engagements are very key in making sure that the opportunities around the river and the farms near it are well outlined and proper research be made.
3.10 Land uses. The geographical size of the Municipal area of jurisdiction is 1,378,429.178 hectares. The major land uses describes a development footprint closely aligned with physical and historical factors. Rural development in its broader sense is compatible and consistent with most land use activities. Mining activities are affected mainly by existing urban development and environmental activities. Existing settlements and mining activities affects ranching activities, while in the case of conservation, subsistence farming is added to the equation. The Municipality has large tracks of cultivated commercial dry land which covers an area of 39,624.387 hectares. Cultivated commercial irrigated land which covers 8,488.227 hectare’s is located along the three rivers namely Mokolo, Phalala and Limpopo River. The rural villages are mainly characterised by cultivated subsistence dry land of about 17,244.714 hectares which is located 65km away in the eastern part, of Lephalale town.
64
The larger portion of the municipal area which covers 1,303,004.24 hectares is characterised by degraded forest, woodland, bush clumps and thicket. The provincial growth point which includes Ellisras town, Onverwacht, Marapong and Light industrial, area covers an area of 9, 91692 hectares. The mining area and quarries covers a geographical space of 3609.286 hectares although there is no clear indication about the precise location of the wetlands the area is estimated at about 828.712 hectares. The three main drainage rivers are Lephalala, Mokolo and Matlabas. These rivers together with numerous lesser rivers and streams constitute a major water catchment area for the lower Limpopo basin. The water bodies as these areas are referred to covers approximately 1,532.23 hectares.
3.10 Land Tenure. A land reform issue within the municipal area encompasses a complex array of challenges located within the sphere of land access, land tenure, land restitution and land administration. Numeral land claims have been lodged with the land restitution commission. Approximately 197 831ha representing 14.1% of the total municipal area is subjected to land claims. There is still a skewed distribution of land among the residents of the municipality, especially on racial basis. At this stage the potential impact of these claims on land use planning and management is unknown. Private ownership is the most prevalent form of land tenure found in Lephalale Municipality. This applies to Lephalale town, to almost all the local service points and to all farms. Communal land ownership applies to all the population concentration points and to all the 38 scattered villages. The total surface area concerned comprises almost 10% of the municipal surface area. Ownership of communal land is technically vested in the national government, but the land is used by local residents. A third form of land tenure applies in Marapong Township. This is referred to as a deed of grant in terms of a proclamation that has become obsolete after the first democratic election of 1994. A deed of grant is less than full ownership. Since 1994, some of the deeds of grant have been converted to full ownership in terms of the Extended Benefit Scheme. Large tracts of land in Marapong are owned by the Limpopo Department of Local Government and Housing. The IDP points out the urgent need for ownership of this land to be transferred to the local Municipality.
3.12 Land Uses and Land Claims. Almost 200 land claims, representing 14.1% of the municipal area, were lodged in 2001. The table below also indicates that only 28 land claims in Lephalale has been gazetted. Only 52 of these claims were accepted. The IDP indicates that 28 of these accepted claims have been settled and the rest are in different stages of investigation and negotiation. Apart from the land claims (restitution), the IDP indicates that there are 344 land redistribution projects in Lephalale Municipality comprising a total area of 62,590 hectares. It is further apparent that the majority of land claims (105) in total are under investigation.
65
The different land uses comprise businesses, offices, industrial parks, residential and institutional. There is still a skewed distribution of land among the residents of the Municipality, especially on racial basis. This unequal distribution of land is a national phenomenon. As a result, the democratic South African government showed it’s committed towards addressing this problem through introducing land reform programmes, which took the form of redistribution, restitution and tenure. The restitution programme triggered a huge response from black communities, as they were heavily affected by the apartheid dispossessions. There were 197 claims that some affected residents of Lephalale Municipality lodged in 2001. A total of 197 831ha represented the area under claim. At this stage the potential impact of these claims on land use planning and management and socio‐economic development is unknown.
Physical Determinants of Development. The assessment approach for developing the SDF is based on an overlay technique whereby a range of features are assessed through the application of geographic information analysis with the aid of GIS. Information from National Environmental Potential Atlas (ENPAT) was utilized as the base information describing the physical
attributes of the municipal area. As described above six functional zones (Urban, Rural, Mining, Agricultural, Cattle and Ranching and Conservation) were
identified as the basis for the assessment. Each theme was mapped per functional zone and regarded as equally important. 3.13 Green Economy Strategy A green Municipality incorporates elements such as water sensitive planning and management, energy efficiency in buildings and transportations and sustainable waste management as part of its mandate. Indeed, municipal greening forms part of the actions in becoming a Green Municipalities but there is much more to it. Whereas a “Green Municipality” is a municipality which manages and finances all functions as required by the Municipal Systems Act 2000 in an environmentally sustainable manner while achieving social upliftment and economic growth. The municipality adopted a green city plan in 2017 with short, medium and long term objectives.
The Laphalale Green City Strategy LGCS has been included as part of the 2019‐20 IDP, a standalone document until the revision of the IDP. Ideally, the LGCS should feed into each sector of the IDP as well as sector plans. The draft 2016/2017 Lephalale IDP (pg. 119) initiated several green economy goals which should be achieved within a short, medium and long‐term period.
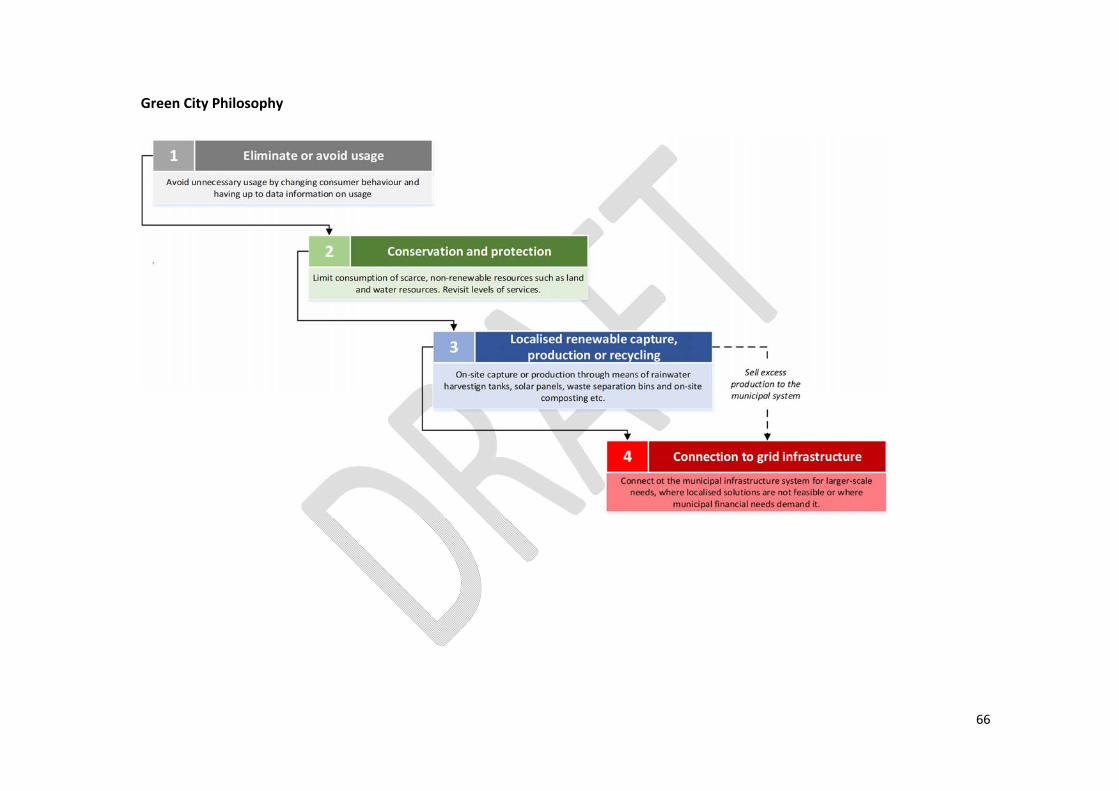
66
Green City Philosophy

67
3. 14 Green economy goals
Time frame Green economy goals Short term goals includes: Generating Green Jobs and improving the environmental quality of the municipality.
Medium term goals includes: Create Enabling Conditions for Green Growth and Change Behavioural and Production Patterns.
Long‐term goals include Building a New Economic/Environmental Paradigm for Lephalale
Green Economy Goals and Interventions
Strategic interventions Green Technology Yes/No
Job ImpactHigh/Low
Business Feasibility Yes/No
Funding Source
Protect the environment Regulate and promote efficient building design and construction
Establish a Green building strategy such as building houses with thermally efficient designs.
Identify various forms of sustainable green building material such as Green Crete.
Yes
Yes
Low
Low
Yes
Yes
GREEN FUND
Energy Identify alternative/renewable sources of energy, e.g. proposed solar plant by LEDET as a source of energy for Node 2.
Identify various types of waste that can be used in energy generation e.g. wastewater to biogas energy, municipal landfill waste methane gas to energy etc.
Identify various forms of affordable renewable energy e.g. Solar geyser, Heat pumps to be installed in households
Yes
Yes
Yes
High
Low
Low
Yes
Yes
Yes
LEDET
AFRICAN DEV BANK
IDC GREEN ENERGY FUND
Investigate benefits of smart‐meters over pre‐paid meters
Embark on process of installing meters (currently budgeted for in the IDP)
No High Yes LLM
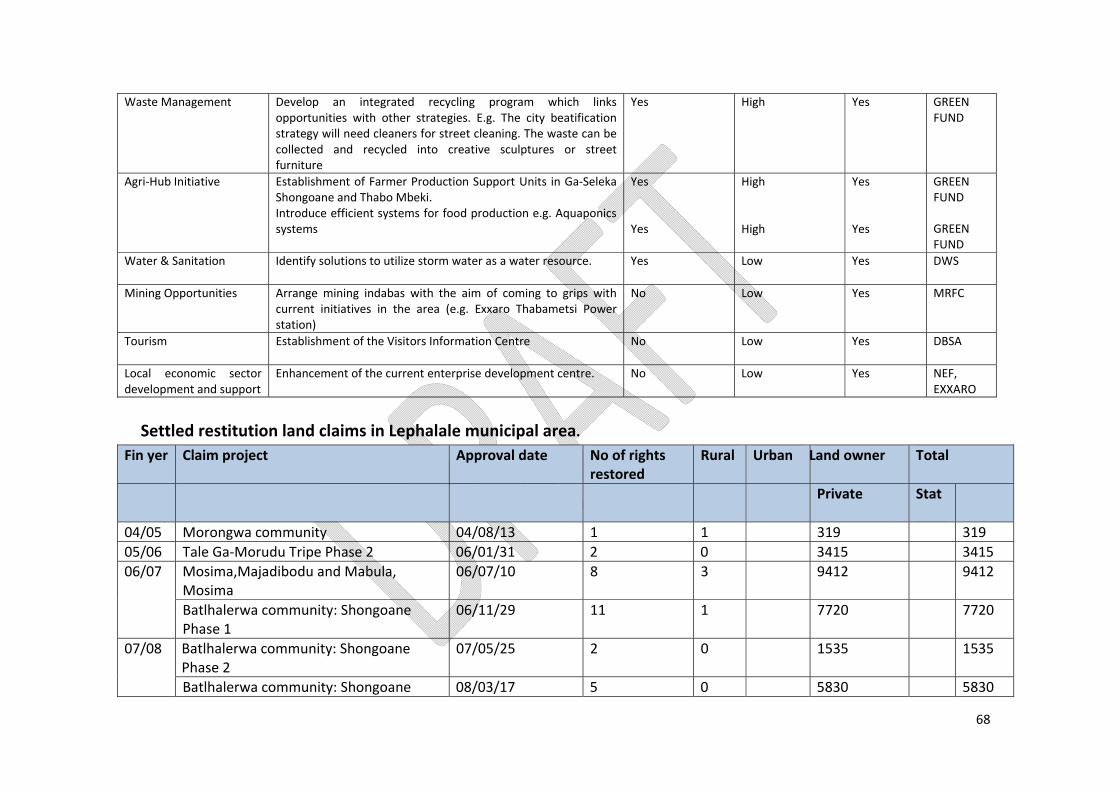
68
Waste Management
Develop an integrated recycling program which links opportunities with other strategies. E.g. The city beatification strategy will need cleaners for street cleaning. The waste can be collected and recycled into creative sculptures or street furniture
Yes High Yes GREEN FUND
Agri‐Hub Initiative Establishment of Farmer Production Support Units in Ga‐Seleka Shongoane and Thabo Mbeki. Introduce efficient systems for food production e.g. Aquaponics systems
Yes Yes
High High
Yes Yes
GREEN FUND
GREEN FUND
Water & Sanitation Identify solutions to utilize storm water as a water resource. Yes Low Yes DWS
Mining Opportunities
Arrange mining indabas with the aim of coming to grips with current initiatives in the area (e.g. Exxaro Thabametsi Power station)
No Low Yes MRFC
Tourism Establishment of the Visitors Information Centre No Low Yes DBSA
Local economic sector development and support
Enhancement of the current enterprise development centre. No Low Yes NEF, EXXARO
Settled restitution land claims in Lephalale municipal area. Fin yer Claim project Approval date No of rights
restored Rural Urban Land owner Total
Private Stat
04/05 Morongwa community 04/08/13 1 1 319 319 05/06 Tale Ga‐Morudu Tripe Phase 2 06/01/31 2 0 3415 3415 06/07 Mosima,Majadibodu and Mabula,
Mosima 06/07/10 8 3 9412 9412
Batlhalerwa community: Shongoane Phase 1
06/11/29 11 1 7720 7720
07/08 Batlhalerwa community: Shongoane Phase 2
07/05/25 2 0 1535 1535
Batlhalerwa community: Shongoane 08/03/17 5 0 5830 5830

69
Phase 3 309 23 31190 31190 08/09 Majadibodu community: Phase 2 08/04/11 3 0 1713 1713
Mabula – Mosima Community; Phase 3 08/04/16 2 0 959 959 Mabula‐ Mosima 09/01/27 1 0 859 857
Source: Land claim commission, 2014
Outstanding Land claims in Lephalale Municipal area. KRP NUMBERS PROPERTY DESCRIBTION CLAIMANT STATUS 2.KRP 6280 New Belgium 608 LR Mr. L.E Seemise Further Investigation 3.KRP 1799 Manamane 201 KQ & others Lucas Mfisa 073 0925 482
Samuel Mfisa 082 830 900 Further Investigation
4.KRP 1617 De Draai 374 LR & Salem 671 LR Mr. Bellingani D.P Further Investigation 5.KRP 2432 Essex 71 LR & Other Mr. Mocheko K.A Further Investigation 6 KRP 519 Rooikop 277 LR Mr. Kok JF Further Investigation 7.KRP 515 Steenbokskloof 331 LR & Other Farms Mr. Kluyts HPJ Further Investigation 8.KRP11316 Zeekoeigat 42 LQ& Other Farms Mr. Lebodi MJ Further Investigation 9.KRP 1564 Melkbosch125 LR & Others Kgoshi ZT Seleka Under Investigations 10.KRP11283 New Belgium 608 LR Mr. Gouws JF Under Investigations 11.KRP 1588 Spektakel 526 L.R Monyeki N.I12. KRP 2479 Bellevue 74 LQ Maluleka F.F Further Investigation 13.KRP 1614 Nora 471 LR Shongoane M.A Further Investigation 14. KRP 12327 Waterval(unclear) Tlhabadira RM Further Investigation 15. KRP 2432 Essex 71 LR & others Seleka Tribe Further Investigation 16. KRP 6630 Rooipoort 660 LQ Nkwana FA Further Investigation 17. KRP 2480 Bellevue 74 KQ Molele PV Further Investigation 18. KRP 7297 Unclear Tayob AB Further Investigation 19.KRP 11913 Serville 587 LG Schabart CP Further Investigation 20. KRP 12319 Unclear Shadi Lebipi Further Investigation Source: Land claim commission, 2014

70
Outstanding land claims
Source: Municipal scoping report
Informal Settlements The Municipality, acting within the frameworks of the Prevention of all illegal eviction from and unlawful Occupation of Land Act, 1998 (Act 19 of 1998) and its Municipal Planning Strategy, and aware of its duty to provide a safe and healthy environment to all its residents, adopted the informal settlement by‐law with the aim of controlling and assisting in the control of authorized and

71
unauthorized informal settlements within its area of jurisdiction. There are three informal settlements with a total household of 8 670 in the urban area.
With established towns and townships within the municipal area, there are sprawling informal settlements that are found adjacent to the nodes, especially where there are mining activities. The existence of the informal settlements within the municipal area extends the service delivery backlogs in municipality. The table below depicts house hold patterns in various informal settlements
Lephalale municipality

72
Spatial challenges
Lack of Municipal land for development in urban areas. Illegal land use activities on agricultural land. Poor planning in rural areas due to lack of implementation of land use management scheme/system. Illegal occupation of land/ land invasion. Dysfunctional spatial patterns Back yard dwellers in marapong Fragmented nature of current urban development found in Lephalale between Marapong, Onverwacht and town. Lack of a marketing policy to realise the developmental vision Enforcement of LDSF for rural areas Non‐integrated GIS Backyard dwellers
CHAPTER 4
4 SOCIAL AND ECONOMIC ANALYSIS.
4.1 Environmental Legislative framework.
There are a number of regulation, policies, acts and treaties that are meant at the protection, preservation and conservation of our natural resources. a. The Constitution. Section 24 of the Constitution of South Africa Act 108 of 1996 provides that everyone has the right to an environment that is not harmful to their health or well‐being and to have the environment protected, for the benefit of present and future generations, through reasonable legislative and other measures that:
Prevent pollution and ecological degradation; Promote conservation; and

73
Secure ecologically sustainable development and use of natural resources while promoting justifiable economic and social development
b. The National Environmental Management Act. The National Environmental Management Act, No. 107 of 1998 (NEMA) came into operation on the 1st January 1999. It is the flagship environmental statute of South Africa. NEMA’s primary purpose is to provide for co‐operative environmental governance by establishing principles for decision‐making on all matters affecting the environment. NEMA also establishes procedures and institutions that will promote public participation in environmental management. Chapter 1 of NEMA stipulates Environmental Management must place people and their needs at the forefront of its concern, and serve the physical, psychological, developmental, cultural and social interest equitably. It also advocates that development must be socially, environmentally and economically sustainable. The principles enshrined in NEMA guide the interpretation, administration and implementation of the environment in South Africa. These principles serve as a framework within which environmental management must take place. They include amongst others, sustainable development and the ‘polluters pay’ principle. c. Sustainable Development Sustainable development is required to ensure the integration of social economic and environmental factors in decision‐making so that development serves present and future generations. Furthermore sustainable development requires that a risk‐averse and cautious approach be applied to decision‐making. d. Polluter Pays Principle. The ‘polluter pays’ principle provides that the cost of remedying pollution, environmental degradation and consequent adverse health effects and of preventing, controlling or minimizing further pollution, environmental damage or adverse health effects must be paid for by those responsible for harming the environment’. NEMA imposes a duty of care on every person who causes, has caused or may cause significant pollution or degradation of the environment to take reasonable measures to prevent the pollution or degradation of the environment from occurring, continuing or reoccurring.

74
e. The National Water Act. The National Water Act, No. 36 of 1998 (‘the National Water Act’) recognizes that water is a natural resource that belongs to all people. The National Water Act regulates the manner in which persons obtain the right to use water and provides for just and equitable utilization of water resources. Sustainability and equity are identified as central guiding principles in the protection, use and these guiding principles recognize: The basic human needs of present and future generations; The need to protect water resources; The need to share some water resources with other countries; and The need to promote social and economic development through the use of water. f. National Environmental Management: Waste Act. The National Environmental Management: Waste Act, No. 59 of 2008 (‘Waste Act’) was enacted to reform the law regulating waste management and to govern waste management activities. The Waste Act has repealed and replaced those sections of the Environmental Conservation Act that dealt with the prevention of littering and waste management. The Act creates a general duty in respect of waste management obliging holders of waste to minimise waste, recycle and dispose of waste in an environmentally sound manner. Holders must also prevent any employees from contravening the Waste Act. Section 18 introduces ‘extended producer responsibility’. The Minister may identify a product, in terms of which extended responsibility applies, identify measures that must be taken and by whom. The Minister may specify how to implement such extended responsibility and any financial arrangements that must be made. g. National Environmental Management: Biodiversity Act. The National Environmental Management: Biodiversity Act, No 10 of 2004 provides for the management and conservation of South Africa’s biodiversity, the protection of threatened and protected species and ecosystems, the sustainable use of indigenous biological resources and the equitable sharing of benefits arising out of bio‐prospecting of those resources. h. National Environmental Management: Air Quality Act. The Air Quality Act regulates air quality in order to protect the environment. It provides reasonable measures for the prevention of pollution and ecological degradation and for securing ecologically sustainable development while promoting
75
justifiable economic and social development. The Act further provides for national norms and standards regulating air quality monitoring, management and control by all spheres of government. It also provides for specific air quality measures.
Lephalale Municipality has an environmental function to execute and ensure that the fundamental environmental rights of the community as enshrined in the constitution are realized. The fundamental rights as stated in the constitution are:‐ To prevent pollution and ecological degradation. To promote conservation. To secure ecologically sustainable development and use of the natural resources while promoting justifiable economic and social
development. The Municipality has sensitive and conservation worthy areas within its jurisdiction, such as the wetlands, river systems, cultural sites, rare and endangered species and part of the Waterberg biosphere. There are also many areas that require remedial attention. i.e. the eradication of alien vegetation, soil erosion control and aspects that require special management, such as pollution control and land use management. The Municipality has the capacity to perform duties that enhance sound environmental management practices which include EIA related issues.
4.2 Air quality. Air quality legislation comprises primary standards which protect human health and secondary standards which protect property, vegetation, climate and aesthetic values.
Particulate and gaseous emissions from industrial operations, domestic fuel burning and vehicle tailpipe emissions were quantified for this assessment, due to the availability of data for these sources. Power generation was identified to be the main contributing source to emissions (99%) in the Local Municipality. With the quantification of all mines in the District, mining sources are likely to be the main contributor to PM10 emissions in the District. Power generation is the main contributing source to SO2 and NO2 emissions in the Lephalale LM, contributing to 99%.
The environmental features that are found in the municipal area are affected by natural environmental challenges inter alia, ozone depletion, global warming, solid and hazardous wastes, the endangerment of biological diversity and land degradation. Environmental degradation in the form of soil erosion, overgrazing, deforestation, over exploitation and habitat destruction should be prevented to effect economic development negatively. Air quality management by‐laws should be developed for non‐compliance to the air quality standards. There should be capacity in terms of human resources for the execution of related duties.
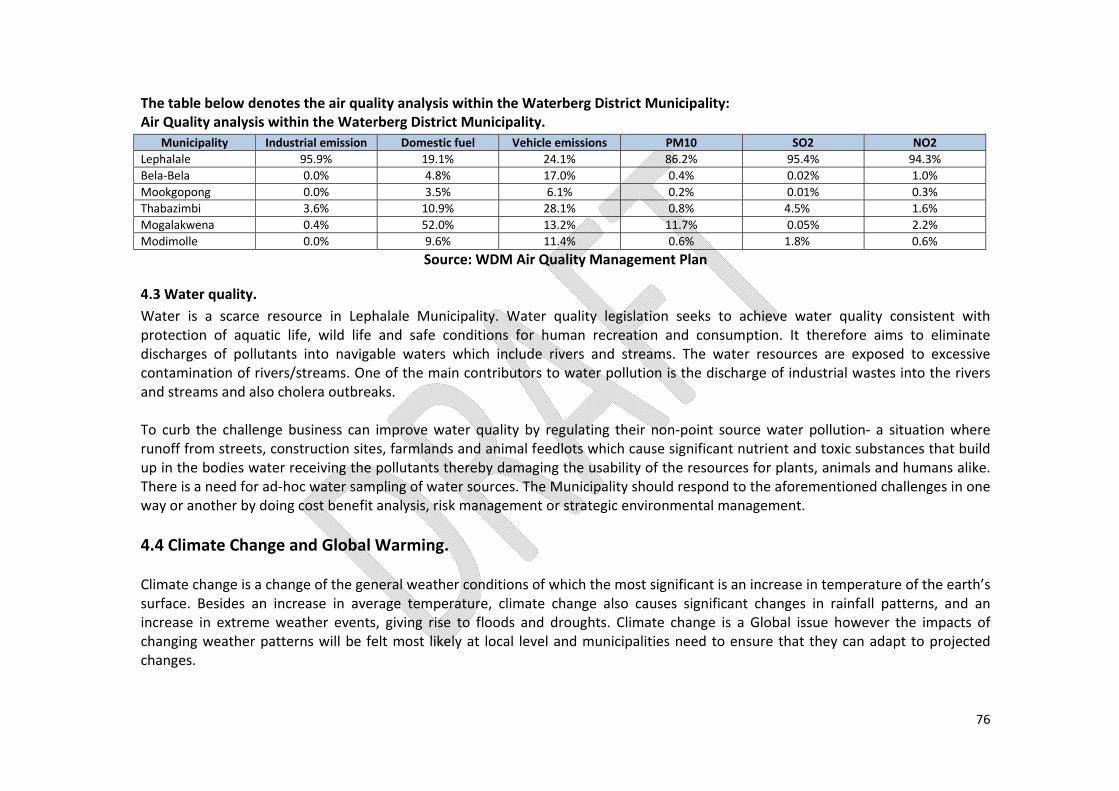
76
The table below denotes the air quality analysis within the Waterberg District Municipality: Air Quality analysis within the Waterberg District Municipality.
Municipality Industrial emission Domestic fuel Vehicle emissions PM10 SO2 NO2Lephalale 95.9% 19.1% 24.1% 86.2% 95.4% 94.3%Bela‐Bela 0.0% 4.8% 17.0% 0.4% 0.02% 1.0%Mookgopong 0.0% 3.5% 6.1% 0.2% 0.01% 0.3%Thabazimbi 3.6% 10.9% 28.1% 0.8% 4.5% 1.6%Mogalakwena 0.4% 52.0% 13.2% 11.7% 0.05% 2.2%Modimolle 0.0% 9.6% 11.4% 0.6% 1.8% 0.6%
Source: WDM Air Quality Management Plan
4.3 Water quality. Water is a scarce resource in Lephalale Municipality. Water quality legislation seeks to achieve water quality consistent with protection of aquatic life, wild life and safe conditions for human recreation and consumption. It therefore aims to eliminate discharges of pollutants into navigable waters which include rivers and streams. The water resources are exposed to excessive contamination of rivers/streams. One of the main contributors to water pollution is the discharge of industrial wastes into the rivers and streams and also cholera outbreaks. To curb the challenge business can improve water quality by regulating their non‐point source water pollution‐ a situation where runoff from streets, construction sites, farmlands and animal feedlots which cause significant nutrient and toxic substances that build up in the bodies water receiving the pollutants thereby damaging the usability of the resources for plants, animals and humans alike. There is a need for ad‐hoc water sampling of water sources. The Municipality should respond to the aforementioned challenges in one way or another by doing cost benefit analysis, risk management or strategic environmental management. 4.4 Climate Change and Global Warming. Climate change is a change of the general weather conditions of which the most significant is an increase in temperature of the earth’s surface. Besides an increase in average temperature, climate change also causes significant changes in rainfall patterns, and an increase in extreme weather events, giving rise to floods and droughts. Climate change is a Global issue however the impacts of changing weather patterns will be felt most likely at local level and municipalities need to ensure that they can adapt to projected changes.
77
Lephalale Local Municipality comprises 1 378 000 ha, and consists of varied topography (steeper in the Waterberg on the south‐east), generally flattening out towards the north, with altitude above sea level between 800 m and 1 200 m. Parent material comprises quartzite sandstone, shale and gneisses amongst others. The climate area varies, becoming both warmer and drier from south to north. The long‐term average annual rainfall is around 400‐600 mm, while average daily temperatures vary between 17°C and 32°C in summer and between 4°C and 20°C in winter. South Africa’s surface air temperature has warmed significantly over much of the country since 1950s. Temperature is expected to increase by another 1.8ºC to 4º by the year 2100 should the necessary action not be taken. The socio‐economic factors that increase South Africa’s vulnerability to climate change are mainly influenced by the following: Large proportion of South Africa’s population has low resilience to extreme events (poverty, high disease burden, inadequate
housing infrastructure and location; Climate change generated events exacerbate existing socio‐economic challenges, inequalities and vulnerability; Much of South Africa has low and variable rainfall; A significant proportion of surface water resources are already fully allocated and; Agriculture and fisheries are essential for food security and livelihoods. In the light of global environmental change, can we confidently claim to manage the environment as we always did in the past? The challenge for municipalities is not to predict the future, but to approach the future with the right tools and the right information. Rising CO2 emission has a detrimental effect on socio economic situation within global communities, with the developing and poor countries being the hardest hit. Some of the visible impacts are severe drought and water scarcity, forest degradation and overgrazing. Critical actions to reduce climate change and greenhouse gas emissions can best be undertaken locally and municipality as a sphere of government have an obligation to manage resources as efficiently as possible in the interest of the citizens. Failure to do so may have far reaching implications. South Africa’s vulnerability to climate change has direct influence on the following:‐ Increased water stress – significant decrease in water availability in many areas. Agricultural production and food security – failing crop yield in many areas Impact of climate change on human health – large proportion of South African population has low resilience to extreme climate
events (poverty, high disease burden, inadequate housing infrastructure and location).

78
Climate change impact will intensify the forces, which for decades have constrained or obstructed progress towards sustainable developments in many parts of our country. It has the potential and can strongly be linked to negative impact on sustainable development. These can effectively lead to the following impact on sustainable development:‐ Curb economic growth and development; Undermine efforts to combat poverty; Hamper efforts to attain Millennium Development Goals and; Threatens to erode the entire community in a specific area Climate change and variability already have a direct impact on the ability of municipalities to meet their constitutional obligations and objectives. Integration of climate change response into a municipal IDP is not a new planning or reporting requirement. It simply offers a means of identifying and prioritising actions to meet new challenges and adjusting existing planning and projects to changing weather conditions and economic constrains around fossil fuels. Lephalale has been declared a hot spot by the national minister and this observation has far reaching implications for the municipality in terms of greenhouse gas emission which does not portray a good picture. The Municipality should compile baseline information on climate change events possibly dating back approximately thirty years ago. These data will provide information and assist with regard to future planning tools to combat escalation of the situation. Road transport is responsible for 24.1% of total transport emission in the Waterberg district Municipality while industrial emission amount to 95.9% and this put Lephalale as the biggest polluter in the district as indicated in table above pp64. The increased number of vehicular mode of transport in Lephalale as a result of ensuing development has not only impacted on our roads infrastructure but also increased greenhouse gas emission immensely. Mobility provides access to goods, employment, commercial and social services, access to friends, relatives, communities and leisure. It also provides access to raw material, employees, suppliers, customers and consumers. Lephalale requires more transport relative to its development trajectory than any other Municipality in Waterberg District. This is because the economy is spatially ‘challenged’ besides being on the countryside. The sparsely distributed rural settlements which are not functionally linked and the fragmented nature of current urban development found in Lephalale between Marapong, Onverwacht and town will always enhance the need for transport. Our road infrastructure particularly in the rural areas is not properly maintained or in good condition for mobility of goods and services.

79
Cities throughout South Africa face mobility challenge of increasing traffic, chronic congestion, air and noise pollution and increased traffic accidents against a background of climate change and the need to reduce our carbon consumption. The challenge for these cities is to alter the balance of priorities from motorised vehicles to more sustainable and active modes. The traditional approach to dealing with increased transport demand has been to provide additional road space by means of new expansive road infrastructure. This approach has not delivered the expected benefits, however, and new approach to tackling current transport problems is required. Inspired by the principles of sustainability, an alternative and low‐carbon approach focuses on the demand side. One new approach, known as A‐S‐I (from Avoid/Reduce, Shift/Maintain, Improve) seeks to achieve significant greenhouse gas emission reduction, reduced energy consumption and less congestion, with the final objective to create more liveable cities. The Municipality in an endeavour to provide sustainable transport should also be seen as an ultimate goal to which we need to move ‘greening’ transport along the way, but simultaneously our lack of reliable public transport can allow us to ‘leapfrog’ to new and better technologies and systems. Elements of low carbon transport system include: Dense but green and mixed land use cities that allow jobs, shopping and leisure facilities close to where people live; Modern high‐quality alternatives to individual car use, especially efficient public transport and good non‐motorised transport
infrastructure and its proper integration. The Municipality should strive for provision of a means for citizens to access social and economic opportunities in a manner that is cognizant of limited resources, including energy, finance and space.
4.5 Agriculture.
Soil and Agricultural Potential. Lephalale Local Municipality comprises 1 378 000 ha, and consists of varied topography (steeper in the Waterberg on the south‐east), generally flattening out towards the north, with altitude above sea level between 800 m and 1 200 m. Parent material comprises quartzite sandstone, shale and gneisses amongst others. The climate area varies, becoming both warmer and drier from south to

80
north. The long‐term average annual rainfall is around 400‐600 mm, while average daily temperatures vary between 17°C and 32°C in summer and between 4°C and 20°C in winter. As far as existing soil information is concerned, the only source of soil information for the area is land type maps at a scale of 1:250 000. There is a great difference between land types in terms of both the soils occurring as well as the associated agricultural potential. There is also a significant difference in the dominance of the agricultural potential classes within each land type. More than 60% of Lephalale Local Municipality area has moderate or better soil potential, but climate (especially rainfall) is the greatest limiting factor, so that irrigation is the preferred method of cultivation to obtain long‐term results. The municipal area is not one where significant zones of water‐erodible soils occur, but wind erosion could be a serious problem if topsoil becomes exposed. The grazing capacity for Lephalale local Municipality (not for game farming) is around 8‐12 ha/Isu. The agricultural potential of the area is intimately associated with topographical, pedological (soil) and climate determinants. As a general trend the potential for dry land cropping decreases with the rainfall distribution from south to north and west to east. Soil factors do play a role in that shallow, sandy and very high clay content which also lead to a slight reduction in potential due to decreased water storage/ plant water supply capacity. Threats to this aspect of the land include erratic rainfall and high input costs. This is evident in the number of fields that have been cleared of bush but that are only covered in grass or encroaching bush at the moment. A component of the high input cost is land value that is skewed at present through aspects such as land restitution, increased urban and mining development and foreign land ownership. The bottom line is that with the increased costs (costs of inputs, cost of land etc.) and environmental risks (erratic rainfall, soil degradation, bush encroachment) economically viable crop production options are diminishing rapidity.
4.6 Waste management. The Municipality developed a draft waste management plan as required by NEMA: Waste act and determined by its powers and function. The Municipality is allocated the function of solid waste management. The function involves determination of waste disposal strategy, regulation, establishment, operation and control of waste disposal sites or facilities, refuse removal, waste minimization through recycling, re‐use and waste education and awareness. In implementing its function the Municipality has a role to ensure that waste management systems are in place and the systems should be in line with the hierarchy of waste management according to the national waste management strategy. The implementation of the function is dependent on the function that is allocated to the Municipality i.e. refuse removal. Currently most of the waste is collected from household followed by commercial industries.
81
4.7 Refuse removal. The Municipality has no drop‐off, garden sites, transfer station, material recovery facilities and buy‐back centres for recycling. The Municipality is relying on private companies and community programmes for recovery of the recyclables. The companies such as Nampak, CONSOL, Mondi, Transpaco, Collect‐a‐can and Consol have contracted a service provider for the recovery of K4 box, cans, plastic bottles, clear and mixed plastics, white paper and glass bottles. There are also informal recyclers in the landfill, collecting K4 box, plastics, papers and steel. The municipality has a challenge of providing refuse removal service to the rural community. A pilot project has been initiated by the municipality to provide for refuse removal services in certain areas within the rural villages. The challenge range from unavailability of land and inadequate funds to provide the service. The municipality has a serious challenge of illegal dumping of garden waste in areas such as Marapong and Onverwacht, in that garden sites are needed in the mentioned areas.
4.8 Waste transport and transfer. The Municipality has five 12 cubic meter , three 20.6 or HC250 compactor trucks and three canter trucks for refuse removal and street cleaning, servicing four collection routes on Monday and Tuesday and five collection routes on Wednesday, Thursday and Friday in the urban area. Most of the 12 cubic meter compactor trucks were bought in 1991 and 1992 and are no longer reliable. The Municipality has no transfer station and Roll‐on‐Roll‐off system in areas that are situated at 30 to 35 kilometres from the landfill site. The areas such as Steenbokpan, Ga‐Seleka, Shongoane, and Mokuruanyane are in a pilot programme for refuse collection in rural areas. Skip bins are been placed at specific central collection point and collected on a weekly basis.
4.9 Waste storage. The Municipality has in‐adequate refuse receptacles for refuse storage. The municipality is using 1, 75 cubic meters bins and is on the process of rolling out 6 cubic meter skip bins for waste storage. In the central business district about seven to ten shops are sharing one or two 1, 75 cubic meter bins and the capacity is not enough. There are in‐adequate refuse receptacles on the streets of Lephalale town. The community and other businesses are not provided with 240 litre wheeled bins for waste storage.
4.10 Waste Education. The Municipality has a formal waste education programme called waste wise education competition and school recycling competition. The Municipality initiated environmental clubs in both rural and urban areas that are educating the community about good waste management practices in line with the National Waste Management Strategy, Municipal Waste Management by‐law, NEMA: Waste

82
Act and other waste legislations. The municipality is also supporting the provincial eco‐school and Limpopo schools state of environment report competition.
4.11 Waste Disposal. The Municipality has one permitted waste disposal facility. The life expectancy of the landfill is 5 years without waste minimization programmes but with such programmes the life expectancy can go as far as more than ten years. The Municipality has appointed a service provider to conduct the feasibility studies for the development of new landfill site. The municipality has no garden sites for temporary storage of garden waste, material recovery facility such as convenient transfer station for recycling and composting.
4 12 Waste information. The Municipality has no data base of waste management companies operating within its area of jurisdiction and statistics for the recovered waste for recycling and disposed waste. Table Household access to refuse removal
Removed by local authority/private company/community members once a week
Removed by local authority/private company/community members less often than a week
Communal refuse dump
Communal container/ central collection point
Own refuse dump
Dump or leave rubbish anywhere (no rubbish disposal)
Other Total H/H
18 779 349 1575 7135 9 806 4335 1023 43 002
Only 62.4% of the households in Lephalale Municipality have access to acceptable refuse removal service level. The Municipality is still faced with the challenge of illegal waste dumping in Marapong more especially next to illegal settlement areas and parts of Onverwacht as well rural areas. Generally waste collected is domestic or household mostly in urban areas especially Marapong, Onverwacht and Town. The provision of the service in rural areas is limited to 9 villages along D3110 road. Communities depend mainly on backyard dumping sites.

83
4.13 Environmental Challenges
Air and water quality and protection of rivers, wetlands and streams around the municipal area Retention and promotion of natural vegetation and ecosystem as a control measure against soil erosion Provision of drop‐off, garden sites, transfer station, material recovery facilities and buy‐back centers for recycling Illegal waste dumping in urban and rural areas Provision of refuse removal service in all the rural villages
CHAPTER 5 5 SERVICE DELIVERY AND INFRASTRUCTURE DEVELOPMENT.
5.1 Water. Lephalale Municipality as Water Service Authority has a duty to all customers and potential customers within its area of jurisdiction to progressively ensure efficient, affordable, economic and sustainable access to water in terms of section 11 [Water Services Act of 1997]. The Municipality has a duty to provide water to a population estimated at 140 240 living within urban, peri‐urban and rural areas of jurisdiction. The Lephalale Municipality is designated as Water Service Authority and Water Service Provider. All the water for the urban area of the Lephalale Municipality originates from Mokolo Dam. Grootegeluk Coal Mine originally built the main supply lines, pump station, balancing dam and water purification works in the urban area. The supply, as well as maintenance of the dam (as agent of DWA) is still done by Grootegeluk coal mine. In the case of Marapong township, which is situated near the mine/power station, purified water to the Municipality is supplied by Matimba Power Station. Even though the municipality has benefited to date from the investments made by Exxaro and Matimba in the past there is a concern that as water service authority, and considering long term development implications, the Municipality should have ownership of infrastructure required to provide water and sanitation services to Marapong area.
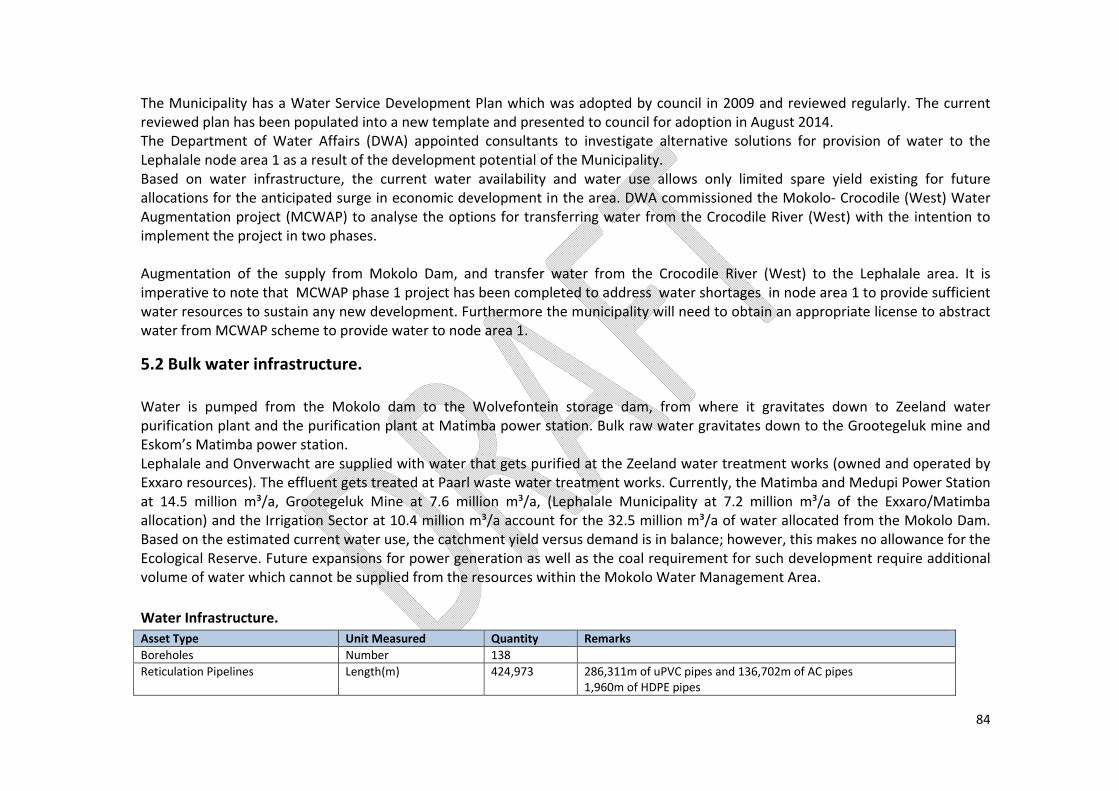
84
The Municipality has a Water Service Development Plan which was adopted by council in 2009 and reviewed regularly. The current reviewed plan has been populated into a new template and presented to council for adoption in August 2014. The Department of Water Affairs (DWA) appointed consultants to investigate alternative solutions for provision of water to the Lephalale node area 1 as a result of the development potential of the Municipality. Based on water infrastructure, the current water availability and water use allows only limited spare yield existing for future allocations for the anticipated surge in economic development in the area. DWA commissioned the Mokolo‐ Crocodile (West) Water Augmentation project (MCWAP) to analyse the options for transferring water from the Crocodile River (West) with the intention to implement the project in two phases. Augmentation of the supply from Mokolo Dam, and transfer water from the Crocodile River (West) to the Lephalale area. It is imperative to note that MCWAP phase 1 project has been completed to address water shortages in node area 1 to provide sufficient water resources to sustain any new development. Furthermore the municipality will need to obtain an appropriate license to abstract water from MCWAP scheme to provide water to node area 1.
5.2 Bulk water infrastructure. Water is pumped from the Mokolo dam to the Wolvefontein storage dam, from where it gravitates down to Zeeland water purification plant and the purification plant at Matimba power station. Bulk raw water gravitates down to the Grootegeluk mine and Eskom’s Matimba power station. Lephalale and Onverwacht are supplied with water that gets purified at the Zeeland water treatment works (owned and operated by Exxaro resources). The effluent gets treated at Paarl waste water treatment works. Currently, the Matimba and Medupi Power Station at 14.5 million m³/a, Grootegeluk Mine at 7.6 million m³/a, (Lephalale Municipality at 7.2 million m³/a of the Exxaro/Matimba allocation) and the Irrigation Sector at 10.4 million m³/a account for the 32.5 million m³/a of water allocated from the Mokolo Dam. Based on the estimated current water use, the catchment yield versus demand is in balance; however, this makes no allowance for the Ecological Reserve. Future expansions for power generation as well as the coal requirement for such development require additional volume of water which cannot be supplied from the resources within the Mokolo Water Management Area. Water Infrastructure. Asset Type Unit Measured Quantity Remarks Boreholes Number 138Reticulation Pipelines Length(m) 424,973 286,311m of uPVC pipes and 136,702m of AC pipes
1,960m of HDPE pipes

85
Bulk pipelines Length(m) 34,693 28,593m of uPVC pipes and 6,046m of AC pipes
Reservoirs Number 121
Water Treatment works Number 2 Witpoort and MaletswaiPump Stations Number 38
Source: Lephalale Municipality
Municipal Water capacity in urban area Infrastructure Current capacity Required capacity to meet future/present demand Shortfall for 2035Water 45.7ML/ 161.98ML 116.28ML
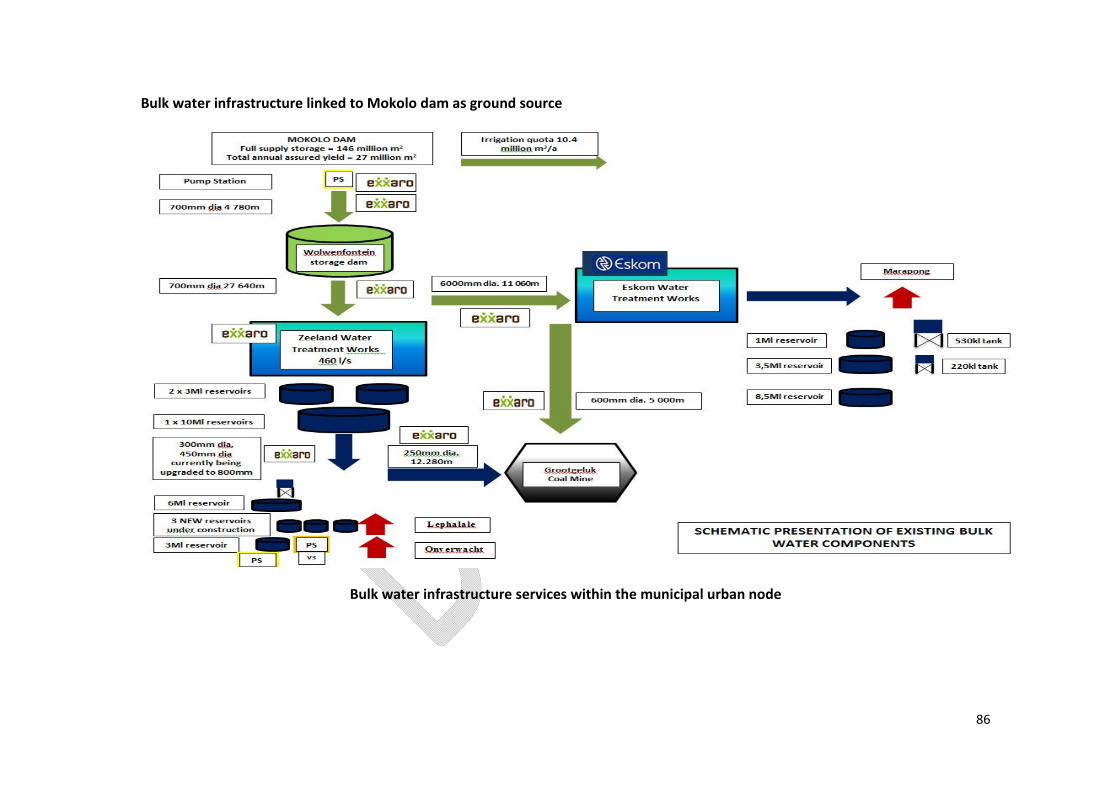
86
Bulk water infrastructure linked to Mokolo dam as ground source
Bulk water infrastructure services within the municipal urban node

87
Source: Municipal scoping report
Current and envisaged water and sanitation infrastructure plan in the urban nodal area as a result of anticipated economic development. Potential Bulk water supply abstracted from boreholes for scheme areas. Scheme Number Supply Area Potential Supply NW 100 Mokuruanyane RWS 1.950Ml/day NW 114 Witpoort RWS 0.930Ml/day NW 115 Ga‐Seleka WS 0.820Ml/day NW 116 Ga‐Shongoane WS 0.300Ml/day Total 4.00Ml/day

88
The rural area is currently divided into four different water services scheme. The potential bulk water supply, according to DWA, abstracted from boreholes in the Lephalale rural area for the four water scheme is as indicated above.
5.3 Water availability in rural areas. The rural areas all obtain their water from groundwater sources (about 85% from boreholes and 15% from well field type boreholes in the riverbed alluvium). The four water sub schemes serve approximately 38 villages through a network of approximately 138 boreholes, which are all owned and operated by the Municipality. The water is pumped to storage reservoirs and then distributed to the consumers. Chlorine dosing tanks were installed in the storage reservoir but the Municipality is experiencing difficulty in maintaining the dosing equipment due to budgetary constraints and not enough resources. The ground water from the boreholes is generally low due to poor yields and unacceptable water quality (class 3 or 4); however this does not necessarily pose a health risk to communities. Water from the well field type boreholes has however higher yields and acceptable quality. The surety of the current water supply from boreholes is not known. It is also not known what the actual volume of water is provided to the community. The Municipality has commissioned a study on water volumes provided to rural villages. Based on a RDP level of service for the existing community, an allocated water use of an average of 9kl/month per household in the rural areas and 36kl/month per household for Thabo‐Mbeki & Thabo‐Mbeki Ext 1 is proposed, the total theoretical current water demand calculated for development focus area 2 amounts to 5,992kl/d and 1,692kl/d for Thabo‐Mbeki and Thabo‐Mbeki Ext 1, all inclusive of a water loss of 15%. A detailed study is required to determine if the current supply from boreholes and wells are sufficient to meet this demand. According to data on the sizes of the reservoirs collected in the Municipality water asset register, the existing reservoirs have a capacity of 8,317kl/d but it is not clear whether the groundwater sources meets demand. The available groundwater yield and quality and storage capacity needs to be investigated as it is unsure if this resource can be expanded and to what degree. According to the water service development plan “starter requirements” approximately 22.6% of the rural population has access to water that have to be carried/carted 0‐200m, while 20.5% of the population has access to water that is 200‐500m away from the point of use. This implies that 35.6% of the rural population does not have water that falls within RDP standard of maximum cartage distance of 200m from point of use (i.e. resident/house). In Lephalale, one‐third of households do not have access to water in the dwelling or yard, but have to make use of community stand pipes. In Marapong this figure is somewhat lower (20% of households make use of community stand pipes) more than half of the households have access to water inside their dwelling. In ward 3 and town Lephalale, approximately 75% of households have access to water inside their dwelling, while 20% have a tap in the yard. The remainder makes use of community stand pipes.
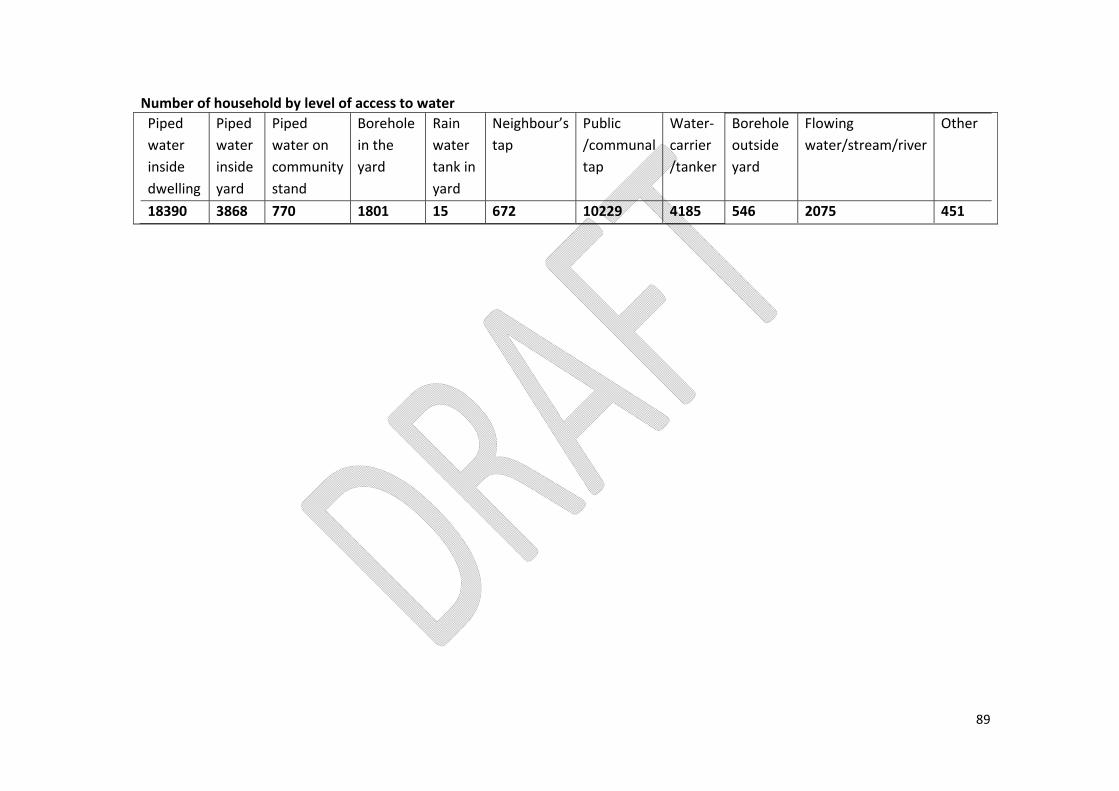
89
Number of household by level of access to water Piped water inside dwelling
Piped water inside yard
Piped water on community stand
Borehole in the yard
Rainwater tank in yard
Neighbour’s tap
Public /communal tap
Water‐carrier /tanker
Borehole outside yard
Flowing water/stream/river
Other
18390 3868 770 1801 15 672 10229 4185 546 2075 451
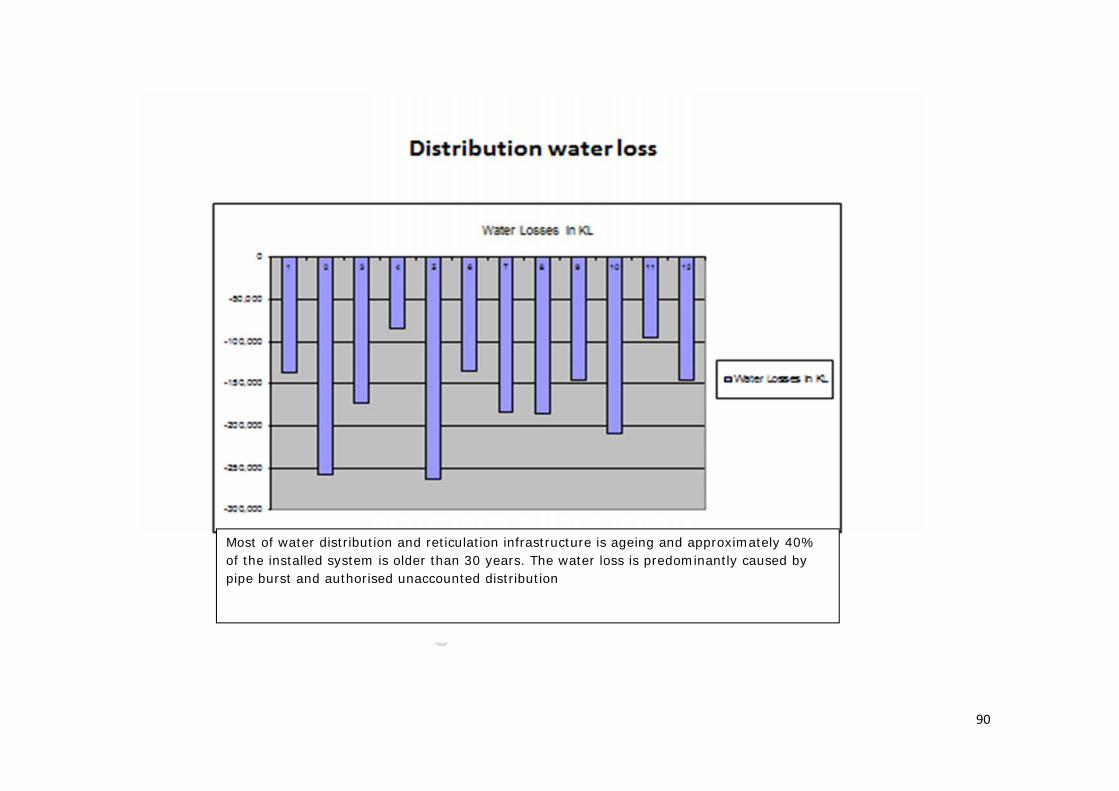
90
Most of water distribution and reticulation infrastructure is ageing and approximately 40% of the installed system is older than 30 years. The water loss is predominantly caused by pipe burst and authorised unaccounted distribution
91
Water challenges
The catchment in which Mokolo Dam is located is currently in deficit Dry boreholes due to lack of rain Aged bulk infrastructure in some urban and rural areas Non availability of ground water in rural areas Unplanned growth of rural villages extensions makes it difficult to provide water to all Insufficient water tankering to informal settlements and farms Implementation of water conservation and water demand management programme Insufficient budget for operations and maintenance of water infrastructure in rural villages Mushrooming of informal settlements in urban areas Poor quality of underground water in rural areas Ability to upgrade water supply services from basic to high level in rural areas Currently the Zeeland water treatment plant cannot cope with high raw water turbidity and the quality of water is affected
5.4 Sanitation. Sanitation is about dignity. The availability of sanitation facilities does not only improve the dignity of people, but also promotes their health. Areas without proper sanitation systems give rise to water borne diseases like cholera, diarrhoea, typhoid etc. It is therefore important that as a Municipality, priority should be given to this service, particularly taking into account the backlog (rural sanitation) and the national target. The land on which Lephalale town situated is relatively flat. Sewers are installed at slopes exceeding the slope of the natural ground level and over relatively short distances, become so deep that it must be pumped. Presently there are 38 pump stations in Onverwacht and Ellisras. All land around the developed areas is privately owned. The township layouts will be prepared by or on behalf of the land owners and the design of sewerage infrastructure will be carried out by their consultants. The requirements with regard to the placement and sizing of pump stations will be the product of the planning and design work undertaken by these developers. For these reasons it is believed that each developer should be responsible for the installation of any sewage pump station(s) and pump line(s) that he may require. Where feasible, when developments take place at the same time in the same area, these developers should be encouraged, if practical to construct infrastructure that they share. Sewage discharged from Onverwacht/Ellisras area is treated at the Paarl sewage treatment works. The treatment works has been expanded to treat 7.25ML sewage per day and presently has spare capacity of 3ML.
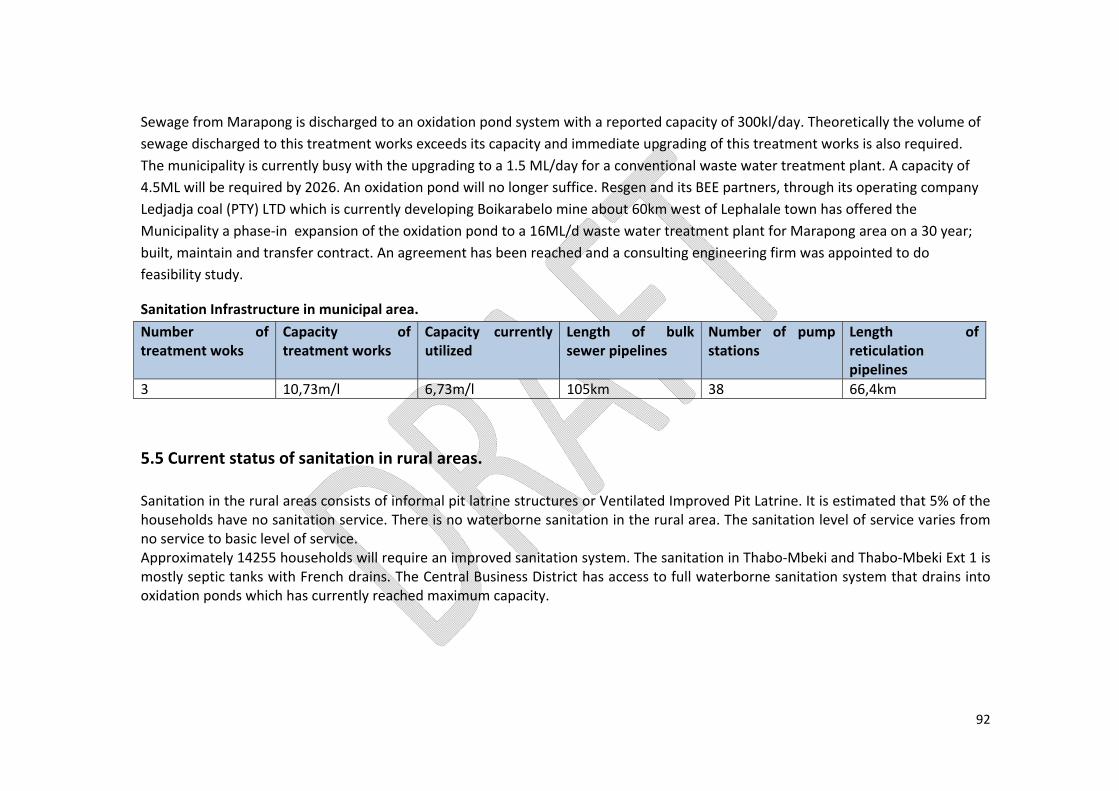
92
Sewage from Marapong is discharged to an oxidation pond system with a reported capacity of 300kl/day. Theoretically the volume of sewage discharged to this treatment works exceeds its capacity and immediate upgrading of this treatment works is also required. The municipality is currently busy with the upgrading to a 1.5 ML/day for a conventional waste water treatment plant. A capacity of 4.5ML will be required by 2026. An oxidation pond will no longer suffice. Resgen and its BEE partners, through its operating company Ledjadja coal (PTY) LTD which is currently developing Boikarabelo mine about 60km west of Lephalale town has offered the Municipality a phase‐in expansion of the oxidation pond to a 16ML/d waste water treatment plant for Marapong area on a 30 year; built, maintain and transfer contract. An agreement has been reached and a consulting engineering firm was appointed to do feasibility study.
Sanitation Infrastructure in municipal area. Number of treatment woks
Capacity of treatment works
Capacity currently utilized
Length of bulk sewer pipelines
Number of pump stations
Length of reticulation pipelines
3 10,73m/l 6,73m/l 105km 38 66,4km
5.5 Current status of sanitation in rural areas. Sanitation in the rural areas consists of informal pit latrine structures or Ventilated Improved Pit Latrine. It is estimated that 5% of the households have no sanitation service. There is no waterborne sanitation in the rural area. The sanitation level of service varies from no service to basic level of service. Approximately 14255 households will require an improved sanitation system. The sanitation in Thabo‐Mbeki and Thabo‐Mbeki Ext 1 is mostly septic tanks with French drains. The Central Business District has access to full waterborne sanitation system that drains into oxidation ponds which has currently reached maximum capacity.

93
Sanitation resources in rural areas.
As indicated in the section covering the water infrastructure, the area does not have sufficient water resources to accommodate a waterborne sanitation system for the entire nodal area 2. The pit latrines and VIPs in the rural area will need to be replaced with a more appropriate environmentally acceptable sanitation system once a more detailed study on what the most suitable technical solution for the existing ground conditions has been completed. Based on RDP level of service for the existing community, an allocated sanitation demand of an average 30kl/month per household for Thabo‐Mbeki and Thabo‐Mbeki Ext 1 is used. The total theoretical current waste water treatment capacity requirement calculated for population concentration point amounts to 1,424kl/d inclusive of a factor of 15% for infiltration. The estimated capacity of the
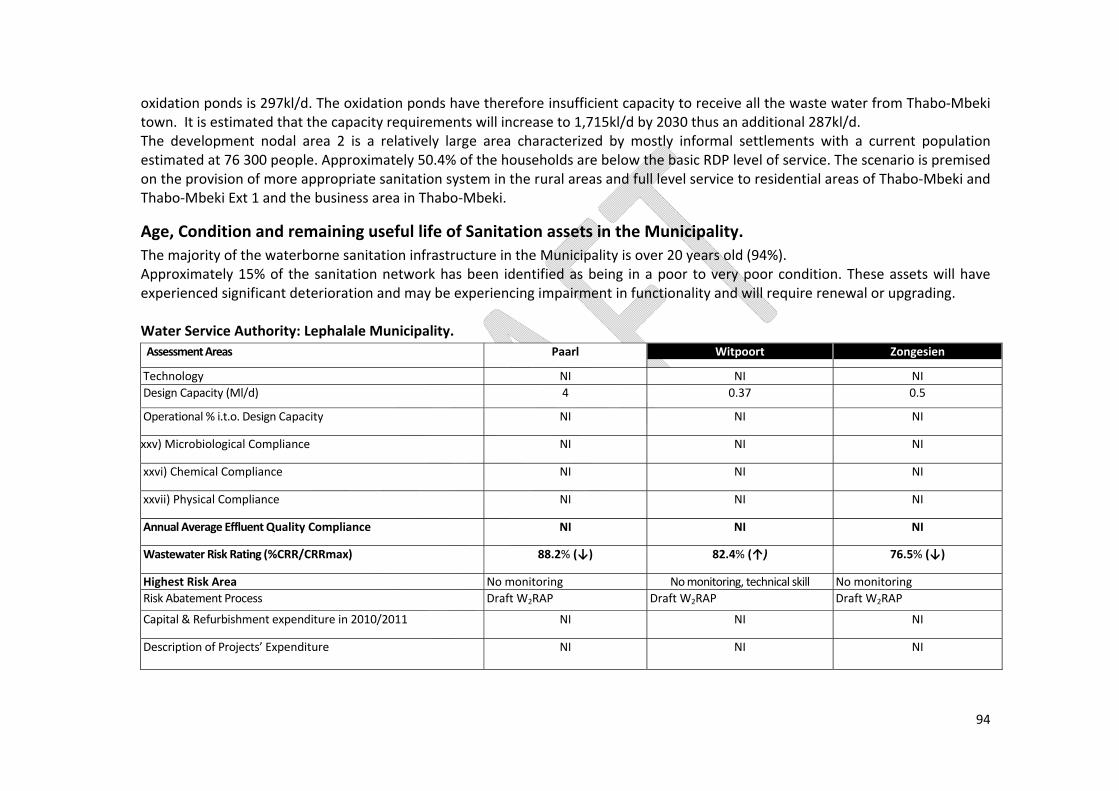
94
oxidation ponds is 297kl/d. The oxidation ponds have therefore insufficient capacity to receive all the waste water from Thabo‐Mbeki town. It is estimated that the capacity requirements will increase to 1,715kl/d by 2030 thus an additional 287kl/d. The development nodal area 2 is a relatively large area characterized by mostly informal settlements with a current population estimated at 76 300 people. Approximately 50.4% of the households are below the basic RDP level of service. The scenario is premised on the provision of more appropriate sanitation system in the rural areas and full level service to residential areas of Thabo‐Mbeki and Thabo‐Mbeki Ext 1 and the business area in Thabo‐Mbeki.
Age, Condition and remaining useful life of Sanitation assets in the Municipality. The majority of the waterborne sanitation infrastructure in the Municipality is over 20 years old (94%). Approximately 15% of the sanitation network has been identified as being in a poor to very poor condition. These assets will have experienced significant deterioration and may be experiencing impairment in functionality and will require renewal or upgrading.
Water Service Authority: Lephalale Municipality. Assessment Areas Paarl Witpoort Zongesien
Technology NI NI NIDesign Capacity (Ml/d) 4 0.37 0.5
Operational % i.t.o. Design Capacity NI NI NI
xxv) Microbiological Compliance NI NI NI
xxvi) Chemical Compliance NI NI NI
xxvii) Physical Compliance NI NI NI
Annual Average Effluent Quality Compliance NI NI NI
Wastewater Risk Rating (%CRR/CRRmax) 88.2% (↓) 82.4% (↑) 76.5% (↓)
Highest Risk Area No monitoring No monitoring, technical skill No monitoringRisk Abatement Process Draft W2RAP Draft W2RAP Draft W2RAP
Capital & Refurbishment expenditure in 2010/2011 NI NI NI
Description of Projects’ Expenditure NI NI NI

95
Assessment Areas Paarl Witpoort Zongesien
Waste water Risk Abatement planning CRR‐based W2RAP is in place, although its potential is limited by the lack of information pertaining to the plant
Additional Notes Green Drop Improvement Plan (GDIP) in place –well compiled to present practical tasks, responsible persons and timeframes with intention to improve the Green Drop 2013/14 score
Source: DWS
Household access to sanitation Flush toilet connected to public sewer system
Flush toilet connected to a septic tank or conservancy tank
Chemical toilet
Pit latrine toilet with ventilation pipe
Pit latrine/toilet without ventilation pipe
Ecological toilet(e.g urine diversion; enviroloo; ect)
Bucket toilet (collected by municipality)
Bucket toilet( emptied by household
Other None
18536 859 952 8326 10054 99 ‐ 74 520 3582
Municipal Sanitation infrastructure
Infrastructure Current capacity Required capacity to meet future/present demand Shortfall for 2035 Sanitation (WWTW) 12.3ML/d 25.65ML/d 13.45ML/d
Sanitation challenges
Aged infrastructure for bulk and internal sewer reticulation Inadequate budget for operation and maintenance of sewer infrastructure Insufficient capacity for waste water treatment works Organizational structure not strategically aligned to execute operational requirements Oxidation pond in Marapong operating
above capacity
5.6 Electricity. Lephalale Municipality is an electricity provider and has an electrical reticulation network supplying electricity to Onverwacht and the eastern region of Lephalale. The Lephalale electricity network is supplied from Eskom at 11kV via the Lephalale Main Substation next to the Onverwacht area. The Eskom supply is generated at Matimba Power Station and fed via the Matimba Substation at 132kV. The

96
Matimba Substation feeds the Eskom Waterberg Substation (Lephalale) where it is stepped down from 132kV to 33kV. Waterberg Substation has two 20 MVA 132kV/33kV transformers. From Waterberg Substation the power is fed via two Wolf conductor lines (approximately 8km each) to the main substation, at Lephalale. The substation has both an Eskom section with three 33kV/11kV 10MVA transformers and a 5 MVA substation from where the primary feeders are fed into the Lephalale network. The long awaited allocation of 120 MVA to make a firm supply has been received from Eskom. Due to the current maximum demand and load growth in the town and surrounding areas, the distribution network have been upgraded to allow for expansion. The load growth from 2008 to date is about 200%. For the area surrounding Lephalale town for which Eskom holds the supply license the load growth could be as high as 20 MVA per year for the next few years at current demand. In line with the expected load growth different scenarios have been put in place to upgrade the network. The rural villages, farm areas and Marapong are Eskom distribution area. The Villa Nora and Tomburke substations have been upgraded to 60MVA capacity for the rural network. Electricity Infrastructure. Asset Type Units Number CTVT Metering Unit Number 22 Ground Mounted Transformer Number 22 Mini Substation Number 252 Medium Voltage Substation Number 43 Medium Substation Buildings Area (m²) 3735m² Asset Type Units Number Pole Mounted Transformer Number 49 Ring Main Unit Number 92 High Voltage Substation Number 3 Source: Municipality
5.7 Network overview. Natural resource for electricity generation. The Waterberg area which includes Lephalale Municipality has been declared a National priority area in terms of the Air Quality Act (act 39 of 2004) which implies that ambient air quality in the area may exceed national ambient standards in the near future and

97
therefore, requires specific national air quality management. The Greenhouse gas scenario has driven the Municipality to embark on adaptation programmes and projects in natural or human systems in response to changing climate. Tobivox which is also known as Tomburke solar Park generates electricity through solar PV technology. Tomburke Solar Park generates 66MW capacity of electricity into Eskom national grid. The Tomburke photovoltaic power plant is capable of generating up to 122Gwh per year. The power plant output is equivalent to the annual consumption needs of around 38 000(thirty eight thousand) South African households while avoiding the emission of over 11 000(eleven thousand) tones of CO² into the atmosphere each year. The Solar Park power plant has a lifespan of twenty years. It will be possible for Lephalale to apply to the NERSA to take over the supply licence from Eskom for the surrounding areas. Whether these developments will be included within the Lephalale electrical supply network or not, the Lephalale electricity supply and network have been extended to accommodate current growth. The current network configuration as is will be able to accommodate growth to 120MVA if the Eskom supply network is strengthened. It must also be mentioned that whether the electrical distribution is within the Lephalale or Eskom distribution areas, the other services e.g. roads, storm water, sanitation and street lights is part of the services rendered by Lephalale Municipality. Household access to electricity In‐house conventional meter
In‐house prepaid meter
Connected to other which household pays for
Connected to other source which household is not paying for
Generator Solar home system
Battery Other No access to electricity
18536 16798 93 1174 199 22 ‐ 1855 4418
Free basic services
NUMBER OF HOUSEHOLDS PROVIDED WITH FREE BASIC SERVICESWater Sewerage and
Sanitation Electricity Refuse Removal Total households Total H/H served as %
14 102 1738 3 429 14 102 43 002 12.5% Lephalale Municipality
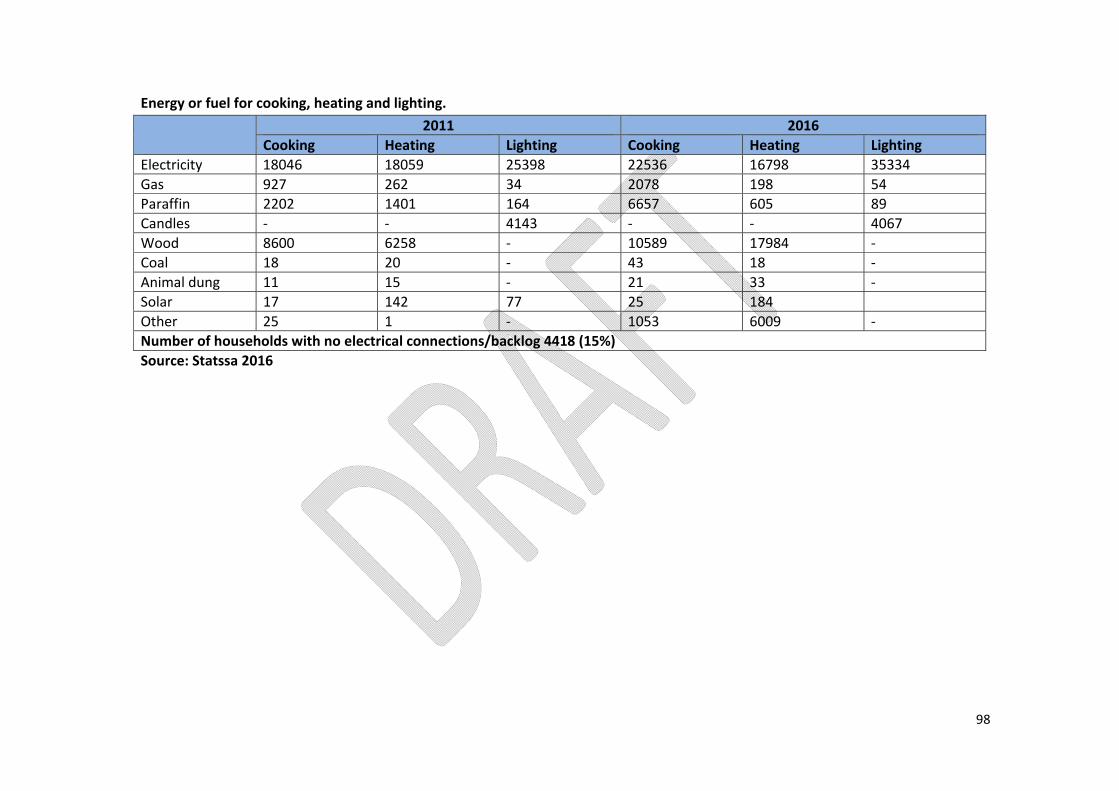
98
Energy or fuel for cooking, heating and lighting. 2011 2016
Cooking Heating Lighting Cooking Heating Lighting Electricity 18046 18059 25398 22536 16798 35334 Gas 927 262 34 2078 198 54 Paraffin 2202 1401 164 6657 605 89 Candles ‐ ‐ 4143 ‐ ‐ 4067 Wood 8600 6258 ‐ 10589 17984 ‐ Coal 18 20 ‐ 43 18 ‐ Animal dung 11 15 ‐ 21 33 ‐Solar 17 142 77 25 184Other 25 1 ‐ 1053 6009 ‐Number of households with no electrical connections/backlog 4418 (15%) Source: Statssa 2016
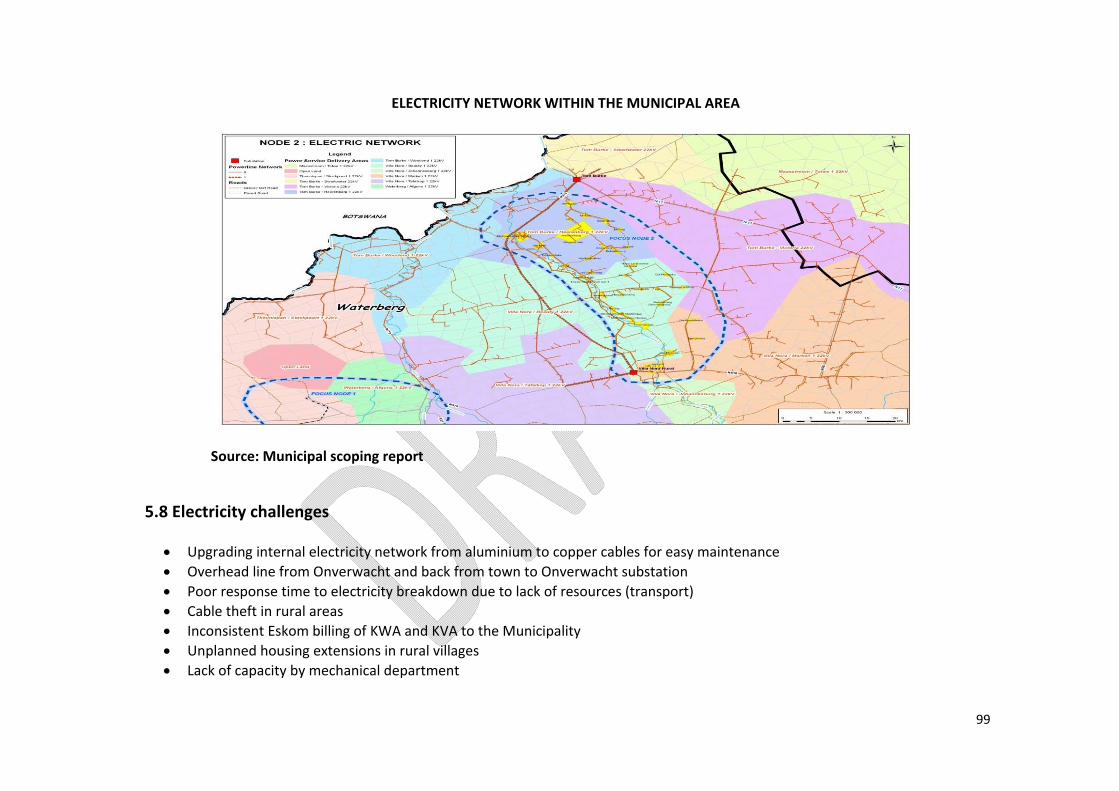
99
ELECTRICITY NETWORK WITHIN THE MUNICIPAL AREA
Source: Municipal scoping report
5.8 Electricity challenges
Upgrading internal electricity network from aluminium to copper cables for easy maintenance Overhead line from Onverwacht and back from town to Onverwacht substation Poor response time to electricity breakdown due to lack of resources (transport) Cable theft in rural areas Inconsistent Eskom billing of KWA and KVA to the Municipality Unplanned housing extensions in rural villages Lack of capacity by mechanical department

100
5.9 Roads and Storm Water.
Roads. The roads in Lephalale are adequately connected to National, Provincial and District roads. The issue being experienced in terms of the roads in the municipal area is two‐fold in nature. The first being the primary roads and related issues. These include the poor state of the roads due to limited maintenance of the roads. The poor state of these primary routes is having a detrimental effect on the distribution of goods, services and people in and through the Municipality. Possible causes of this are lack of funds, human resources, equipment and capacity to maintain the existing infrastructure. The second element of this issue is the poor state of the internal circulation routes in the area (especially in the rural area). The causes of the poor state of these roads can be attributed to lack of appropriate road maintenance policies and funds, the category/type of the roads i.e. gravel roads carrying high volumes of traffic. The R33 road serve as a link between Lephalale and Modimolle Municipality more especially for the delivery of machinery and equipment for construction of Medupi power station, expansion of Grootegeluk coal mine and future developments. This road needs special attention from Department of Roads and Transport and Road Agency Limpopo (RAL). Between Vaalwater and Lephalale the road gradient is too steep for abnormal heavy duty loads, therefore R510 and R517 are recommended for heavy goods vehicles (freight). The southern by‐pass provincial road P198‐1 linking R510 to Medupi has been identified as one of the main critical road. The Lephalale municipality will be responsible for bulk road infrastructure and individual developers of townships will have to provide all internal roads. There is concern on the rapidly degrading of many roads due to the increasing economic activities. Of the total length of municipal roads, some are paved and these are mainly in Marapong, Onverwacht and Ellisras respectively. The unpaved roads vary from dirt tracks to graded gravel surfaces which are mainly located in the rural areas of the Municipality. The current policy for improving municipal roads, as stated in the 2010/2011 IDP is to ultimately pave all municipal roads. Given limited resources and finances, interim 3 to 5 year programmes are prepared and updated annually to maintain existing assets to address serious problems, to improve access roads between villages and the higher order roads in conjunction with programmes of WDM, DOR&T, RAL and SANRAL. In the medium term, improved access to Lephalale will become a top priority, in terms of road, rail and air. It is unlikely that the coal and petrochemical cluster will reach its full potential without the upgrading of the R33 which needs rehabilitation from Vaalwater to Lephalale, the construction of a southern bypass from the R33 to the coal mine and power stations and the upgrading of the road in a westerly direction from Lephalale town to Steenbokpan and beyond to the Botswana border.
101
5.10 Functional road hierarchy. Road classification refers to the process where different types of roads are classified in a framework and placed in relation to each other. A functional road classification refers to the process of classifying roads according to the characteristics of traffic service and function that they are intended to provide. The local municipality could have the following benefits from a functionally classified road network: A suitable balance between mobility roads and activity/ access streets, it is possible to provide a high level of connectivity, while
maintaining a high level of road safety and accessibility. Orderly grouping of roads in a framework around which national, provincial and local government can plan and implement
various construction maintenance and environmental schemes and projects. A sound basis for traffic management, transport and land use management planning. Assistance to consider the effect of local government decisions on surrounding areas and streets. Helps clarify policies concerning roads within a local government district and precinct. Ensures the necessary facilities for commercial vehicles to traverse the area and allows for orderly planning of heavy goods
vehicle (freight) routes. Assist planners in the zoning of land for various uses and the restriction of activities which are compatible with mobility (traffic
flow) or accessibility functions designated routes.
5.11 Road network at regional level. The road network is the principal means of travel in Lephalale and the greater Waterberg district Municipality. On a district scale, several provincial roads provide inter‐provincial and inter‐municipal connectivity for the wider district, they also serve as linkage roads that provide local connectivity and form key components of the supply chain of the local economy. Intensive road network and infrastructure planning did not precede nor has it kept pace with the significant industrial and population growth within the municipal area. To date few of the unchecked development effects visible in road transport include: Increased traffic through Lephalale without extended road infrastructure Significantly high freight truck traffic, High levels of road congestion during peak traffic periods. The description of this roads are summarized below and it is important to note that this is a regional classification of the main roads and some of these road classification will change where the roads run through an urban area such as small towns and villages along the route.

102
Roads and storm water status quo. Municipality Total road network length Road kilometres tarred Road infrastructure backlog Lephalale Local Municipality 1 054. 84km 233. 02km 821. 82km Lephalale Municipality Provincial and District Roads classification. Roads Description Functional
Road Hierarchy Classification
N11 From Ladysmith (Kwa Zulu Natal) via Middleburg in Mpumalanga linking N1 at Mokopane via Lephalale to Botswana Border.
R1
P19/2 (R518)
East‐West corridor, from Lebowakgomo, in the South‐East link, linking with N1 in Mokopane and ending at Lephalale CBD.
R2
R510 North‐South corridor stretching from N4 highway in Rustenburg, via Thabazimbi and the Lephalale CBD to the Botswana Border.
R2
P198/1 (R33)
North‐South corridor passing via N1, linking Vaalwater to Lephalale CBD R2
R516 East‐West from Bela‐Bela connecting N1 and R33 traffic to R511 and R510 R2 R517 East‐ West from Vaalwater provides a link between R33 towards R510 R2 R572 North‐East from Tomburke to Stockpoort, it provides the link between N11 to R33 R2 D1675 West from Lephalale town provides a link from R33 to Steenbokpan R3 D175 North‐West it extends from the R572 to provide a link to Buffels‐Drift. R3 D3110 Serves as a district collector and links the R518 and R572 R3
In general the lower order roads in Lephalale are unpaved and would mostly be classified as R4 and the remaining local access roads as R5. The Lephalale town development nodal area 1 consists mainly of the CBD and residential areas in the direct vicinity. This is the most densely populated area in Lephalale and therefore the road planning and functional classification should be done in a more detailed level.

103
5.12 Storm water drainage. Just as the municipal road network is mainly rural in character, so are the related storm water drainage facilities. With the exception of most of the paved residential streets in Onverwacht and Ellisras which have kerbs, side channels, inlets and sub‐surface drain pipe or open collector channels network. The majority of municipal roads in and between the rural villages carry storm water drainage at surface level in open lateral channels, in and across the roadways and occasionally in culverts under the road. The residential streets in Marapong and Thabo‐Mbeki & Thabo‐Mbeki Ext 1 do not have storm water drainage infrastructure system. Urban development in a catchment changes the run off characteristics therein, increasing the impervious areas and resulting in an increased quantity of storm water runoff as well as more rapid and frequent concentration thereof. The developer of a township is required to accept the potential storm water flow from the area of catchment upstream of the township and to manage this as well as the runoff generated within the development, through a well‐planned and designed drainage system. Conventional drainage system should cater for frequent or minor storms. The guidelines for human settlement and design recommend the following design frequencies for minor system. Flood Design Frequency. Land use Design flood recurrence intervalResidential 1‐5 yearsInstitutional (e.g. school) 2‐5 yearsGeneral commercial and industrial 5 yearsHigh value central business district 5‐10 years In many instances in Lephalale minor storm drainage systems will serve more than one land use, and it is proposed that the Municipality should generally require that these systems be designed to accommodate the five year recurrence interval storm. A watershed is located along the western boundary of the development area of Onverwacht. Sections of the major storm infrastructure have been installed where it traverse the existing Ellisras extensions in close proximity to Mokolo river. This is necessitated by existing developments and restricted space. Two rivers drain Lephalale municipality, the Mokolo River which parallels on the east side of the R510 through Ellisras town and the Palala River which parallels on the west side of the D3110. Both rivers drain northwards to the Limpopo River. Storm water is the most source of damage to roads. The damage can extend from total destruction of a bridge or culvert crossing to damage shoulders, road
104
edges and destabilization of sub‐grade and base course layers. Where roads are unpaved washing away of the wearing course results in rapid road degeneration and use of the road by motorized transport rapidly becomes impossible. Uncontrolled storm water and free drainage systems are therefore to be avoided. Lephalale municipality has road graders and related equipment for road maintenance. The Limpopo DOR&T also has a maintenance depot in Lephalale town from which maintenance of Provincial, District and some Municipal roads is conducted. Budget is continuously provided, where possible for development of a road maintenance programme for Municipal Roads that are unpaved. Due attention needs to be given in this programme to the related storm water drainage facilities to maintain the accessibility not only of vehicular travel but also of non‐motorized travel. There is storm water channel backlog of 15518m in length and a bottom width of between 0,9m and 1,6m specifically around Onverwacht and Ellisras. Storm water backlog in the rural area is unknown but the area on the Southern part of Thabo Mbeki and Seleka Wyk 2 (Mmatshwana) is frequently flooded during heavy rainy seasons by Palala river when it over flows. Storm water backlog in Marapong is still under investigation. The appointed service provider estimates the costs to be around R2.6 billion.
5.13 Public Transport. The Municipality has a constitutional obligation to ensure that accessible, safe, efficient, adequate and affordable public transport is provided to the community. The Municipality adopted the Integrated Transport Plan in 2012 after the assistance from Department of Cooperative Governance Housing and Traditional Affairs. The geographical location of the villages and work opportunities in Lephalale is one of the determining factors in understanding transport demand problems. There are 38 rural villages in Lephalale, many of them located 40 km or more from the CBD of Lephalale. The CBD and town are located close to the coal mines and power stations, whereas the villages developed historically along Lephalale River. Approximately 65% or more of the Lephalale population live on farms or rural villages. These result in low residential densities, which make the cost of effective transport provision high. The coal reserves, estimated up to 260 years of reserves, are the main driver of economic activity in the area. If the planned and envisaged additional power stations and potential coal to liquid facilities, similar to SASOL or Secunda materialized, it will be a large stimulus for development in the area. Depending on what developments materialize in the area, between 16 000 and 37 000 additional housing units will be required for the next 20 years or so. In the development of future coal mines and power stations, care should be taken that residential settlements are located as close as possible to these work opportunities, to reduce travel time and cost of transport.

105
There are three formal taxi ranks in Lephalale, two informal taxi ranks and one bus rank. Bus shelters provided by the Municipality at some of the villages are only able to accommodate five people. Public Transport facilities are inadequate and in some cases far from the people they are supposed to serve. Public Transport/Taxi Facilities Number of formal minibus taxi
facilities Number of informal minibus taxi facilities Total minibus taxi facilities
Taxi ranks 4 3 7
43% of ranks are informal with amenities 25% of formal ranks have no amenities 28% of the ranks have offices 57% of the ranks are paved 42% of the ranks have ablution facilitiesSource: Lephalale municipality
The current economic development in Lephalale has most certainly brought about the increase in demand for provision of public transport although it is not clear as to what an extent. The problems faced by the Municipality regarding public transport are multi‐faceted. Problems include poor road conditions, lack of infrastructure such as lay‐bys, inadequate formalized taxi and bus ranks, taxis and buses that are not user friendly to people with disability, poor customer service, too many pick‐up points per route resulting in passengers having to travel for a long time before reaching their destinations, poor conditions of taxis and buses etc. These problems can only be addressed through preparation of number of Statutory Plans such as Current Public Transport Record (CPTR), Operating Licensing Strategy (OLS), Rationalization Plan (Rat Plan) and Integrated Transport Plan (ITP).
5.14 Road Freight Transport. Lephalale’s main conduit to the mines and the power station, Nelson Mandela road D1675 is currently experiencing high traffic volumes. The road has been upgraded into a dual way lane and is making a great difference with regards to traffic flow during peak times. To date few of the unchecked development effects visible in road transport include amongst other, increased traffic through Lephalale without extended road infrastructure consisting of high freight traffic and high levels of congestion during peak traffic periods.

106
Projects of National strategic importance such as the Medupi power station and Grootegeluk coal mine expansion have in recent years resulted in a significant increase in road freight volumes to and from Lephalale. In addition, exports through the Groblersbrug border post on the N11 passing through Lephalale municipal area has increased. Various national, provincial and local roads in the Lephalale area have been damaged by heavy vehicles. This adversely affects the economic development of the area. Over the past decade there was a substantial growth in volume of high grade coal transported by road from Grootegeluk coal mine to Exxaro’s clients in the Limpopo, Northwest, Mpumalanga and Gauteng provinces. Coal mines on the eastern Highveld in Mpumalanga cannot keep up with the demand as some are reaching the end of their productive lives and can only supply medium to low grade coal. In comparison, the Waterberg coal fields are still relatively unexploited and have large reserves of high grade coal available. Freight routes for the transportation of coal and coal products from Lephalale to end‐users across the country and beyond have increased tremendously.
Transportation of construction materials for existing infrastructure and future projects within Lephalale Municipal area. (a) Medupi Power station: High volumes of materials such as steel, cement and other materials for the construction of Medupi Power station are transported by road from manufacturing plants and factories all over Gauteng. Abnormal loads with pre‐manufactured components such as boilers which have either been manufactured by local industries or imported through Durban harbour are also arriving at the construction site almost on a daily basis. The last unit of the power station should be commissioned by 2019. Construction works on Medupi should continue until 2020. (b) Mokolo and Crocodile River Water Augmentation Project: The first construction phase of the Mokolo and Crocodile River Water Augmentation Project (MCWAP) was commenced with early 2012. This project involves a water pipeline which Water Affairs and the TCTA (Trans Caledon Tunnel Authority) is constructing over a distance of ± 35km between Mokolo Dam and Medupi Power station. Phase 2 of the project is earmarked to commence in 2018 to abstract water from Hartebeest dam.
107
(c) New Market coke plant: Exxaro’s new coke plant at Grootegeluk mine, which was under operation, has recently burnt down and it is expected that new reconstruction will resume after the investigation of the course of fire. (d) IPP Waterberg power station: The power station to be constructed and operated by an independent Power Producer will be built in the Steenbokpan area. Environmental studies in terms of the National Environmental Management Act are currently being done. (e) TFR Rail Project Phase 1: In January 2012, Transnet Freight Rail announced the first phase of a rail improvement project to increase the rail capacity of the existing Lephalale‐Thabazimbi‐Rustenburg‐Pyramid rail line from the current 4 mta to 23 mta. A budget allocation of 7 billion rand will be spent over the next 5 years to increase passing loops on the existing single line and replacing sleepers to increase the loading capacity from 20 tons to 26 tons per axle. (f) TFR Rail Project Phase 2: The second phase of the rail improvement project is aimed at increasing export capacity from the Waterberg coal fields and includes amongst others, the doubling of the Lephalale ‐Thabazimbi rail line. The cost of this project is estimated at R31 billion and it will increase capacity on the line to 80 mta. This will also result in an increase in mining activity in the Waterberg coal fields between Lephalale and Botswana border. (g) Boikarabelo mine: This coal mine is planned north‐east of Lephalale. Construction works will result in the increased road freight transport during the development phase of the mine. (h) Sekoko mine: This mine will be located along the Botswana border. It will also result in an increase in construction traffic during construction phase of the project as well as the transport of coal when mining commences.
108
(i) Thabametsi Mine: The proposed new mine adjacent to Grootegeluk should be under construction from 2018. This mine will supply coal to the proposed 600 to 1 200MW power station for the Limpopo Independent Power Producer (IPP). 5.15 Consumer goods for local consumption. The electricity generation and mining sectors together contribute 75% to the regions’ economy, while the business sector contributes only 14%. The business sector uses only road transport to transport all consumer goods required to maintain the Lephalale population of 42 054 households.
5.16 Roads and storm water challenges.
The roads and storm water infrastructure in the municipality indicates that 821.83km of the roads are gravel. The majority of the infrastructure in the Municipality is between 10 to 20 years old and this implies that within the next six
years the majority of these unpaved roads will have reached their end of expected useful life. 21% of the road infrastructure with the current replacement cost amount of R112.8 million (excluding annual inflation of
±7.8%) is in poor condition while 23% of the infrastructure with current replacement cost of R123.8 million is in a very poor condition.
Marapong and Thabo‐Mbeki area has no storm water infrastructure at all.
CHAPTER 6
6 LOCAL ECONOMIC DEVELOPMENTS. Promotion of Local Economic Development is a constitutional mandate which reads as follows: “A Municipality must structure and manage its administration, and budgeting and planning process to give priority to the basic needs of the community and to promote the social and economic development of the community”. LED is a participatory process which requires inputs from various stakeholders. LED encourages the private, public and civil society sectors to work together to create an enabling environment for economic development. As the elected entity, the municipality has the role to facilitate the economic growth and development within its boundaries and therefore acts as a driver for Local Economic Development.
109
The Lephalale LED strategy which was reviewed by council in (2014) recommends that the specific objective of local economic development should be to promote the comparative and competitive advantages of the Lephalale economy for the benefit of all its citizens. This objective should form the basis for job creation from which households can earn respectable livelihoods; the spatial diversification of production and service provision as much as possible throughout the municipal area; and for broad based and sustainable economic empowerment. The Municipality, as representative of the community and as custodian of the strategy has a leading role to play in the implantation process. This role ranges from intelligent intervention to gentle facilitation, depending on the resources that can be mobilized to achieve LED objectives. The facilitation role itself (as reflected in the municipal vision statement) can range from public sector resource contributions to networking, promotion of dialogue; and compilation and distribution of planning information.
6.1 Economic Analysis. Lephalale is defined by Limpopo Growth and Development Strategy as a coal mining and petrochemical cluster. The area is currently experiencing growth driven by mining expansion and construction of Medupi power station. Medupi project has already started demobilising staff on completed project phases. The coal to liquid project that was investigated by Sasol and currently placed on hold could broaden the opportunities for cluster formation. The local economy is dominated by the coal mine and the power station. Three clusters that are most relevant to Lephalale are firstly Coal & Petrochemical, secondly red meat and thirdly Tourism. Lephalale is currently in the final stage of considerable public sector investment, estimated at R140 billion over the past six years, for construction of Medupi power station. One of government’s key priorities is to increase economic growth and to promote social inclusion. The National Development Plan (NDP) is a plan to unite South Africans, unleash the energies of its citizens, grow inclusive economy, build capabilities and enhance capacity of the state and leaders working together to solve complex problems. Given government’s objectives of growing the economy, creating jobs, addressing poverty and promoting social cohesion, the NDP assists government in confronting three fundamental planning questions:‐ Where should government direct its investment and development initiatives to ensure sustainable and maximum impact; What kind of spatial forms and arrangements are most conducive to the achievements of the objectives of democratic nation‐
building and social and economic inclusion?

110
How can government as a whole capitalize on complementarities and facilitate consistent decision making and move beyond focusing on integration and coordination procedures to establishing processes and mechanism that will bring about strategic coordination, interaction and alignment?
Rapid economic growth that is sustained and inclusive is a pre‐requisite for the achievement of other policy objectives, among which poverty alleviation is key. Beyond the constitutional obligation identified above, government spending on fixed investment should be focused on localities of economic growth and/or economic potential in order to gear up private sector investment, to stimulate sustainable economic activities and to create long‐term employment opportunities. In order to overcome the spatial distortion of the past, future settlement and economic development opportunities should be channelled into activity corridors and nodes that are adjacent to or that link the main growth centre. The accelerated and shared growth initiative for South Africa (ASGISA) is derived from the objective of achieving a 6% growth rate for national economy, which will create the platform for halving unemployment and meeting social development targets. The government had to review this target as a result of global economic meltdown. The initiative requires the following specific actions:‐ Strengthening the macro‐economy, creating essential infrastructure, formulating and implementing sector and industrial
strategies, promoting skills and education, supporting the second economy and improving public administration. The joint initiative on priority skills acquisition (JIPSA) was formulated in response to the call by AsgiSA to fast‐track the resolution of the skills shortages challenge in the country. The National Framework for LED in South Africa aims to support the development of local economies through integrated government action. The framework promotes a strategic approach to the development of local economies and a shift away from narrow municipal interests focused only on government inputs into ad‐hoc projects. The application of the National Spatial Development Perspective (NSDP), Industrial Policy, ASGI‐SA and Provincial Growth and Development Strategies (PGDSs) through joint action with municipalities institutionalized in inter‐Governmental Relations forums is the driving force for local and hence national economic growth and development. Unemployment in Lephalale at 22.9% is below the provincial average, due to all the local developments relating to the new Eskom (Medupi) power station and the expansion of coal production from the mine. The labour force participation rate in Lephalale is above the provincial average, which indicates the high incidence of workers who originates from other places.

111
6.2 EPWP implementation programme, CWP, etc. Over the years Lephalale Municipality has been implementing projects through labour intensive programme aligned to the Extended Public Works Programme (EPWP). The EPWP involves creating temporary work opportunities for the unemployed, using public sector expenditure. It builds on existing best‐practice government infrastructure and social programmes either by deepening their labour absorption or extending them. The EPWP is a programme that cuts across all departments and spheres of government. Under EPWP, all government bodies and parastatal are required to make systematic effort to target the unskilled unemployed. Jobs Created within municipal area (Number of jobs created through municipal initiatives and capital projects from municipal budget up to 3rd Quarter) EPWP – 54 CWP 589 6.3 Enabling Economic Infrastructure.
Community services and infrastructure play a vital role in the development of the local economy in the region. The level of service in both of these categories directly and indirectly affects the ability of a region to attract and retain talented individuals and to compete for business.
The following factors should be taken into account when assessing the readiness, or enabling environment of an area:
The quality and extent of hard infrastructure such as road and rail networks, airports and harbors. The sophistication of local telecommunications, banking and finance services similarly impact on the input and operational costs of doing business. The extent to which spatial and land planning policies and documents are flexible to the needs of businesses and the relative ease of following land planning processes, such as rezoning applications.
The sophistication of the public sector, quantity and quality of available labour and training programmes, in relation to specific human resource requirements of investors. Quality of life factors, such as the supply of housing and personal lifestyle facilities (such as educational, cultural and recreational services) also have impact on the attraction of a particular investment.
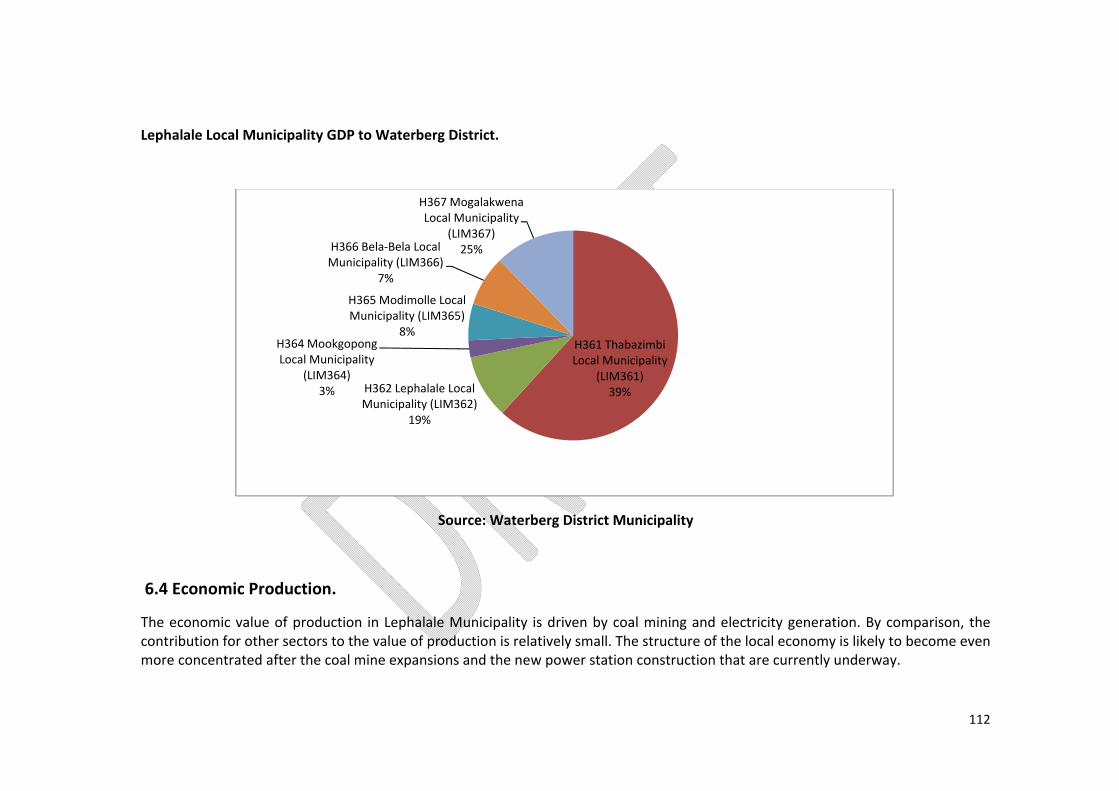
112
Lephalale Local Municipality GDP to Waterberg District.
Source: Waterberg District Municipality
6.4 Economic Production.
The economic value of production in Lephalale Municipality is driven by coal mining and electricity generation. By comparison, the contribution for other sectors to the value of production is relatively small. The structure of the local economy is likely to become even more concentrated after the coal mine expansions and the new power station construction that are currently underway.
H361 Thabazimbi Local Municipality
(LIM361)39%H362 Lephalale Local
Municipality (LIM362)19%
H364 MookgopongLocal Municipality
(LIM364)3%
H365 Modimolle Local Municipality (LIM365)
8%
H366 Bela‐Bela Local Municipality (LIM366)
7%
H367 Mogalakwena Local Municipality
(LIM367)25%
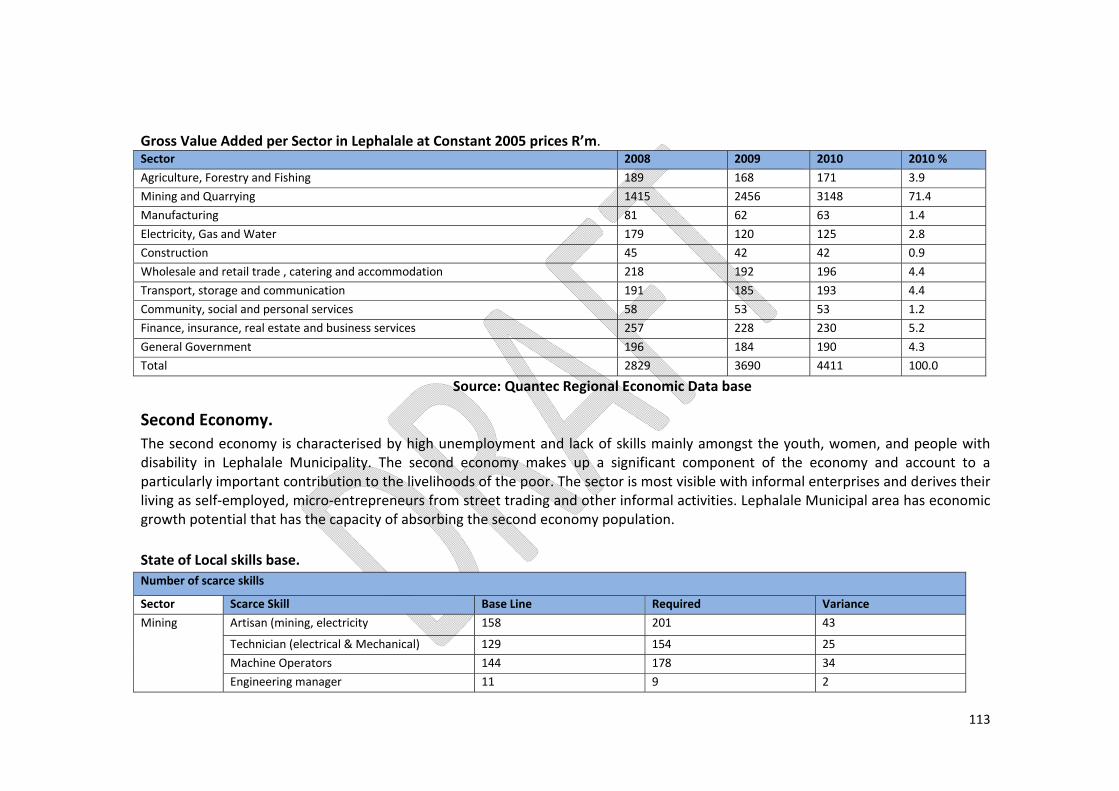
113
Gross Value Added per Sector in Lephalale at Constant 2005 prices R’m. Sector 2008 2009 2010 2010 %Agriculture, Forestry and Fishing 189 168 171 3.9Mining and Quarrying 1415 2456 3148 71.4Manufacturing 81 62 63 1.4Electricity, Gas and Water 179 120 125 2.8Construction 45 42 42 0.9Wholesale and retail trade , catering and accommodation 218 192 196 4.4Transport, storage and communication 191 185 193 4.4Community, social and personal services 58 53 53 1.2Finance, insurance, real estate and business services 257 228 230 5.2General Government 196 184 190 4.3Total 2829 3690 4411 100.0
Source: Quantec Regional Economic Data base
Second Economy. The second economy is characterised by high unemployment and lack of skills mainly amongst the youth, women, and people with disability in Lephalale Municipality. The second economy makes up a significant component of the economy and account to a particularly important contribution to the livelihoods of the poor. The sector is most visible with informal enterprises and derives their living as self‐employed, micro‐entrepreneurs from street trading and other informal activities. Lephalale Municipal area has economic growth potential that has the capacity of absorbing the second economy population. State of Local skills base. Number of scarce skills
Sector Scarce Skill Base Line Required VarianceMining Artisan (mining, electricity 158 201 43
Technician (electrical & Mechanical) 129 154 25Machine Operators 144 178 34Engineering manager 11 9 2

114
Tourism Tourism marketing2 (interns)
20 19
Tour guides 0 200 200Tourism information presenters 0 135 135
Agriculture Agriculture engineering 5 10 5Veterinary medicines 7 9 2Meat inspectors 2 9 7
Source: Lephalale Municipality
6.5 National Energy programme. Vast coal deposits and other minerals of national importance are found in Lephalale area. Currently phosphates are mined at Glenover mine near Steenbokpan. Iron is also found in Marnitz within the Lephalale area. The most important of these minerals are the coal deposits located in the Waterberg coal field. The coal seams have an average thickness of 115 meter and holds approximately 40% of the national coal reserves of South Africa. At current production rates it holds 300 years of export potential. This coal fields stretches across the border into Botswana. Discussions with Exxaro and Anglo Coal reveal that Lephalale will become the coal gate into Africa, with significant Botswana/Zambia coal exports through the border posts and Limpopo province. Currently Exxaro Resources export coal via road from Lephalale to Zambia. This export market is expected to grow. The largest coal production shift in the history of South Africa is scheduled to take place towards 2019, with the production of coal progressively moving from Witbank to Lephalale. Coal consumption in South Africa will continue to be dominated by the existing coal‐fired powered stations, the first of which will only be decommissioned from 2021. Whether any more power stations will be built after the two which are currently being constructed, and whether another coal to liquid plant build the next biggest domestic Coal demand sector will depend on precautionary steps South Africa might take to reduce its Carbon‐intensity and greenhouse gas emissions in the face of global concerns around climate change. In 2008, Eskom estimated that it would need around 200 Mtpa (million tons per annum) of coal by 2018 and that South Africa could need 40 more coal mines at an estimated R100 billion investment. A number of old mines are nearing the end of their life and, according to Eskom estimates, new mines will have to contribute around 180 Mtpa within 10 years to meet Eskom, Sasol, and other domestic and export demand (Eberhard, 2011).

115
Demand for South African coal exports are expected to decline in Europe as it decarbonizes its power sector, but will increase especially in India, and also China and other countries in the east. This demand is driven by rapid economic growth and arguments that these countries’ per GDP CO² emissions are still below Organization of Economic Cooperation and Development averages. However, South Africa’s ability to respond to this growing demand will depend on the development and implementation of coordinated investment strategy in new coal mines and rail capacity to get coal to its ports (Eberhard, 2011).
6.6 Localized guidelines for rural development, poverty alleviation and gender equity. Women, children, people with disabilities, the aged, farm workers and rural residents are most vulnerable groups in the communities. The disparities and poverty express themselves along racial and spatial lines. These socially disadvantaged individuals are found in rural villages and townships. Since development is about improving the lives and standards of living of people, the said groups should benefit as well. Their rights to basic and human dignity are protected in the constitution of the Republic of South Africa. Inequality also plays itself in the form of unemployment and empowerment opportunities among women, people with disability and the youth. The IDP in particular and the municipal policies in general should assist in dealing with the issues of inequality and unemployment. The causes of these inequalities and influence over access to and control over social, political and economic resources should be fully understood. All of these have a bearing on service delivery and development in the context of the IDP. The mainstreaming of the gender in the IDP process is very important. War on poverty programme and other poverty alleviation programmes must be assisted and be complemented to assist in dire need situations. The main instruments which are used against poverty are cooperatives, food security and local economic development programmes. Rural development priorities are underscored by the realization that in lagging regions, the agricultural sector is complimented by other primary industries such as mining, tourism, manufacturing and other labour intensive economic activities that can create employment for semi‐skilled and unskilled population groups. The unlocking of rural economic potential will be done through:
Fostering knowledge transfer and beneficiation in mining, manufacturing and tourism; Mapping out the mining and manufacturing value chain; Harnessing the capacity of the energy sector through diversification of energy resources; Ensuring meaningful transformation and broad‐based participation in the mining industry through empowering emergent black
businesses in this sector; and

116
Ensuring that there is beneficiation within the mining and manufacturing sectors, leading to the improved quality of life for rural communities.
The unlocking and/or harnessing of economic potential of these sectors are envisioned to promote social inclusion, poverty reduction and economic development in rural areas. The District Rural Development Plans for Limpopo provide a unique platform and opportunity to support the sustainable management and optimal utilization of natural resources; growth of rural business and; improvement of the well‐being of rural communities. The District Rural Development Plans DRDP are designed to be innovative, adaptable and integrated with other strategic spatial plans as a means of ensuring maximum value from investments. The identification of agriculture business as a catalyst for revitalizing rural economies does not neglect the vulnerability of this sector to climate change, drought as well as global market forces. To this end, DRDLR and other departments responsible for rural development have put emphasis on non‐agricultural sectors. DRDPs for Limpopo therefore will employ a targeted approach to key sunrise sectors, notably tourism, creative industries and the service sector. Such an approach will create opportunities for small businesses to (a) collaborate with established ones and (b) contribute to the growth of rural economies. The District Rural Development Plan forms part of a range of strategic spatial planning instruments as well as other sector plans aimed at transforming the apartheid space economy. In achieving the goal of economic inclusivity and transformation, agricultural development has been identified as one of the critical sectors that can unlock development. The appreciation of agricultural development in Waterberg and other rural municipalities should be located within an appreciation of the country’s agrarian transformation agenda. In other words, the development of an inclusive and competitive agricultural sector is informed by the appreciation of ongoing land reform processes as well as land tenure systems that continue to evolve. All the strategic spatial plans as well as sector plans for Limpopo point to the fact that agriculture is at the heart of rural economic transformation. The Limpopo Development Plan (LDP) as well as the Agriculture Policy Action Plan (APAP) attests to the fact that rural areas are faced with the triple challenges of poverty, unemployment and lack of service delivery. To this end, while acknowledging the uniqueness of Limpopo’s districts with regard to population dynamics and economic development, it should be noted that the aforementioned triple challenges cut across all municipal boundaries.

117
Other projects either in a feasibility or bankable feasibility stage.
Lephalale Municipality
6.7 Relationship with Botswana. Although not well‐known, fact is a certain portion generally known as the “Tuli Block” situated adjacent and north of the Limpopo River in Botswana was previously part of South Africa. Because of the historical land tenure ways this “block” was subdivided into
118
farms measuring ± 2000 hectares in extent under freehold title. This has a signifying importance for the Lephalale municipal area specifically for Lephalale town. Most residents in the “Tuli Block” have close relations with South Africa and more specifically with the Lephalale Area. Botswana is relatively under developed country with limited infrastructure and a small population. The closest towns in Botswana to the “Tuli Block” are the towns of Mahalapye, Palapye and Selibwe Pikwe. These three towns are very small settlements without any proper economic bases offering very basic amenities. These results in the owners and residents using the well and diverse established facilities in Lephalale town e.g. churches, schools, doctors, businesses, banks, hospitals etcetera. As a result thereof it further stimulates the local economy and the role of Lephalale town as a regional facility. The Botswana government is also looking at the exploitation of the coal field in Botswana. The building of power stations, dams, Coal mines and power transfer stations are currently under investigation. Botswana does not have the required skills and knowledge to construct such developments and will make use of the available skills and knowledge pool in South Africa. Lephalale town as the biggest town with well‐established facilities will further benefit from such developments leading to a further and increased stimulation thereof, eventually resulting in the upgrading and expansion of link roads, border posts, and other public, residential, industrial and business facilities in town. There is good prospect of increased employment opportunities for the local communities.
6.8 Economic Development Potential of Lephalale. Grootegeluk coal mine owned by Exxaro has been expanded to supply coal for the new Medupi Power Station from 2012 onwards. As part of its mining expansion programme Exxaro has announced that it will be constructing a new coal mine named Thabametsi which will be situated about 13km to the west of Grootegeluk coal mine. The mine is expected initially to produce 6 million tons of coal per year and later be ramped up to 16 million tons as off‐take agreements are secured. The project has been approved by department of mineral resources and construction is expected to be in 2018. Exxaro is targeting the development of a 1,200 MW independent power producer to be attached to the new mine. This can be expanded in modules to a standard base power station generating 4,600 MW of electricity. During the State of the Nation address in 2013 the president of the Republic of South Africa made pronouncement of the integration of rail, road, and water infrastructure, centred on Waterberg in the western part and Steelpoort in Sekhukhune in the eastern part of Limpopo with Mpumalanga province. The efforts are intended to unlock the enormous mineral belt of coal, platinum, palladium, chrome and other minerals in order to facilitate increased mining as well as stepped‐up beneficiation of minerals in Limpopo.

119
Construction of Medupi Power Station commenced in August 2007. According to plan the first phase of the station was commissioned towards the end of 2014. Economic activities and development within the municipal area has brought visible benefits to the local community. High illiteracy level is hampering most people from entering the job market as a result of not meeting minimum requirements. Much needs to be done to improve literacy level. Development opportunities. The economic trends will describe macro‐economy environment of the Lephalale Municipality and will give a broad but concise overview of the economy of the municipality. The economy in the area can be divided into three main categories namely; primary, secondary and tertiary sectors. Create an enabling environment where the electricity sector can become a hub within the provincial and national economy; Use the primary resources to create an opportunity for tourism development in the Lephalale region; The agricultural sector should be supported by creative and sustainable development of SMME’s to integrate the agricultural
and mining sectors with tourism development and; Value adding to the raw materials. The manufacturing of products that use the raw materials mined at Lephalale should be a
core development potential.
Lephalale’s Competitive and Comparative Advantage. The Waterberg Coal Field located in Lephalale is estimated to contain a resource of 50 billion tons, of which 12.5 billion tons can be mined by opencast method. This coal is sufficiently close to surface that it does not require the sinking of a shaft. Eskom has stated publicly that it needs to increase electricity generation from 40,000 MW in 2008 to 80,000 MW in 2026 and that at least half of this will be from coal fired power stations. This implies that 20,000 MW is needed from coal. It is expected that the new Kusile Power Station in Mpumalanga, for which construction commenced in 2008, is the last coal fired power station to be built outside the Waterberg Coal Field in this time horizon. Kusile will generate 4,800 MW, which is similar to the output expected from Medupi Power Station. Construction of Medupi, in Lephalale Municipality, commenced in 2007. The implication is that at least another 10,400 MW of generation capacity is required from coal before 2026 and the Waterberg Coal Field is the most likely source of coal for this purpose. It is therefore reasonable to assume that the Municipality could host another three coal fired power stations after Medupi. The existing Matimba Power Station, Medupi, which is currently under construction, and the other three power stations that can reasonably be expected, will collectively consume 80 million tons of coal per year. With an

120
opencast mining resource of 12.5 billion tons, these power stations can be sustained for 156 years. A study conducted by Professor Phillip Lloyd on behalf of Bateman, indicated that the Waterberg coal is among the most liquefiable in the world. A feasibility study for a coal to liquid process in the Waterberg has been concluded by Sasol. The new coal mines, the power stations and the coal to liquid facility could lead to a six‐fold increase in households in and around Lephalale town, from 5,000 in 2007 to 32,000 in 2020. This will create a significant demand for building material and will also have secondary implications for retail, service and small industry development. Lephalale Municipality therefore has a competitive advantage in game‐related tourism. A strong footprint of game lodges has already been established. Finally, the municipality has a competitive advantage in beef production. The latest available livestock census figures from the Department of Agriculture indicate that 36,000 cattle are owned by commercial farmers and 16,000 head of cattle by communal farmers.
6.9 Mineral rights. The object of the minerals and petroleum Development Act no. 28 of 2002 is to make provision for the equitable access to and sustainable development of the nations, mineral and petroleum resources, and to provide for matters connected therewith, such as prospecting and mining and rights and permits. The Act recognizes the following: that the country’s mineral and petroleum resources belong to the nation and that the state is the custodian thereof. Mining can and should contribute to economic growth and job creation. there is a need to promote the local and rural development and to social upliftment of communities affected by mining the state should endeavour to bring about equitable access to South Africa’s minerals and petroleum resources, particularly for
historically disadvantaged persons. the nations mineral and petroleum resources should be developed in an orderly and ecologically sustainable manner. Holders of mining and petroleum rights should contribute towards the socio‐economic development of the areas in which they
are operating. security of tenure should be provided in respect of prospecting, exploration, and mining and production operation. The Municipality has no jurisdiction over the administration and granting of mineral rights but does have the right to be consulted on each application that will affect it. The municipality is also obliged to facilitate economic and mining development processes by building networks and promoting good working relationships in the sector, such private company, parastatal, development organizations and public infrastructure agencies.Lephalale has the potential to be the national pioneer in the Green Economy.
121
The advantages of the municipal area are:
Perfect geographic situation to develop renewable energy industry and economies of scale; Invaluable mineral resource base for local beneficiation; Unexploited biodiversity resources for green tourism and payment for ecosystem services; Vibrant young population to enthusiastically engage in new, innovative and developmental economic activities.
The Green Economy in Lephalale benefits for the economy and the environment. The goals of the Lephalale Green Economy plan are: Short Term: Generate Jobs Improve Environmental Quality Medium Term: Create Enabling Conditions for Green Growth Change Behavioral and Production Patterns Long‐Term: Build a New Economic/Environmental Paradigm for Lephalale
The above will be implemented through specified initiatives in the following key focus areas:
Sustainable Production and Consumption Water Management Sustainable Waste Management Practices Clean Energy and Energy Efficiency Resource Conservation and Management Agriculture, Food Production and Forestry Green buildings and the built environment Sustainable Transport and Infrastructure Cross‐cutting economic initiatives
122
The Green Economy is: Environmentally sustainable, based on the belief that our biosphere is a closed system with finite resources and a limited
capacity for self‐regulation and self‐renewal. We depend on the earth’s natural resources, and therefore we must create an economic system that respects the integrity of ecosystems and ensures the resilience of life supporting systems. A ecological economy: Globally humankind has been exploring ecosystem services for the last 10 000 years. Ecosystem services are all benefits people derive from nature: Provisioning – food, timber, water; Regulating – climate, disease, nutrient cycles regulation, Supporting – soil formation, Cultural – aesthetic and educational, places of worship, etc. Because of the elasticity and flexibility of natural systems, we still enjoy the plethora of benefits ecosystem services provide. However, since the beginning of the industrial revolution, we have significantly changed many variables in the Earth System. Through agriculture and urbanization, we are introducing new land use, which competes with the natural habitat of plants and animals, leading to their extinction, which is now measured at a rate 1 000 times higher than its natural background. A low carbon economy: the carbon level of economic activities in SA is disturbingly high. We are the 13th biggest emitter of CO² in the world. Continuing to operate in the current energy from coal production paradigm will compromise our position as an international player and challenge our energy security. A circular economy: an economy in which the waste from one production / consumption process is circulated as a new input into the same or a different process. Currently, the waste from all aspects of human activities creates pollution, as we release new chemical products and substances in the soil, rivers, oceans, air thus threatening to destroy the living web on which our live depends.
Socially just, founded on the conviction that culture and human dignity are precious resources that, like our natural resources, require responsible stewardship to avoid their depletion. We must create a vibrant economic system that ensures all people have access to a decent standard of living and full opportunities for personal and social development. The indigenous ways of life, culture preservation and transfer, knowledge dissemination, land, water and resource use, food production, settlement maintenance, etc are a rich source to explore and respect.

123
Locally rooted, based on the belief that an authentic connection to place is the essential pre‐condition to sustainability and justice. The Green Economy is a global aggregate of individual communities meeting the needs of its citizens through the responsible, local production and exchange of goods and services.
The Green Economy is local production and consumption, efficient use of energy and water and care of natural and created resources. It is a new way of thinking, planning and living. It provides socially and environmentally just solutions to economic exclusion and resource degradation.
6.10 Tourism. The importance of tourism industry to the economy of the area is likely to continue to grow into the future. This is likely to be related to the hunting and ecotourism industries, but could also be linked to any expansion of the industrial operations and the related business tourism. The existing importance of the business tourism sector, and its strong links to the mine and power station are also viewed as important. The challenge faced by the tourism industry in the area is to increase leisure/ecotourism visitors in the summer seasons. This would relate to ecotourism rather than hunting. There is the opportunity to increase tourism in the area through tours to the power station (s) and/or mine. The location of the Lephalale Municipality provides unique opportunities for economic development and tourism in particular. The area is renowned for hunting, wildlife and scenic beauty and nature reserves, sports and adventure. Five routes have been developed in the municipal area and include the following: The Mokolo route R510 Marula route D1675 Limpopo route R572 Waterberg route; and R33 Heritage route. D3110 The Waterberg Savannah Biosphere, a UNESCO declared Biosphere covers the large portion of the Waterberg District Municipality namely, Lephalale, Mokgalakwena, Thabazimbi and Modimolle Municipalities. The biggest part of the Waterberg Biosphere is located within the Lephalale Municipality and the entire biosphere measures 15 000 square meters. The central vision of the Waterberg Biosphere reserve is to maximise the area's potential for conservation, sustainable development and social upliftment.

124
The Waterberg plateau has an overall character that despite the development of numerous lodges and disturbances such as landing strips still maintains a wilderness character. Similarly the wide open bushveld plains of the Limpopo Peneplain represent a special South African bushveld character. This area of pristine bushveld and small sleepy towns makes for a special character not found elsewhere in South Africa. This character is one of key selling points that the tourism sector employs in their marketing strategy. The valleys from which the escarpment can be viewed as well as the escarpment itself should be protected in some way to ensure that no development takes place there that could affect the character or sense of the place in a negative fashion. The maintenance of these landscape features is as important from a conservation perspective as sensitive biological features that should be maintained to ensure the long term ability of the landscape to attract tourists to the area. B & B and Accommodation facilities. Holiday resorts Game/Nature reserve Guest farms Guest houses Hotels Camping Fishing Total number of beds6 45 63 218 3 5 7 4254
Source: Lephalale Municipality
Tourism and especially eco‐tourism has shown considerable growth in the recent years. It is a good example of sustainable use of opportunities and resources, and offers the benefit of a range of employment options for local people. A negative factor in the Lephalale economy is the lack of economic activity in the rural village area. This is where the majority of the current population lives. The very high rate of unemployment implies that opportunities for the establishment of small industries or businesses which are labour intensive should be pursued in order to make use of the potential workforce.
6.11 Socio ‐ Economic Transformation
Lephalale Municipality’s plans are to promote growth and development, and also to eradicate the triple scourge of unemployment, poverty and inequality. Impact will be on the following:
1. Economic transformation and democratic consolidation , and 2. To improve the quality of life for all.
125
In implementation process on Economic Transformation, focus will be more on disadvantaged groups, i.e Women, Youth and People living with disabilities.
The following Pillars will guide the implementation:
1. Creating decent jobs. 2. Accelerating economic growth through:
Manufacturing SMME and cooperatives development and support Skills development Improving the industrial and Economic impact of public expenditure.
3. Developing rural development strategy.
This strategy will cover issues of land development – job creation, poverty alleviation and inequality particularly in rural areas.
4. Provide support to cooperatives and micro‐enterprises.
More emphasis will be on youth through: Public employment programmes Internships Job placement Youth entrepreneurship programmes
5. Supporting and creating EPWP Programmes.
6. Intervention in social wages (Labour standard wage to match standard of living). 7. Investing in skills and education. 8. Benefiting the community through natural resources within the municipal area.Local communities benefit through employment, procurement and other opportunities. 9. Benchmarking and partner with neighboring Provinces for good practices. Targeted mining industrial towns: e.g Mpumalanga,North West etc. This will assist the municipality to get more investors for development.

126
10. Building capacity within the Municipality and implement programmes of Economic transformation in order to boost economic growth, working together with businesses, Labour Forums and all stakeholders.
Economic Growth Projects: Institution MAYORAL INITIATIATIVE PROGRAMMES
Exxaro contractors site Exxaro housing project 1. Learnership programmes Electrification of various villages 2. Mayoral BursariesCRUunits 3. EPWP Programmes Sefihlogo‐letlora road project 4. Security Training ProgrammeKiti‐mokuruanyane road project 5. Driver’s License Mokuruanyane access road 6. Artisan skills programme Maletswai access road 7. Community Working Programme Lerupurupung access road 8. Skills Development Programmes (different sectors) Thabo mbeki water scheme Thabo mbeki sewer Tshelammake water Sewer plant paarl Matimba shut down Medupi project from sept.2017 Altoostyd Captain thulare informal settlement fencing Transnet Refurbishment of ac pipes – phase 2 Refurbishment of ac pipes – phase 3 Refurbishment of shongoane sports comlex

127
Developmental opportunities identified to address challenges on socio economic transformation:
1. Horticulture— there are wide range of vegetables that are produced within the jurisdiction of the municipality. Most production occurs within larger commercial farms but small farmers also contribute to the production too.
Recommended Strategic Approach / Initiative (S) towards Horticulture Development.
Promoting dialogue and building a relationship of trust between farmers and the municipality(This will restore confidence and improve competitions of the local horticulture industry)
Establishment of an agricultural logistics hub and fresh produce Market. Additional skills development programmes within the context of the national skills development strategy, in conjuction with the
Department of labour and AgriSeta. Effective marketing will stimulate expansion in the current production of vegetables and consequently in employment and skills
development. Establishment of farmer organization with an aim to facilitate the development of a co‐operative which will assist local farmers to access
the market.
2. Meat production ‐ according to the Lephalale IDP the municipality has competitive advantage in beef production; 36,000 cattles are owned by commercial farmers and 16,000 head of cattle by communal farmers.
Recommended Strategic Approach/Initiative(s) towards Meat Industry.
Develop veldt management plan to enhance the carrying capacity of the land for livestock development. A livestock support programme for emerging farmers. Clustering opportunities in terms of feed production, feed lotting schemes and meat processing. Seizing opportunities offered by game farming.(to expand the agricultural sector and also to strengthen tourism ).

128
3. Mining and Energy — the economic value of production in Lephalale Municipality is driven by coal mining and this structure of the local economy is likely to become even more concentrated after the envisaged coal mine expansions.
Focus will be on the following:
mine development, coal beneficiation and mine procurement
Recommended Intervention (S)
Facilitate mining development process and maximize the impact on local economic development by:
partnership with the Departments, private institutions and TVET College to align their curriculum with the new upcoming development skills within the local area.
Improve the competence of local business people to win mining procurement contracts. Support the development of bulk infrastructure to attract investors into the municipality. Partner with schools for Career exhibitions.
6.12 Local Economic Development challenges. High rate of unemployment Large volume of unskilled community members, especially youth. Less interest in educational programmes Less interest in Agricultural initiatives by the youth within municipal area Failure to effectively implement and monitor progress of LED strategies LED institutional capacity is low and undeveloped Lack of capacity for business planning to link Municipal and sector department/IDP infrastructure and service delivery into LED
strategy and sustainable implementation for growth and development Economic down turn Mushrooming of illegal hawkers stall

129
CHAPTER 7
7 .FINANCIAL MANAGEMENT AND VIABILITY. Financial Management and Viability of a Municipality is core to the development of communities in a sustainable manner by providing municipal service. The Municipality has however embarked on a process of addressing all the gaps identified by the auditor general. The identification of Lephalale Municipality by Limpopo Employment Growth and Development plan as a petrochemical cluster prompted an endeavour for a coordinated long term plan which resulted into a 20 year financial model with the assistance of Coghsta. The Waterberg coal fields which boast more than 40% of the total coal reserve of South Africa is located in Lephalale, and this has positioned the Municipality to attain the status of national development node. There is uncertainty about some of the major projects which were announced by other investors in 2006; however the Municipality has drawn a financial model based on anticipated development scenario until 2030. It is speculated that by then Lephalale will be the second biggest town in Limpopo and ultimately attain the status of a city ten years later. The Municipality currently has limited financial resource capacity. The sources of income vary from the income generated through the sale of municipal services i.e. water, electricity, sewerage, refuse removal, bulk contribution, vehicle licenses and tax levies, through to intergovernmental grants (IGG) and external loans. The narrow tax base of the Municipality is a constraint on municipal income. There is however a need to develop a revenue generation strategy and to focus more on the viability part of this KPA as engendered in the national key performance indicators. Currently 46% of the total budget is made up of government grants. The major contributing factor to lack of revenue is that only ±20% of the total household is paying for rates and services. This seriously hampers our service delivery effort as we have the capacity but no funds to implement. The broad financial challenges are sources of revenue and effective implementation of IDP and SDBIP.

130
BUDGET SUMMARY
LIM362 Lephalale - Table A9 Asset Management
Description Ref 2015/16 2016/17 2017/18 Current Year 2018/19 2019/20 Medium Term Revenue & Expenditure Framework
R thousand Audited Outcome
Audited Outcome
Audited Outcome
Original Budget
Adjusted Budget
Full Year Forecast
Budget Year 2019/20
Budget Year +1 2020/21
Budget Year +2 2021/22
CAPITAL EXPENDITURE Total New Assets 1 83,874 97,111 – 56,523 103,839 103,839 107,667 81,175 94,330
Roads Infrastructure 38,042 31,707 – 27,902 29,022 29,022 2,000 45,975 49,330 Storm water Infrastructure – – – – – – – – – Electrical Infrastructure 1,264 8,816 – 10,013 12,198 12,198 – – – Water Supply Infrastructure 39,711 37,284 – 5,616 52,361 52,361 60,101 35,200 45,000 Sanitation Infrastructure – 7,066 – 9,242 1,911 1,911 32,159 – – Solid Waste Infrastructure – – – – – – – – – Rail Infrastructure – – – – – – – – – Coastal Infrastructure – – – – – – – – – Information and Communication Infrastructure – 6,116 – – – – – – –
Infrastructure 79,017 90,989 – 52,773 95,492 95,492 94,260 81,175 94,330 Community Facilities – – – – – – – – – Sport and Recreation Facilities – – – – – – – – –
Community Assets – – – – – – – – – Heritage Assets – – – – – – – – –
Revenue Generating – – – – – – – – – Non-revenue Generating – – – – – – – – –
Investment properties – – – – – – – – – Operational Buildings 4,857 6,122 – 3,750 8,347 8,347 13,407 – – Housing – – – – – – – – –
Other Assets 4,857 6,122 – 3,750 8,347 8,347 13,407 – – Biological or Cultivated Assets – – – – – – – – –
Servitudes – – – – – – – – – Licences and Rights – – – – – – – – –
Intangible Assets – – – – – – – – – Computer Equipment – – – – – – – – – Furniture and Office Equipment – – – – – – – – – Machinery and Equipment – – – – – – – – – Transport Assets – – – – – – – – – Land – – – – – – – – – Zoo's, Marine and Non-biological Animals – – – – – – – – –

131
Total Renewal of Existing Assets 2 – – – – – – – – –
Roads Infrastructure – – – – – – – – – Storm water Infrastructure – – – – – – – – – Electrical Infrastructure – – – – – – – – – Water Supply Infrastructure – – – – – – – – – Sanitation Infrastructure – – – – – – – – – Solid Waste Infrastructure – – – – – – – – – Rail Infrastructure – – – – – – – – – Coastal Infrastructure – – – – – – – – – Information and Communication Infrastructure – – – – – – – – –
Infrastructure – – – – – – – – – Community Facilities – – – – – – – – – Sport and Recreation Facilities – – – – – – – – –
Community Assets – – – – – – – – – Heritage Assets – – – – – – – – –
Revenue Generating – – – – – – – – – Non-revenue Generating – – – – – – – – –
Investment properties – – – – – – – – – Operational Buildings – – – – – – – – – Housing – – – – – – – – –
Other Assets – – – – – – – – – Biological or Cultivated Assets – – – – – – – – –
Servitudes – – – – – – – – – Licences and Rights – – – – – – – – –
Intangible Assets – – – – – – – – – Computer Equipment – – – – – – – – – Furniture and Office Equipment – – – – – – – – – Machinery and Equipment – – – – – – – – – Transport Assets – – – – – – – – – Land – – – – – – – – – Zoo's, Marine and Non-biological Animals – – – – – – – – –
Total Upgrading of Existing Assets 6 – – – – – – – – –
Roads Infrastructure – – – – – – – – – Storm water Infrastructure – – – – – – – – – Electrical Infrastructure – – – – – – – – – Water Supply Infrastructure – – – – – – – – – Sanitation Infrastructure – – – – – – – – – Solid Waste Infrastructure – – – – – – – – – Rail Infrastructure – – – – – – – – –
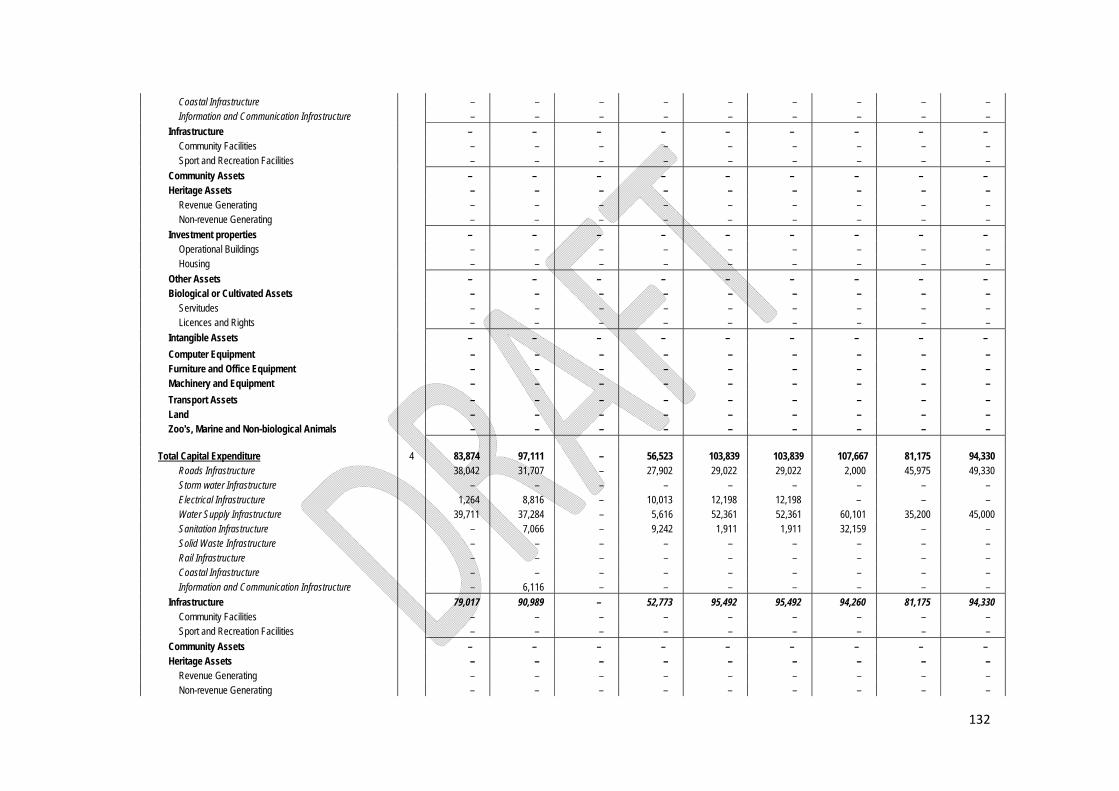
132
Coastal Infrastructure – – – – – – – – – Information and Communication Infrastructure – – – – – – – – –
Infrastructure – – – – – – – – – Community Facilities – – – – – – – – – Sport and Recreation Facilities – – – – – – – – –
Community Assets – – – – – – – – – Heritage Assets – – – – – – – – –
Revenue Generating – – – – – – – – – Non-revenue Generating – – – – – – – – –
Investment properties – – – – – – – – – Operational Buildings – – – – – – – – – Housing – – – – – – – – –
Other Assets – – – – – – – – – Biological or Cultivated Assets – – – – – – – – –
Servitudes – – – – – – – – – Licences and Rights – – – – – – – – –
Intangible Assets – – – – – – – – – Computer Equipment – – – – – – – – – Furniture and Office Equipment – – – – – – – – – Machinery and Equipment – – – – – – – – – Transport Assets – – – – – – – – – Land – – – – – – – – – Zoo's, Marine and Non-biological Animals – – – – – – – – –
Total Capital Expenditure 4 83,874 97,111 – 56,523 103,839 103,839 107,667 81,175 94,330
Roads Infrastructure 38,042 31,707 – 27,902 29,022 29,022 2,000 45,975 49,330 Storm water Infrastructure – – – – – – – – – Electrical Infrastructure 1,264 8,816 – 10,013 12,198 12,198 – – – Water Supply Infrastructure 39,711 37,284 – 5,616 52,361 52,361 60,101 35,200 45,000 Sanitation Infrastructure – 7,066 – 9,242 1,911 1,911 32,159 – – Solid Waste Infrastructure – – – – – – – – – Rail Infrastructure – – – – – – – – – Coastal Infrastructure – – – – – – – – – Information and Communication Infrastructure – 6,116 – – – – – – –
Infrastructure 79,017 90,989 – 52,773 95,492 95,492 94,260 81,175 94,330 Community Facilities – – – – – – – – – Sport and Recreation Facilities – – – – – – – – –
Community Assets – – – – – – – – – Heritage Assets – – – – – – – – –
Revenue Generating – – – – – – – – – Non-revenue Generating – – – – – – – – –

133
Investment properties – – – – – – – – – Operational Buildings 4,857 6,122 – 3,750 8,347 8,347 13,407 – – Housing – – – – – – – – –
Other Assets 4,857 6,122 – 3,750 8,347 8,347 13,407 – – Biological or Cultivated Assets – – – – – – – – –
Servitudes – – – – – – – – – Licences and Rights – – – – – – – – –
Intangible Assets – – – – – – – – – Computer Equipment – – – – – – – – – Furniture and Office Equipment – – – – – – – – – Machinery and Equipment – – – – – – – – – Transport Assets – – – – – – – – – Land – – – – – – – – – Zoo's, Marine and Non-biological Animals – – – – – – – – –
TOTAL CAPITAL EXPENDITURE - Asset class 83,874 97,111 – 56,523 103,839 103,839 107,667 81,175 94,330
ASSET REGISTER SUMMARY - PPE (WDV) 5 930,891 1,467,408 1,490,917 1,543,690 1,490,917 1,490,917 1,490,917 1,490,917 1,490,917 Roads Infrastructure 374,285 31,707 360,414 27,902 Storm water Infrastructure Electrical Infrastructure 24,265 8,816 100,678 10,013 Water Supply Infrastructure 111,393 37,284 531,184 5,616 Sanitation Infrastructure 327,806 7,066 116,716 9,242 Solid Waste Infrastructure 44,760 1,382,535 Rail Infrastructure Coastal Infrastructure Information and Communication Infrastructure
Infrastructure 882,509 1,467,408 1,108,992 52,773 – – – – –
Community Assets 48,305 96,900 Heritage Assets 77 77
Investment properties
Other Assets 207,180 1,490,917 1,490,917 1,490,917 1,490,917 1,490,917 1,490,917 Biological or Cultivated Assets
Intangible Assets Computer Equipment 858
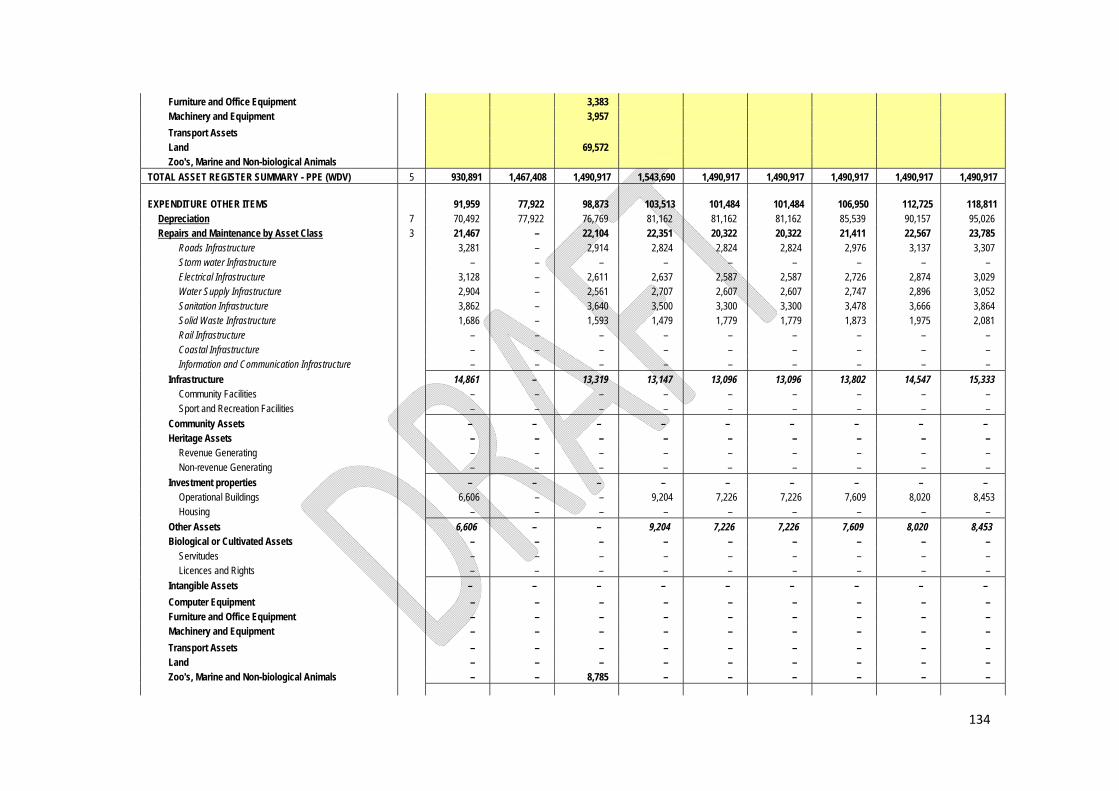
134
Furniture and Office Equipment 3,383 Machinery and Equipment 3,957 Transport Assets Land 69,572 Zoo's, Marine and Non-biological Animals
TOTAL ASSET REGISTER SUMMARY - PPE (WDV) 5 930,891 1,467,408 1,490,917 1,543,690 1,490,917 1,490,917 1,490,917 1,490,917 1,490,917
EXPENDITURE OTHER ITEMS 91,959 77,922 98,873 103,513 101,484 101,484 106,950 112,725 118,811 Depreciation 7 70,492 77,922 76,769 81,162 81,162 81,162 85,539 90,157 95,026 Repairs and Maintenance by Asset Class 3 21,467 – 22,104 22,351 20,322 20,322 21,411 22,567 23,785
Roads Infrastructure 3,281 – 2,914 2,824 2,824 2,824 2,976 3,137 3,307 Storm water Infrastructure – – – – – – – – – Electrical Infrastructure 3,128 – 2,611 2,637 2,587 2,587 2,726 2,874 3,029 Water Supply Infrastructure 2,904 – 2,561 2,707 2,607 2,607 2,747 2,896 3,052 Sanitation Infrastructure 3,862 – 3,640 3,500 3,300 3,300 3,478 3,666 3,864 Solid Waste Infrastructure 1,686 – 1,593 1,479 1,779 1,779 1,873 1,975 2,081 Rail Infrastructure – – – – – – – – – Coastal Infrastructure – – – – – – – – – Information and Communication Infrastructure – – – – – – – – –
Infrastructure 14,861 – 13,319 13,147 13,096 13,096 13,802 14,547 15,333 Community Facilities – – – – – – – – – Sport and Recreation Facilities – – – – – – – – –
Community Assets – – – – – – – – – Heritage Assets – – – – – – – – –
Revenue Generating – – – – – – – – – Non-revenue Generating – – – – – – – – –
Investment properties – – – – – – – – – Operational Buildings 6,606 – – 9,204 7,226 7,226 7,609 8,020 8,453 Housing – – – – – – – – –
Other Assets 6,606 – – 9,204 7,226 7,226 7,609 8,020 8,453 Biological or Cultivated Assets – – – – – – – – –
Servitudes – – – – – – – – – Licences and Rights – – – – – – – – –
Intangible Assets – – – – – – – – – Computer Equipment – – – – – – – – – Furniture and Office Equipment – – – – – – – – – Machinery and Equipment – – – – – – – – – Transport Assets – – – – – – – – – Land – – – – – – – – – Zoo's, Marine and Non-biological Animals – – 8,785 – – – – – –
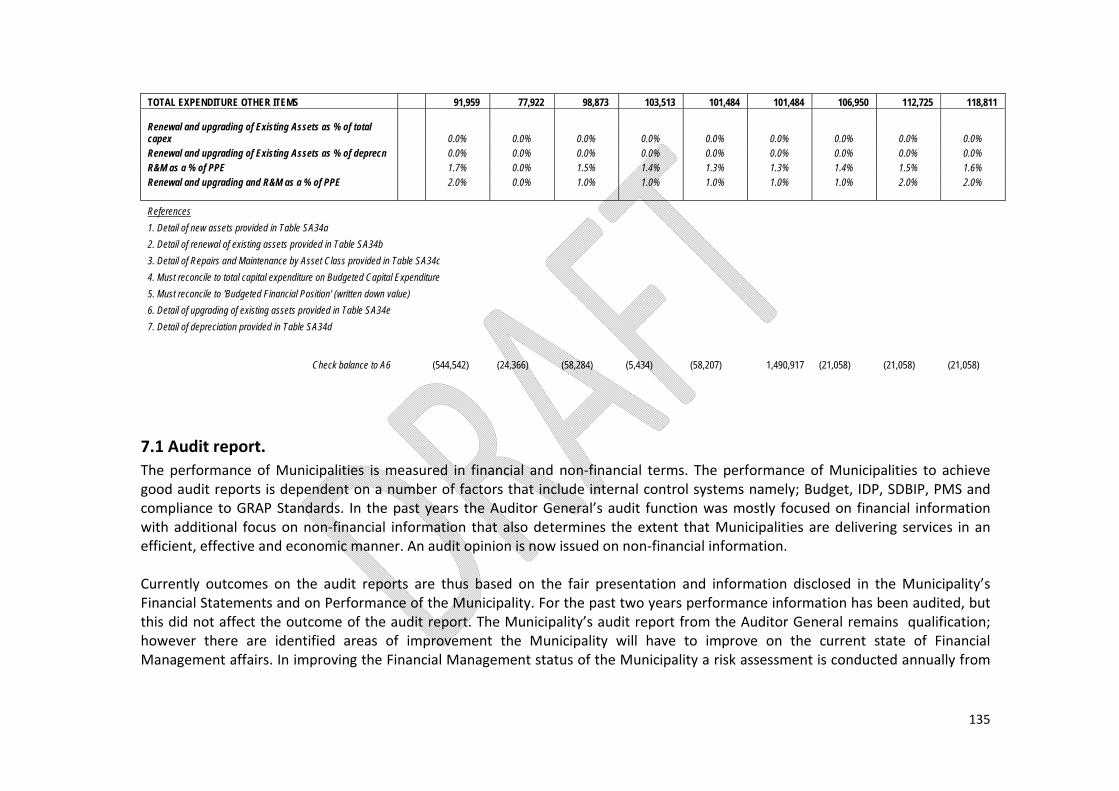
135
TOTAL EXPENDITURE OTHER ITEMS 91,959 77,922 98,873 103,513 101,484 101,484 106,950 112,725 118,811 Renewal and upgrading of Existing Assets as % of total capex 0.0% 0.0% 0.0% 0.0% 0.0% 0.0% 0.0% 0.0% 0.0% Renewal and upgrading of Existing Assets as % of deprecn 0.0% 0.0% 0.0% 0.0% 0.0% 0.0% 0.0% 0.0% 0.0% R&M as a % of PPE 1.7% 0.0% 1.5% 1.4% 1.3% 1.3% 1.4% 1.5% 1.6% Renewal and upgrading and R&M as a % of PPE 2.0% 0.0% 1.0% 1.0% 1.0% 1.0% 1.0% 2.0% 2.0% References 1. Detail of new assets provided in Table SA34a 2. Detail of renewal of existing assets provided in Table SA34b 3. Detail of Repairs and Maintenance by Asset Class provided in Table SA34c 4. Must reconcile to total capital expenditure on Budgeted Capital Expenditure 5. Must reconcile to 'Budgeted Financial Position' (written down value) 6. Detail of upgrading of existing assets provided in Table SA34e 7. Detail of depreciation provided in Table SA34d
Check balance to A6 (544,542)
(24,366)
(58,284)
(5,434)
(58,207) 1,490,917
(21,058)
(21,058)
(21,058)
7.1 Audit report. The performance of Municipalities is measured in financial and non‐financial terms. The performance of Municipalities to achieve good audit reports is dependent on a number of factors that include internal control systems namely; Budget, IDP, SDBIP, PMS and compliance to GRAP Standards. In the past years the Auditor General’s audit function was mostly focused on financial information with additional focus on non‐financial information that also determines the extent that Municipalities are delivering services in an efficient, effective and economic manner. An audit opinion is now issued on non‐financial information. Currently outcomes on the audit reports are thus based on the fair presentation and information disclosed in the Municipality’s Financial Statements and on Performance of the Municipality. For the past two years performance information has been audited, but this did not affect the outcome of the audit report. The Municipality’s audit report from the Auditor General remains qualification; however there are identified areas of improvement the Municipality will have to improve on the current state of Financial Management affairs. In improving the Financial Management status of the Municipality a risk assessment is conducted annually from

136
which a Risk register is compiled and reviewed on a regular basis. The Municipality developed a business continuity management system as required by Legislation in terms of the ICT Framework. Table8. Audit reports. Year 2015/16 2016/17 2017/18 2019/20Audit report Unqualified Unqualified Qualified Qualified
Lephalale Municipality
A number of Financial Policies which are relevant to the Powers and Functions of the Municipality were developed and implemented. This policies are supply chain management, debt collection and credit control policy, fixed assets policy and banking and investment policy, property rates policy and virement policy indigent policy, cash management and investment policy, subsistence and travel policy and asset management policy.
Banking and Investment Policy. The Municipality has a banking and investment policy adopted by Council and it is reviewed regularly. The objective of the policy is to ensure that the Municipality’s cash resources are managed effectively and efficiently. Council therefore has the responsibility to invest these public revenues knowledgeably and judiciously, and must be able to account fully to the community in regard to such investments. The intention of the policy is aimed at gaining the optimal return on investments, without incurring undue risks during those periods when cash revenues are not needed for capital or operational purposes.
Debt collection policy. The Municipality has a debt collection policy adopted by council. The debt collection policy determines that municipal accounts be paid on due date as indicated on the account and non‐payment of accounts will result in debt collection. The council in its application of the policy, reserves the right to differentiate between different categories of consumers, debtors, services or service standards. The council will on application of the credit control policy avoid discrimination as forbidden by the constitution unless it is established that discrimination is fair as allowed by the constitution.
Fixed asset policy. The Municipality has a fixed asset policy which was adopted by council. A fixed asset is defined in GAMAP 17 as a tangible item of property, plant or equipment held by a municipality for use in the productions or supply of goods or services, for rental to others, or for administrative purposes, and which is expected to be used during more than one reporting period (financial year)

137
A fixed asset is thus an asset, either movable or immovable, owned by or under the control of the Municipality, and from which the Municipality reasonably expects to derive economic benefits, or reasonably expects to use in service delivery, over a period extending beyond one financial year. In compliance with the requirements of the National Treasury, the chief financial officer shall ensure that all fixed assets are classified under the specific headings in the fixed assets register, and heads of departments shall in writing provide the chief financial officer with such information or assistance as is required to compile a proper classification:
Indigent Policy. The primary intention of the policy is to ensure that no one is completely denied access to basic services for reasons of inability to pay for such a service. Underlying this policy is the recognition that the supply of ‘basic’ services assists in alleviating poverty and improves level of the communities within the area. Free basic services will be implemented progressively in accordance with the ability of council to render any of the specific services in various areas within its jurisdiction, in accordance with the levels of services which are appropriate and affordable. Section 74.2(c) of Municipal Systems Act, 32 of 2000 states that poor households must have access to at least basic services through: Tariffs that cover only operating and maintenance costs; Special tariffs or life line tariffs for low levels of use or consumption of services or for basic levels of services; and Any other direct or indirect method of subsidization of tariffs for poor household. Section 97 (c) of the Municipal Systems Act, 2000 states that a Municipality must make provision for indigent debtors that is consistent with its rates and tariff policies and any national policy on indigents. The Municipality adopted its indigent policy in 2001 and it is reviewed as and when it is necessary for council to do so. Fraud Policy and Fraud Prevention Plan. The plan is premised on the institution’s core ethical values driving the business of the Municipality, the development of its systems, policies and procedures, interaction with ratepayers, the public and other stakeholders, and decision‐making by individual managers representing the institution. This means that in practice directorates, departments and other business units of the Municipality and even external stakeholders must be guided by the plan as the point of reference for their conduct in relation to the Municipality. In addition to promoting ethical conduct within the municipality, the plan is also intended to assist in preventing, detecting, investigating and sanctioning fraud and corruption.
138
The main issues addressed in the document are the review and update of the Fraud Prevention Plan, incorporating the Code of Conduct and Fraud Policy and incident Response Plan. The plan takes into account the risks of fraud and corruption as identified in business risk assessments initiated by the Municipality and the outcome of interviews held with senior management of the Municipality. The plan does not guarantee that the municipality will not be impacted by incidents of fraud and corruption but is intended to serve as an additional measure to assist in the limitation of fraud and corruption risk with a particular focus on creating awareness and promoting ethical business conduct. The Fraud Policy and Fraud Prevention Plan were adopted by council in March 2008 and were reviewed in 2015.
7.2 Audit Report Finding. Legislative requirement purpose of the Audit
The AG is required in terms MFMA (sec 126) to audit the AFS of the municipality and express an opinion on financial statements and to report on material findings relating to compliance with specific requirements in key applicable laws and regulations.
AG provides assurance to stakeholders regarding the use of public funds and assets in South Africa.
AG’s purpose is also to add value to the Municipality by making recommendations where necessary to assist in the improvement of the audit opinion.
2018/19 AUDIT OPINION
The report is a summary of the assessment on of the financial statements, reporting on predetermined objectives and compliance with laws and regulations for the year ended 30 June 2019
The Municipality has obtained QUALIFIED Audit Opinion. This opinion remained the same from last financial year.
Material findings that led to qualified opinion were valuation of the provision for landfill site and impairment of water reservoir.

139
Other material findings were raised on non compliance and Predetermined objectives
MATTERS OF EMPHASIS on AFS
Significant uncertainty :
With reference to note 42 to the financial statements, the municipality is the defendant in a number of lawsuits. The municipality is opposing the claims amounting to R63 492 441. The ultimate outcome of these matters cannot presently be determined.
Material impairments of debts
As disclosed in note10 and 11 to the financial statements, the municipality made material impairments for consumers debtors from non‐exchange transactions and exchange transactions of R28 198 278 and R57 480 817, respectively due to inadequate collection practices.
Restatement of corresponding figures
As disclosed in note 44 to the financial statements, the corresponding figures for 30 June 2018 were restated as a result of an error in the financial statements of the municipality at, and for the year ended, 30 June 2019.
Irregular expenditure
As disclosed in note 48 to the financial statements, the municipality incurred irregular expenditure of R65 440 095 due to non compliance with applicable laws
Audit of Predetermined Objectives (AOPO)
Non‐Financial Performance Information was audited and KPA 1, KPA 2 and KPA 4 were selected for Audit The focus was on the Reliability and Usefulness of the reported information Opinion was expressed per KPA Municipality obtained qualified opinions for all selected.

140
KPA 4 was qualified on usefulness of reported information while KPA 2 and KPA 1 were qualified on reliability of reported information
MEASURES FOR IMPROVEMENT
Develop, implement and monitor Action Plan to address the issues raised Improve on implementing measures in addressing the Irregular and Unauthorised expenditures that occurs due to non‐
compliance with other regulations and poor planning Improve governance and oversight processes Improve on compliance with relevant regulations regulatory requirements Accurate reporting of information and accountability Improve on internal processes within the Municipality Improve on implementations of the Internal Audit Recommendations
Financial management challenges are as follows:
Under spending of conditional grants. The low capital expenditure on own funding projects, The Low liquidity ratio. Vacant Positions Low revenue collection Untraceable debtors
CHAPTER 8
8 INSTITUTIONAL DEVELOPMENT AND TRANSFORMATION. In the light of the actual and potential development challenges the Municipality reviews its organizational structure in order that the structure should reflect how the Municipality has organized its resources and competencies for the purpose of delivering on core responsibilities. The political structure consists of council and the executive committee. The administration consists of the office of the Municipal Manager and five departments: Corporate Service, Budget & Treasury, Development Planning, Infrastructure Services and Social Services.

141
DIAGRAM: 3 Organizational structures.
Current institutional capacity constraints within Lephalale Municipality will impede the achievement of development targets for Limpopo Coal and Petrochemical cluster. The most critical constraints in the context of the cluster are in technical services, both at managerial and operational levels. Specific areas of acute constrains are in water and sanitation.
8.1 Functions of Municipal departments. Lephalale Local Municipality has reviewed its organisational structure in the year 2019 to respond closely to its mandate, as well as how it has organised its resources and competencies, for the purpose of delivering on core responsibilities. Hence, the political structure consists of the Council and the Executive Committee. The following represents the department of the municipality during the development of the strategic planning document: Office of the Municipal Manager Strategic Support Services Directorate Budget and Treasury Directorate Community Services Directorate Corporate Services Directorate Infrastructural Services Directorate
Council
Municipal Manager
Corporate Service Budget & Treasury
Development Planning
Infrastructure Services Social Services Strategic
Management
142
Development Planning Directorate The section below provides detailed description of departmental functional analysis by outlining departments and their key functions as follows:
Office of the Municipal Manager. The Office of the Municipal Manager is responsible for: Ensuring the smooth running of the municipality. It provides guidance and advice on compliance with certain Acts for governing the Municipality to the political structures;
political office‐bearers and officials.
The Office of the Municipal Manager comprises of the following administrative units: Internal Audit. Risk Management.
Key Functions Management of Municipality's administration in accordance with Municipal legislation and other legislation applicable to local
government, including management, discipline and development of human capital; Formulation and development of an economical, effective, efficient and accountable administration that is equipped to carry out
the task of implementing the municipality Integrated Development Plan (IDP) and responsive to the needs of the local community;
Oversee management and monitoring of Municipal services provided to local community in a sustainable and equitable manner; Provide strategic direction to the development and review of credible Integrated Development Plans Provide the administration and implementation of the Municipality's by‐laws and other legislation, including the implementation
of National and Provincial directives, policies and legislation; Exercise powers delegated to the Municipal Manager by Municipal Council and other authorities of the Municipality; Render administrative and strategic support to the Executive Mayor and other political structures in Council; and Manage income and expenditure of the municipality to ensure sound financial management of Council resources.
143
Strategic Support Services Directorate
Strategic Support Services Directorate is responsible for: Strategic planning Provides support to the office of the municipal manager on strategic management issues.
Strategic Support Services Directorate comprises of the following administrative units: Special Programmes (Youth, elderly, disabled, gender and HIV/AIDS) Office of the Mayor Offices of the Speaker and Chief Whip Public Participation Performance Management. Integrated Development Planning. Internal and external communication.
Key Functions: Render administrative and strategic support to the Office of the Mayor, Speaker's Office and the Chief Whip. coordination of Youth, Elderly, Children, Disabled and Gender activities and programmes coordination of Public Participation and Intergovernmental Relations activities and programmes formulation and development of an economical, effective, efficient and accountable administration that is equipped to carry out
the task of implementing the municipality Integrated Development Plan (IDP) and responsible to the needs of the local community;
provide the management and monitoring of Municipal services provided to local community in a sustainable and equitable manner;
Provide strategic direction to the development and review of credible Integrated Development Plans
Budget and Treasury Directorate
Budget and Treasury Directorate is responsible for: Budget compilation and control, Debtor management (Credit Control, Debt collection),
144
Accounting Services (Cash flow management, Cost accounts), Treasury management (Loans, Investments) Inventory (Procurement & Provisioning).
Budget and Treasury Directorate comprises of the following administrative units: Budget and Reporting Expenditure Income Supply Chain Management Key Functions: To direct a value for money finance function that promotes effective financial management policies and practices in a
Municipality; To ensure adequate and effective systems for accounting records and control systems; To ensure effective and efficient financial reporting, as required by Municipal Finance Management Act; To ensure proper monitoring and implementation support systems are put in place to ensure that all duties are executed in
accordance with budget allocation and within legislative requirements; To maintain sufficient working capital by managing assets, investments, liabilities, borrowings and cash flow effectively; To identify and monitor processes and procedures for financial and regulatory risks
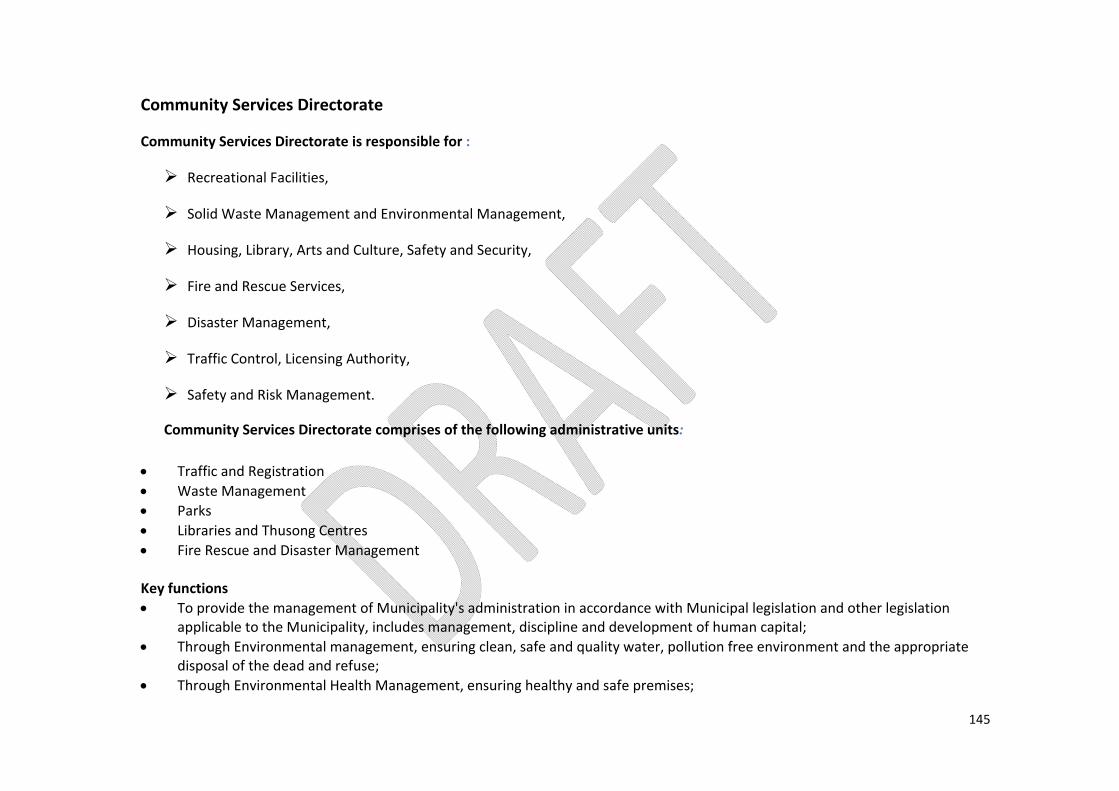
145
Community Services Directorate
Community Services Directorate is responsible for :
Recreational Facilities,
Solid Waste Management and Environmental Management,
Housing, Library, Arts and Culture, Safety and Security,
Fire and Rescue Services,
Disaster Management,
Traffic Control, Licensing Authority,
Safety and Risk Management.
Community Services Directorate comprises of the following administrative units: Traffic and Registration Waste Management Parks Libraries and Thusong Centres Fire Rescue and Disaster Management Key functions To provide the management of Municipality's administration in accordance with Municipal legislation and other legislation
applicable to the Municipality, includes management, discipline and development of human capital; Through Environmental management, ensuring clean, safe and quality water, pollution free environment and the appropriate
disposal of the dead and refuse; Through Environmental Health Management, ensuring healthy and safe premises;

146
To coordinate Health programmes ensuring healthy communities, productive workforce and economic growth; To manage the provision of fire and rescue services in saving lives, the prevention of fires, safeguarding of property, humans and
animals; To facilitate a crime free environment; To provide the promotion of Sports, Arts and Culture for purposes of wellness, preserved and diverse culture and a society with
high morals; and To provide the endorsement of literacy, economic growth, enrichment of minds, job security and safe schools.
Corporate Services Directorate Corporate Services Directorate is responsible for: Administrative Support, Legal and Secretariat Human Resources Management. It provides support services, provided based on specialised knowledge, best practices and technology to serve internal (and
sometimes external) customers and stakeholders. Corporate Services Directorate comprises of the following administrative units: Administration and Secretariats Human Resources Legal Services Key functions Provide general office services including telecommunication services, switchboard and receptions, office space provisioning,
office cleaning services; Provide administrative support to council and its committees through the implementation of the standing rules of order of
council; Records management and registry through the implementation of the records management policy and the central registry
manual and ensure adherence to the National Archives of South Africa Act; Provide personnel administration and organisational design services to the municipality through implementation of municipal
policies and collective agreements as well as adherence to the national labour legislation;

147
Ensure that the Skills Development and Equity Acts are implemented through the development and implementation of the workplace skills plan and the equity plan as well as facilitate training and development for staff and councillors;
Establish and maintain good employee relations; Develop and implement the strategies for employee health and safety as well as employee wellness; and Provide information and technology support to the municipality.
Infrastructural Services Directorate Infrastructural Services Directorate is responsible for: Water services, Electrical services, Sanitation services, Public Works, Roads and Storm water, Municipal Workshop.
Infrastructural Services Directorate comprises of the following administrative units: Water Sanitation PMU Electrical services and mobile asset maintenance Roads and Storm water Key functions To provide the management of the Technical services department's administration in accordance with Municipal legislation and
other legislation applicable to the municipality, including management, discipline and development of staff; To ensure the provision of cost effective management of department’s budget and the timely implementation of resolutions and
projects related to the department; To ensure the provision of Basic Water and Hygienic Sanitation systems; To ensure the construction of municipal roads for safe accessible roads; To ensure cost effective project management of infrastructure development; and To ensure compliance to national building regulations act.
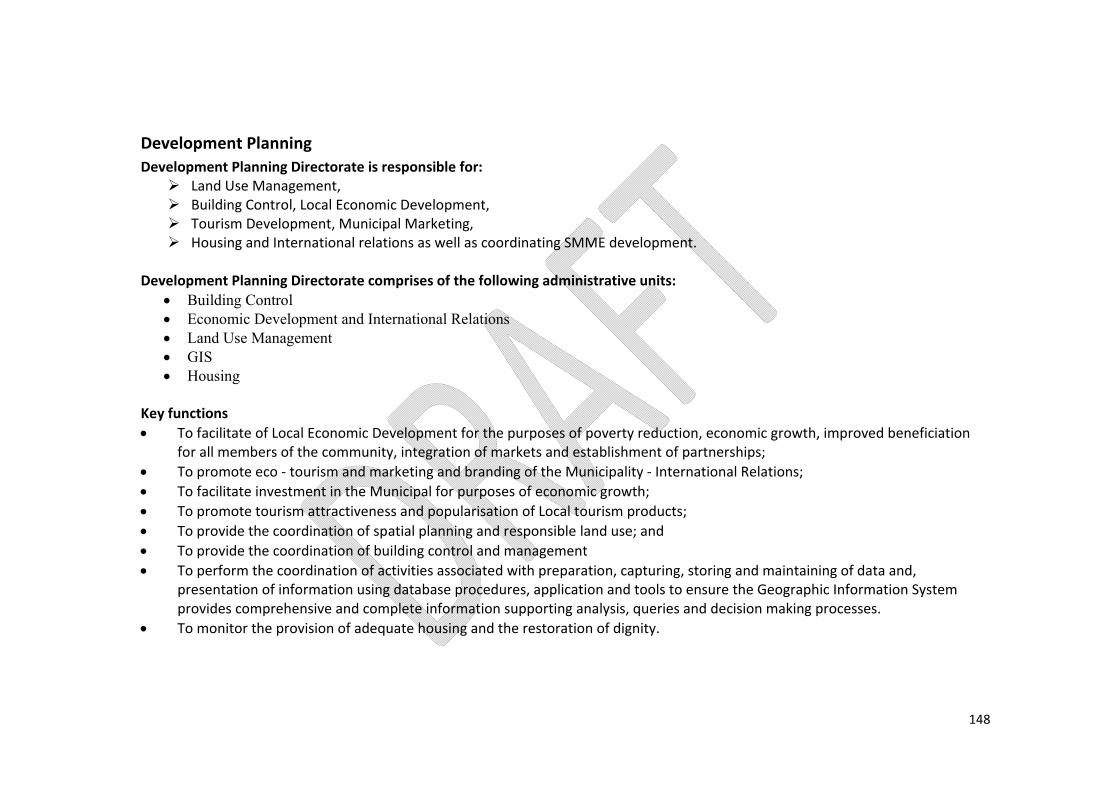
148
Development Planning Development Planning Directorate is responsible for: Land Use Management, Building Control, Local Economic Development, Tourism Development, Municipal Marketing, Housing and International relations as well as coordinating SMME development.
Development Planning Directorate comprises of the following administrative units:
Building Control Economic Development and International Relations Land Use Management GIS Housing
Key functions To facilitate of Local Economic Development for the purposes of poverty reduction, economic growth, improved beneficiation
for all members of the community, integration of markets and establishment of partnerships; To promote eco ‐ tourism and marketing and branding of the Municipality ‐ International Relations; To facilitate investment in the Municipal for purposes of economic growth; To promote tourism attractiveness and popularisation of Local tourism products; To provide the coordination of spatial planning and responsible land use; and To provide the coordination of building control and management To perform the coordination of activities associated with preparation, capturing, storing and maintaining of data and,
presentation of information using database procedures, application and tools to ensure the Geographic Information System provides comprehensive and complete information supporting analysis, queries and decision making processes.
To monitor the provision of adequate housing and the restoration of dignity.

149
Institutional Resources. Department Number of staff Occupied Vacant Total budgeted positions Support Infrastructure Services 172 27 199 Social Services 153 25 178 Corporate Support Services 41 7 48 Budget and Treasury 38 8 46 Development Planning 19 1 20 Strategic Support Services 17 8 25 Office of Municipal Manager 7 2 9 Total Positions 447 78 525
8.2 Employment Equity. The Municipality has employment equity plan which was adopted by council. The employment equity plan intends to achieve equity in the workplace, in order to make the Municipal workforce more representative and ensuring fair and equitable employment practices for employees. It further intends to create an organisational culture that is non‐discriminatory, values diversity and legitimizes the input of employees. The objective of the policy is to address under‐representation of designated groups in all occupational categories and levels in the workforce. It has not been easy to implement the employment equity plan for Lephalale Municipality. The institutional plan is reflected in the table below. Institutional profile. Occupational level Male Female Disabled Black White Black White Male Female Senior Management 1 2 Professionally qualified & experienced specialists and mid‐management (divisional head & professionals)
32 1 12
Skilled technical and academically qualified, junior management, supervisors, foremen and superintendent
29 2 18 2
Semi‐skilled and discretionary decision making 101 55 5Unskilled and defined decision making 125 60 Total Permanent 288 3 147 7

150
Temporary Employees Grand total
Source: Lephalale Municipality
8.3 Good Governance and Public Participation.
The delivery of services to the community relies on the institutional and organizational development level of the Municipality. Effective implementation of Powers and Functions of the Municipality relies highly on the functionality of Oversight Committees established to ensure accountability and transparency of Municipal processes. The Political Oversight role of Council is performed by Council functionaries that are established in terms of the Municipal Structures Act. Development planning in the Local Sphere of Government is conducted through the Integrated Development Planning instrument. Each Municipality in terms of the Municipal Systems Act (act 32 0f 2000) is responsible amongst other for formulating, adopting and implementing the Integrated Development Plan (IDP). The Mayor has to drive the IDP process and such to be adopted by the Municipal council. Community participation and involvement is central to IDP’s. Community/Ward based planning can be a useful way for making more structured inputs in the IDP process and for organising community needs together with wider strategic issues incorporating Provincial and National priorities and strategies. The IDP should reflect the best possible development decisions and trade‐offs that focus on viability of economic, social, environmental, financial and institutional stability. The Municipal Systems Act (act 32 of 2000) prescribes that municipalities should determine a vision for long‐term development, development objectives for the elected term of council and development strategies which are to be aligned with national and provincial sector plans and planning requirements. These legal requirements corresponds perfectly to the requirements of modern Municipal management, i.e. all role‐players in a Municipality need a joint vision as a common ground which provides guidance to everybody – the municipal governing bodies as well as the residents – and which gives direction beyond the council’s term of office. The council’s decisions have to be orientated by clearly defined and agreed objectives, which at the same time give orientation towards management, and form the basis for performance management and the accountability of the municipal government towards the residents. The activities of the executive bodies of the council need to be guided and streamlined by strategies which are the result of joint decision‐making process in which the executing agencies and all concerned parties are involved (IDP Guidelines 2001).
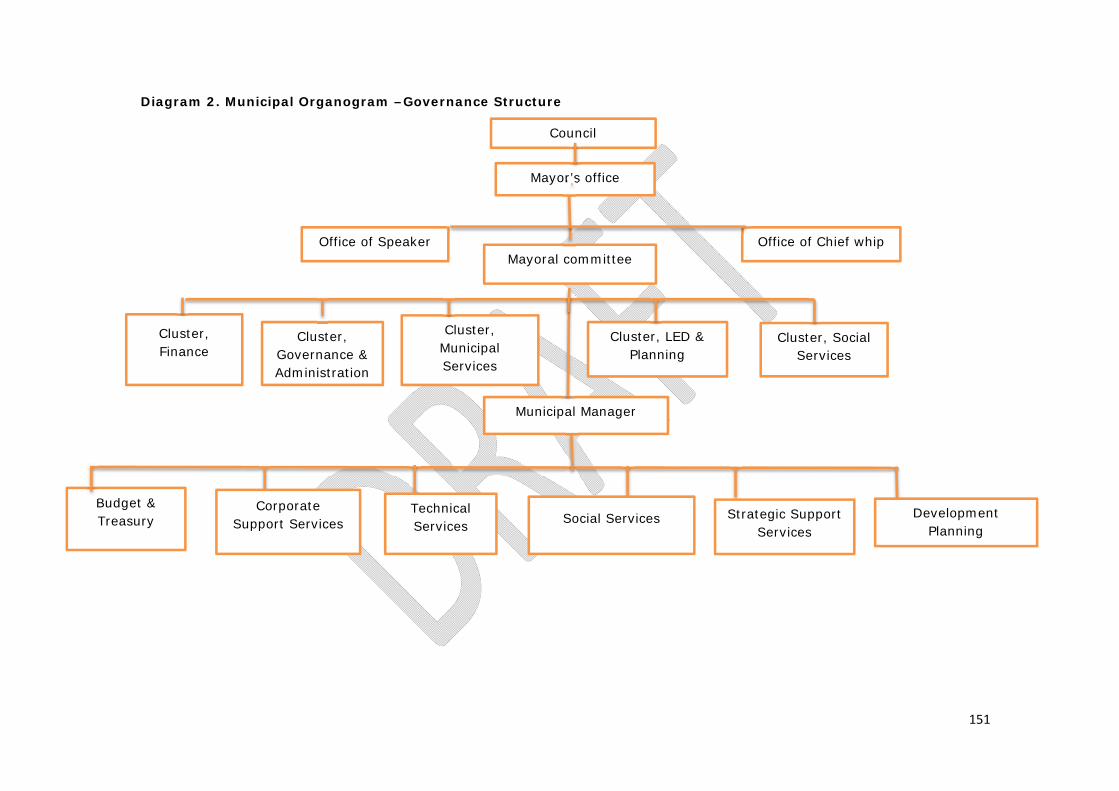
151
Diagram 2. Municipal Organogram –Governance Structure
Council
Mayor’s office
Office of Chief whip Office of Speaker Mayoral committee
Cluster, LED & Planning
Cluster, Social Services
Cluster, Municipal Services
Cluster, Governance & Administration
Cluster, Finance
Municipal Manager
Development Planning
Strategic Support Services
Social Services Technical Services
Corporate Support Services
Budget & Treasury

152
8.4 Portfolio committees
Most of the Portfolio Committees are functional as expected or in terms of requirements and this has improved the performance of cluster committees. The existing IGR structures experience challenges of executing the delegated mandate to ensure development and service delivery. Thirteen(13) ward committees have been established from thirteen wards (13). The Legislative mandate obliges the Municipality to execute its responsibility of deepening local democracy by involving communities in the development processes.
The challenges experienced by the Municipality include lack of accountability and common understanding of IGR structures, lack of integration, uncoordinated actions between the Province and Municipality and inadequate enforcement of and Performance Management Systems for IGR structures. Limitations of the community participation processes include inadequate inclusion of the special groups during the community participation process. Twelve community development workers are deployed in all the wards across the municipal area. The Municipality does not have powers and functions on a number basic services delivery needs which the communities require. These powers are competencies of other spheres of government, while planning for such services should be integrated into the municipal IDP. The successes of implementation of these functions entirely depend on the cooperation, commitment and involvement of provinces and national departments in service delivery needs. There are three (3) Traditional authorities in the Municipal area. Traditional authorities take part in the development of the IDP. Traditional authorities promote indigenous knowledge that can assist the Municipality with sustainable disaster management systems and perform customary law roles that are consistent with the constitution. The Traditional authorities assist in the mobilization of the community and allocation of land to residents in the development process. Participation of women, children, youth and people affected by HIV/AIDS is limited to the establishment of forums dealing with specific issues. 8.5 Oversight committee.
The Municipality established the Municipal Public Accounts Committee MPAC which assists with overlooking on the proper procedure of Council process. The Committee scrutinise section 46 and other reports with purpose of making recommendations to council. The Supply Chain Management procedure and other related matters are also scrutinised with the purpose of making recommendations to council on a regular basis.
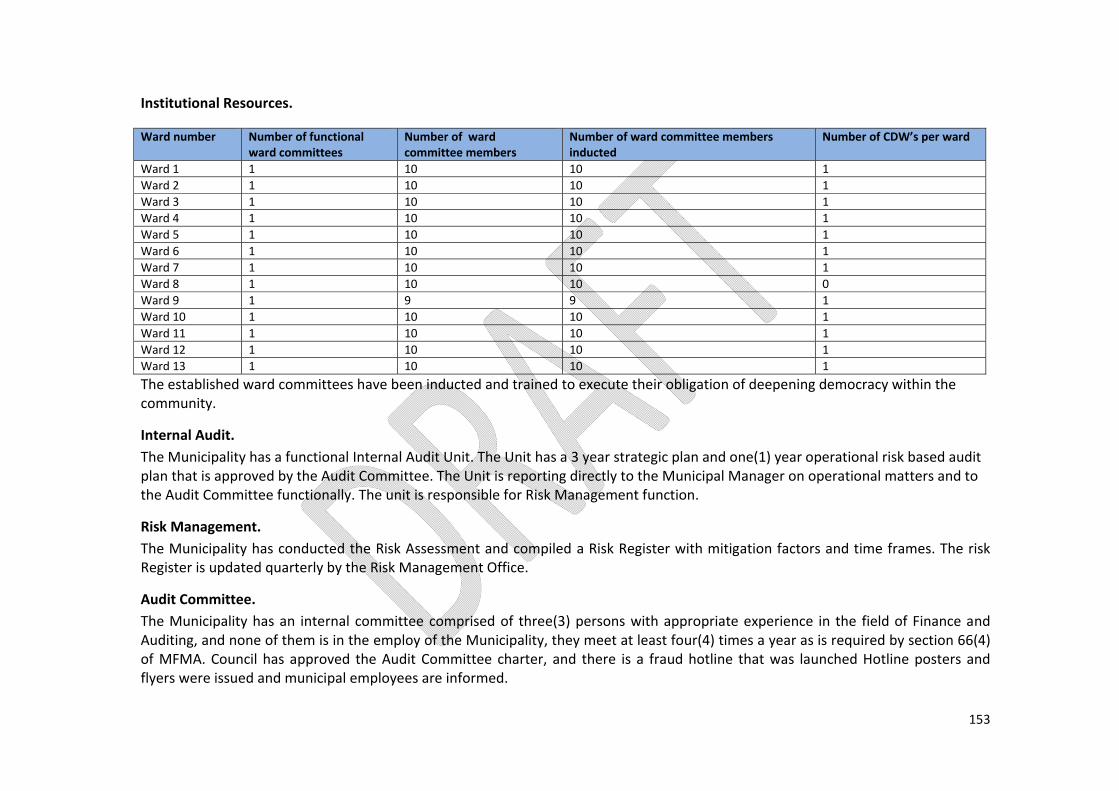
153
Institutional Resources.
Ward number Number of functional ward committees
Number of ward committee members
Number of ward committee members inducted
Number of CDW’s per ward
Ward 1 1 10 10 1Ward 2 1 10 10 1Ward 3 1 10 10 1Ward 4 1 10 10 1Ward 5 1 10 10 1Ward 6 1 10 10 1Ward 7 1 10 10 1Ward 8 1 10 10 0Ward 9 1 9 9 1Ward 10 1 10 10 1Ward 11 1 10 10 1Ward 12 1 10 10 1Ward 13 1 10 10 1The established ward committees have been inducted and trained to execute their obligation of deepening democracy within the community.
Internal Audit. The Municipality has a functional Internal Audit Unit. The Unit has a 3 year strategic plan and one(1) year operational risk based audit plan that is approved by the Audit Committee. The Unit is reporting directly to the Municipal Manager on operational matters and to the Audit Committee functionally. The unit is responsible for Risk Management function.
Risk Management. The Municipality has conducted the Risk Assessment and compiled a Risk Register with mitigation factors and time frames. The risk Register is updated quarterly by the Risk Management Office.
Audit Committee. The Municipality has an internal committee comprised of three(3) persons with appropriate experience in the field of Finance and Auditing, and none of them is in the employ of the Municipality, they meet at least four(4) times a year as is required by section 66(4) of MFMA. Council has approved the Audit Committee charter, and there is a fraud hotline that was launched Hotline posters and flyers were issued and municipal employees are informed.

154
Supply chain committee. The Municipality has a Supply Chain Committee which is responsible for the implementation of good business practice transaction in dealing with sourcing of goods and services from the service providers
Anti‐fraud and corruption. The plan is premised on the institution’s core ethical values driving the business of the Municipality, the development of its systems, policies and procedures, interaction with rate payers, the public and other stakeholders, and decision‐making by individual managers representing the institution. Policy implementation is challenged by fraught and corruption brought by both internal and external factors of the municipal institutions. To address the challenges of fraud and corruption the municipality has developed anti‐fraud and corruption strategies and also risk management strategies.
Declaration of Interest by Officials – the Municipality has confirmed that the policy in relation to officials’ declaration of business interests has been implemented. There is no report that confirms whether municipal councillors have interest in companies that do business with the municipality and government and/or government institutions whether officials are directors of companies doing business with government. There is also no report that confirms whether any Political Office‐Bearers from Provinces or National have business interest in the Municipality.
Communication Strategy. The Municipality has a Communication Strategy which has been adopted by Council and is reviewed on an annual basis. The objective of the strategy is to give guidance to the municipality as to how best it can communicate with both internal and external stakeholders. The strategy is premised from the National GCIS Strategic Framework for Communication 2009‐2014 and other related policies and directives from Provincial and National government.
8.6 Good governance challenges.
Inadequate information to monitor progress for the implementation of IDP projects. Limited involvement of the community to monitor the performance of the Municipality. Lack of internal and external assessment tools to monitor internal audit activities. Limited achievement on compliance with key issues of legislation, the MFMA, MSA and other regulatory policies.
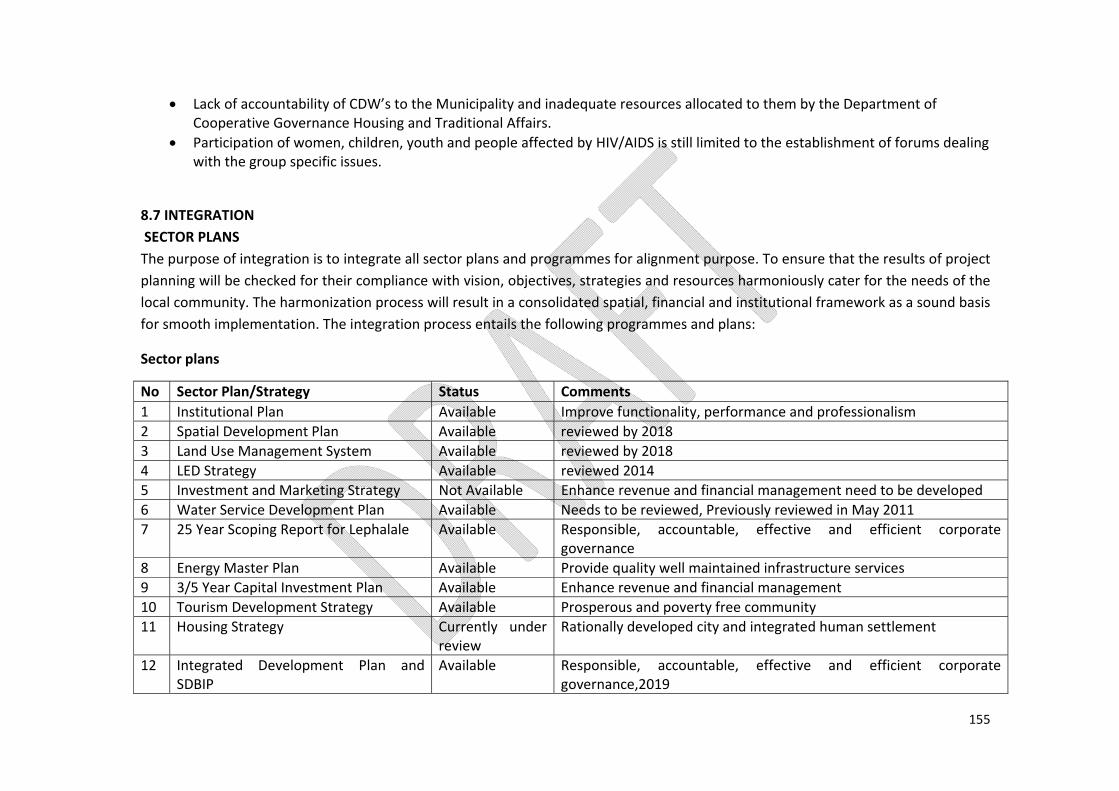
155
Lack of accountability of CDW’s to the Municipality and inadequate resources allocated to them by the Department of Cooperative Governance Housing and Traditional Affairs.
Participation of women, children, youth and people affected by HIV/AIDS is still limited to the establishment of forums dealing with the group specific issues.
8.7 INTEGRATION SECTOR PLANS The purpose of integration is to integrate all sector plans and programmes for alignment purpose. To ensure that the results of project planning will be checked for their compliance with vision, objectives, strategies and resources harmoniously cater for the needs of the local community. The harmonization process will result in a consolidated spatial, financial and institutional framework as a sound basis for smooth implementation. The integration process entails the following programmes and plans:
Sector plans
No Sector Plan/Strategy Status Comments 1 Institutional Plan Available Improve functionality, performance and professionalism2 Spatial Development Plan Available reviewed by 20183 Land Use Management System Available reviewed by 2018 4 LED Strategy Available reviewed 2014 5 Investment and Marketing Strategy Not Available Enhance revenue and financial management need to be developed 6 Water Service Development Plan Available Needs to be reviewed, Previously reviewed in May 2011 7 25 Year Scoping Report for Lephalale Available Responsible, accountable, effective and efficient corporate
governance 8 Energy Master Plan Available Provide quality well maintained infrastructure services 9 3/5 Year Capital Investment Plan Available Enhance revenue and financial management 10 Tourism Development Strategy Available Prosperous and poverty free community 11 Housing Strategy Currently under
review Rationally developed city and integrated human settlement
12 Integrated Development Plan and SDBIP
Available Responsible, accountable, effective and efficient corporate governance,2019
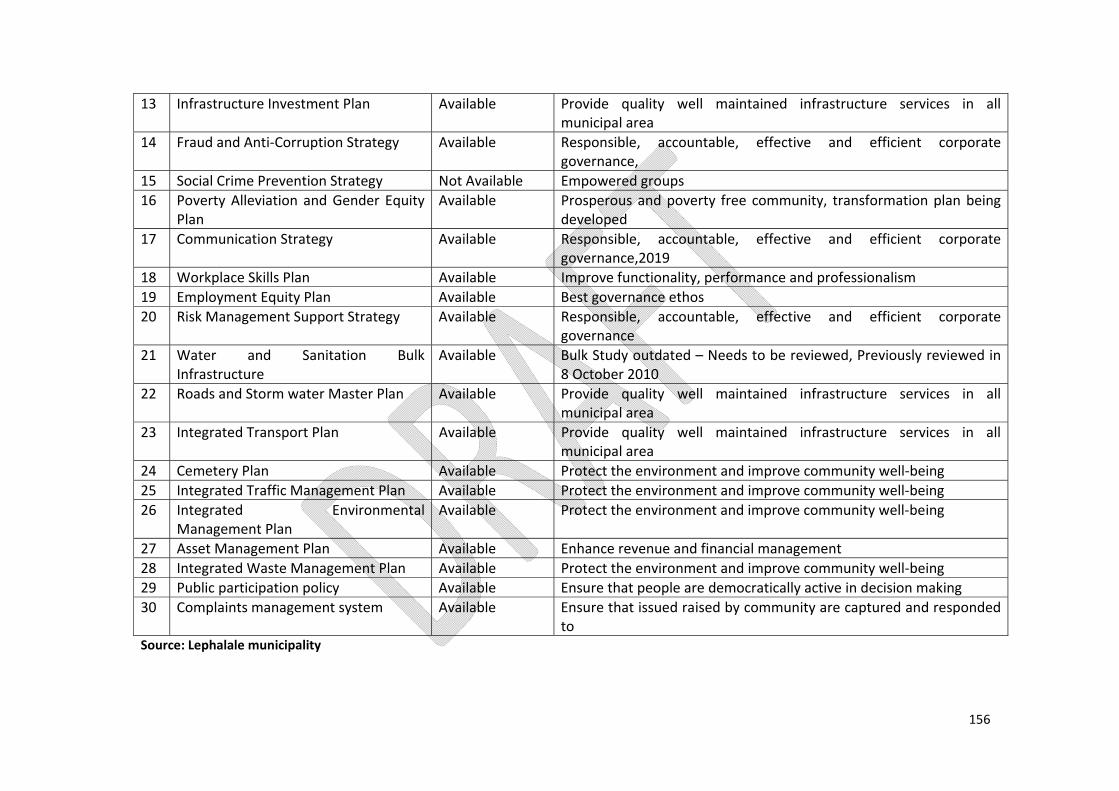
156
13 Infrastructure Investment Plan Available Provide quality well maintained infrastructure services in all municipal area
14 Fraud and Anti‐Corruption Strategy Available Responsible, accountable, effective and efficient corporate governance,
15 Social Crime Prevention Strategy Not Available Empowered groups 16 Poverty Alleviation and Gender Equity
Plan Available Prosperous and poverty free community, transformation plan being
developed 17 Communication Strategy Available Responsible, accountable, effective and efficient corporate
governance,2019 18 Workplace Skills Plan Available Improve functionality, performance and professionalism 19 Employment Equity Plan Available Best governance ethos 20 Risk Management Support Strategy Available Responsible, accountable, effective and efficient corporate
governance 21 Water and Sanitation Bulk
Infrastructure Available Bulk Study outdated – Needs to be reviewed, Previously reviewed in
8 October 2010 22 Roads and Storm water Master Plan Available Provide quality well maintained infrastructure services in all
municipal area 23 Integrated Transport Plan Available Provide quality well maintained infrastructure services in all
municipal area 24 Cemetery Plan Available Protect the environment and improve community well‐being25 Integrated Traffic Management Plan Available Protect the environment and improve community well‐being 26 Integrated Environmental
Management Plan Available Protect the environment and improve community well‐being
27 Asset Management Plan Available Enhance revenue and financial management 28 Integrated Waste Management Plan Available Protect the environment and improve community well‐being 29 Public participation policy Available Ensure that people are democratically active in decision making 30 Complaints management system Available Ensure that issued raised by community are captured and responded
to Source: Lephalale municipality

157
8.8 SWOT ANALYSIS
A SWOT ANALYSIS is often conducted as a major part of a situation analysis. SWOT is an acronym that refers to Strengths, Weaknesses, Opportunities and Threats. SWOT analysis is one of the most used forms of business analysis. A SWOT examines and assesses the impacts of internal strengths and weaknesses, and external opportunities and threats, on the success of the "subject" of analysis. An important part of a SWOT analysis involves listing and evaluating the organization’s strengths, weaknesses, opportunities, and threats. Each of these elements is described: Strengths: Strengths are those factors that make an organization more competitive than its marketplace peers. Strengths are
attributes what the organization has as a distinctive advantage or what resources it has that is strategic to the competition. Strengths are, in effect, resources, capabilities and core competencies that the organization holds that can be used effectively to achieve its strategic objectives.
Weaknesses: A weakness is a limitation, fault, or defect within the organization that will keep it from achieving its objectives; it
is what an organization does poorly or where it has inferior capabilities or resources as compared to other organizations. Opportunities: Opportunities include any favorable current prospective situation in the organization’s environment, such as a
trend, market, change or overlooked need that supports the demand for a product or service and permits the organization to enhance its competitive position.
Threats: A threat includes any unfavorable situation, trend or impending change in an organization’s environment that is currently or potentially damaging or threatening to its ability to compete. It may be a barrier, constraint, or anything that might inflict problems, damages, harm or injury to the organization.
Based on the developmental, institutional challenges and priorities that are identified by the municipality, identification of the strength, opportunities, weaknesses and threats should be done to assess whether the municipality is realizing its vision, mission statement and strategic objectives. This can only be done through a SWOT analysis. Critical success factor: (CSF) as defined by Wikipedia is the term for an element that is necessary for an organization or project to achieve its mission. It is a critical factor or activity required for ensuring the success of a company or an organization. Boynlon, A.C., and Zmud, R.W. 1984. "An Assessment of Critical Success Factors," Sloan Management Review (25:4), pp. 17‐27 defines it as: "Critical success factors are those few things that must go well to ensure success for a manager or an organization, and, therefore, they represent those managerial or enterprise areas, that must be given special and continual attention to bring about high performance. CSFs include issues vital to an organization's current operating activities and to its future success."

158
STRENGHTS WEAKNESSES
S ‐ WHAT WORK WELL? (STRENGTHS) W ‐ WHAT ARE THE CHALLENGES? (WEAKNESSES) 1. Stable council that annually approves policies 1.Audit findings on AOPO 2.In‐house legislative drafting 2.Lack of capacity building of Concillors 3.Credible IDP and successful outreach programmes 3.ICT infrastructure 4.Financially viable to sustain service delivery and jobs 4.Weak revenue collection strategy 5.Ability to supply free basic services to indigent consumers 5.Decentralised SCM processes 6.Policies in place 6.Delay in implementation of all EMS modules 7.Stakeholder relations 7.Regression on audit opinion 8.Provision of basic services 8.Ageing infrastructure 9.Inadequate resources for maintenance of recreational facilities 10.Inadequate waste management facilities 11.Lack of Bulk services
O ‐ WHAT MIGHT WORK IN OUR FAVOUR? (OPPORTUNITIES) T ‐ WHAT IS THREATENING US FROM OUTSIDE? (THREATS)1.Paperless agenda for the Councilors 1. Land invasion 2. Mining developments 2. High unemployment rate 3. Support from departments and private sector 3. Community unrest and protests 4. Increase revenue streams with new development coming to Lephalale
4. Scaling down of business investment in Lephalale
5. Establishment of community trust 5. Non‐payment of municipal accounts by consumers 6.Paperless agenda for the Councilors 6. Rapid changes in legislative requirements 8. Establishment of community trust 7. Land invasion – informal settlements 9. Mining developments 8.Environmental pollution (Air & land pollution) 10. Support from departments and private sector 9. High rate of crime 11.Provincial and national priorities 10. Illegal connections 12. PPP approach/system
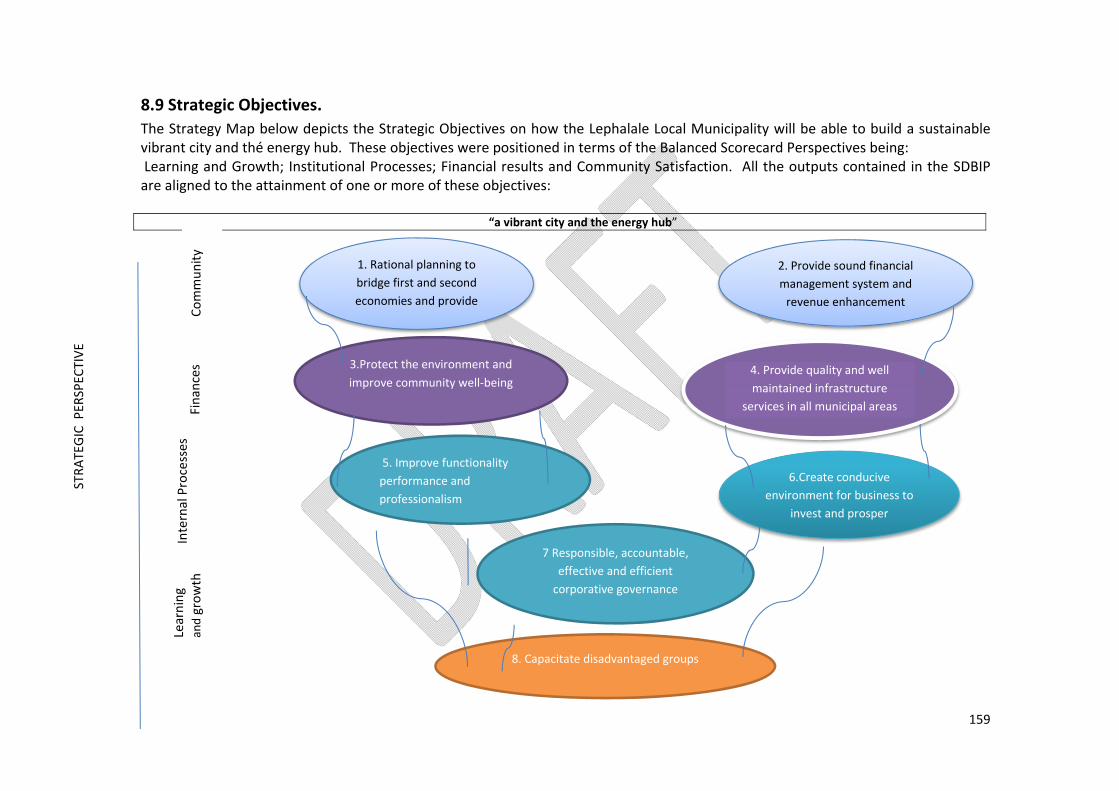
159
8.9 Strategic Objectives. The Strategy Map below depicts the Strategic Objectives on how the Lephalale Local Municipality will be able to build a sustainable vibrant city and thé energy hub. These objectives were positioned in terms of the Balanced Scorecard Perspectives being: Learning and Growth; Institutional Processes; Financial results and Community Satisfaction. All the outputs contained in the SDBIP are aligned to the attainment of one or more of these objectives:
“a vibrant city and the energy hub”
2. Provide sound financial management system and revenue enhancement
1. Rational planning to bridge first and second economies and provide
4. Provide quality and well maintained infrastructure
services in all municipal areas
3.Protect the environment and improve community well‐being
6.Create conducive environment for business to
invest and prosper
5. Improve functionality performance and professionalism
7 Responsible, accountable, effective and efficient corporative governance
8. Capacitate disadvantaged groups
STRA
TEGIC PER
SPEC
TIVE
Learning
an
d grow
th
Internal Processes
Commun
ity
Fina
nces

160
The description of the Strategic Objectives of Lephalale Local Municipality follows below: STRATEGIC OBJECTIVES / GOALS
DESCRIPTION OF STRATEGIC OBJECTIVES/RATIONAL
Rational planning to bridge first and second economies and provide adequate land for development
The Municipality seeks to conduct a land audit for the identified nodal areas well in advance to realise its strategy of becoming a city and thereby bridge the first and second economies. Further investments and establishment of industries and enterprises should be investigated and established to diversify the economy of the municipal area. The municipality must create an environment conducive for economic growth through investments in socio‐economic infrastructure to trigger local economic growth and forge partnerships with stakeholders to invest in the local economy. Existing policies should be reviewed or new policies developed to become more enabling and focussed on establishment of partnerships and networks that will enhance and expand the SMME value chain. The spatial positioning and related possibilities to link with and benefit from other growing economies around the municipal area should be exploited through extensive marketing and branding of the municipality as a vibrant city.
Provide sound financial management system and revenue enhancement
Lephalale Local Municipality seeks to identify potential revenue sources and also increase its own revenue through credit control and lobbying for more external funding for it to create sustainable revenue base to become a fully‐fledged city. These mechanisms will therefore entail the establishment of a proper credit control unit to handle credit collection processes. Hence, the improvement on billing accuracy will need to be optimised. These efforts need to be well communicated to communities in order to secure buy‐in and thereby enhancing democratic governance. Given the complexity of the situation the municipality will need to review its credit control policy and eliminate possible gaps in the process. It is therefore critical for the Budget and Treasury department to develop business plans for projects that need funding and submit to WDM donor funder to lobby for funding. This will afford the municipality with an opportunity to build the city and realise its vision for the next 20 years and beyond.

161
STRATEGIC OBJECTIVES / GOALS
DESCRIPTION OF STRATEGIC OBJECTIVES/RATIONAL
Protect the environment and improve community well‐being
The municipality should come up with innovative ways on how it can increase community awareness and participation in environmental management (pollution, waste and emissions) activities and initiatives. The powers and function delegated to the Lephalale Local Municipality must play a significant role in the monitoring and analysing of air quality within the municipal area which is closely related to the monitoring and measuring of mining and vehicle emissions. It is commonly known that mining activities and the movement of trucks in the municipal area have increased enormously since the inception of the Matimba and Medupi Power stations. This advent therefore necessitates the need to identify and protect the environmental. The municipality needs to develop an environmental management plan which ought to give rise to intensifying recycling initiatives. Lastly environmental by‐laws with appropriate punitive mechanism and action plan need to be developed, promulgated and enforced to strengthen compliance thereof.
Provide quality and well maintained infrastructural services in all municipal areas
The development of power stations in Lephalale has brought along many challenges associated with infrastructure and service delivery. Apart from the fact that significant backlogs exist in terms of basic service delivery, the Lephalale Local Municipality’s needs to refurbish its existing infrastructure that is ageing due to increasing population size as the economy grows. It is therefore critical for the Municipality to consider the development of infrastructure as well as options such as serious investments that is required to refurbish and maintain these assets. The extent of infrastructure development needs in the building of a city is rather uncertain and therefore it is of critical importance that Lephalale Local Municipality should develop an Infrastructure Investment Master Plan. This plan should assist the municipality to classify the current state of infrastructure, assist with integrated planning to ensure planning for provision and refurbishment of infrastructure is taken into consideration and carefully planned.
Improve functionality, performance and professionalism
Lephalale Local Municipality seeks to become a fully‐fledged City in the coming 20 years. Becoming a city comes with a responsibility to improve the current status quo meaning that the functionality of systems will therefore need to change for the better.

162
STRATEGIC OBJECTIVES / GOALS
DESCRIPTION OF STRATEGIC OBJECTIVES/RATIONAL
The Municipality will also need to accelerate its performance and level of professionalism enough to convince government and other stakeholders of its readiness to become a City. Lephalale Local Municipality has thus far began to interact with international communities bearing the advent of mining, therefore the need to practice international best practices has now become an absolute necessity. It can be said again that the municipality ought to step up its operational standards and governance structure and systems to comply with best practice. Therefore good governance instilled into the minds and hearts of municipal leadership, management and officials.
Create a conducive environment for businesses to invest and prosper
Lephalale Local Municipality seeks to compile programmes and formulate policies and by‐laws that encourage entrepreneurship and thereby monitor and evaluate performance of the local economy and investment trends. Project designs to include labour intensive methods and identify opportunity areas and expose SMMEs to incubation projects which will stimulate development and thereby enhance job creation. Ensure LED's involvement and integration of the appointment process of labourers in capital projects. Hence, the advent of mining pertaining to energy within the municipal areas gives rise for the municipality to elaborate on the manufacturing, tourism, mining, wholesale and retail, agricultural and government sectors. In order to promote PPP the municipality needs to develop incentive packages for private investment. Invariably the municipality will seek to develop collaboration agreements with both public and private entities on programme implementation. Furthermore, the municipality needs to establish an entity that will drive economic development and mobilise funding for bulk infrastructure network. Lephalale economic development agency as a vehicle for such development is necessary.

163
STRATEGIC OBJECTIVES / GOALS
DESCRIPTION OF STRATEGIC OBJECTIVES/RATIONAL
Responsible, accountable, effective and efficient corporate governance
Lephalale Local Municipality seeks to strengthen and effectively manage the systems and procedures to ensure that sound governance practices are adhered to. This should begin with the need to ensure the full functionality of ward committee and public participation systems to enhance democratic governance. These will give rise to the need to maximise organisational excellence and provide accountability to the community of Lephalale. Hence, the complexities of becoming a city comes with responsibility and accountability, the development of strategic plans with the long term vision in mind will be of critical importance. The municipality should plan beyond 2030 to realise its vision of becoming a City. These will also involve the attendance of sector planning and involving sector departments in municipal planning. The development of a credible IDP is the cornerstone of good governance, hence the municipality must ensure that effective functioning of the municipal system and processes by ensuring effective planning, monitoring, reporting and evaluation processes on service delivery improvement and how effectively the IDP outcomes are achieved. These will ensure that a clean audit opinion is achieved by the municipality.
Capacitate disadvantaged groups
Community capacity can be seen as the capacity of the people in communities to participate in actions based on community interests, both as individuals and through groups, organisations and networks. It is not primarily about their ability to act in their personal capacity, family or employers’ interest, which are catered for in other spheres. However, many of the same skills are involved, and people who are active in the community invariably benefit in other ways as well. It is therefore critical for the communities to possess skills and knowledge that will assist them to improve the quality of their lives. Knowledge is power. The actions people and groups undertake can broadly be described as Community Activity. This can be divided into three types of activities: Action to build social knowledge: building relationships, trust, shared norms and networks. It involves people taking part in community initiatives, groups and organisations, and those groups communicating
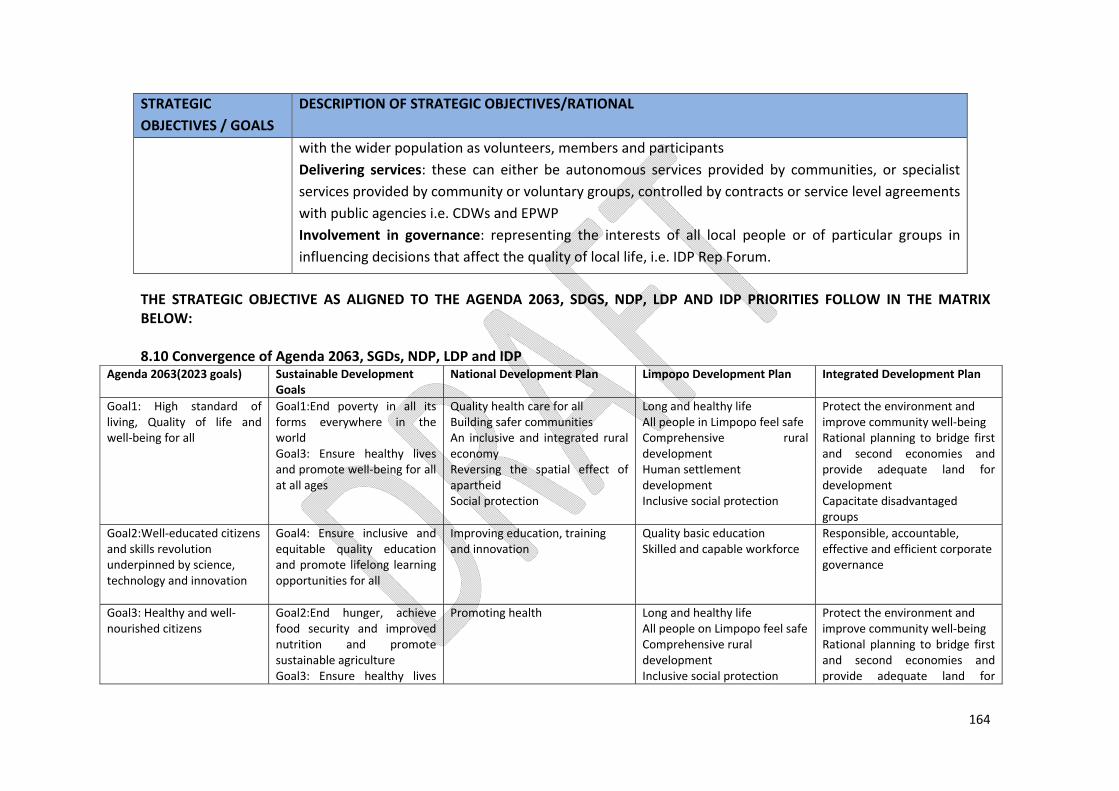
164
STRATEGIC OBJECTIVES / GOALS
DESCRIPTION OF STRATEGIC OBJECTIVES/RATIONAL
with the wider population as volunteers, members and participantsDelivering services: these can either be autonomous services provided by communities, or specialist services provided by community or voluntary groups, controlled by contracts or service level agreements with public agencies i.e. CDWs and EPWP Involvement in governance: representing the interests of all local people or of particular groups in influencing decisions that affect the quality of local life, i.e. IDP Rep Forum.
THE STRATEGIC OBJECTIVE AS ALIGNED TO THE AGENDA 2063, SDGS, NDP, LDP AND IDP PRIORITIES FOLLOW IN THE MATRIX BELOW: 8.10 Convergence of Agenda 2063, SGDs, NDP, LDP and IDP
Agenda 2063(2023 goals) Sustainable Development Goals
National Development Plan Limpopo Development Plan Integrated Development Plan
Goal1: High standard of living, Quality of life and well‐being for all
Goal1:End poverty in all its forms everywhere in the world Goal3: Ensure healthy lives and promote well‐being for all at all ages
Quality health care for allBuilding safer communities An inclusive and integrated rural economy Reversing the spatial effect of apartheid Social protection
Long and healthy lifeAll people in Limpopo feel safe Comprehensive rural development Human settlement development Inclusive social protection
Protect the environment and improve community well‐being Rational planning to bridge first and second economies and provide adequate land for development Capacitate disadvantaged groups
Goal2:Well‐educated citizens and skills revolution underpinned by science, technology and innovation
Goal4: Ensure inclusive and equitable quality education and promote lifelong learning opportunities for all
Improving education, training and innovation
Quality basic education Skilled and capable workforce
Responsible, accountable, effective and efficient corporate governance
Goal3: Healthy and well‐nourished citizens
Goal2:End hunger, achieve food security and improved nutrition and promote sustainable agriculture Goal3: Ensure healthy lives
Promoting health Long and healthy lifeAll people on Limpopo feel safeComprehensive rural development Inclusive social protection
Protect the environment and improve community well‐being Rational planning to bridge first and second economies and provide adequate land for

165
and promote well‐being for all at all ages
system development
Agenda 2063(2023 goals) Sustainable Development Goals
National Development Plan Limpopo Development Plan Integrated Development Plan
Goal4: Transformed economies and job creation
Goal8: Promote sustained, inclusive and sustainable economic growth, full and productive employment and decent work for all
Economy and employment Decent employment through inclusive growth Comprehensive rural development
Create a conducive environment for businesses to invest and prosper
Goal5:Modern Agriculture for increased productivity and production
Goal2: End hunger, achieve food security and improved nutrition and promote sustainable agriculture Goal12: Ensure sustainable consumption economy and production patterns
Integrated and inclusive rural economy
Long and healthy lifeComprehensive rural development Environmental protection Inclusive social protection system
Rational planning to bridge first and second economies and provide adequate land for development Protect the environment and improve community well‐being
Transformed economies Goal6:Ensure availability and sustainable management of water and sanitation for all Goal9:Build resilient infrastructure, promote inclusive and sustainable industrialization, and foster innovation
Improving infrastructure Sustainable and inclusive economic growth STI driven manufacturing, industrialization and value addition Economic diversification and resilience
Maintenance and upgrading of infrastructure in all municipal areas
Goal2:Well‐educated citizens and skills revolution underpinned by science, technology and innovation
Reforming the Public Service. Demonstrating good governance and administration
Fighting corruption Improve functionality, performance and professionalism

166
KPA 1 Spatial Rationale.
Directorate Outcomes, Objectives and Strategies. PROGRAMME OUTCOME Programme Objective Immediate Action
(1‐2 Yrs) Short Term Strategies (3‐5 Yrs) Medium Term
Strategies (5‐10 Yrs) Long Term Strategies (10 Yrs+)
Sustainable development
Rational planning to bridge first and second economies and provide adequate land for development
ensure adequate land availability for development by 2020
Approach COGHSTA (HDA) for acquiring developmental land.
Land assembly and budget Avail land for development
Land use Rational planning to bridge first and second economies and provide adequate land for development
develop and implement all land use policies according to land use principles by 2018.
Enforcement of the reviewed SDF and LUS
Compilation and enforcement of land use policies to complement the implementation of the LUS and SDF
Formalize rural settlements in conjunction with CoGHSTA and develop comprehensive infrastructure plans
Sustainable rural settlements
Rational planning to bridge first and second economies and provide adequate land for development
facilitate sustainable rural settlements by 2022
Enforce LSDF for rural villages
Sustainable and integrated rural development
Informed spatial planning (GIS)
Rational planning to bridge first and second economies and provide adequate land for development
sustainable and integrated GIS System by June 2020
Continuous maintenance of existing licenses
all cadastral and infrastructure datasets converted into shape files (ArcGIS File format) by June 2020
operational and fully functional GIS intranet/internet website
integrate GIS with other systems including Billing, Deeds registry

167
PROGRAMME OUTCOME Programme Objective Immediate Action (1‐2 Yrs)
Short Term Strategies (3‐5 Yrs) Medium Term Strategies (5‐10 Yrs)
Long Term Strategies (10 Yrs+)
Building plans administration and inspectorate
Rational planning to bridge first and second economies and provide adequate land for development
Safe and formalised housing structures.
effective administrative/regulatory framework for building plan approval Streamline and monitor the building plan approval process.
Improve on law enforcement as per the NBR and land use management requirements. Continuously apply and enforce compliance on NBR regulation Act 103 of 1997.
Develop a punitive strategy for dealing with building regulation transgressors (e.g. deprivation of electrical services of transgressors).. Fast track the contravention process.
Continuously enforce the building regulations. Continuously apply and enforce compliance on NBR regulation.
Building plans administration and inspectorate
Rational planning to bridge first and second economies and provide adequate land for development
Formalised structures and revenue generation
Improve on law enforcement as per the NBR requirements Co‐ordinate information sessions with CIDB, NHBRC and other service providers for builders locally
Enforce compliance of municipal building regulation and NBR policies
Develop a punitive strategy for dealing with building regulation transgressors (e.g. deprivation of electrical services of transgressors)..
Continuously enforce the building regulations. Continuously apply and enforce compliance on NBR regulation.
Socio economic surveys
Rational planning to bridge first and second economies and provide adequate land for development
Sustainable integrated urban development
capture data on housing needs register Facilitate special presidential package for mining towns and Implement Accreditation Level
Approach COGHSTA (HDA) for acquiring developmental land. Increase access to decent housing needs.
Land acquisition and budget.
Avail land for development.
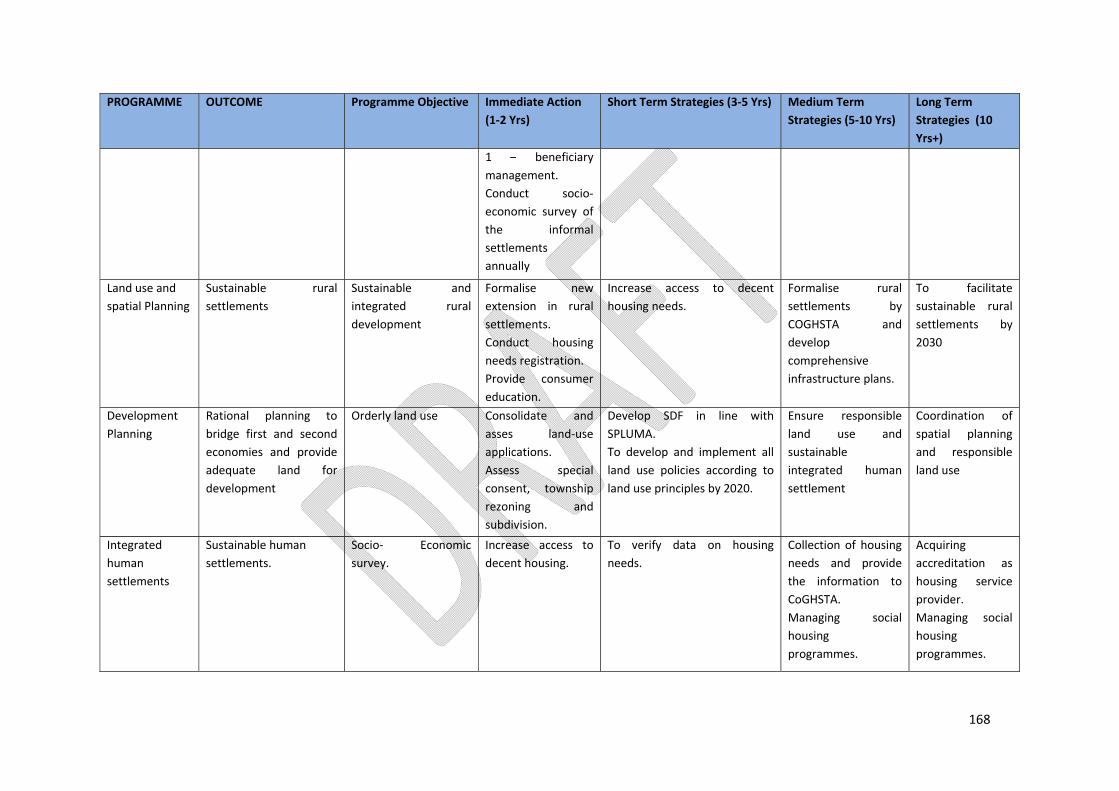
168
PROGRAMME OUTCOME Programme Objective Immediate Action (1‐2 Yrs)
Short Term Strategies (3‐5 Yrs) Medium Term Strategies (5‐10 Yrs)
Long Term Strategies (10 Yrs+)
1 – beneficiary management. Conduct socio‐economic survey of the informal settlements annually
Land use and spatial Planning
Sustainable rural settlements
Sustainable and integrated rural development
Formalise new extension in rural settlements. Conduct housing needs registration. Provide consumer education.
Increase access to decent housing needs.
Formalise rural settlements by COGHSTA and develop comprehensive infrastructure plans.
To facilitate sustainable rural settlements by 2030
Development Planning
Rational planning to bridge first and second economies and provide adequate land for development
Orderly land use Consolidate and asses land‐use applications. Assess special consent, township rezoning and subdivision.
Develop SDF in line with SPLUMA. To develop and implement all land use policies according to land use principles by 2020.
Ensure responsible land use and sustainable integrated human settlement
Coordination of spatial planning and responsible land use
Integrated human settlements
Sustainable human settlements.
Socio‐ Economic survey.
Increase access to decent housing.
To verify data on housing needs.
Collection of housing needs and provide the information to CoGHSTA. Managing social housing programmes.
Acquiring accreditation as housing service provider. Managing social housing programmes.

169
KPA 2 Basic Services and Infrastructure investment
Directorate Outcomes, Objectives and Strategies PROGRAMME OUTCOME Programme
Objective Immediate Actions (1‐2 Yrs)
Short Term Strategies (3‐5 Yrs)
Medium Term Strategies (5‐10 Yrs)
Long Term Strategies (10 Yrs+)
Water Provide quality, sustainable and well maintained infrastructure services for Lephalale’s future development
Reduce water loss to less than 12%.
Reduce water loss by 3%. Embark on awareness campaign on water conservation. Replace AC pipes and repair household metering.
Ensure that water losses are at acceptable standards not acceding 14%. Conduct continuous water awareness and conservation campaigns.
Implementation of water conservation and water demand management programme. Reduce water losses to less than 14%. Install water smart metering system.
Improve efficiency and accuracy of water management system to further reduce water losses e.g. smart metering, monitoring of illegal uses.
Water Provide quality, sustainable and well maintained infrastructure services for Lephalale’s future development.
Water infrastructure maintenance and Upgrading.
Ensure that 30% of AC pipes are replaced by 2020. Refurbishment of existing water infrastructure. Resolve all water breakdowns within24 hours.
To ensure that all AC pipes are replaced by 2020. To attend and resolve all water breakdowns within 24 hours
Expand on teams and employees responsible for maintenance of water infrastructure
Implement and adhere to preventative maintenance plan and effectively attend to reactive maintenance aspects. Refurbishment of existing water infrastructure.
Water Provide quality, sustainable and well maintained infrastructure services for Lephalale’s future development
Water Quality (Blue Drop)
Safe drinking water
Maintain blue drop status (minimum of 90%), risk rating to be less than 50%.
Monitoring of water quality within all registered water sources
Establishment of own accredited water testing laboratory for ensuring water quality
Water Provide quality, sustainable and well maintained infrastructure services for Lephalale’s future development
Water Supply
Access to water supply to all the community. Linking Marapong supply with the Zealand treatment
Review water master plan to be incorporated within the integrated rural development plan. Upgrade rural water
Implementation of regional water scheme projects (MIG) Ensure that MCWAP plans incorporate the rural water demand. Finalisation of Section 78(3)
Implement credit control mechanisms to create culture of payment for services. Ensure that all households have yard

170
PROGRAMME OUTCOME Programme Objective
Immediate Actions (1‐2 Yrs)
Short Term Strategies (3‐5 Yrs)
Medium Term Strategies (5‐10 Yrs)
Long Term Strategies (10 Yrs+)
works.
networks (source, storage and reticulation) from RDP standards to yard connections and implementation of mechanisms of metering, billing and invoicing of services delivered.
process with regards to determination of appropriate mechanisms for water provisioning. Conduct surveys and development of feasibility study for development of technical report and realistic funding requirements.
connections by 2030
Sanitation Provide quality, sustainable and well maintained infrastructure services for Lephalale’s future development
Sustainable environment and infrastructure.
Zero spillage of sewer. Attend and resolve all sanitation breakdowns within 24 hours. Refurbish existing sanitation infrastructure and adhere to preventative maintenance plan.
To implement mechanisms to reduce sanitation spillages to achieve zero spillages by 2020 To attend and resolve all sanitation breakdowns within 24 hours
Install telemetric systems for sewer pump stations To upgrade capacity of WWTW at all nodal points by 2021
Conducting awareness campaigns on health and hygiene matters Implement and adhere to preventative maintenance plan and effectively attend to reactive maintenance aspects. Refurbish existing sanitation infrastructure
Sanitation Provide quality, sustainable and well maintained infrastructure services for Lephalale’s future development
Sanitation (upgrading and maintenance)
Upgrade capacity of WWTW, conduct EIA and increase capacity of Paarl WWTW.
Safe, affordable and hygienic sanitation systems. To establish a city wide water borne sanitation system by 2030.
Conduct feasibility study and compile sanitation master plan for both rural and urban areas
Upgrading of existing sanitation infrastructure for the establishment of a city wide water borne sanitation system
Sanitation Provide quality, sustainable and well maintained infrastructure services for Lephalale’s future
Waste Water Quality (Green Drop).
Sustainable environment. Implementation of preventative maintenance plans
To establish a compliant, healthy and hygienic sanitation system by 2020.
Implement plans to ensure compliance (submission of portfolio of evidence for maintenance of sewer network) to green drop
Manage and maintain existing sewer infrastructure to maintain compliance to green drop

171
PROGRAMME OUTCOME Programme Objective
Immediate Actions (1‐2 Yrs)
Short Term Strategies (3‐5 Yrs)
Medium Term Strategies (5‐10 Yrs)
Long Term Strategies (10 Yrs+)
development.
and adherence to service standards.
Implementation of preventative maintenance plans and adherence to service standards.
requirements and standards (inclusive of sampling)
standards and minimize risks. Implementation of preventative maintenance plans and adherence to service standards.
Electricity Provide quality, sustainable and well maintained infrastructure services for Lephalale’s future development
Sound maintenance plan for electricity.
Develop electricity maintenance plan. increase the effective utilisation and upgrade the capacity of the electricity network with 120 MVA.
ensure continuous and reliable supply of electricity to all residents within the Lephalale municipal area.
Upgrade water and sewer electric panels to more modern energy saving panels. Upgrade internal (feeder lines) reticulation within town (Onverwacht substation to Lephalale town) to accommodate 80MVA.
Incorporate and integrate all electricity provisioning (inclusive of all rural areas) within the whole Lephalale municipal area Extending of distribution license from NERSA of Marapong and rural villages to fall within the municipal licensed area
Electricity Provide quality, sustainable and well maintained infrastructure services for Lephalale’s future development
Reduce electrical loss.
Reduce electrical loss by 7 %. Get return line from Onverwacht to town and back
provide all households within the municipal area with electricity in line with national targets by 2030
Review electricity master plan
Complete ring feed of entire back bone structure of electrical infrastructure
Electricity Provide quality, sustainable and well maintained infrastructure services for Lephalale’s future development
Energy Efficiency.
Reduce carbon footprint.
continuously implement energy efficiency measures Replace normal switches with sensor switches.
Control systems and capacitate banks in main substations Exchange energy consuming lights with energy saving lights (High masts and street lights). Installation of ripple
Promote and enforce consumer compliance to energy saving initiatives (solar geysers, solar lights, inverter air conditioners and energy relay controls)
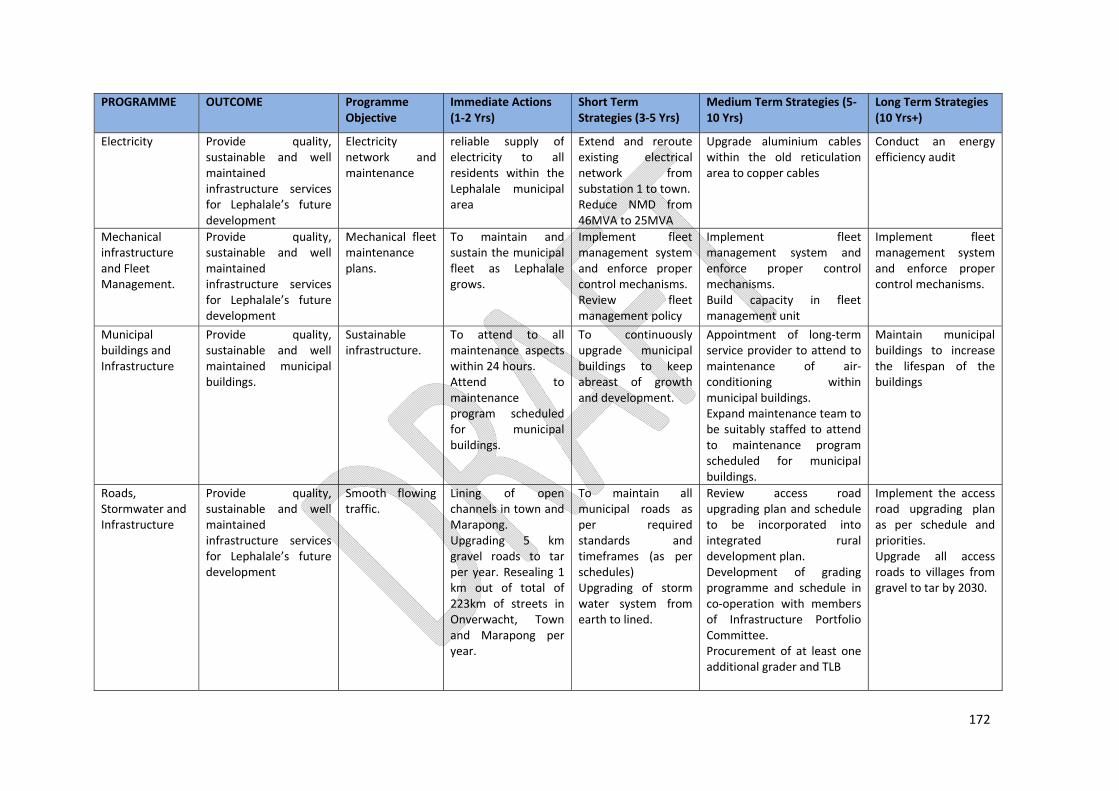
172
PROGRAMME OUTCOME Programme Objective
Immediate Actions (1‐2 Yrs)
Short Term Strategies (3‐5 Yrs)
Medium Term Strategies (5‐10 Yrs)
Long Term Strategies (10 Yrs+)
Electricity Provide quality, sustainable and well maintained infrastructure services for Lephalale’s future development
Electricity network and maintenance
reliable supply ofelectricity to all residents within the Lephalale municipal area
Extend and reroute existing electrical network from substation 1 to town. Reduce NMD from 46MVA to 25MVA
Upgrade aluminium cables within the old reticulation area to copper cables
Conduct an energy efficiency audit
Mechanical infrastructure and Fleet Management.
Provide quality, sustainable and well maintained infrastructure services for Lephalale’s future development
Mechanical fleet maintenance plans.
To maintain and sustain the municipal fleet as Lephalale grows.
Implement fleet management system and enforce proper control mechanisms. Review fleet management policy
Implement fleet management system and enforce proper control mechanisms. Build capacity in fleet management unit
Implement fleet management system and enforce proper control mechanisms.
Municipal buildings and Infrastructure
Provide quality, sustainable and well maintained municipal buildings.
Sustainable infrastructure.
To attend to all maintenance aspects within 24 hours. Attend to maintenance program scheduled for municipal buildings.
To continuously upgrade municipal buildings to keep abreast of growth and development.
Appointment of long‐term service provider to attend to maintenance of air‐conditioning within municipal buildings. Expand maintenance team to be suitably staffed to attend to maintenance program scheduled for municipal buildings.
Maintain municipal buildings to increase the lifespan of the buildings
Roads, Stormwater and Infrastructure
Provide quality, sustainable and well maintained infrastructure services for Lephalale’s future development
Smooth flowing traffic.
Lining of open channels in town and Marapong. Upgrading 5 km gravel roads to tar per year. Resealing 1 km out of total of 223km of streets in Onverwacht, Town and Marapong per year.
To maintain all municipal roads as per required standards and timeframes (as per schedules) Upgrading of storm water system from earth to lined.
Review access road upgrading plan and schedule to be incorporated into integrated rural development plan. Development of grading programme and schedule in co‐operation with members of Infrastructure Portfolio Committee. Procurement of at least one additional grader and TLB
Implement the access road upgrading plan as per schedule and priorities. Upgrade all access roads to villages from gravel to tar by 2030.

173
PROGRAMME OUTCOME Programme Objective
Immediate Actions (1‐2 Yrs)
Short Term Strategies (3‐5 Yrs)
Medium Term Strategies (5‐10 Yrs)
Long Term Strategies (10 Yrs+)
Roads, Stormwater and Infrastructure
Provide quality, sustainable and well maintained infrastructure services for Lephalale’s future development
Roads and Storm water (New infrastructure)
Build new Municipal roads and storm water. Linking the local road network to the provincial arterial roads. Unlocking industrial corridors.
Construct the southern and northern by‐pass roads by 2020 Provide and construct another Marapong access road
Review roads and storm water master plan for incorporation into Rural Development Strategic plan Provide for walkways and pavements in town, Onverwacht and Marapong
Construct northern by‐pass roads with adequate and sufficient linkages. Construct and develop storm water measures in Marapong. Improve culverts in all rural villages
PMU Timeous completion of projects in line with infrastructure plan.
Projects and contract management.
Ensure that all Capital project are implemented within planned period and budget. Quality assurance.
Contract Management Projects Registration. Three Year Service providers to reduce procurement delays and under‐spending. Municipal Funded projects progress monitoring.
Funded projects progress monitoring and evaluation. Continuous contract Management for project implementation.

174
KPA 3 Financial Management and Viability.
Directorate Outcomes, Objectives and Strategies. PROGRAMME OUTCOME Programme
Objective Immediate Action (1‐2 Yrs)
Short Term Strategies (3‐5 Yrs) Medium Term Strategies (5‐10 Yrs)
Long Term Strategies (10 Yrs+)
Budget and reporting
Creditable financial reporting
Continuous compliance with regulatory frameworks.
implement cost management accounting. Implement quarterly budget banking. Prepare maintenance budget informed by maintenance plan. Enforce market testing of prices during budget processes Compile credible AFS and interim financialsImplementation of mSCOA.
Implement proper cost management system Implementation of mSCOA Increase capacity of B&R division to realise cost account management
To redefine and implement credible cost accounting systems Implementation of mSCOA
To have a cost management automated system
Revenue management
Sound financial management system and revenue enhancement
Increased revenue.
Implementation of a streamlined and integrated creditor’s payment system. Increase own revenue through credit control. Increase revenue base. General cost coverage through collection, expenditure minimization, improve efficiency in operations.
Resolving electricity distribution and collection in Marapong and Thabo Mbeki. Improve on billing accuracy. Lobby for more external funding. Review valuation roll
Implement credit control policy and continuously identify additional revenue sources. Development business plans for projects that need funding and submit to WDM donor funder to lobby for funding. Implementing signed agency agreements
Implement credit control policy and continuously identify additional revenue sources. Development business plans for projects that need funding and submit to WDM donor funder to lobby for funding Implementing signed agency agreements

175
PROGRAMME OUTCOME Programme Objective
Immediate Action (1‐2 Yrs)
Short Term Strategies (3‐5 Yrs) Medium Term Strategies (5‐10 Yrs)
Long Term Strategies (10 Yrs+)
Creating community awareness.
Revenue management
Affordable access to basic services
Free basic services
Update and verify indigent register on a regular basis. Providing indigents with free basic services. Community awareness. Develop action plan and changing over to pre‐paid system. Establish vending points and systems for pre‐paid water and electrical system.
Update and verify indigent register. Providing indigents with free basic services. Community awareness Implementation of indigent management system Annual review of indigent management policy
Update and verify indigent register. Providing indigents with free basic services. Community awareness
Update and verify indigent register. Providing indigents with free basic services. Community awareness
Expenditure Management
Maintenance of sound financial Management and viability.
Cash flow management.
Payment of creditors within 30 days. Payment of external loans, interest and redemption due on time.
Implementation of a streamlined and integrated creditors payment system
Extending the capacity of expenditure unit
Extending the capacity of expenditure unit
Supply Chain management
Credible procurement processes
Demand and Acquisition
Ensure compliance with SCM regulatory framework. Timely, cost effective, efficient, equitable, transparent and fair procurement of goods and services. Creating a healthy working environment
Conduct internal workshops on SCM. Conduct awareness on SCM processes during induction of new staff. Updating of database on annual basis. Revision of procurement policy on annual basis. Supplier’s performance management.
Develop policy on procurement of event services Continuous data cleansing of suppliers. Identify recurring procurement that can be outsourced.
Centralization of procurement processes. Updating of database on annual basis Building the capacity in the SCM unit

176
PROGRAMME OUTCOME Programme Objective
Immediate Action (1‐2 Yrs)
Short Term Strategies (3‐5 Yrs) Medium Term Strategies (5‐10 Yrs)
Long Term Strategies (10 Yrs+)
that takes diversity into consideration to improve efficiency and effectiveness. Compile deviation register for report to council. Do stock reconciliation on a daily basis. Update supplier’s data base and invite suppliers to register annually.
Training of SCM committees. Develop SPI that details the action to be followed in procurement of goods and services for the municipality in line with SCM policy.
Asset Management
Sound financial management system and revenue enhancement
Sustainable assets
Ensure that the asset register is compliant with GRAP and other prescriptions. Development and implementation of an infrastructure investment framework and plan. Staff awareness campaign on asset management. Revision of asset policy annually
Develop a register for Work in progress. Increase the capacity in asset management unit.
Continuous review and implementation of an infrastructure investment framework and plan Annual review of asset management policy.
Increase the capacity in asset management unit. Annual review of asset management policy.
Revenue Management
Sound financial management system and revenue enhancement
Increased revenue.
Increase own revenue through credit control. Identification of potential additional revenue sources. Review credit control
Creating community awareness. Implementation of pre‐paid electricity and smart metering. Manage external debt collectors. Revise tariff structures.
Resolving electricity distribution and collection in Marapong and Thabo Mbeki. Identification of potential additional revenue sources.
Implement credit control policy and continuously identify additional revenue sources. Development business plans for projects that

177
PROGRAMME OUTCOME Programme Objective
Immediate Action (1‐2 Yrs)
Short Term Strategies (3‐5 Yrs) Medium Term Strategies (5‐10 Yrs)
Long Term Strategies (10 Yrs+)
policy and closing all loop holes. Improve on billing accuracy. Continuous implementation of pre‐paid electricity and smart metering.
Development business plans for projects that need funding and submit to WDM donor funder to lobby for funding.
Pursuing the signing of agency agreement for unfunded mandates Implementing signed agency agreements
need funding and submit to WDM donor funder to lobby for funding. Implementing signed agency agreements. Review valuation roll.
KPA 4 Local Economic Development
PROGRAMME OUTCOME Programme Objective
Immediate Action (1‐2 Yrs)
Short Term Strategies (3‐5 Yrs)
Medium Term Strategies (5‐10 Yrs)
Long Term Strategies (10 Yrs+)
Strategic Support Service (LED)
Employment opportunities
Job creation Reduce unemployment rate of 27% by 2% annually within the municipality. Create employment opportunities through municipal LED and capital projects and collaboration with strategic partners
Reduce unemployment rate of 27% by 5% within the municipality by 2020 (to be in line with SDGs & NDP)
Collaborate with local stakeholders and strategic partners that deals with developmental programmes to provide job creation opportunities
Have fully‐fledged LED unit that is able to do proper research related to all economic sectors and facilitate local job creation and beneficiation
Strategic Support Service (LED)
Create conducive environment for business to invest and prosper
Marketing and branding
Increased investment (all sectors) opportunities
Continuously promote investment in Lephalale
Facilitation of investment in the municipality for purpose of economic growth
Facilitation of LED for integration of markets and establishment of partnerships
Strategic Support Service (LED)
Create conducive environment for business to
Good stakeholder relations
Facilitate establishment of public private partnerships.
Identify and attract potential strategic partners for investment by 2022. Maintain good relationships with
Foster IGR relationships. Develop collaboration agreements with both public and private entities
Maintain good relationships with strategic partners
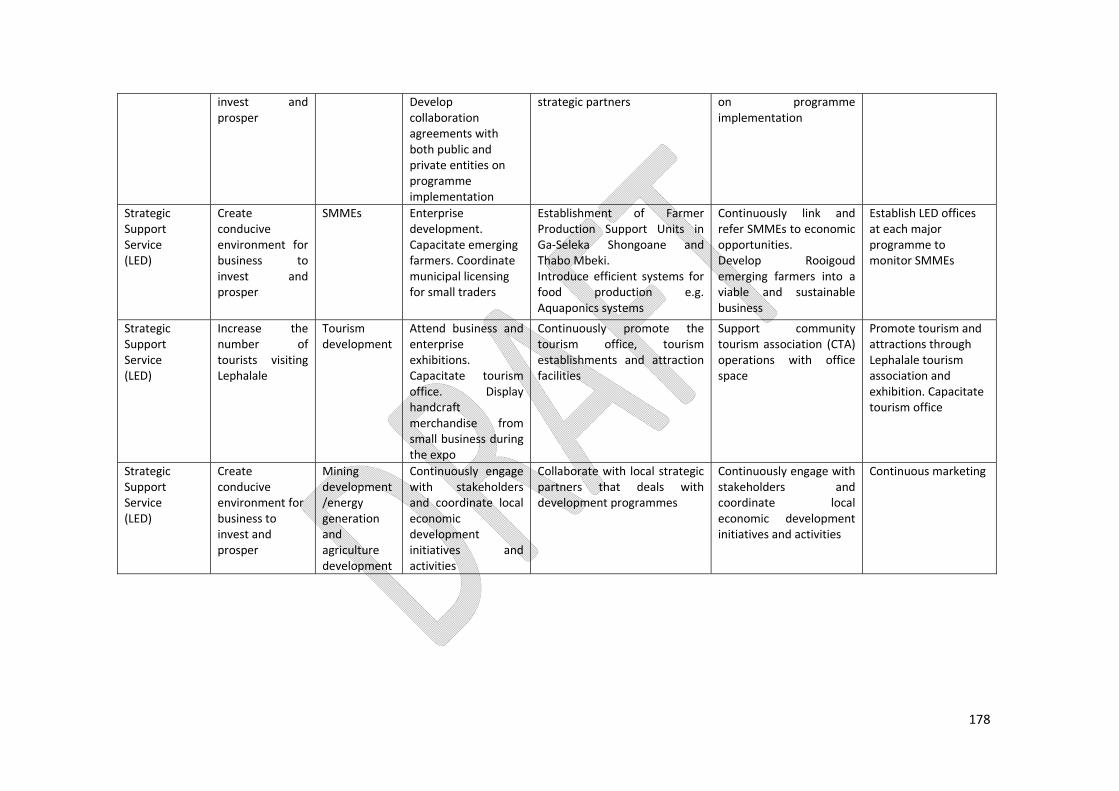
178
invest and prosper
Develop collaboration agreements with both public and private entities on programme implementation
strategic partners on programme implementation
Strategic Support Service (LED)
Create conducive environment for business to invest and prosper
SMMEs Enterprise development. Capacitate emerging farmers. Coordinate municipal licensing for small traders
Establishment of Farmer Production Support Units in Ga‐Seleka Shongoane and Thabo Mbeki. Introduce efficient systems for food production e.g. Aquaponics systems
Continuously link and refer SMMEs to economic opportunities. Develop Rooigoud emerging farmers into a viable and sustainable business
Establish LED offices at each major programme to monitor SMMEs
Strategic Support Service (LED)
Increase the number of tourists visiting Lephalale
Tourism development
Attend business and enterprise exhibitions. Capacitate tourism office. Display handcraft merchandise from small business during the expo
Continuously promote the tourism office, tourism establishments and attraction facilities
Support community tourism association (CTA) operations with office space
Promote tourism and attractions through Lephalale tourism association and exhibition. Capacitate tourism office
Strategic Support Service (LED)
Create conducive environment for business to invest and prosper
Mining development/energy generation and agriculture development
Continuously engage with stakeholders and coordinate local economic development initiatives and activities
Collaborate with local strategic partners that deals with development programmes
Continuously engage with stakeholders and coordinate local economic development initiatives and activities
Continuous marketing
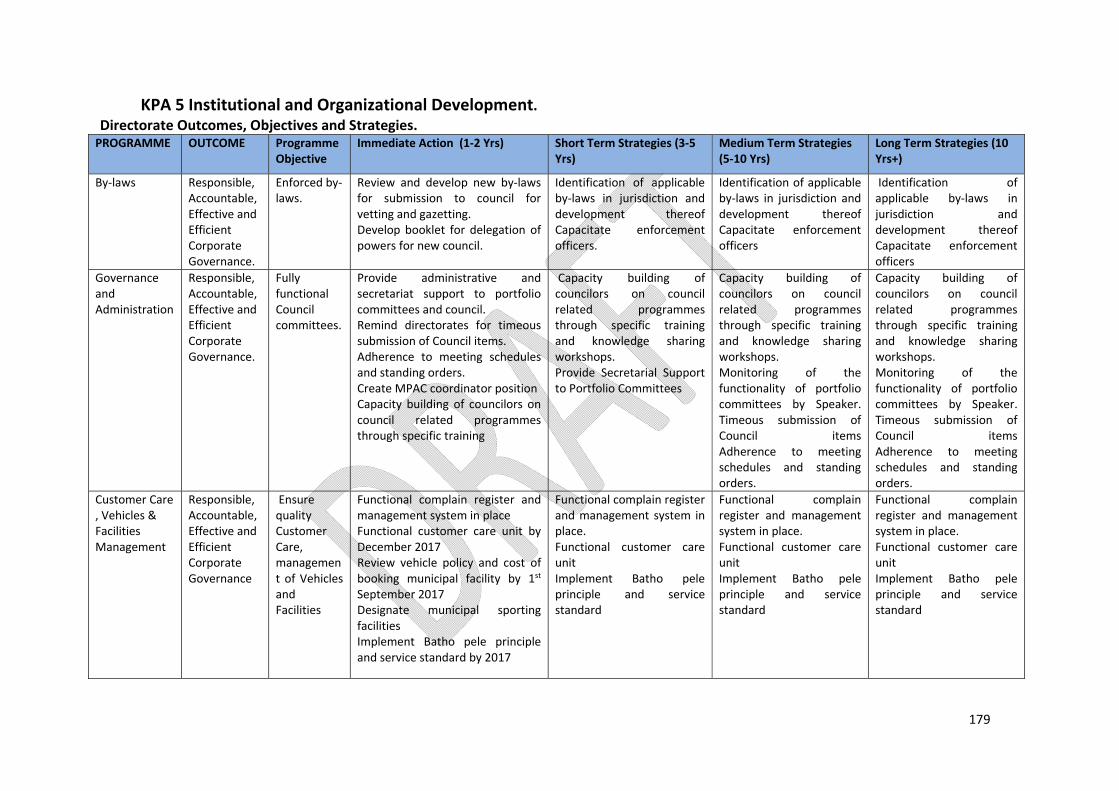
179
KPA 5 Institutional and Organizational Development. Directorate Outcomes, Objectives and Strategies. PROGRAMME OUTCOME Programme
Objective Immediate Action (1‐2 Yrs) Short Term Strategies (3‐5
Yrs) Medium Term Strategies (5‐10 Yrs)
Long Term Strategies (10 Yrs+)
By‐laws
Responsible, Accountable, Effective and Efficient Corporate Governance.
Enforced by‐laws.
Review and develop new by‐laws for submission to council for vetting and gazetting. Develop booklet for delegation of powers for new council.
Identification of applicable by‐laws in jurisdiction and development thereof Capacitate enforcement officers.
Identification of applicable by‐laws in jurisdiction and development thereofCapacitate enforcement officers
Identification of applicable by‐laws in jurisdiction and development thereof Capacitate enforcement officers
Governance and Administration
Responsible, Accountable, Effective and Efficient Corporate Governance.
Fully functional Council committees.
Provide administrative and secretariat support to portfolio committees and council. Remind directorates for timeous submission of Council items. Adherence to meeting schedules and standing orders. Create MPAC coordinator position Capacity building of councilors on council related programmes through specific training
Capacity building of councilors on council related programmes through specific training and knowledge sharing workshops. Provide Secretarial Support to Portfolio Committees
Capacity building of councilors on council related programmes through specific training and knowledge sharing workshops. Monitoring of the functionality of portfolio committees by Speaker.Timeous submission of Council itemsAdherence to meeting schedules and standing orders.
Capacity building of councilors on council related programmes through specific training and knowledge sharing workshops. Monitoring of the functionality of portfolio committees by Speaker. Timeous submission of Council items Adherence to meeting schedules and standing orders.
Customer Care , Vehicles & Facilities Management
Responsible, Accountable, Effective and Efficient Corporate Governance
Ensure quality Customer Care, management of Vehicles and Facilities
Functional complain register and management system in place Functional customer care unit by December 2017 Review vehicle policy and cost of booking municipal facility by 1st September 2017 Designate municipal sporting facilities Implement Batho pele principle and service standard by 2017
Functional complain register and management system in place. Functional customer care unit Implement Batho pele principle and service standard
Functional complain register and management system in place. Functional customer care unit Implement Batho pele principle and service standard
Functional complain register and management system in place. Functional customer care unit Implement Batho pele principle and service standard

180
PROGRAMME OUTCOME Programme Objective
Immediate Action (1‐2 Yrs) Short Term Strategies (3‐5 Yrs)
Medium Term Strategies (5‐10 Yrs)
Long Term Strategies (10 Yrs+)
Human Resource Management
Responsible, Accountable, Effective and Efficient Corporate governance
Competent and skilled workforce
Review organizational structure and institutional study. Introduce and implement competency tests for appointment of all managers L1‐2 by 1st July 2017 and all level 3‐4 by 1st July 2018. Provide training to executive, divisional managers and supervisors on code of conduct, DC procedure and HR related issues. Implement employment equity. Conclude job evaluation by December 2017
Develop competency requirement for all levels. Align powers and functions in terms of the institutional study and review the study by June 2018. Arrange change management sessions by June 2018. Have approved HR strategy by July 2018. Conclude and implement Job Evaluation by December 2018. Arrange Annual Team Building sessions yearly.
During annual review of the organizational structure, ensure that new positions are aligned to the recommendations of the institutional study.Verification of qualifications. Review HR recruitment policy annually. To appoint people who can build and manage a city. Acquisition of a HR information system.
During annual review of the organizational structure, ensure that new positions are aligned to the recommendations of the institutional study. Review institutional study Verification of qualifications. Review HR recruitment policy annually To appoint people who can build and manage a city.
IT and support
Responsible, Accountable, Effective and Efficient Corporate Governance.
Business intelligence.
Implement IT Governance framework phase 1 deliverables by 2018/19. Ensure running of Municipal ICT information systems, applications, servers and computer network. Offer support to Municipal computer users. Implementation of the mSCOA ICT assessment report (procurement of software and hardware).
Implement IT Governance framework phase 2 & 3 deliverables by 2019/20.Capacitate IT unit with more support staff.
Continuously capacitate the unit and upgrade electronic systems and hardware. Implement IT Governance framework phase2 and 3 Continuous enhancement of municipal corporate governance of information technology
Continuously capacitate the unit and upgrade electronic systems and hardware. Continuous enhancement of municipal corporate governance of information technology

181
PROGRAMME OUTCOME Programme Objective
Immediate Action (1‐2 Yrs) Short Term Strategies (3‐5 Yrs)
Medium Term Strategies (5‐10 Yrs)
Long Term Strategies (10 Yrs+)
Labour Relations
Responsible, Accountable, Effective and Efficient Corporate Governance.
Disciplined and productive workforce.
Enforce code of conduct and disciplinary code. Reduce grievances, disputes and locally initiated labour action. Train Executives, Managers, Managers and supervisors code of conduct disciplinary code and HR related issues. Arrange annual labour relations workshop for officials.
Create awareness amongst staff on code of conduct. Ensure that grievances are resolved speedily. Executive Managers ,Managers and supervisors to undergo Management Development Programme.
Having regular LLF meetings. Create awareness amongst staff on code of conduct. Ensure that grievances are resolved speedily. Enforcing discipline.Application of disciplinary procedures and actions.
Having regular LLF meetings. Create awareness amongst staff on code of conduct. Ensure that grievances are resolved speedily Enforcing discipline. Application of disciplinary procedures and actions. Annual team building sessions.
Employee Assistance Programme (EAP)
Responsible, Accountable, Effective and Efficient Corporate Governance.
Productive and well balanced workforce.
Calculate the overall employee satisfaction rating obtained from all completed survey forms. Develop and review EAP policies and submit for council approval. Arrange annual team building sessions. Implement wellness programme. Create awareness on EAP services available
Implementation of EAP Policy Arrange annual team building sessions. Development and implement change management strategy.
Review and implementation of EAP Policy. Arrange annual team building sessions.
Implementation of EAP Policy.
Occupation Health and Safety
Responsible, Accountable, Effective and Efficient Corporate Governance.
Safe working environment
Ensure compliance to the Occupational Health and Safety Act. Conduct Occupational Health and Safety audit. Conducting evacuation training and drills every six months. Conduct training with staff working at heights.Training parks personnel on pest control.
Training Executive Managers, Divisional Managers and Supervisors, incident investigators and safety reps on OHS matters.Conducting evacuation training and drills every six months. Conduct training with staff working at heights.
Training Executive Managers, Divisional Managers and Supervisors, incident investigators and safety reps on OHS matters. Conducting evacuation training and drills every six months. Conduct training with staff working at heights.
Training Executive Managers, Divisional Managers and Supervisors, incident investigators and safety reps on OHS matters. Conducting evacuation training and drills every six months. Conduct training with staff working at heights. Establishment of a pest control unit.

182
PROGRAMME OUTCOME Programme Objective
Immediate Action (1‐2 Yrs) Short Term Strategies (3‐5 Yrs)
Medium Term Strategies (5‐10 Yrs)
Long Term Strategies (10 Yrs+)
Property Management
Responsible, Accountable, Effective and Efficient Corporate Governance.
Sustainable fixed assets
Conduct land enquiry on Municipal property and ownership in general.
Facilitate name change of streets and amenities.Review and implement property management policy.
Facilitate acquisition of land for building a city.
Efficient management of municipal property.
Records and Archiving
Responsible, Accountable, Effective and Efficient Corporate governance
Improved and informed decision making.
Ensure safe keeping of council documentation at all times. Archiving and record keeping of municipal documents. Classification of information to ensure safety of documentations. Compile procedure manual for records and archiving
Induct new employee on archiving processes.Automation of archiving system, including proper management information system. Provide effective and safe storage space for documentation.
Implementation of the MunAdmin electronic system in phases.
Fully fledged integrated and automated information and archiving system.
Legal Services Responsible, Accountable, Effective and Efficient Corporate Governance.
Accountable and responsible administration.
Minimise unwarranted litigations and legal costs. Decrease percentage of litigation cases against the municipality negotiated for settlement per year. Percentage of SLA drafted within 2 weeks of receipt of request from date of submission.
Conduct Legal information dissemination workshops with all relevant officials annually. Support municipal department on compliance to legislation.
To develop and implement control measures to ensure compliance with legislation. Develop plan to reduce litigation and costs.
Continuous assistance to other directorates with the drafting and review of by‐laws and policies as and when it is required.
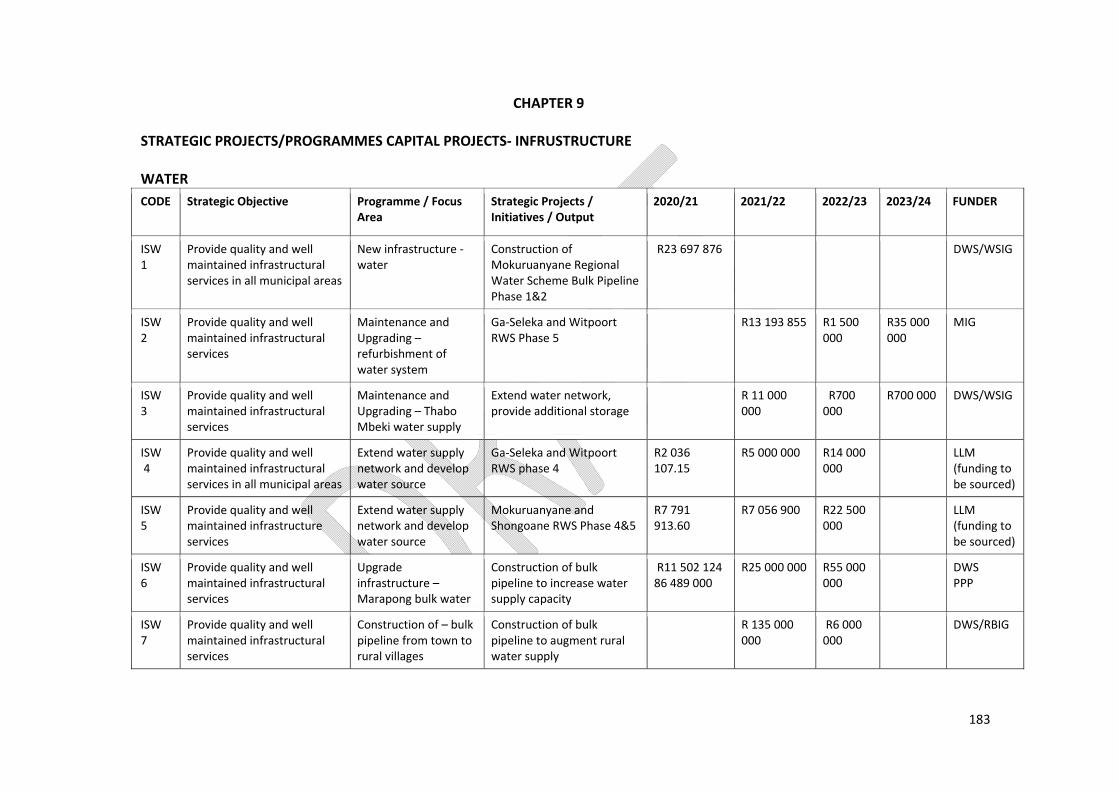
183
CHAPTER 9 STRATEGIC PROJECTS/PROGRAMMES CAPITAL PROJECTS‐ INFRUSTRUCTURE WATER CODE Strategic Objective Programme / Focus
Area Strategic Projects / Initiatives / Output
2020/21 2021/22 2022/23 2023/24 FUNDER
ISW 1
Provide quality and well maintained infrastructural services in all municipal areas
New infrastructure ‐water
Construction of Mokuruanyane Regional Water Scheme Bulk Pipeline Phase 1&2
R23 697 876 DWS/WSIG
ISW 2
Provide quality and well maintained infrastructural services
Maintenance and Upgrading –refurbishment of water system
Ga‐Seleka and Witpoort RWS Phase 5
R13 193 855 R1 500 000
R35 000 000
MIG
ISW 3
Provide quality and well maintained infrastructural services
Maintenance and Upgrading – Thabo Mbeki water supply
Extend water network, provide additional storage
R 11 000 000
R700 000
R700 000 DWS/WSIG
ISW 4
Provide quality and well maintained infrastructural services in all municipal areas
Extend water supply network and develop water source
Ga‐Seleka and Witpoort RWS phase 4
R2 036 107.15
R5 000 000 R14 000 000
LLM(funding to be sourced)
ISW 5
Provide quality and well maintained infrastructure services
Extend water supply network and develop water source
Mokuruanyane and Shongoane RWS Phase 4&5
R7 791 913.60
R7 056 900 R22 500 000
LLM(funding to be sourced)
ISW 6
Provide quality and well maintained infrastructural services
Upgrade infrastructure – Marapong bulk water
Construction of bulk pipeline to increase water supply capacity
R11 502 12486 489 000
R25 000 000 R55 000 000
DWSPPP
ISW 7
Provide quality and well maintained infrastructural services
Construction of – bulk pipeline from town to rural villages
Construction of bulk pipeline to augment rural water supply
R 135 000 000
R6 000 000
DWS/RBIG
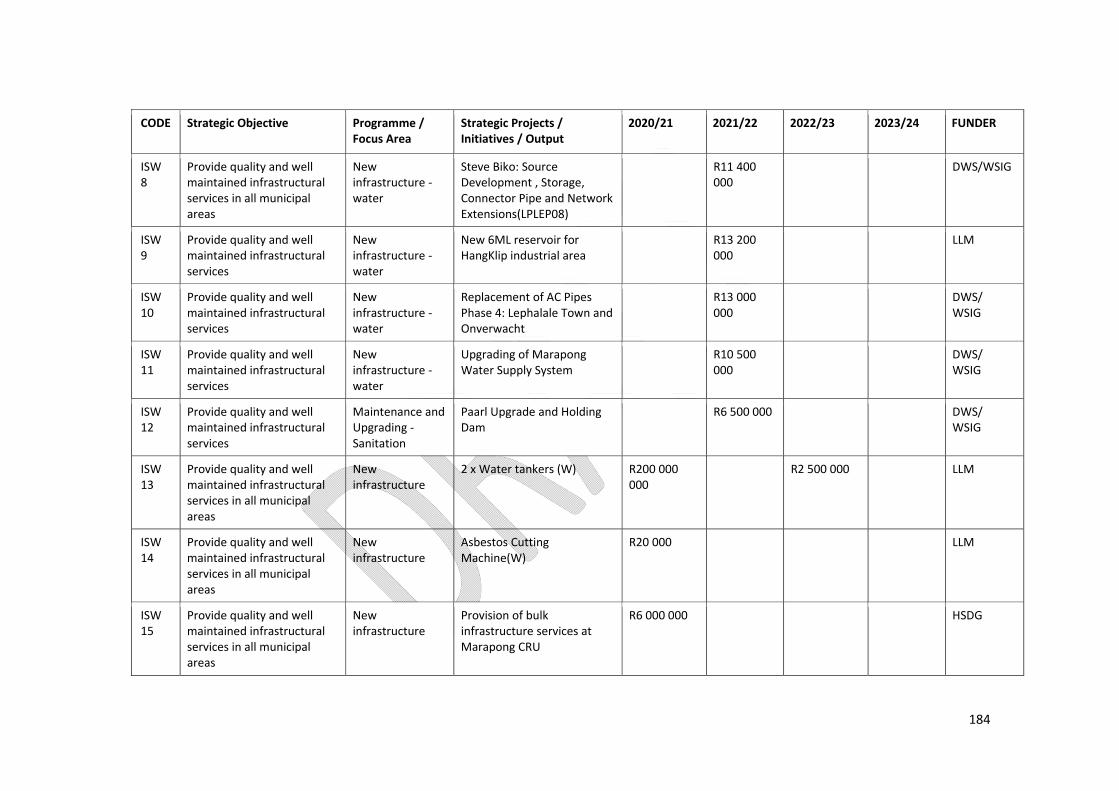
184
CODE Strategic Objective Programme /
Focus Area Strategic Projects / Initiatives / Output
2020/21 2021/22 2022/23 2023/24 FUNDER
ISW 8
Provide quality and well maintained infrastructural services in all municipal areas
New infrastructure ‐ water
Steve Biko: Source Development , Storage, Connector Pipe and Network Extensions(LPLEP08)
R11 400 000
DWS/WSIG
ISW 9
Provide quality and well maintained infrastructural services
New infrastructure ‐ water
New 6ML reservoir for HangKlip industrial area
R13 200 000
LLM
ISW 10
Provide quality and well maintained infrastructural services
New infrastructure ‐ water
Replacement of AC Pipes Phase 4: Lephalale Town and Onverwacht
R13 000 000
DWS/ WSIG
ISW 11
Provide quality and well maintained infrastructural services
New infrastructure ‐ water
Upgrading of Marapong Water Supply System
R10 500 000
DWS/ WSIG
ISW 12
Provide quality and well maintained infrastructural services
Maintenance and Upgrading ‐ Sanitation
Paarl Upgrade and Holding Dam
R6 500 000 DWS/ WSIG
ISW 13
Provide quality and well maintained infrastructural services in all municipal areas
New infrastructure
2 x Water tankers (W) R200 000 000
R2 500 000 LLM
ISW 14
Provide quality and well maintained infrastructural services in all municipal areas
New infrastructure
Asbestos Cutting Machine(W)
R20 000 LLM
ISW 15
Provide quality and well maintained infrastructural services in all municipal areas
New infrastructure
Provision of bulk infrastructure services at Marapong CRU
R6 000 000 HSDG
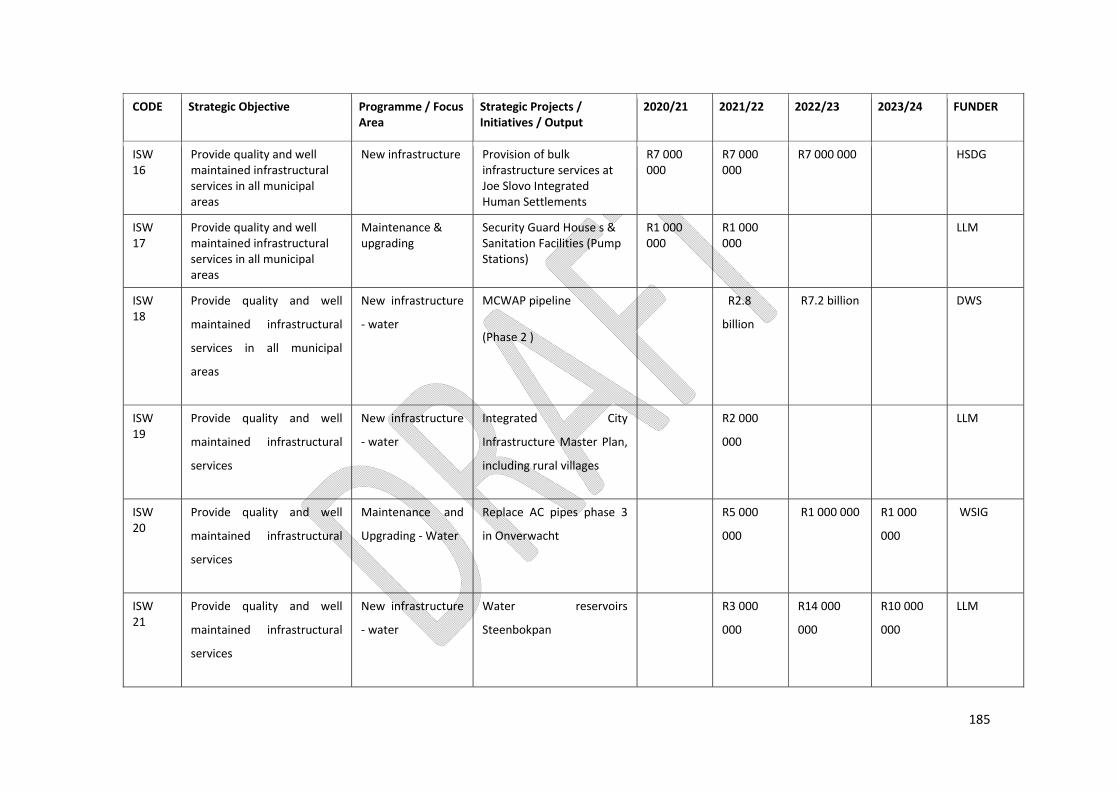
185
CODE Strategic Objective Programme / Focus Area
Strategic Projects / Initiatives / Output
2020/21 2021/22 2022/23 2023/24 FUNDER
ISW 16
Provide quality and well maintained infrastructural services in all municipal areas
New infrastructure Provision of bulk infrastructure services at Joe Slovo Integrated Human Settlements
R7 000 000
R7 000 000
R7 000 000 HSDG
ISW 17
Provide quality and well maintained infrastructural services in all municipal areas
Maintenance & upgrading
Security Guard House s & Sanitation Facilities (Pump Stations)
R1 000 000
R1 000 000
LLM
ISW 18
Provide quality and well
maintained infrastructural
services in all municipal
areas
New infrastructure
‐ water
MCWAP pipeline
(Phase 2 )
R2.8
billion
R7.2 billion
DWS
ISW 19
Provide quality and well
maintained infrastructural
services
New infrastructure
‐ water
Integrated City
Infrastructure Master Plan,
including rural villages
R2 000
000
LLM
ISW 20
Provide quality and well
maintained infrastructural
services
Maintenance and
Upgrading ‐ Water
Replace AC pipes phase 3
in Onverwacht
R5 000
000
R1 000 000 R1 000
000
WSIG
ISW 21
Provide quality and well
maintained infrastructural
services
New infrastructure
‐ water
Water reservoirs
Steenbokpan
R3 000
000
R14 000
000
R10 000
000
LLM

186
CODE Strategic Objective Programme / Focus Area
Strategic Projects / Initiatives / Output
2020/21 2021/22 2022/23 2023/24 FUNDER
ISW 22
Provide quality and well
maintained infrastructural
services in all municipal
areas
Water Service
Development Plan
Review of the Water
Service Development Plan
R3 000
000
R6 000 000 LLM
ROADS CODE Strategic Objective Programme / Focus
Area Strategic Projects / Initiatives / Output
2020/21 2021/22 2022/23 2023/24 FUNDER
ISR 1
Provide quality and well maintained infrastructural services
Maintenance Upgrading roads, storm water
Nikara access roads. R23 378 473
MIG
ISR 2
Provide quality and well maintained infrastructural services
Public works Extension of civic centre building(roof replacement)
R16 000 000
R16 000 000
LLM
ISR 3
Provide quality and well maintained infrastructural services in all municipal areas
Maintenance and Upgrading ‐ roads and storm water
Phahladira access road phase 2
R27 000 000
R20 468 407
MIG
ISR 4
Provide quality and well maintained infrastructural services
Maintenance and Upgrading ‐ roads and storm water
OR Tambo avenue dual lane from R33 junction to R518 junction
R40 000 000
PPP
ISR 5
Provide quality and well maintained infrastructural services in all municipal areas
Maintenance and Upgrading ‐ roads and storm water
Northern by‐pass Marapong to R510
R90 000 000
R31 000000
R60 000 000
RAL

187
CODE Strategic Objective Programme / Focus
Area Strategic Projects / Initiatives / Output
2020/21 2021/22 2022/23 2023/24 FUNDER
ISR 6
Provide quality and well maintained infrastructural services in all municipal areas
Maintenance and Upgrading ‐ roads and storm water
Southern by‐pass Onverwacht to R510
R86 000 000
R86 000 000
RAL/PPP
ISR 7
Provide quality and well maintained infrastructural services in all municipal areas
Maintenance and Upgrading ‐ roads and storm water
Phase 5 ‐ Storm water open channel from Onverwacht to Lephalale
R 7 000 000
LLM
ISR 8
Provide quality and well maintained infrastructural services in all municipal areas
Maintenance and Upgrading ‐ roads and storm water
Steve Biko Access road R10 000 000
MIG
ISR 9
Provide quality and well maintained infrastructural services
Maintenance and Upgrading – Onverwacht internal road system
Reconstruction of internal roads at Onverwacht
R50 000 000
R50 000 000
R50 000 000 PPP
ISR 10
Provide quality and well maintained infrastructural services in all municipal areas
Upgrading ‐ roads and storm water
Upgrade of road D1754 & D3109 Kitty,Dipompong to Mokuruanyane
R30 000 000
R40 000 000
PPP
ISR 11
Provide quality and well maintained infrastructural services in all municipal areas
Maintenance and Upgrading ‐ roads and storm water
Melville access road (Shongoane 1)
R8 407 650
MIG
ISR 12
Provide quality and well maintained infrastructural services in all municipal areas
New infrastructure ‐roads and storm water
Marapong 2nd Phase access road
R20 000 000
R20 000 000
PPP
ISR 13
Provide quality and well maintained infrastructural services in all municipal areas
New infrastructure ‐roads and storm water
Marapong storm water – Marapong CRU housing to existing storm water channel
R 4 000 000
MIG/PPP
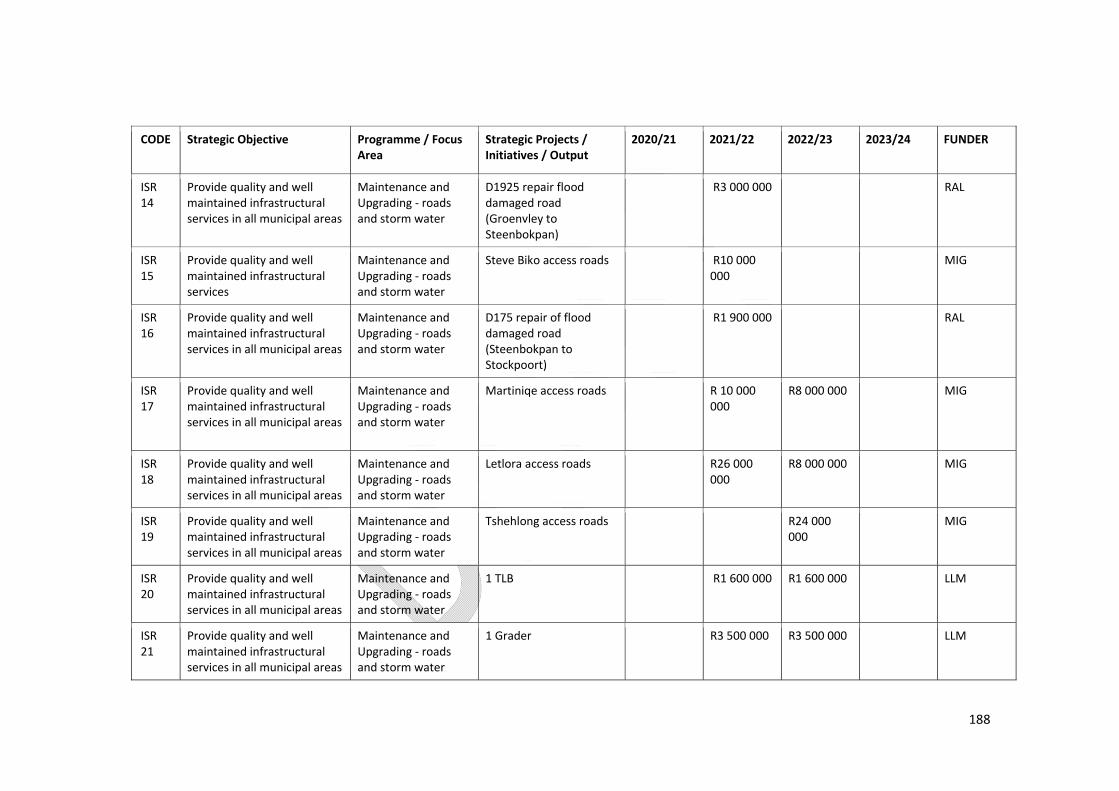
188
CODE Strategic Objective Programme / Focus
Area Strategic Projects / Initiatives / Output
2020/21 2021/22 2022/23 2023/24 FUNDER
ISR 14
Provide quality and well maintained infrastructural services in all municipal areas
Maintenance and Upgrading ‐ roads and storm water
D1925 repair flood damaged road (Groenvley to Steenbokpan)
R3 000 000 RAL
ISR 15
Provide quality and well maintained infrastructural services
Maintenance and Upgrading ‐ roads and storm water
Steve Biko access roads R10 000 000
MIG
ISR 16
Provide quality and well maintained infrastructural services in all municipal areas
Maintenance and Upgrading ‐ roads and storm water
D175 repair of flood damaged road (Steenbokpan to Stockpoort)
R1 900 000 RAL
ISR 17
Provide quality and well maintained infrastructural services in all municipal areas
Maintenance and Upgrading ‐ roads and storm water
Martiniqe access roads R 10 000 000
R8 000 000 MIG
ISR 18
Provide quality and well maintained infrastructural services in all municipal areas
Maintenance and Upgrading ‐ roads and storm water
Letlora access roads R26 000 000
R8 000 000 MIG
ISR 19
Provide quality and well maintained infrastructural services in all municipal areas
Maintenance and Upgrading ‐ roads and storm water
Tshehlong access roads R24 000 000
MIG
ISR 20
Provide quality and well maintained infrastructural services in all municipal areas
Maintenance and Upgrading ‐ roads and storm water
1 TLB R1 600 000
R1 600 000 LLM
ISR 21
Provide quality and well maintained infrastructural services in all municipal areas
Maintenance and Upgrading ‐ roads and storm water
1 Grader R3 500 000 R3 500 000 LLM
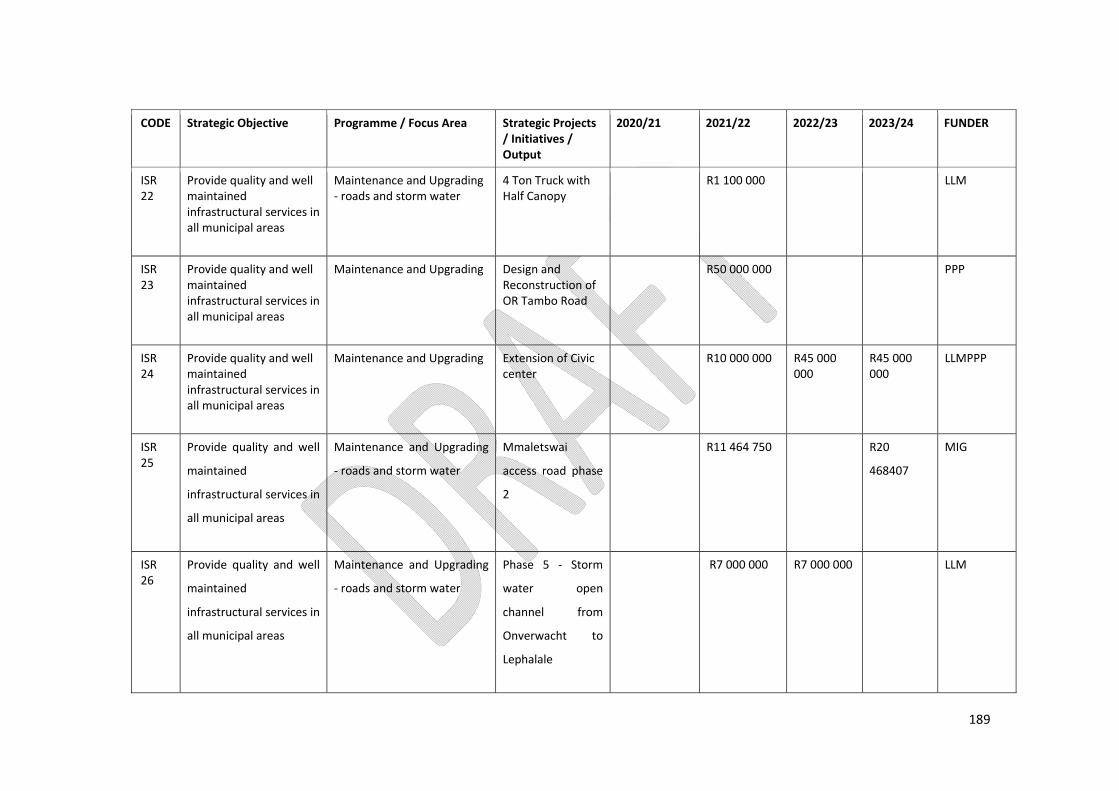
189
CODE Strategic Objective Programme / Focus Area Strategic Projects
/ Initiatives / Output
2020/21 2021/22 2022/23 2023/24 FUNDER
ISR 22
Provide quality and well maintained infrastructural services in all municipal areas
Maintenance and Upgrading ‐ roads and storm water
4 Ton Truck with Half Canopy
R1 100 000 LLM
ISR 23
Provide quality and well maintained infrastructural services in all municipal areas
Maintenance and Upgrading Design and Reconstruction of OR Tambo Road
R50 000 000 PPP
ISR 24
Provide quality and well maintained infrastructural services in all municipal areas
Maintenance and Upgrading Extension of Civic center
R10 000 000 R45 000 000
R45 000 000
LLMPPP
ISR 25
Provide quality and well
maintained
infrastructural services in
all municipal areas
Maintenance and Upgrading
‐ roads and storm water
Mmaletswai
access road phase
2
R11 464 750 R20
468407
MIG
ISR 26
Provide quality and well
maintained
infrastructural services in
all municipal areas
Maintenance and Upgrading
‐ roads and storm water
Phase 5 ‐ Storm
water open
channel from
Onverwacht to
Lephalale
R7 000 000 R7 000 000 LLM
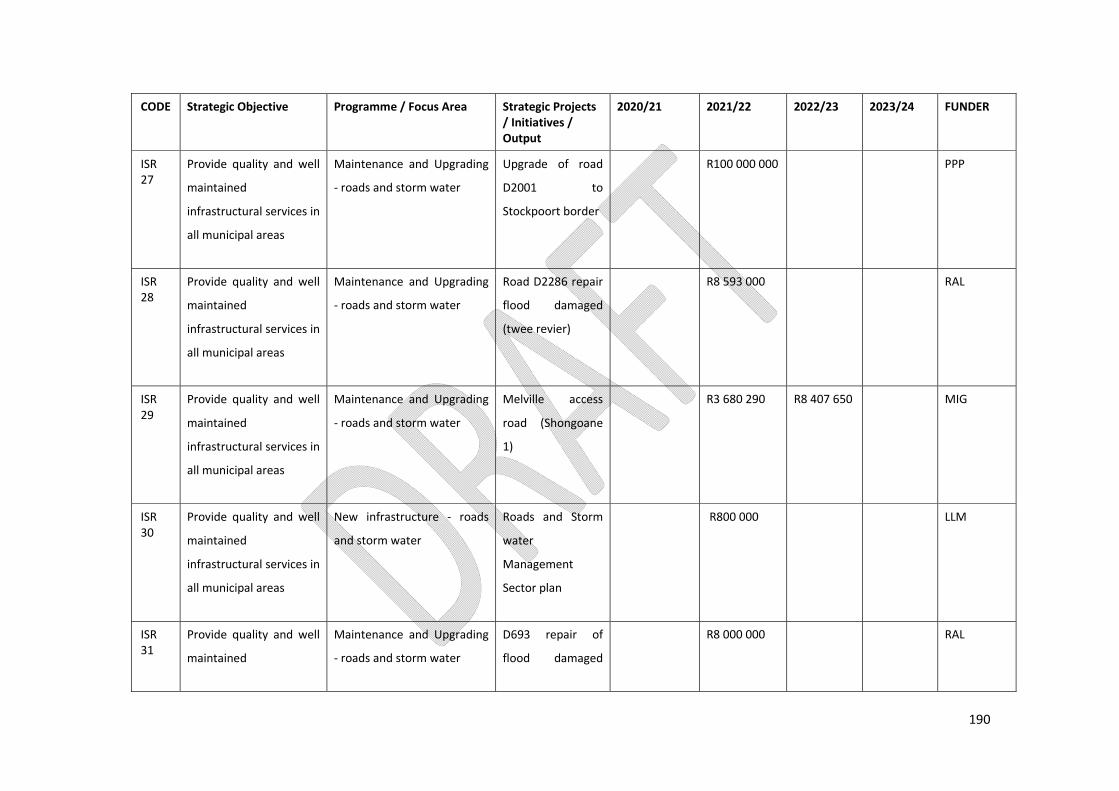
190
CODE Strategic Objective Programme / Focus Area Strategic Projects / Initiatives / Output
2020/21 2021/22 2022/23 2023/24 FUNDER
ISR 27
Provide quality and well
maintained
infrastructural services in
all municipal areas
Maintenance and Upgrading
‐ roads and storm water
Upgrade of road
D2001 to
Stockpoort border
R100 000 000 PPP
ISR 28
Provide quality and well
maintained
infrastructural services in
all municipal areas
Maintenance and Upgrading
‐ roads and storm water
Road D2286 repair
flood damaged
(twee revier)
R8 593 000 RAL
ISR 29
Provide quality and well
maintained
infrastructural services in
all municipal areas
Maintenance and Upgrading
‐ roads and storm water
Melville access
road (Shongoane
1)
R3 680 290 R8 407 650 MIG
ISR 30
Provide quality and well
maintained
infrastructural services in
all municipal areas
New infrastructure ‐ roads
and storm water
Roads and Storm
water
Management
Sector plan
R800 000 LLM
ISR 31
Provide quality and well
maintained
Maintenance and Upgrading
‐ roads and storm water
D693 repair of
flood damaged
R8 000 000 RAL
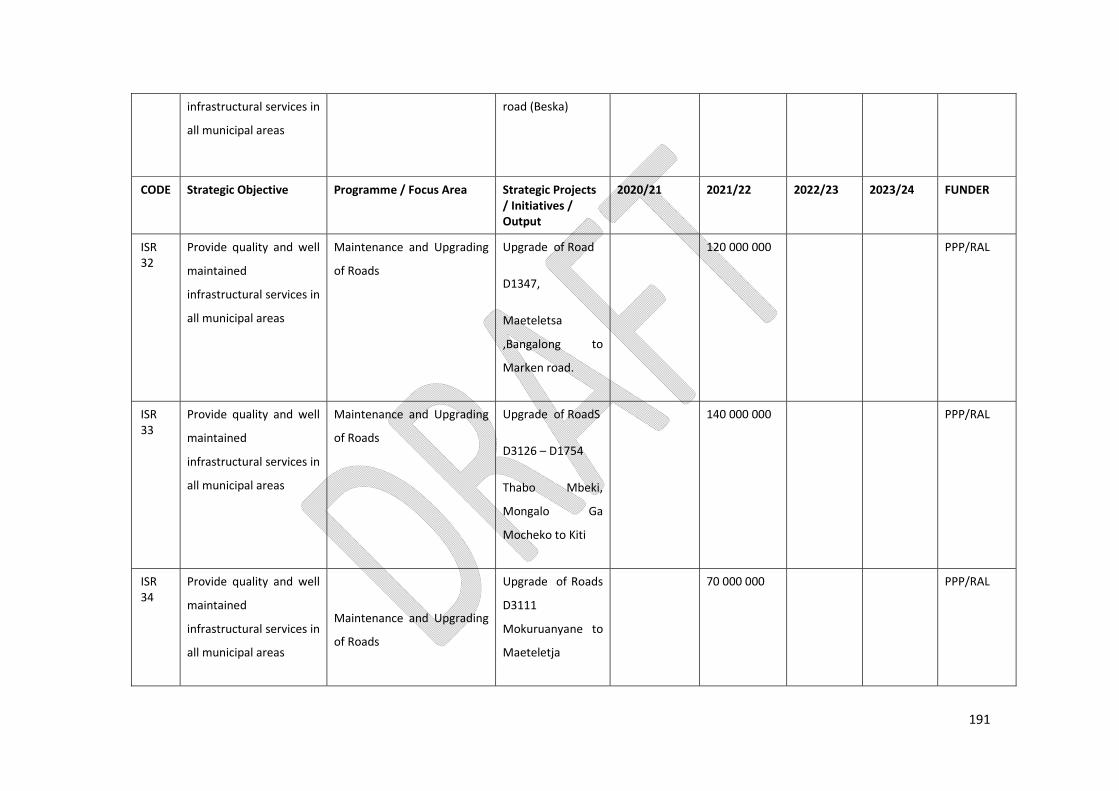
191
infrastructural services in
all municipal areas
road (Beska)
CODE Strategic Objective Programme / Focus Area Strategic Projects / Initiatives / Output
2020/21 2021/22 2022/23 2023/24 FUNDER
ISR 32
Provide quality and well
maintained
infrastructural services in
all municipal areas
Maintenance and Upgrading
of Roads
Upgrade of Road
D1347,
Maeteletsa
,Bangalong to
Marken road.
120 000 000 PPP/RAL
ISR 33
Provide quality and well
maintained
infrastructural services in
all municipal areas
Maintenance and Upgrading
of Roads
Upgrade of RoadS
D3126 – D1754
Thabo Mbeki,
Mongalo Ga
Mocheko to Kiti
140 000 000 PPP/RAL
ISR 34
Provide quality and well
maintained
infrastructural services in
all municipal areas
Maintenance and Upgrading
of Roads
Upgrade of Roads
D3111
Mokuruanyane to
Maeteletja
70 000 000 PPP/RAL

192
CODE Strategic Objective Programme / Focus Area Strategic Projects / Initiatives / Output
2020/21 2021/22 2022/23 2023/24 FUNDER
ISR 35
Provide quality and well
maintained
infrastructural services in
all municipal areas
Maintenance and Upgrading
of Roads
Upgrade of Road
D1754
Mokuruanyane to
Melinda
140 000 000 PPP/RAL
ISR 36
Provide quality and well
maintained
infrastructural services in
all municipal areas
Maintenance and Upgrading
of Roads
Thabo Mbeki
Ext 2
100 000 000 LLM/PPP

193
ELECTRICITY CODE Strategic Objective Programme / Focus
Area Strategic Projects / Initiatives / Output
2020/21 2021/22 2022/23 2023/24 FUNDER
ISE 1
Provide quality and well maintained infrastructural services in all municipal areas
Maintenance & Uprade
Construction of king bird line from Onverwacht to Town, Substation 4, 5, & 6
R25 000 000 R50 000 000 LLM
ISE 2
Provide quality and well maintained infrastructural services in all municipal areas
New infrastructure Procure 800 KVA generator
R1.8 000 000 LLM
ISE 3
Provide quality and well maintained infrastructural services in all municipal areas
Maintenance & upgrading
Cable Fault Detector(E)
R2 500 000 LLM
ISE 4
Provide quality and well maintained infrastructural services in all municipal areas
Maintenance & upgrading
Electrification at various villages
R10 000 000 INEP
ISE 5
Provide quality and well maintained infrastructural services in all municipal areas
Maintenance & upgrading
Installation of high mast lights in various villages
R10 000 000 MIG
ISE 6
Provide quality and well
maintained infrastructural
services in all municipal
areas
New infrastructure
‐ electricity
Upgrade internal network R4 000 000 R 3 000 000 R2 000
000
LLM
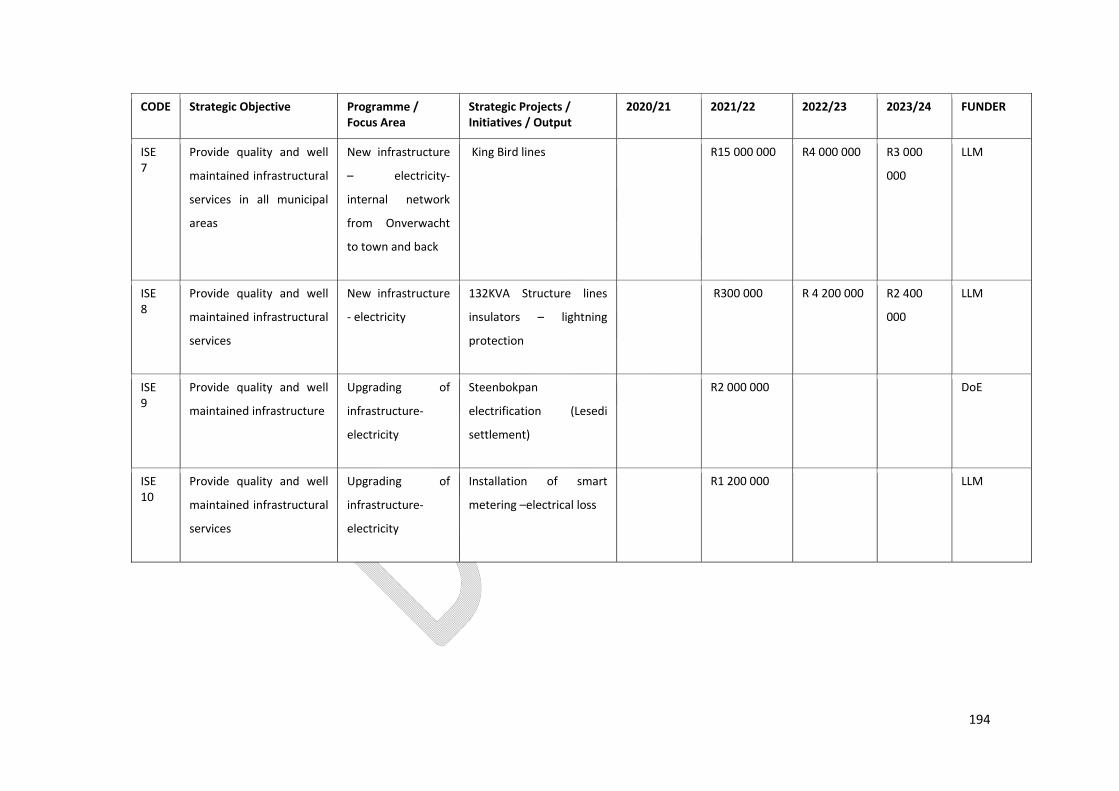
194
CODE Strategic Objective Programme / Focus Area
Strategic Projects / Initiatives / Output
2020/21 2021/22 2022/23 2023/24 FUNDER
ISE 7
Provide quality and well
maintained infrastructural
services in all municipal
areas
New infrastructure
– electricity‐
internal network
from Onverwacht
to town and back
King Bird lines R15 000 000 R4 000 000 R3 000
000
LLM
ISE 8
Provide quality and well
maintained infrastructural
services
New infrastructure
‐ electricity
132KVA Structure lines
insulators – lightning
protection
R300 000 R 4 200 000 R2 400
000
LLM
ISE 9
Provide quality and well
maintained infrastructure
Upgrading of
infrastructure‐
electricity
Steenbokpan
electrification (Lesedi
settlement)
R2 000 000 DoE
ISE 10
Provide quality and well
maintained infrastructural
services
Upgrading of
infrastructure‐
electricity
Installation of smart
metering –electrical loss
R1 200 000
LLM

195
SANITATION CODE Strategic Objective Programme /
Focus Area Strategic Projects / Initiatives / Output
2020/21 2021/22 2022/23 2023/24 FUNDER
ISS I
Provide quality and well maintained infrastructural services in all municipal areas
New infrastructure
Procure Jetvac honey sucker (S)
R6 000 000 LLM
ISS 2
Provide quality and well maintained infrastructural services in all municipal areas
New infrastructure
Honey sucker(S) R1 200 000 LLM
ISS 3
Provide quality and well maintained infrastructural services in all municipal areas
Maintenance & upgrading
Pump station 1 & 23 and part of Paarl upgrading
R11 000 000 PPP
ISS 4
Provide quality and well maintained infrastructural services in all municipal areas
Maintenance & upgrading
Upgrading of pumpstation 13 & 22
R13 000 000 PPP
ISS 5
Provide quality and well maintained infrastructural services in all municipal areas
Maintenance & upgrading
Marapong Oxidation Pond (reduction of sludge and clearing of vegetation)
R300 000 LLM
ISS 6
Provide quality and well maintained infrastructural services in all municipal areas
Maintenance & upgrading
Upgrade of Emergency holding Dam for Paarl
R1 500 000 WSIG
ISS 7
Provide quality and well maintained infrastructural services in all municipal areas
New infrstructure
Design & Installation of Infrastructure bulk service of Thabo Mbeki Ext 2
R10 000 000 R10 000 000
R10 000 000
MIG/ WSIG
ISS 8
Provide quality and well maintained infrastructural services in all municipal areas
Maintenance & upgrading
Re‐engineering and upgrade of pump stations
R40 000 000
R40 000 000
WSIG

196
CODE Strategic Objective Programme / Focus Area
Strategic Projects / Initiatives / Output
2020/21 2021/22 2022/23 2023/24 FUNDER
ISS 9
Provide quality and well maintained infrastructural services in all municipal areas
Maintenance & upgrading
Replacement of sewer AC Pipes in Onverwacht
R10 000 000 R10 000 000
WSIG
ISS 10
Provide quality and well maintained infrastructural services
Maintenance and Upgrading ‐ Sanitation
Zongesien Waste Water Treatment Works
R7 000 000 DWS/ WSIG
ISS 11
Provide quality and well maintained infrastructural services in all municipal areas
Maintenance & Upgrade
To conduct a technical assessment in all rural areas (VIP Toilets)
R1 500 000 R2 000 000 LLM
SS 12
Provide quality and well
maintained infrastructural
services in all municipal areas
infrastructure ‐
water
Borehole development,
storage, connector pipe
and network extension
(Mohlasedi)
R4 084 416 R1 000
000
R350 000 LLM
SS 13
Provide quality and well
maintained infrastructural
services in all municipal areas
Maintenance
and Upgrading ‐
Sanitation
Old Paarl Waste Water
Plant – Upgrade
capacity
R15 000
000
LLM
SS 14
Provide quality and well
maintained infrastructural
services
Maintenance
and Upgrading ‐
Sanitation
Re‐engineering of
sewer network
(necessary) phase 2
R5 000 000 R5 000
0000
DWA
SS 15
Provide quality and well
maintained infrastructural
Maintenance
and Upgrading –
Thabo Mbeki Sewer
Network Sanitation
R7 550 000 R10 612
713
MIG

197
services Sanitation Phase2
CODE Strategic Objective Programme / Focus Area
Strategic Projects / Initiatives / Output
2020/21 2021/22 2022/23 2023/24 FUNDER
SS 16
Provide quality and well
maintained infrastructural
services
New
infrastructure –
rural VIP toilets
Construction of VIP'S:
Sanitation projects in
various villages,
Shongoane scheme
R2 0000
000
DWS
SS 17
Provide quality and well
maintained infrastructural
services in all municipal areas
New
infrastructure–
Upgrade
Zongesien
WWTW
Upgrading of sewer
ponds to activated
sludge plant
R17 500
000
R3 500
000
PPP
SS 18
Provide quality and well
maintained infrastructural
services
Maintenance
and Upgrading ‐
Sanitation
Feasibility for location
of new 12ML sewage
works at Steenbokpan
R1 000 000 LLM
SS 19
Provide quality and well
maintained infrastructural
services
Maintenance
and Upgrading ‐
Sanitation
Develop sanitation
master plan for the
entire municipal area
R1 800 000 LLM
SS 20
Provide quality and well Maintenance Installation of irrigation R800 000 LLM

198
maintained infrastructural
services
and Upgrading ‐
Sanitation
system at Paarl sewer
plant
CODE Strategic Objective Programme / Focus Area
Strategic Projects / Initiatives / Output
2020/21 2021/22 2022/23 2023/24 FUNDER
SS 21
Provide quality and well
maintained infrastructural
services in all municipal areas
Maintenance
and Upgrading ‐
Sanitation
Two pipelines
replacement from
pump station no. 1 to
Paarl WWTW
R1 000 000 R7 000
000
LLM
SS 22
Provide quality and well
maintained infrastructural
services
Maintenance
Upgrading
roads, storm
water
Mokuruanyane access
roads (Tshehlong)
R3 378
473
MIG

199
STRATEGIC PROJECTS/PROGRAMMES CAPITAL PROJECTS‐ SOCIAL SERVICES
CODE Strategic Objective Programme / Focus Area
Strategic Projects / Initiatives / Output
2020/21 2021/22 2022/23 2023/24 FUNDER
SS 1
Protect the environment and improve community
Environmental Management
EPWP –capacitate disadvantaged groups
R1 584 000 R1 669 536 EPWP
SS 2
Protect the environment and improve community well‐being
Environmental Management
30 x 30 x 3cubic meter skip bins‐ for appropriate waste storage in the transfer stations
R1 600 000 R3 800 000 R4 200 000 R4 500 000 LLM
SS 3
Protect the environment and improve community well‐being
Environmental Management
2 x Grab Lorry‐ collection of carcasses on the road reserve
R4 000 000 R4 500 000 R5 000 000 LLM
SS 4
Protect the environment and improve community
Environmental Management
2 x Roll‐on‐Roll‐off trucks R4 000 000 R4 200 000 R4 500 000 LLM
SS 5
Protect the environment and improve community
Environmental Management
200 x Street litter bins R400 000 R420 000 R450 000 LLM
SS 6
Protect the environment and improve community well‐being
Environmental Management
Acquisition of 50 x 6 cubic meter skip bins
R950 000 R1 000 000 R1 100 000 LLM
SS 7
Protect the environment and improve community well‐being
Environmental Management
2 x canter trucks – for refuse removal in town, Marapong , Steenbokpan and Onverwacht
R1 200 000 R1 800 000 R2 000 000 LLM
SS 8
Protect the environment and improve community well‐being
Environmental Management
2 x waste transfer stations‐safe waste storage and disposal in rural areas
R50 000 000 R55 000 000
R60 000 000
MIG
SS 9
Protect the environment and improve community well‐being
Environmental Management
2x skip loader trucks R2 000 000 R4 600 000 R4 900 000 LLM

200
CODE Strategic Objective Programme / Focus Area
Strategic Projects / Initiatives / Output
2020/21 2021/22 2022/23 2023/24 FUNDER
SS 10
Protect the environment and improve community well‐being
Environmental Management
2x Compactor trucks
R5 300 000 R5 600 000 R5 900 000 LLM
SS 11
Protect the environment and improve community well‐being
Environmental Management
Marapong Waste Drop‐off area
R4 000 000 R5 000 000 MIG
SS 12
Protect the environment and improve community well‐being
Environmental Management
Steenbokpaan Waste Drop‐off area
R4 000 000 R5 000 000 MIG
SS 13
Protect the environment and improve community well‐being
Environmental Management
Landfill Development R50 000 000
R55 000 000
MIG
SS 14
Protect the environment and improve community well‐being
Parks, Sports and open space
Fencing of cemeteries
R 3 000 000 LLM
SS 15
Protect the environment and improve community well‐being
Parks, Sports and open space
Establish crematory facilities R 200 000 LLM
SS 16
Protect the environment and improve community well‐being
Parks, Sports and open space
Feasibility study for the establishment of regional cemeteries
R2,5 000 000
R3 000 000 R3,5 000 000
LLM
SS 17
Protect the environment and improve community
Parks, Sports and open space
2 x Ride on lawn mower‐ for grass cutting
R150 000 LLM
SS 18
Protect the environment and improve community well‐being
Parks, Sports and open space
Establish 3 x parks in various villages
R6 000 000 R6 000 000 R8 000 000 MIG
SS 19
Protect the environment and improve community well‐being
Parks, Sports and open space
Establishment of the cemetery in Marapong
R4 000 000 R5,9 000 000
R2,9 000 000
LLM
SS 20
Protect the environment and improve community well‐being
Parks, Sports and open space
Develop greening master plan R1 000 000 1 000 000 LLM
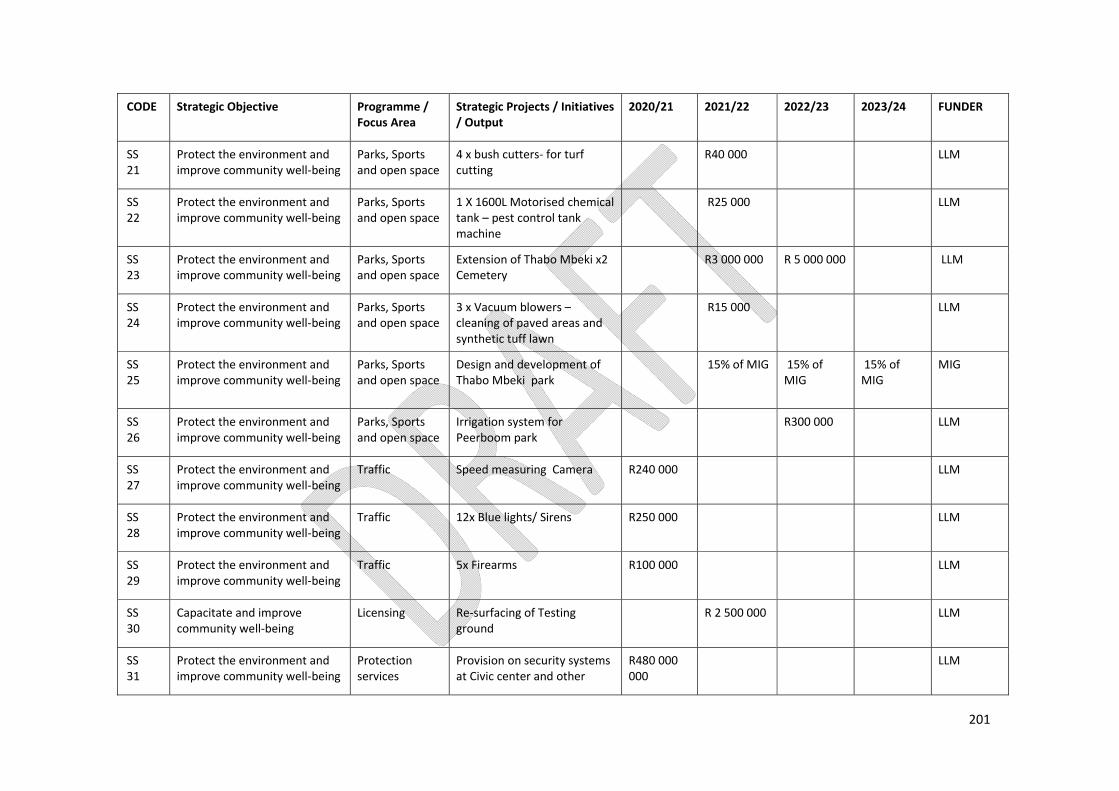
201
CODE Strategic Objective Programme / Focus Area
Strategic Projects / Initiatives / Output
2020/21 2021/22 2022/23 2023/24 FUNDER
SS 21
Protect the environment and improve community well‐being
Parks, Sports and open space
4 x bush cutters‐ for turf cutting
R40 000 LLM
SS 22
Protect the environment and improve community well‐being
Parks, Sports and open space
1 X 1600L Motorised chemical tank – pest control tank machine
R25 000 LLM
SS 23
Protect the environment and improve community well‐being
Parks, Sports and open space
Extension of Thabo Mbeki x2 Cemetery
R3 000 000 R 5 000 000 LLM
SS 24
Protect the environment and improve community well‐being
Parks, Sports and open space
3 x Vacuum blowers –cleaning of paved areas and synthetic tuff lawn
R15 000 LLM
SS 25
Protect the environment and improve community well‐being
Parks, Sports and open space
Design and development of Thabo Mbeki park
15% of MIG 15% of MIG
15% of MIG
MIG
SS 26
Protect the environment and improve community well‐being
Parks, Sports and open space
Irrigation system for Peerboom park
R300 000 LLM
SS 27
Protect the environment and improve community well‐being
Traffic Speed measuring Camera R240 000 LLM
SS 28
Protect the environment and improve community well‐being
Traffic 12x Blue lights/ Sirens R250 000 LLM
SS 29
Protect the environment and improve community well‐being
Traffic 5x Firearms R100 000 LLM
SS 30
Capacitate and improve community well‐being
Licensing Re‐surfacing of Testing ground
R 2 500 000 LLM
SS 31
Protect the environment and improve community well‐being
Protection services
Provision on security systems at Civic center and other
R480 000 000
LLM
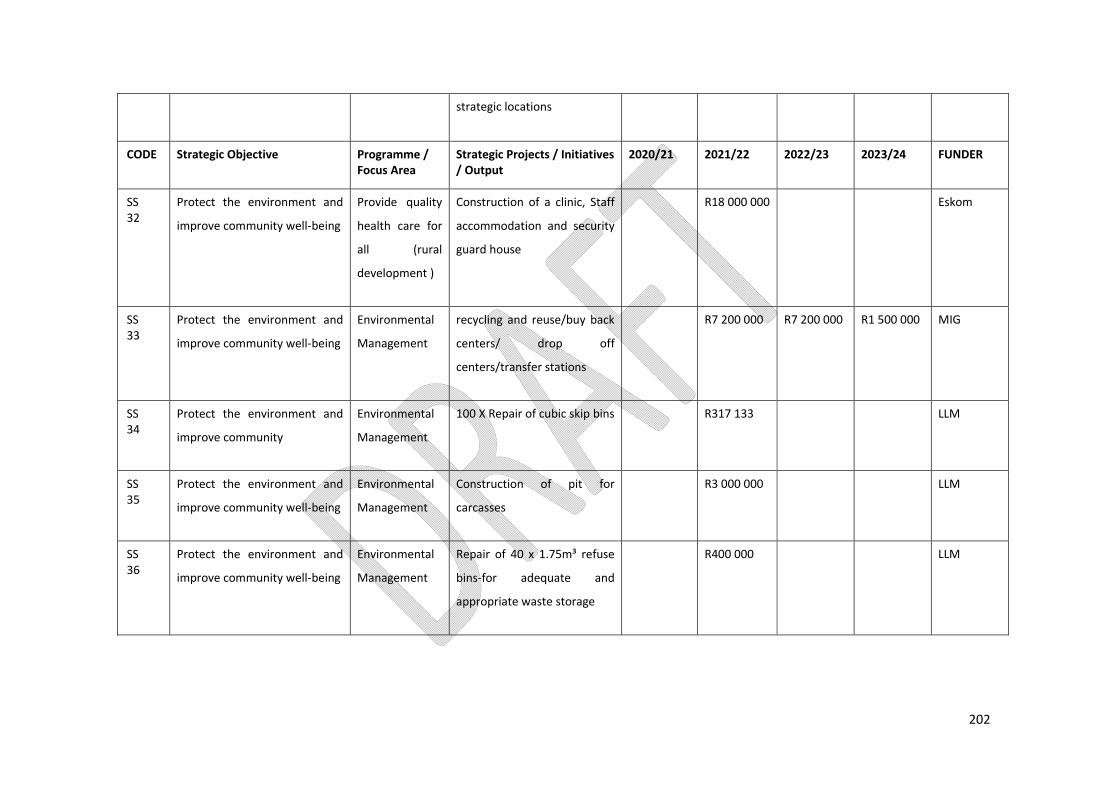
202
strategic locations
CODE Strategic Objective Programme / Focus Area
Strategic Projects / Initiatives / Output
2020/21 2021/22 2022/23 2023/24 FUNDER
SS 32
Protect the environment and
improve community well‐being
Provide quality
health care for
all (rural
development )
Construction of a clinic, Staff
accommodation and security
guard house
R18 000 000 Eskom
SS 33
Protect the environment and
improve community well‐being
Environmental
Management
recycling and reuse/buy back
centers/ drop off
centers/transfer stations
R7 200 000 R7 200 000 R1 500 000 MIG
SS 34
Protect the environment and
improve community
Environmental
Management
100 X Repair of cubic skip bins R317 133 LLM
SS 35
Protect the environment and
improve community well‐being
Environmental
Management
Construction of pit for
carcasses
R3 000 000 LLM
SS 36
Protect the environment and
improve community well‐being
Environmental
Management
Repair of 40 x 1.75m³ refuse
bins‐for adequate and
appropriate waste storage
R400 000 LLM

203
CODE Strategic Objective Programme / Focus
Area Strategic Projects / Initiatives / Output
2020/21 2021/22 2022/23 2023/24 FUNDER
SS 37
Protect the
environment and
improve community
well‐being
Environmental
Management
Repair of Weighbridge
500 000 LLM
SS 38
Protect the
environment and
improve community
well‐being
Environmental
Management
1 XLDV bakkie
700 000 LLM
SS 39
Protect the
environment and
improve community
well‐being
Environmental
Management
Fencing of four recycling site 400 000 100 000 100 000 LLM
SS 40
Protect the
environment and
improve community
Environmental
Management
Ablution facilities and Mobile
office at recycling site
400 000 200 000 200 000 LLM

204
CODE Strategic Objective Programme / Focus Area
Strategic Projects / Initiatives / Output
2020/21 2021/22 2022/23 2023/24 FUNDER
SS 41
Protect the
environment and
improve community
well‐being
Environmental
Management
1 X Canter truck 600 000 LLM
SS 42
Protect the
environment and
improve community
well‐being
Environmental
Management
Operationalize weigh bridge‐
landfill site
300 000 LLM
SS 43
Protect the environment and improve community well‐being
Social Services Development of 3 Technical Sec Schools
R15 000 000
5 000 000 Dept of Education PPP
SS 44
Protect the environment and improve community well‐being
Social Services Development of Primary School at Steve Biko
30 000 000 10 000 000 Dept of Education PPP

205
STRATEGIC PROJECTS/PROGRAMMES CAPITAL PROJECTS- DEVELOPMENT PLANNING CODE Strategic Objective Programme /
Focus Area Strategic Projects / Initiatives / Output
2020/21 2021/22 2022/23 2023/24 FUNDER
DP 1
Rational planning to bridge first and second economies and provide adequate land for development
Sustainable and integrated human settlements
Township establishment of Steve Biko ( town planning and land surveying)
2 000 000
LLM
DP 2
Rational planning to bridge first and second economies and provide adequate land for development
Sustainable and integrated human settlements
Tenure security:Proclamation of Marapong x 2, & 4
1 500 000 1 000 000 Coghsta
DP 3
Rational planning to bridge first and second economies and provide adequate land for development
Sustainable and integrated human settlements
Re‐planning of MarapongExt 3 ( Proclamation )
971 068.73 Coghsta
DP 4
Rational planning to bridge first and second economies and provide adequate land for development
Sustainable and integrated human settlements
Development of Captain Nkebe Thulare township at Marapong
97 000 000
PPP
DP 5
Rational planning to bridge first and second economies and provide adequate land for development
Sustainable and integrated human settlements
Provision of RDP houses in various villages
30 000 000 40 000 000 CoGHSTA
DP 6
Rational planning to bridge first and second economies and provide adequate land
Sustainable and integrated human settlements
Formalization of Lesedi (Steenbokpan area)
1 000 000 Coghsta

206
for development
DP 7
Rational planning to bridge first and second economies and provide adequate land for development
Sustainable and integrated human settlements
Acquisition of 6 hectares land for integrated human settlements
50 000 30 000 000 6 000 000 LLM
CODE Strategic Objective Programme / Focus Area
Strategic Projects / Initiatives / Output
2020/21 2021/22 2022/23 2023/24 FUNDER
DP 8
Rational planning to bridge first and second economies and provide adequate land for development
Sustainable and integrated human settlements
Township Establishment for the formalisation of Mamojela Park Informal Settlement ( Grootforntein area) off‐site development
1 315 750 Coghsta
DP 9
Rational planning to bridge first and second economies and provide adequate land for development
Functionality, performance and professionalism
GIS integration (Linking of FMS to GIS)
2 000 000 1 500 000 1 500 000 LLM
DP 10
Rational planning to bridge first and second economies and provide adequate land for development
Sustainable and integrated human settlements
Development Urban design framework
500 000 PPP
DP 11
Rational planning to bridge first and second economies and provide adequate land for development
Human Settlement
Accelerate development of houses in rural areas (various villages including Richards Lager)
60 000 000 80 000 000 90 000 000 CoGHSTA
DP 12
Rational planning to bridge
first and second economies
and provide adequate land
Sustainable and
integrated rural
development
Upgrading of informal
settlements and fast
tracking of CRU
90 000 000 3 500 000 CoGHSTA
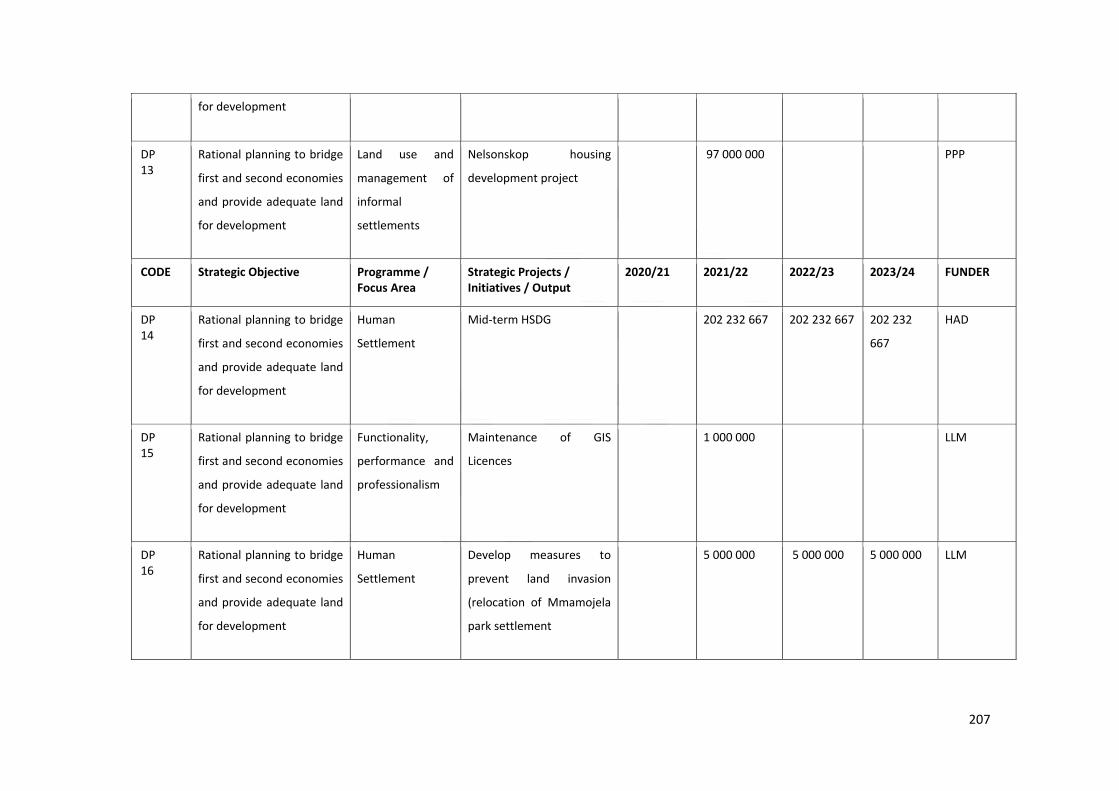
207
for development
DP 13
Rational planning to bridge
first and second economies
and provide adequate land
for development
Land use and
management of
informal
settlements
Nelsonskop housing
development project
97 000 000
PPP
CODE Strategic Objective Programme / Focus Area
Strategic Projects / Initiatives / Output
2020/21 2021/22 2022/23 2023/24 FUNDER
DP 14
Rational planning to bridge
first and second economies
and provide adequate land
for development
Human
Settlement
Mid‐term HSDG
202 232 667 202 232 667 202 232
667
HAD
DP 15
Rational planning to bridge
first and second economies
and provide adequate land
for development
Functionality,
performance and
professionalism
Maintenance of GIS
Licences
1 000 000 LLM
DP 16
Rational planning to bridge
first and second economies
and provide adequate land
for development
Human
Settlement
Develop measures to
prevent land invasion
(relocation of Mmamojela
park settlement
5 000 000 5 000 000 5 000 000 LLM
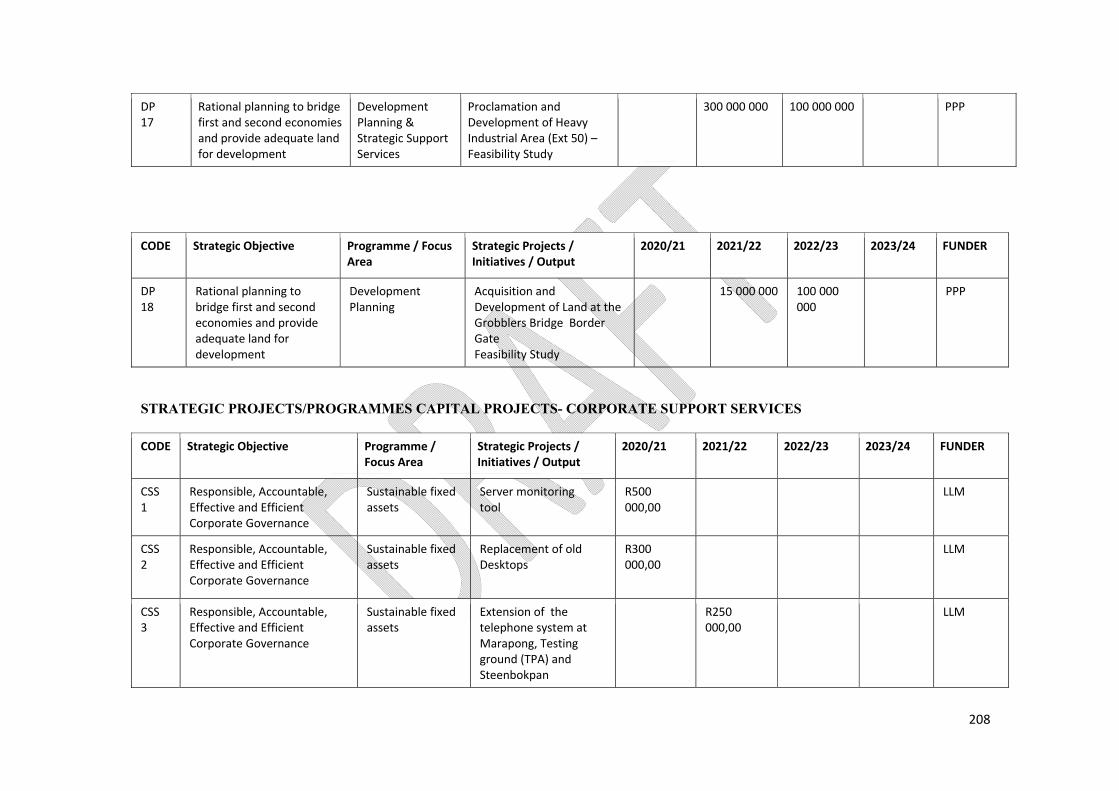
208
DP 17
Rational planning to bridge first and second economies and provide adequate land for development
Development Planning & Strategic Support Services
Proclamation and Development of Heavy Industrial Area (Ext 50) – Feasibility Study
300 000 000 100 000 000 PPP
CODE Strategic Objective Programme / Focus
Area Strategic Projects / Initiatives / Output
2020/21 2021/22 2022/23 2023/24 FUNDER
DP 18
Rational planning to bridge first and second economies and provide adequate land for development
Development Planning
Acquisition and Development of Land at the Grobblers Bridge Border Gate Feasibility Study
15 000 000 100 000 000
PPP
STRATEGIC PROJECTS/PROGRAMMES CAPITAL PROJECTS- CORPORATE SUPPORT SERVICES CODE Strategic Objective Programme /
Focus Area Strategic Projects / Initiatives / Output
2020/21 2021/22 2022/23 2023/24 FUNDER
CSS 1
Responsible, Accountable, Effective and Efficient Corporate Governance
Sustainable fixed assets
Server monitoring tool
R500 000,00
LLM
CSS 2
Responsible, Accountable, Effective and Efficient Corporate Governance
Sustainable fixed assets
Replacement of old Desktops
R300 000,00
LLM
CSS 3
Responsible, Accountable, Effective and Efficient Corporate Governance
Sustainable fixed assets
Extension of the telephone system at Marapong, Testing ground (TPA) and Steenbokpan
R250 000,00
LLM

209
CSS 4
Responsible, Accountable, Effective and Efficient Corporate Governance
Sustainable fixed assets
Office furniture R200 000 LLM
STRATEGIC PROJECTS/PROGRAMMES CAPITAL PROJECTS- STRATEGIC SUPPORT SERVICES CODE Strategic Objective Programme /
Focus Area Strategic Projects / Initiatives / Output
2020/21 2021/22 2022/23 2023/24 FUNDER
SSS 1
Responsible, Accountable, Effective and Efficient Corporate Governance
Communications Camera 70 000,00 LLM
CODE Strategic Objective Programme / Focus Area
Strategic Projects / Initiatives / Output
2020/21 2021/22 2022/23 2023/24 FUNDER
SSS 2
Create conducive environment for business to invest and prosper
Local Economic Development
Development of Student Residential Accommodation Units
10 000 000 60 000 000 PPP
SSS 3
Create conducive environment for business to invest and prosper
Local Economic Development
Development of Training Centres (x2)
15 000 000 5 000 000 PPP

210
EXXARO PROJECTS

211

212
CHAPTER 10
Performance Management System
Introduction Chapter 6, S38 of the Municipal Systems Act (2000) (MSA) requires that every Municipality must develop a Performance Management System suitable for their own needs. The aim of performance management is to indicate how well a Municipality is meeting its priorities/goals and objectives. It gives clear guidance on the effectiveness and efficiency of policies and processes and indicates improvements required. Performance management is key to effective management. It facilitates effective accountability, enabling key stakeholders and role players to track progress and identify scope for improvement. The performance management system is the primary mechanism to monitor, review and improve on the activities of the municipality. It must provide an integrated approach that links municipal performance to individual performance; aimed at improving planning (reviewing), budgeting, monitoring, reporting and evaluation.
10.1 Legislation. Municipal Systems Act (2000)l Chapter 6 states that every Municipality is required to develop and implement a performance management system. Section 26 (i) of the Municipal Systems act requires from municipalities to reflect the key performance indicators and performance targets determined in terms of section 41 in their Integrated Development Plan. Section 41 (1) requires that a municipality must in terms of its performance management system and in accordance with any regulations and guidelines that may be prescribed‐ set appropriate key performance indicators as a yardstick for measuring performance, including outcomes and impact, with
regard to the municipality's development priorities and objectives set out in its integrated development plan; set measurable performance targets with regard to each of those development priorities and objectives; with regard to each of those development priorities and objectives and against the key performance indicators and targets set in
terms of paragraphs (a) and (b)‐ monitor performance; and measure and review performance at least once per year;

213
take steps to improve performance with regard to those development priorities and objectives where performance targets are not met; and
establish a process of regular reporting to the council, other political structures, political office bearers and staff of the Municipality; and the public and appropriate organs of state.
The Local Government: Municipal Planning and Performance Management Regulations, 2001 describes the role of the performance management system in monitoring, evaluation and review: “7.(1) A Municipality’s performance management system entails a framework that describes and represents how the Municipality’s cycle and processes of performance planning, monitoring, measurement, review, reporting and improvement will be conducted, organised and managed”
10.2 Methodology Lephalale Local Municipality adopted the Logic Model to establish outputs and map the processes to get to the desired outcomes. This methodology is used to create a performance measurement system that will ensure effective and efficient performance management. The Logic Model operates on the principle that goals and strategic objectives are to be translated into impacts, outcomes, outputs, activities and inputs. This model is applied to create a logical flow of key components required to give effect to the achievement of strategic objectives. The following figure presents the components of the Logic Model:
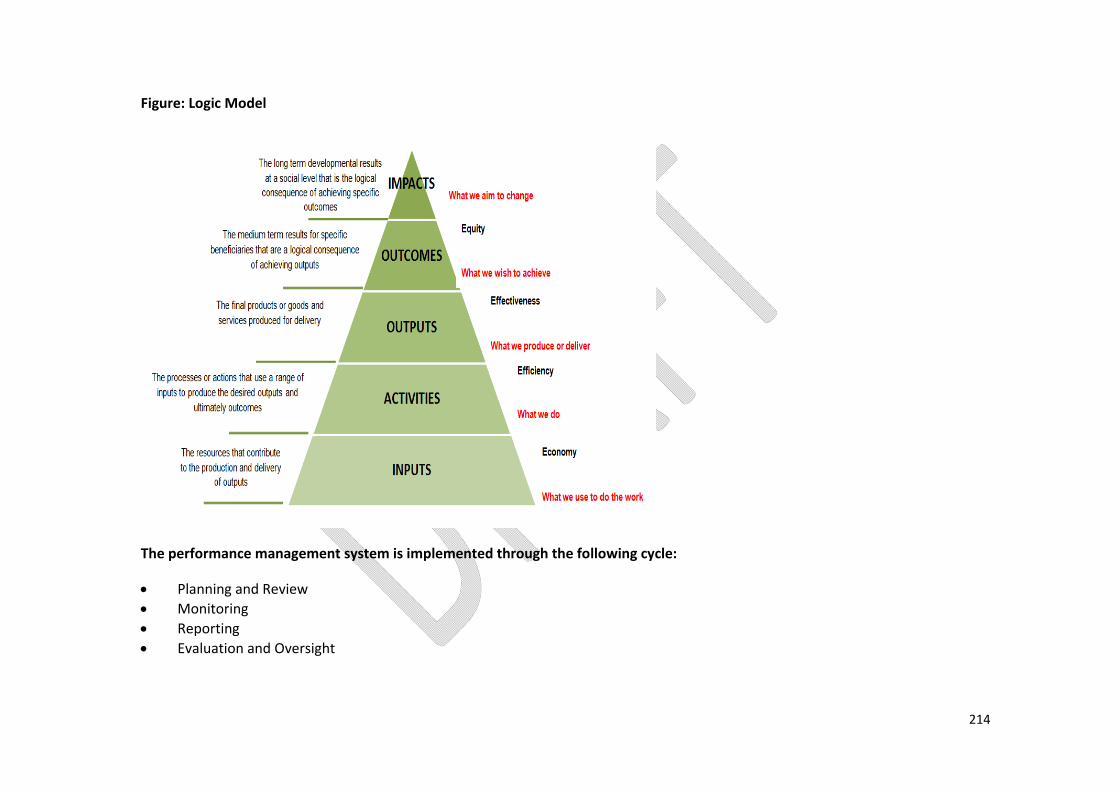
214
Figure: Logic Model
The performance management system is implemented through the following cycle:
Planning and Review Monitoring Reporting Evaluation and Oversight

215
a) Planning and Review The Municipal Systems Act No 32 of 2000 (Section 34) stipulates that a Municipality must review its IDP annually in accordance with an assessment of its Performance Management System and to make any necessary changes through a prescribed process. Planning and review is therefore the first step in the implementation of the Performance Management System. Planning and review consists of two actions that take place at different times of the municipal financial year. The first is the review of the IDP at the beginning of the municipal financial year, which informs the planning for the forthcoming year. The second is the annual review of performance to assess the achievements to the objectives set out in the preceding IDP. b) Monitoring Monitoring means to be aware of the state of a system. Monitoring refers to the process of data management that includes collection, gathering, storing and management of information. Monitoring is the key to any successful Performance Management System because it provides information to compare achievements with initial targets. Based on the outcome of the comparison, corrective actions can be taken and guidance can be provided to ensure that the desired outcomes are achieved. The process of monitoring entails a few key phases: Determining the data that must be collected in order to assess performance, how that data is to be collected, stored, verified
and analysed and how reports on that data are to be compiled. Analysing the data provided by the monitoring system in order to assess performance. Assessment to track and improve performance.
c) Reporting The reporting process provides information to decision makers on the progress of strategic goals, programmes and projects. Reporting collates information into intelligence and represents consolidation from the previous steps into reports. Reports inform decision makers of the challenges faced and the interventions envisaged that will enhance the performance of under‐performing programmes/projects. Reporting requires that we take the priorities of the organisation, its performance objectives, indicators, targets, measurements and analysis, and present this information in a simple and accessible format, relevant and useful to the specified target group.

216
Reporting within performance management in local government is a tool to ensure accountability of the: Municipality to Citizens and Communities Executive Committee to Council Administration to the Executive Committee or Mayor Line/Functional/Divisional Management to Executive Management and Portfolio Committees Employees to the organisation The reporting process should follow the lines of accountability mentioned above. Reporting formats: The functions of the different reports can be summarised as follows: Report type Description Quarterly IDP and SDBIP reporting
This report needs to contain the service delivery projections for each quarter. It needs to include the operational and capital expenditure, by vote. These targets need to be reported on quarterly according to National Treasury Circular 13.
Mid‐year budget and CoGHSTA report
This report reflects the performance of the Municipality during the first half of the financial year. The report must be submitted to the Mayor, National Treasury and CoGHSTA. It serves to identify possible adjustments that need to be made to ensure targets are met at the end of the financial year.
Annual report Section 121 of the MFMA identifies that each municipality has to produce an annual report for each financial year. This report must include: the financial statements of the municipality approved by the Auditor‐General; an audit report from the Auditor‐General; an assessment by the accounting officer; evidence of corrective action taken in response to the audit report from the Auditor‐General; information pertaining the municipality’s audit committee; assessment of the accounting officer to measure performance objectives; the annual performance report of the municipality; and

217
Report type Description any other information as prescribed in the document.
Oversight report The municipal Council needs to consider the municipal annual report whereupon an oversight report should be compiled. The Oversight report needs to include a statement explaining that the annual report has been approved with or without reservations; has rejected the annual report or has referred the annual report back for revision.
d) Evaluation
Evaluation of a Municipality’s performance, inclusive of organisational, financial and employee performance is essential to ensure that corrective measures are identified and put in place to improve areas of non‐performance. For the evaluation process to be effective, a holistic approach needs to be adopted, it should be conducted regularly and continuously through an in‐depth analysis process. Summative evaluation happens at the end of a financial year with the submission of the Annual report. Annual reports are the key reporting instruments for directorates to be held accountable against the performance targets and budgets outlined in their strategic plans. Annual reports are therefore required to contain information on service delivery, financial statements and the audit report. Evaluation within the organisation occurs at three levels to ensure impartial, transparent and accurate validation of performance achievements: Administrative Evaluation through the annual report, impact of programmes and projects, internal audit committee and
performance audit committee Political Oversight through portfolio committees, municipal public accounts committee and council Auditor General Evaluation through the auditor general report Implementation
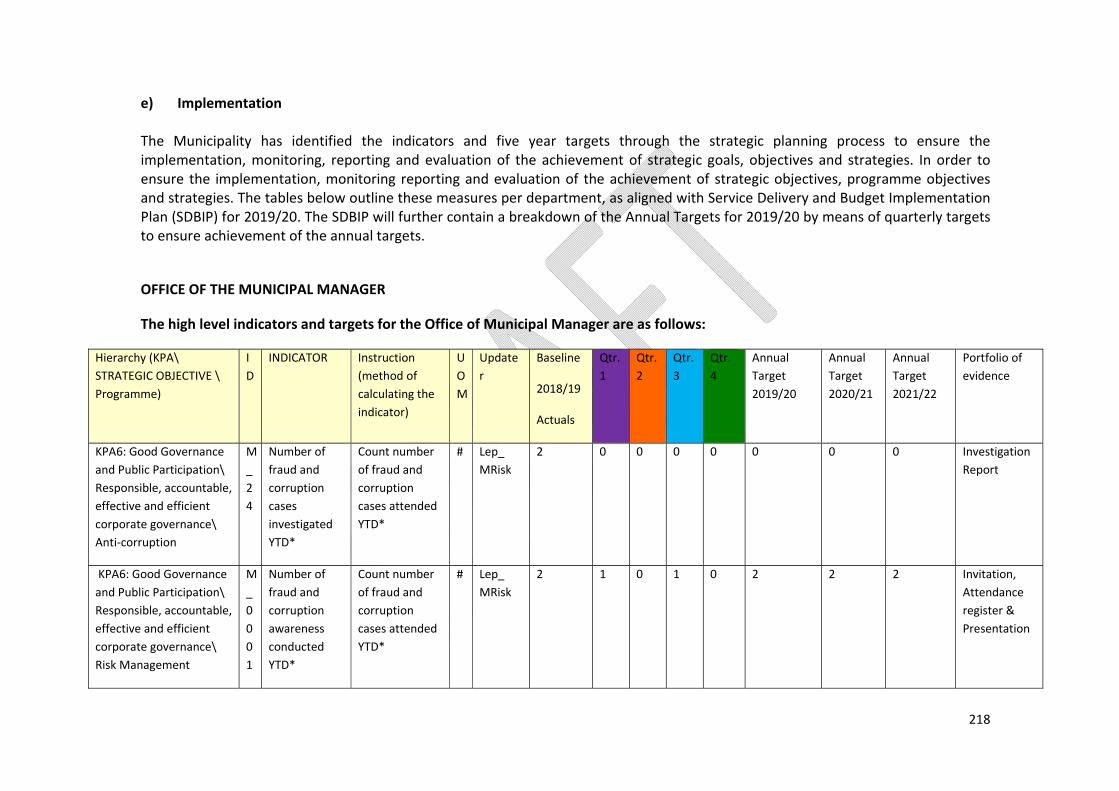
218
e) Implementation The Municipality has identified the indicators and five year targets through the strategic planning process to ensure the implementation, monitoring, reporting and evaluation of the achievement of strategic goals, objectives and strategies. In order to ensure the implementation, monitoring reporting and evaluation of the achievement of strategic objectives, programme objectives and strategies. The tables below outline these measures per department, as aligned with Service Delivery and Budget Implementation Plan (SDBIP) for 2019/20. The SDBIP will further contain a breakdown of the Annual Targets for 2019/20 by means of quarterly targets to ensure achievement of the annual targets.
OFFICE OF THE MUNICIPAL MANAGER
The high level indicators and targets for the Office of Municipal Manager are as follows:
Hierarchy (KPA\STRATEGIC OBJECTIVE \ Programme)
ID
INDICATOR Instruction (method of calculating the indicator)
UOM
Updater
Baseline
2018/19
Actuals
Qtr. 1
Qtr. 2
Qtr. 3
Qtr. 4
Annual Target 2019/20
Annual Target 2020/21
Annual Target 2021/22
Portfolio of evidence
KPA6: Good Governance and Public Participation\ Responsible, accountable, effective and efficient corporate governance\ Anti‐corruption
M_24
Number of fraud and corruption cases investigated YTD*
Count number of fraud and corruption cases attended YTD*
# Lep_ MRisk
2 0 0 0 0 0 0 0 Investigation Report
KPA6: Good Governance and Public Participation\ Responsible, accountable, effective and efficient corporate governance\ Risk Management
M_ 0001
Number of fraud and corruption awareness conducted YTD*
Count number of fraud and corruption cases attended YTD*
# Lep_ MRisk
2 1 0 1 0 2 2 2 Invitation, Attendance register & Presentation
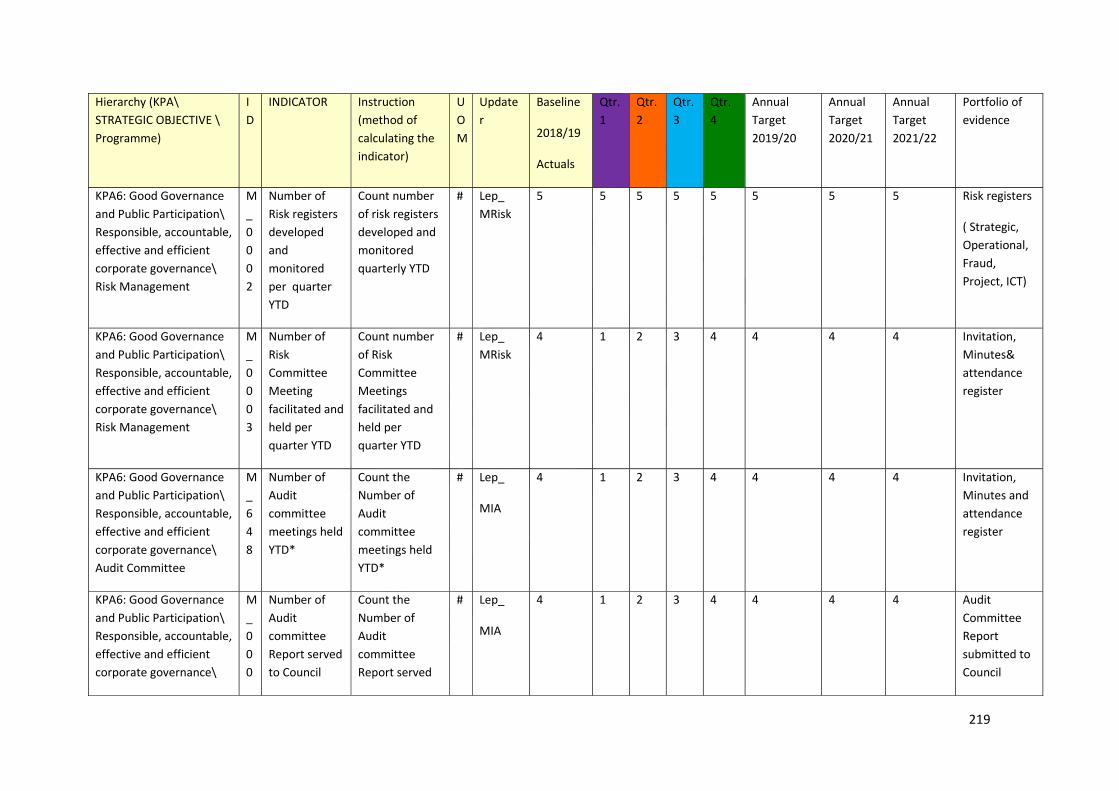
219
Hierarchy (KPA\STRATEGIC OBJECTIVE \ Programme)
ID
INDICATOR Instruction (method of calculating the indicator)
UOM
Updater
Baseline
2018/19
Actuals
Qtr. 1
Qtr. 2
Qtr. 3
Qtr. 4
Annual Target 2019/20
Annual Target 2020/21
Annual Target 2021/22
Portfolio of evidence
KPA6: Good Governance and Public Participation\ Responsible, accountable, effective and efficient corporate governance\ Risk Management
M_ 0002
Number of Risk registers developed and monitored per quarter YTD
Count number of risk registers developed and monitored quarterly YTD
# Lep_ MRisk
5 5 5 5 5 5 5 5 Risk registers
( Strategic, Operational, Fraud, Project, ICT)
KPA6: Good Governance and Public Participation\ Responsible, accountable, effective and efficient corporate governance\ Risk Management
M_ 0003
Number of Risk Committee Meeting facilitated and held per quarter YTD
Count number of Risk Committee Meetings facilitated and held per quarter YTD
# Lep_ MRisk
4 1 2 3 4 4 4 4 Invitation, Minutes& attendance register
KPA6: Good Governance and Public Participation\ Responsible, accountable, effective and efficient corporate governance\ Audit Committee
M_648
Number of Audit committee meetings held YTD*
Count the Number of Audit committee meetings held YTD*
# Lep_
MIA
4 1 2 3 4 4 4 4 Invitation, Minutes and attendance register
KPA6: Good Governance and Public Participation\ Responsible, accountable, effective and efficient corporate governance\
M_000
Number of Audit committee Report served to Council
Count the Number of Audit committee Report served
# Lep_
MIA
4 1 2 3 4 4 4 4 Audit Committee Report submitted to Council
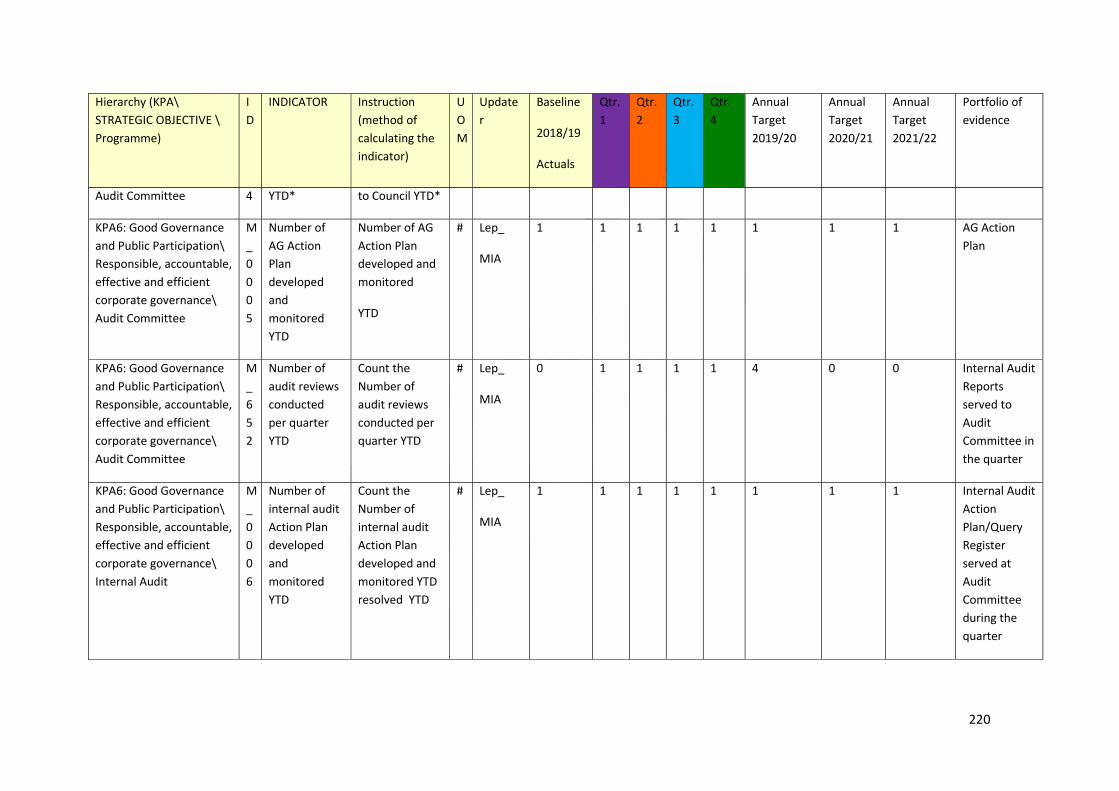
220
Hierarchy (KPA\STRATEGIC OBJECTIVE \ Programme)
ID
INDICATOR Instruction (method of calculating the indicator)
UOM
Updater
Baseline
2018/19
Actuals
Qtr. 1
Qtr. 2
Qtr. 3
Qtr. 4
Annual Target 2019/20
Annual Target 2020/21
Annual Target 2021/22
Portfolio of evidence
Audit Committee 4 YTD* to Council YTD*
KPA6: Good Governance and Public Participation\ Responsible, accountable, effective and efficient corporate governance\ Audit Committee
M_ 0005
Number of AG Action Plan developed and monitored YTD
Number of AG Action Plan developed and monitored
YTD
# Lep_
MIA
1 1 1 1 1 1 1 1 AG Action Plan
KPA6: Good Governance and Public Participation\ Responsible, accountable, effective and efficient corporate governance\ Audit Committee
M_652
Number of audit reviews conducted per quarter YTD
Count the Number of audit reviews conducted per quarter YTD
# Lep_
MIA
0 1 1 1 1 4 0 0 Internal Audit Reports served to Audit Committee in the quarter
KPA6: Good Governance and Public Participation\ Responsible, accountable, effective and efficient corporate governance\ Internal Audit
M_ 0006
Number of internal audit Action Plan developed and monitored YTD
Count the Number of internal audit Action Plan developed and monitored YTD resolved YTD
# Lep_
MIA
1 1 1 1 1 1 1 1 Internal Audit Action Plan/Query Register served at Audit Committee during the quarter

221
Hierarchy (KPA\STRATEGIC OBJECTIVE \ Programme)
ID
INDICATOR Instruction (method of calculating the indicator)
UOM
Updater
Baseline
2018/19
Actuals
Qtr. 1
Qtr. 2
Qtr. 3
Qtr. 4
Annual Target 2019/20
Annual Target 2020/21
Annual Target 2021/22
Portfolio of evidence
KPA6: Good Governance and Public Participation\ Responsible, accountable, effective and efficient corporate governance\ Auditor General
M_651
Number of Unqualified Perform‐ance Opinion per annum YTD*
Count the Number of Unqualified Performance Opinion for a Financial Year YTD*
# Lep_
MIA
1 N/A 1 1 1 1 1 1 AG Audit Report
KPA2: Service Delivery and Infrastructure Development\ Protect the environment and improve community well‐being\ Safety and Security
M_706
Number of safety and security forum meetings held per quarter YTD
Count the Number of functional safety and security meeting held per quarter YTD
# Lep‐MM security
3 1 1 1 1 1 1 1 Invitations,
agenda, attendance register,
minutes

222
STRATEGIC SUPPORT SERVICES ‐ VOTE 7
The high level indicators and targets for the Strategic Support Services Directorate are as follows:
Hierarchy (KPA\STRATEGIC OBJECTIVE \ Programme)
ID
INDICATOR Instruction (method of calculating the indicator)
UOM
Updater Baseline
2018/19
Actuals
Qtr. 1
Qtr. 2
Qtr. 3
Qtr. 4
Annual Target 2019/20
Annual Target 2020/21
Annual Target 2021/22
Portfolio of evidence
KPA6: Good Governance and Public Participation\ Capacitate disadvantaged groups\ Special Projects
M_322
Number of HIV/Aids campaigns held YTD*
Count the Number of HIV/Aids campaigns held YTD*
# Lep_ MPP
5 1 2 3 4 4 5 5 Adverts/Notices/
Invitations
Presentations
Attendance Registers
KPA6: Good Governance and Public Participation\ Capacitate disadvantaged groups\ Special Projects
M_641
Number of special programmes awareness campaigns held YTD*
Count the Number of special programmes awareness campaigns held YTD*
# Lep_ MPP
18 3 6 9 12 12 12 12 Invitations, attendance registers , delivery receipts
(where applicable)
KPA6: Good Governance and Public Participation\ Responsible, accountable, effective and
M_335
Number of media releases published YTD*
Count the Number of media releases published
# Lep_ Com
30 5 10 15 20 20 20 20 Copy of publication
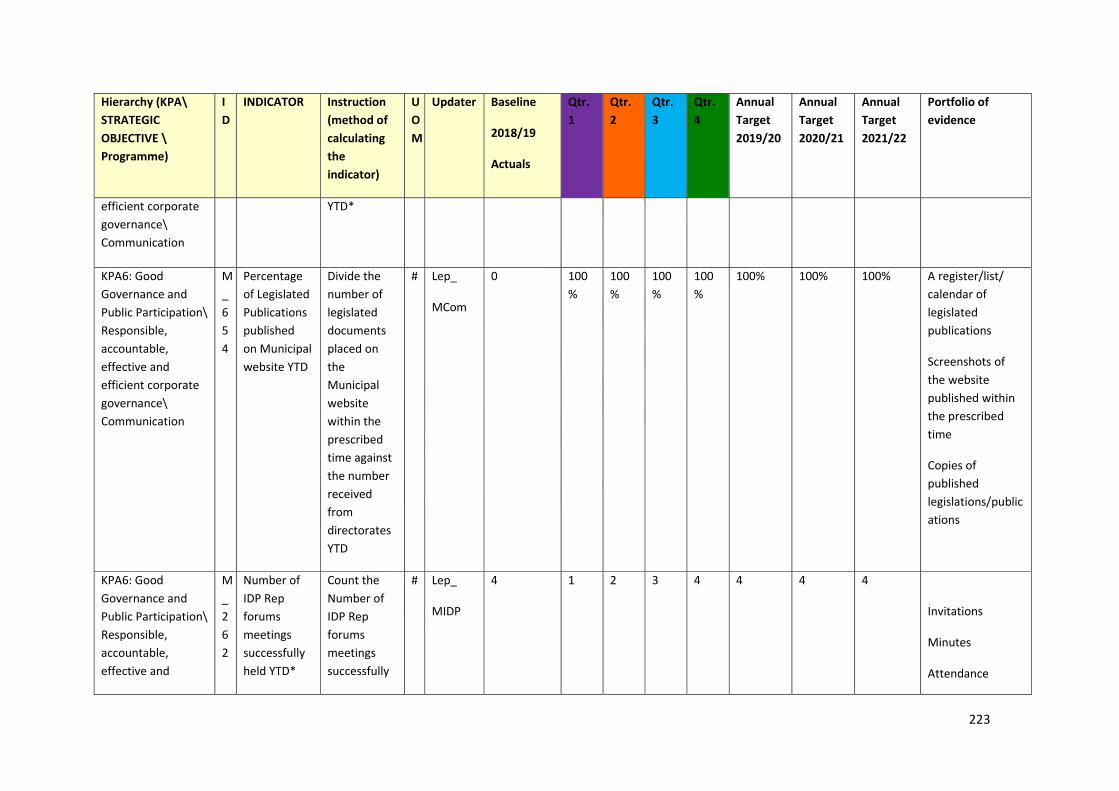
223
Hierarchy (KPA\STRATEGIC OBJECTIVE \ Programme)
ID
INDICATOR Instruction (method of calculating the indicator)
UOM
Updater Baseline
2018/19
Actuals
Qtr. 1
Qtr. 2
Qtr. 3
Qtr. 4
Annual Target 2019/20
Annual Target 2020/21
Annual Target 2021/22
Portfolio of evidence
efficient corporate governance\ Communication
YTD*
KPA6: Good Governance and Public Participation\ Responsible, accountable, effective and efficient corporate governance\ Communication
M_654
Percentage of Legislated Publications published on Municipal website YTD
Divide the number of legislated documents placed on the Municipal website within the prescribed time against the number received from directorates YTD
# Lep_
MCom
0 100%
100%
100%
100%
100% 100% 100% A register/list/ calendar of legislated publications
Screenshots of the website published within the prescribed time
Copies of published legislations/publications
KPA6: Good Governance and Public Participation\ Responsible, accountable, effective and
M_262
Number of IDP Rep forums meetings successfully held YTD*
Count the Number of IDP Rep forums meetings successfully
# Lep_
MIDP
4 1 2 3 4 4 4 4
Invitations
Minutes
Attendance
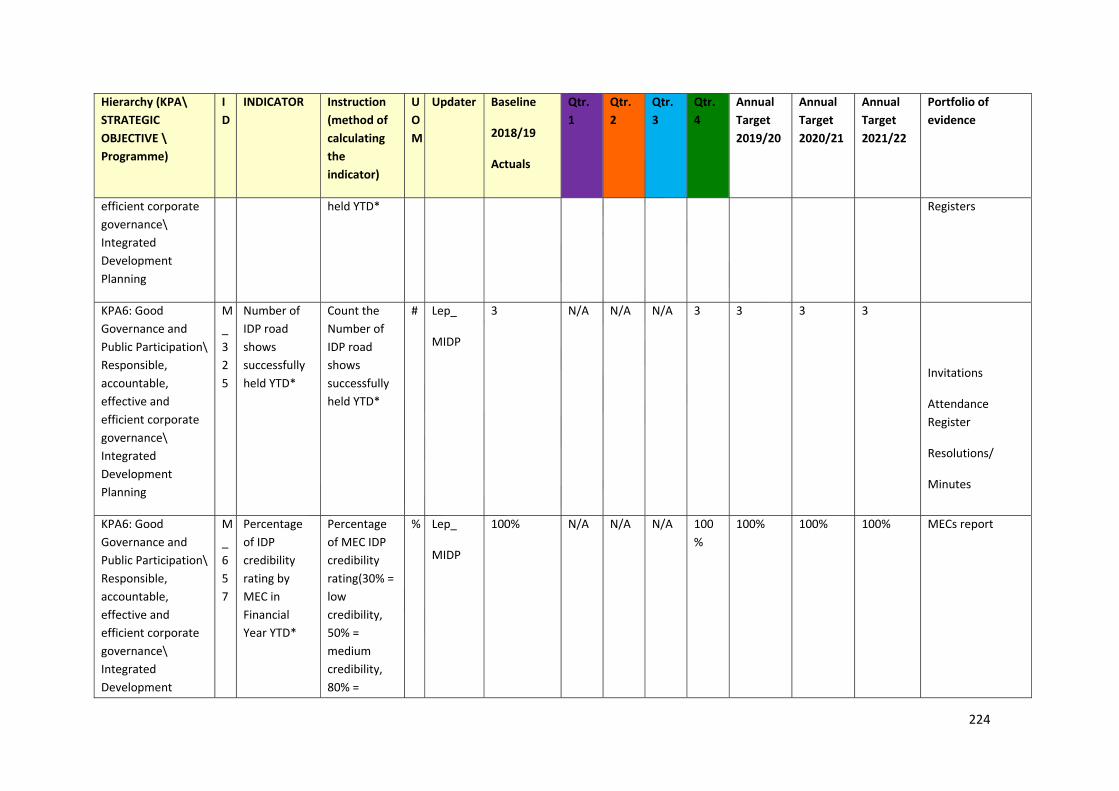
224
Hierarchy (KPA\STRATEGIC OBJECTIVE \ Programme)
ID
INDICATOR Instruction (method of calculating the indicator)
UOM
Updater Baseline
2018/19
Actuals
Qtr. 1
Qtr. 2
Qtr. 3
Qtr. 4
Annual Target 2019/20
Annual Target 2020/21
Annual Target 2021/22
Portfolio of evidence
efficient corporate governance\ Integrated Development Planning
held YTD* Registers
KPA6: Good Governance and Public Participation\ Responsible, accountable, effective and efficient corporate governance\ Integrated Development Planning
M_325
Number of IDP road shows successfully held YTD*
Count the Number of IDP road shows successfully held YTD*
# Lep_
MIDP
3 N/A N/A N/A 3 3 3 3
Invitations
Attendance Register
Resolutions/
Minutes
KPA6: Good Governance and Public Participation\ Responsible, accountable, effective and efficient corporate governance\ Integrated Development
M_657
Percentage of IDP credibility rating by MEC in Financial Year YTD*
Percentage of MEC IDP credibility rating(30% = low credibility, 50% = medium credibility, 80% =
% Lep_
MIDP
100% N/A N/A N/A 100%
100% 100% 100% MECs report

225
Hierarchy (KPA\STRATEGIC OBJECTIVE \ Programme)
ID
INDICATOR Instruction (method of calculating the indicator)
UOM
Updater Baseline
2018/19
Actuals
Qtr. 1
Qtr. 2
Qtr. 3
Qtr. 4
Annual Target 2019/20
Annual Target 2020/21
Annual Target 2021/22
Portfolio of evidence
Planning credible, 100% = highly credible) YTD*
KPA6: Good Governance and Public Participation\ Responsible, accountable, effective and efficient corporate governance\ Integrated Development Planning
M_658
Final IDP approved by Council by end May YTD*
Final IDP approved by Council by end May YTD*
# Lep_
MIDP
1 N/A N/A N/A 1 1 1 1 Process Plan
Copy of Council resolution
Copy of approved IDP
Proof that it was published within prescribed timeframe
KPA6: Good Governance and Public Participation\ Responsible, accountable, effective and efficient corporate governance\ Performance
M_06
Final Annual Report approved by Council by end of March 2017 YTD*
Final Annual Report of previous financial year approved by Council YTD
# Lep_
PMS
1 N/A N/A 1 N/A 1 1 1 Council resolution, process plan , scheduled timelines

226
Hierarchy (KPA\STRATEGIC OBJECTIVE \ Programme)
ID
INDICATOR Instruction (method of calculating the indicator)
UOM
Updater Baseline
2018/19
Actuals
Qtr. 1
Qtr. 2
Qtr. 3
Qtr. 4
Annual Target 2019/20
Annual Target 2020/21
Annual Target 2021/22
Portfolio of evidence
Management
KPA6: Good Governance and Public Participation\ Responsible, accountable, effective and efficient corporate governance\ Performance Management
M_09
Draft Annual Reports tabled to Council by 31st of January YTD*
Draft Annual Reports tabled to Council by 31st January YTD*
# Lep_
PMS
1 N/A N/A 1 N/A 1 1 1 Council resolution, process plan, scheduled timelines
KPA6: Good Governance and Public Participation\ Responsible, accountable, effective and efficient corporate governance\ Performance Management
M_43
SDBIP signed by the Mayor within 28 days after the approval of budget and the IDP YTD
SDBIP signed by the Mayor within 28 days after the approval of budget and the IDP YTD
# Lep_
PMS
1 N/A N/A N/A 1 1 1 1 Process plan
Copy of Final SDBIP
Proof that it was approved/signed within the prescribed time
KPA6: Good Governance and Public Participation\ Responsible,
M_4
Annual Performance Report submitted to
Annual Performance Report submitted to
# Lep_
PMS
1 1 1 1 1 1 1 1
Process plan

227
Hierarchy (KPA\STRATEGIC OBJECTIVE \ Programme)
ID
INDICATOR Instruction (method of calculating the indicator)
UOM
Updater Baseline
2018/19
Actuals
Qtr. 1
Qtr. 2
Qtr. 3
Qtr. 4
Annual Target 2019/20
Annual Target 2020/21
Annual Target 2021/22
Portfolio of evidence
accountable, effective and efficient corporate governance\ Performance Management
8 auditor general by August 30th YTD
auditor general by August 30th YTD
Copy of AR
Proof of submission to AG/Stakeholders
Proof that it was published within prescribed time
KPA6: Good Governance and Public Participation\ Responsible, accountable, effective and efficient corporate governance\ Performance Management
M_315
Number of quarterly performance assessments performed YTD*
Count the Number of performance assessments performed YTD*
# Lep_
PMS
4 1 2 3 4 4 4 4 Schedule for assessments
Proof that Performance agreements were published in July on the website
Assessment Reports
KPA6: Good Governance and Public Participation\ Responsible, accountable, effective and efficient corporate
M_40
Number of Quarterly Performance Reports submitted to Audit Committee
Count the Number of Quarterly Performance Reports submitted to Audit
# Lep_
PMS
4 1 2 3 4 4 4 4 Signed quarterly reports submitted to Audit Committee
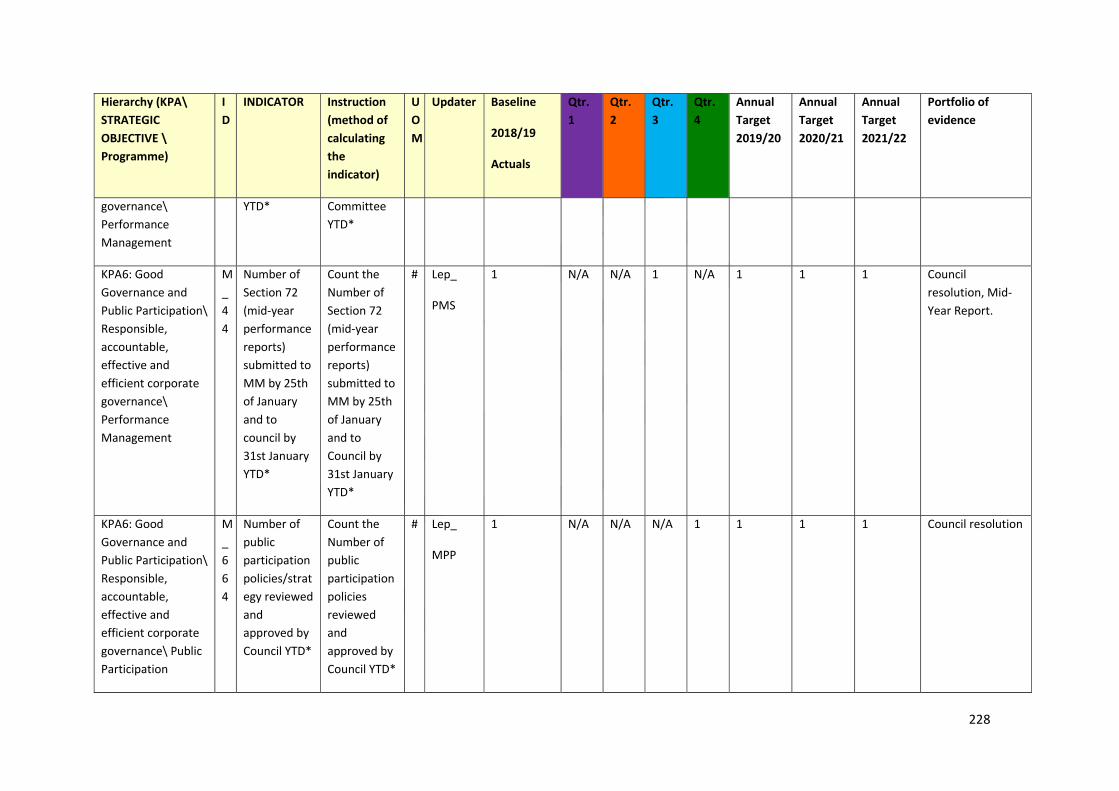
228
Hierarchy (KPA\STRATEGIC OBJECTIVE \ Programme)
ID
INDICATOR Instruction (method of calculating the indicator)
UOM
Updater Baseline
2018/19
Actuals
Qtr. 1
Qtr. 2
Qtr. 3
Qtr. 4
Annual Target 2019/20
Annual Target 2020/21
Annual Target 2021/22
Portfolio of evidence
governance\Performance Management
YTD* Committee YTD*
KPA6: Good Governance and Public Participation\ Responsible, accountable, effective and efficient corporate governance\ Performance Management
M_44
Number of Section 72 (mid‐year performance reports) submitted to MM by 25th of January and to council by 31st January YTD*
Count the Number of Section 72 (mid‐year performance reports) submitted to MM by 25th of January and to Council by 31st January YTD*
# Lep_
PMS
1 N/A N/A 1 N/A 1 1 1 Council resolution, Mid‐Year Report.
KPA6: Good Governance and Public Participation\ Responsible, accountable, effective and efficient corporate governance\ Public Participation
M_664
Number of public participation policies/strategy reviewed and approved by Council YTD*
Count the Number of public participation policies reviewed and approved by Council YTD*
# Lep_
MPP
1 N/A N/A N/A 1 1 1 1 Council resolution

229
Hierarchy (KPA\STRATEGIC OBJECTIVE \ Programme)
ID
INDICATOR Instruction (method of calculating the indicator)
UOM
Updater Baseline
2018/19
Actuals
Qtr. 1
Qtr. 2
Qtr. 3
Qtr. 4
Annual Target 2019/20
Annual Target 2020/21
Annual Target 2021/22
Portfolio of evidence
KPA6: Good Governance and Public Participation\ Responsible, accountable, effective and efficient corporate governance\ Ward Committees
M_208
Number of ward committees that are functional and having meetings at least once per quarter and submit reports of such meetings YTD
Count the Number of ward committees that are functional and having meetings at least once per quarter and submit reports of such meetings YTD
# Lep_
MPP
13 13 13 13 13 13 13 13 Minutes of the meetings held, attendance register, schedule of meetings
KPA4: Local Economic Development\ Create a conducive environment for businesses to invest and prosper\ Job Creation
M_688
Number of jobs created through municipal LED initiatives and capital projects (from municipal budget)
Count the Number of jobs created through municipal LED and capital projects (from municipal budget) YTD
# Lep‐MLED
1200 320 640 840 1040 1040 1200 1200 List of beneficiaries
Contracts/ID Numbers

230
Hierarchy (KPA\STRATEGIC OBJECTIVE \ Programme)
ID
INDICATOR Instruction (method of calculating the indicator)
UOM
Updater Baseline
2018/19
Actuals
Qtr. 1
Qtr. 2
Qtr. 3
Qtr. 4
Annual Target 2019/20
Annual Target 2020/21
Annual Target 2021/22
Portfolio of evidence
YTD*
KPA4: Local Economic Development\ Create a conducive environment for businesses to invest and prosper\ Job Creation
M_51
Number of jobs created through strategic partners (energy generation, new mines and other business proposals) YTD*
Count the Number of jobs created through strategic partners (energy generation, new mines and other business proposals) YTD
# MLED 1207 213 425 658 850 850 900 1 000 Numbers as reported from employing companies.
List of beneficiaries
Contracts/ID Numbers
KPA4: Local Economic Development\ Create a conducive environment for businesses to invest and prosper\ Marketing and Branding
M_695
Number of Public Private Partnerships established YTD*
Count the Number of Public Private Partnerships established YTD
# Lep‐MLED
2 1 1 2 2 2 2 2
MOA
Minutes
KPA4: Local Economic
M_
Number of meetings
Count the Number of
# Lep‐ 4 N/A 1 1 2 2 4 4
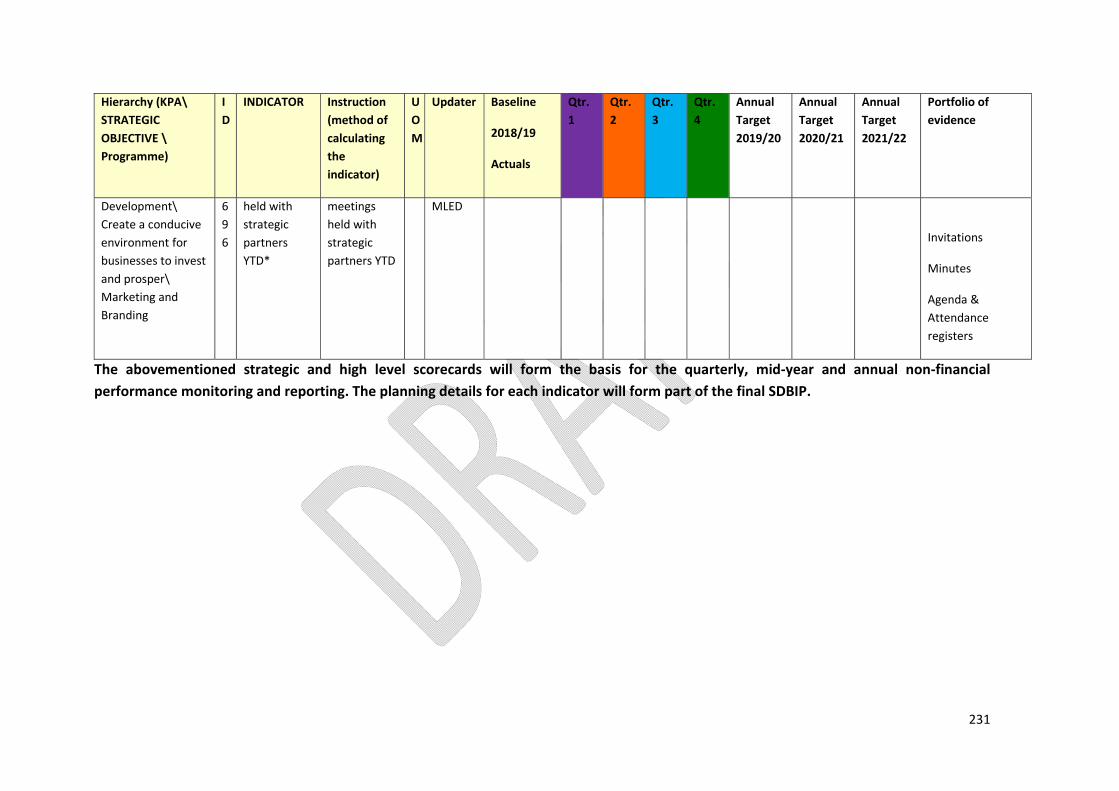
231
Hierarchy (KPA\STRATEGIC OBJECTIVE \ Programme)
ID
INDICATOR Instruction (method of calculating the indicator)
UOM
Updater Baseline
2018/19
Actuals
Qtr. 1
Qtr. 2
Qtr. 3
Qtr. 4
Annual Target 2019/20
Annual Target 2020/21
Annual Target 2021/22
Portfolio of evidence
Development\Create a conducive environment for businesses to invest and prosper\ Marketing and Branding
696
held with strategic partners YTD*
meetings held with strategic partners YTD
MLED
Invitations
Minutes
Agenda & Attendance registers
The abovementioned strategic and high level scorecards will form the basis for the quarterly, mid‐year and annual non‐financial performance monitoring and reporting. The planning details for each indicator will form part of the final SDBIP.

232
DEVELOPMENTPLANNING–VOTE6
The high level indicators and targets for the Strategic Support Services Directorate are as follows:
Hierarchy (KPA\STRATEGIC OBJECTIVE \ Programme)
ID
INDICATOR Instruction (method of calculating the indicator)
UOM
Updater Baseline
2018/19
Actuals
Qtr. 1
Qtr. 2
Qtr. 3
Qtr. 4
Annual Target 2019/20
Annual Target 2020/21
Annual Target 2021/22
Portfolio of evidence
KPA6: Good Governance and Public Participation\ Capacitate disadvantaged groups\ Special Projects
M_322
Number of HIV/Aids campaigns held YTD*
Count the Number of HIV/Aids campaigns held YTD*
# Lep_ MPP 5 1 2 3 4 4 5 5 Adverts/Notices/Invitations
Presentations
Attendance Registers
KPA6: Good Governance and Public Participation\ Capacitate disadvantaged groups\ Special Projects
M_641
Number of special programmes awareness campaigns held YTD*
Count the Number of special programmes awareness campaigns held YTD*
# Lep_ MPP 18 3 6 9 12 12 12 12 Invitations, attendance registers , delivery receipts
(where applicable)
KPA6: Good Governance and Public Participation\ Responsible, accountable, effective and
M_335
Number of media releases published YTD*
Count the Number of media releases published YTD*
# Lep_ Com 30 5 10 15 20 20 20 20 Copy of publication

233
Hierarchy (KPA\STRATEGIC OBJECTIVE \ Programme)
ID
INDICATOR Instruction (method of calculating the indicator)
UOM
Updater Baseline
2018/19
Actuals
Qtr. 1
Qtr. 2
Qtr. 3
Qtr. 4
Annual Target 2019/20
Annual Target 2020/21
Annual Target 2021/22
Portfolio of evidence
efficient corporate governance\ Communication
KPA6: Good Governance and Public Participation\ Responsible, accountable, effective and efficient corporate governance\ Communication
M_654
Percentage of Legislated Publications published on Municipal website YTD
Divide the number of legislated documents placed on the Municipal website within the prescribed time against the number received from directorates YTD
# Lep_
MCom
0 100%
100%
100%
100%
100% 100% 100% A register/list/calen‐dar of legislated publications
Screenshots of the website published within the prescribed time
Copies of published legislations/publications
KPA6: Good Governance and Public Participation\ Responsible, accountable, effective and efficient corporate
M_262
Number of IDP Rep forums meetings successfully held YTD*
Count the Number of IDP Rep forums meetings successfully
# Lep_
MIDP
4 1 2 3 4 4 4 4 Invitations
Minutes
Attendance Registers

234
Hierarchy (KPA\STRATEGIC OBJECTIVE \ Programme)
ID
INDICATOR Instruction (method of calculating the indicator)
UOM
Updater Baseline
2018/19
Actuals
Qtr. 1
Qtr. 2
Qtr. 3
Qtr. 4
Annual Target 2019/20
Annual Target 2020/21
Annual Target 2021/22
Portfolio of evidence
governance\Integrated Development Planning
held YTD*
KPA6: Good Governance and Public Participation\ Responsible, accountable, effective and efficient corporate governance\ Integrated Development Planning
M_325
Number of IDP road shows successfully held YTD*
Count the Number of IDP road shows successfully held YTD*
# Lep_
MIDP
3 N/A N/A N/A 3 3 3 3 Invitations
Attendance Register
Resolutions/
Minutes
KPA6: Good Governance and Public Participation\ Responsible, accountable, effective and efficient corporate governance\ Integrated Development
M_657
Percentage of IDP credibility rating by MEC in Financial Year YTD*
Percentage of MEC IDP credibility rating(30% = low credibility, 50% = medium credibility, 80% = credible,
% Lep_
MIDP
100% N/A N/A N/A 100%
100% 100% 100% MECs report

235
Hierarchy (KPA\STRATEGIC OBJECTIVE \ Programme)
ID
INDICATOR Instruction (method of calculating the indicator)
UOM
Updater Baseline
2018/19
Actuals
Qtr. 1
Qtr. 2
Qtr. 3
Qtr. 4
Annual Target 2019/20
Annual Target 2020/21
Annual Target 2021/22
Portfolio of evidence
Planning 100% = highly credible) YTD*
KPA6: Good Governance and Public Participation\ Responsible, accountable, effective and efficient corporate governance\ Integrated Development Planning
M_658
Final IDP approved by Council by end May YTD*
Final IDP approved by Council by end May YTD*
# Lep_
MIDP
1 N/A N/A N/A 1 1 1 1 Process Plan
Copy of Council resolution
Copy of approved IDP
Proof that it was published within prescribed timeframe
KPA6: Good Governance and Public Participation\ Responsible, accountable, effective and efficient corporate governance\ Performance Management
M_06
Final Annual Report approved by Council by end of March 2017 YTD*
Final Annual Report of previous financial year approved by Council YTD
# Lep_
PMS
1 N/A N/A 1 N/A 1 1 1 Council resolution, process plan , scheduled timelines

236
Hierarchy (KPA\STRATEGIC OBJECTIVE \ Programme)
ID
INDICATOR Instruction (method of calculating the indicator)
UOM
Updater Baseline
2018/19
Actuals
Qtr. 1
Qtr. 2
Qtr. 3
Qtr. 4
Annual Target 2019/20
Annual Target 2020/21
Annual Target 2021/22
Portfolio of evidence
KPA6: Good Governance and Public Participation\ Responsible, accountable, effective and efficient corporate governance\ Performance Management
M_09
Draft Annual Reports tabled to Council by 31st of January YTD*
Draft Annual Reports tabled to Council by 31st January YTD*
# Lep_
PMS
1 N/A N/A 1 N/A 1 1 1 Council resolution, process plan, scheduled timelines
KPA6: Good Governance and Public Participation\ Responsible, accountable, effective and efficient corporate governance\ Performance Management
M_43
SDBIP signed by the Mayor within 28 days after the approval of budget and the IDP YTD
SDBIP signed by the Mayor within 28 days after the approval of budget and the IDP YTD
# Lep_
PMS
1 N/A N/A N/A 1 1 1 1 Process plan
Copy of Final SDBIP
Proof that it was approved/signed within the prescribed time
KPA6: Good Governance and Public Participation\ Responsible, accountable, effective and
M_48
Annual Performance Report submitted to auditor general by
Annual Performance Report submitted to auditor general by
# Lep_
PMS
1 1 1 1 1 1 1 1 Process plan
Copy of AR
Proof of submission to

237
Hierarchy (KPA\STRATEGIC OBJECTIVE \ Programme)
ID
INDICATOR Instruction (method of calculating the indicator)
UOM
Updater Baseline
2018/19
Actuals
Qtr. 1
Qtr. 2
Qtr. 3
Qtr. 4
Annual Target 2019/20
Annual Target 2020/21
Annual Target 2021/22
Portfolio of evidence
efficient corporate governance\ Performance Management
August 30th YTD
August 30th YTD
AG/Stakeholders
Proof that it was published within prescribed time
KPA6: Good Governance and Public Participation\ Responsible, accountable, effective and efficient corporate governance\ Performance Management
M_315
Number of quarterly performance assessments performed YTD*
Count the Number of performance assessments performed YTD*
# Lep_
PMS
4 1 2 3 4 4 4 4 Schedule for assessments
Proof that Performance agreements were published in July on the website
Assessment Reports
KPA6: Good Governance and Public Participation\ Responsible, accountable, effective and efficient corporate governance\ Performance
M_40
Number of Quarterly Performance Reports submitted to Audit Committee YTD*
Count the Number of Quarterly Performance Reports submitted to Audit Committee
# Lep_
PMS
4 1 2 3 4 4 4 4 Signed quarterly reports submitted to Audit Committee

238
Hierarchy (KPA\STRATEGIC OBJECTIVE \ Programme)
ID
INDICATOR Instruction (method of calculating the indicator)
UOM
Updater Baseline
2018/19
Actuals
Qtr. 1
Qtr. 2
Qtr. 3
Qtr. 4
Annual Target 2019/20
Annual Target 2020/21
Annual Target 2021/22
Portfolio of evidence
Management YTD*
KPA6: Good Governance and Public Participation\ Responsible, accountable, effective and efficient corporate governance\ Performance Management
M_44
Number of Section 72 (mid‐year performance reports) submitted to MM by 25th of January and to council by 31st January YTD*
Count the Number of Section 72 (mid‐year performance reports) submitted to MM by 25th of January and to Council by 31st January YTD*
# Lep_
PMS
1 N/A N/A 1 N/A 1 1 1 Council resolution, Mid‐Year Report.
KPA6: Good Governance and Public Participation\ Responsible, accountable, effective and efficient corporate governance\ Public Participation
M_664
Number of public participation policies/strategy reviewed and approved by Council YTD*
Count the Number of public participation policies reviewed and approved by Council YTD*
# Lep_
MPP
1 N/A N/A N/A 1 1 1 1 Council resolution
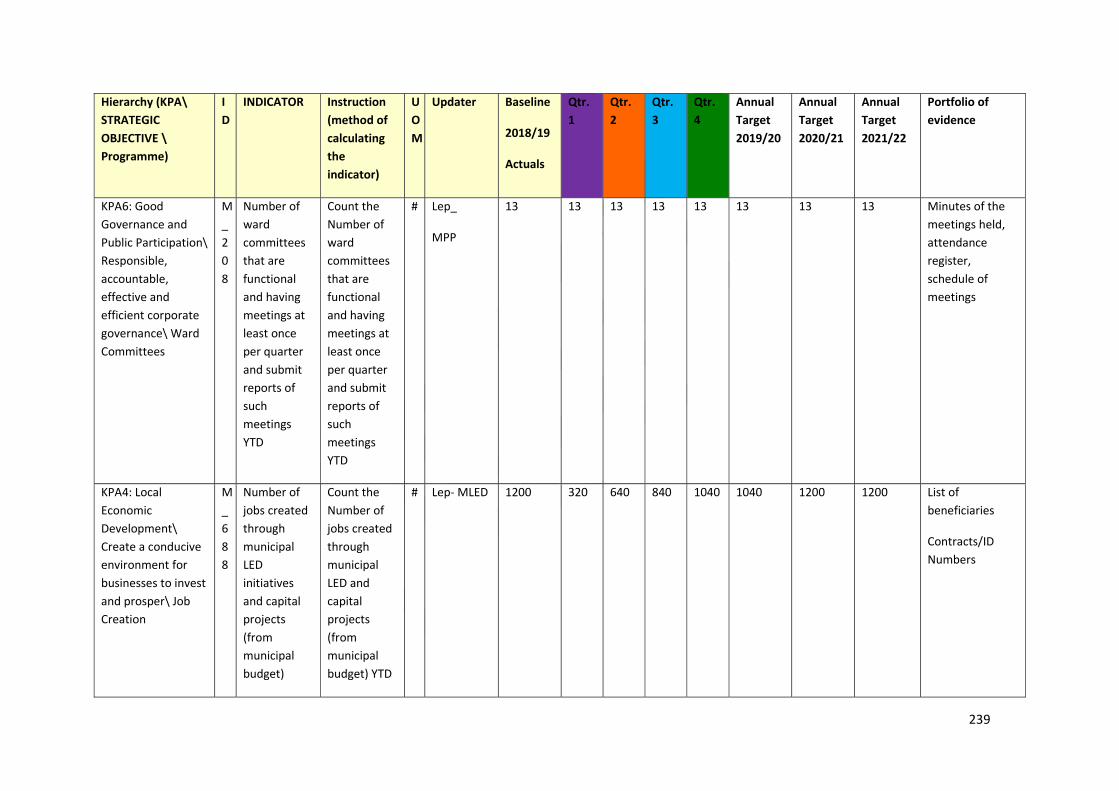
239
Hierarchy (KPA\STRATEGIC OBJECTIVE \ Programme)
ID
INDICATOR Instruction (method of calculating the indicator)
UOM
Updater Baseline
2018/19
Actuals
Qtr. 1
Qtr. 2
Qtr. 3
Qtr. 4
Annual Target 2019/20
Annual Target 2020/21
Annual Target 2021/22
Portfolio of evidence
KPA6: Good Governance and Public Participation\ Responsible, accountable, effective and efficient corporate governance\ Ward Committees
M_208
Number of ward committees that are functional and having meetings at least once per quarter and submit reports of such meetings YTD
Count the Number of ward committees that are functional and having meetings at least once per quarter and submit reports of such meetings YTD
# Lep_
MPP
13 13 13 13 13 13 13 13 Minutes of the meetings held, attendance register, schedule of meetings
KPA4: Local Economic Development\ Create a conducive environment for businesses to invest and prosper\ Job Creation
M_688
Number of jobs created through municipal LED initiatives and capital projects (from municipal budget)
Count the Number of jobs created through municipal LED and capital projects (from municipal budget) YTD
# Lep‐ MLED 1200 320 640 840 1040 1040 1200 1200 List of beneficiaries
Contracts/ID Numbers

240
Hierarchy (KPA\STRATEGIC OBJECTIVE \ Programme)
ID
INDICATOR Instruction (method of calculating the indicator)
UOM
Updater Baseline
2018/19
Actuals
Qtr. 1
Qtr. 2
Qtr. 3
Qtr. 4
Annual Target 2019/20
Annual Target 2020/21
Annual Target 2021/22
Portfolio of evidence
YTD*
KPA4: Local Economic Development\ Create a conducive environment for businesses to invest and prosper\ Job Creation
M_51
Number of jobs created through strategic partners (energy generation, new mines and other business proposals) YTD*
Count the Number of jobs created through strategic partners (energy generation, new mines and other business proposals) YTD
# MLED 1207 213 425 658 850 850 900 1 000 Numbers as reported from employing companies.
List of beneficiaries
Contracts/ID Numbers
KPA4: Local Economic Development\ Create a conducive environment for businesses to invest and prosper\ Marketing and Branding
M_695
Number of Public Private Partnerships established YTD*
Count the Number of Public Private Partnerships established YTD
# Lep‐ MLED 2 1 1 2 2 2 2 2 MOA
Minutes

241
Hierarchy (KPA\STRATEGIC OBJECTIVE \ Programme)
ID
INDICATOR Instruction (method of calculating the indicator)
UOM
Updater Baseline
2018/19
Actuals
Qtr. 1
Qtr. 2
Qtr. 3
Qtr. 4
Annual Target 2019/20
Annual Target 2020/21
Annual Target 2021/22
Portfolio of evidence
KPA4: Local Economic Development\ Create a conducive environment for businesses to invest and prosper\ Marketing and Branding
M_696
Number of meetings held with strategic partners YTD*
Count the Number of meetings held with strategic partners YTD
# Lep‐MLED 4 N/A 1 1 2 2 4 4 Invitations
Minutes
Agenda & Attendance registers
The abovementioned strategic and high level scorecards will form the basis for the quarterly, mid‐year and annual non‐financial performance monitoring and reporting. The planning details for each indicator will form part of the final SDBIP.

242
DEVELOPMENTPLANNING–VOTE6The high level indicators and targets for the Development Planning Directorate are as follows:
Hierarchy (KPA\ STRATEGIC OBJECTIVE \ Programme)
ID
INDICATOR Instruction (method of calculating the indicator)
UOM
Updater Baseline
2018/19
Actuals
Qtr. 1
Qtr. 2
Qtr. 3
Qtr. 4
Annual Target 2019/20
Annual Target 2020/21
Annual Target 2021/22
t
i Portfolio of evidence
KPA1: Spatial Rationale\ Rational planning to bridge first and second economies and provide adequate land for development\ Socio Economic Surveys
M_186
Percentage of enquiries captured and attended on a monthly basis, YTD.
Count the Number of enquiries captured and attended on a monthly basis, YTD.
Divide the attended queries by the total available and multiply by 100.
#
MHS
0
100%
100%
100%
100%
100%
100%
100%
Query register
KPA1: Spatial Rationale\ Rational planning to bridge first and second economies and provide
M_707
Number of human settlement development plans reviewed and approved
Count the number of human settlement development plans reviewed and approved by
# MHS 0 N/A N/A N/A 1 1 1 1 Council Resolution
Develop‐ment Plans
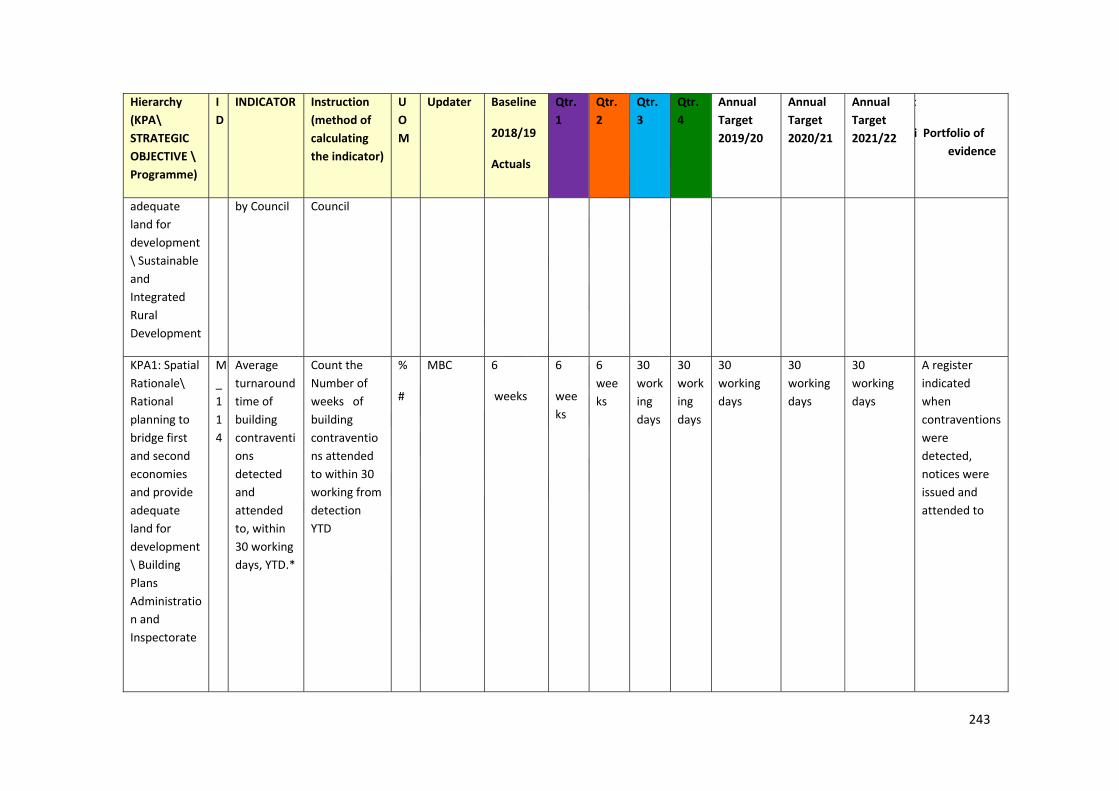
243
Hierarchy (KPA\ STRATEGIC OBJECTIVE \ Programme)
ID
INDICATOR Instruction (method of calculating the indicator)
UOM
Updater Baseline
2018/19
Actuals
Qtr. 1
Qtr. 2
Qtr. 3
Qtr. 4
Annual Target 2019/20
Annual Target 2020/21
Annual Target 2021/22
t
i Portfolio of evidence
adequate land for development\ Sustainable and Integrated Rural Development
by Council Council
KPA1: Spatial Rationale\ Rational planning to bridge first and second economies and provide adequate land for development\ Building Plans Administration and Inspectorate
M_114
Average turnaround time of building contraventions detected and attended to, within 30 working days, YTD.*
Count the Number of weeks of building contraventions attended to within 30 working from detection YTD
%
#
MBC 6
weeks
6
weeks
6 weeks
30 working days
30 working days
30 working days
30 working days
30 working days
A register indicated when contraventions were detected, notices were issued and attended to
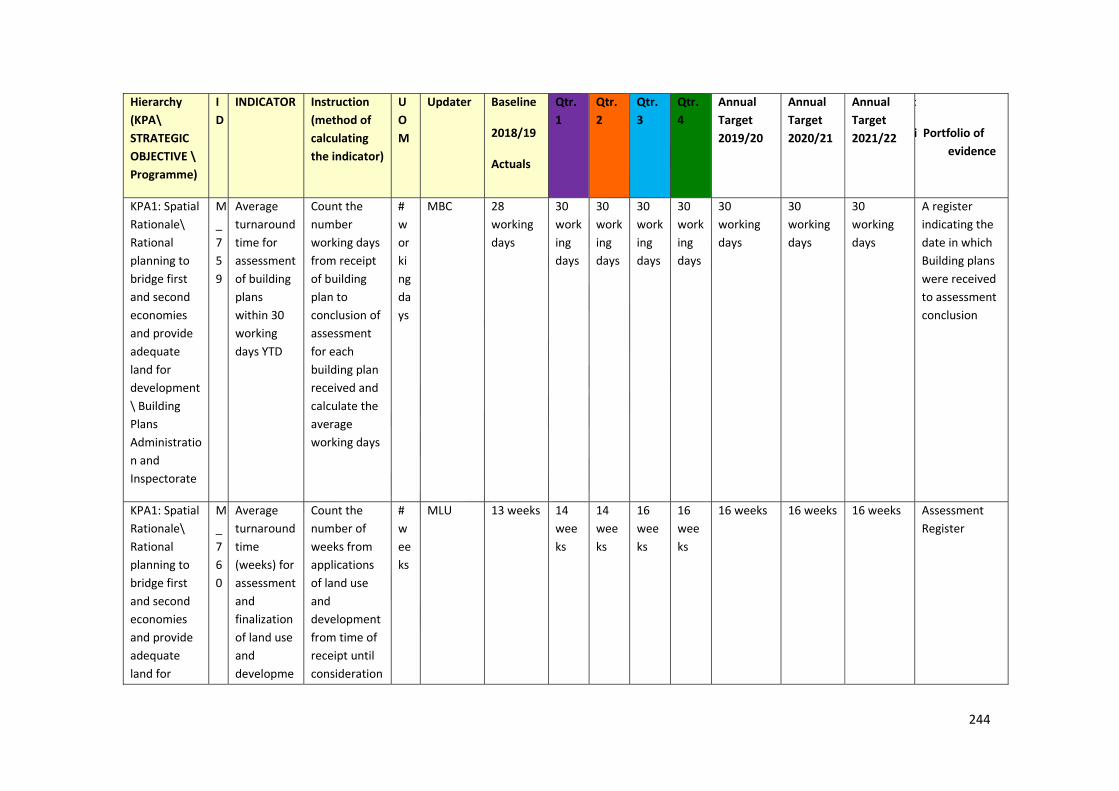
244
Hierarchy (KPA\ STRATEGIC OBJECTIVE \ Programme)
ID
INDICATOR Instruction (method of calculating the indicator)
UOM
Updater Baseline
2018/19
Actuals
Qtr. 1
Qtr. 2
Qtr. 3
Qtr. 4
Annual Target 2019/20
Annual Target 2020/21
Annual Target 2021/22
t
i Portfolio of evidence
KPA1: Spatial Rationale\ Rational planning to bridge first and second economies and provide adequate land for development\ Building Plans Administration and Inspectorate
M_759
Average turnaround time for assessment of building plans within 30 working days YTD
Count the number working days from receipt of building plan to conclusion of assessment for each building plan received and calculate the average working days
# working days
MBC 28 working days
30 working days
30 working days
30 working days
30 working days
30 working days
30 working days
30 working days
A register indicating the date in which Building plans were received to assessment conclusion
KPA1: Spatial Rationale\ Rational planning to bridge first and second economies and provide adequate land for
M_760
Average turnaround time (weeks) for assessment and finalization of land use and developme
Count the number of weeks from applications of land use and development from time of receipt until consideration
# weeks
MLU 13 weeks 14 weeks
14 weeks
16 weeks
16 weeks
16 weeks 16 weeks 16 weeks Assessment Register

245
Hierarchy (KPA\ STRATEGIC OBJECTIVE \ Programme)
ID
INDICATOR Instruction (method of calculating the indicator)
UOM
Updater Baseline
2018/19
Actuals
Qtr. 1
Qtr. 2
Qtr. 3
Qtr. 4
Annual Target 2019/20
Annual Target 2020/21
Annual Target 2021/22
t
i Portfolio of evidence
development\ Land use
nt applications from the date of receipt as delegated to the Executive Manager
by the delegated official
KPA1: Spatial Rationale\ Rational planning to bridge first and second economies and provide adequate land for development\ Land use
M_755
Average turnaround time (weeks) for assessment and finalization of land use and development applications from date of receipt as delegated to the
Count the number of weeks from receipt of applications for land development and land use received until consideration by the Municipal Planning Tribunal.
# weeks
MLU 16 weeks 16 weeks
16 weeks
26 weeks
26 weeks
26 weeks 26 weeks 26 weeks Assessment Register
Tribunal Meeting Minutes

246
Hierarchy (KPA\ STRATEGIC OBJECTIVE \ Programme)
ID
INDICATOR Instruction (method of calculating the indicator)
UOM
Updater Baseline
2018/19
Actuals
Qtr. 1
Qtr. 2
Qtr. 3
Qtr. 4
Annual Target 2019/20
Annual Target 2020/21
Annual Target 2021/22
t
i Portfolio of evidence
Municipal Planning Tribunal
KPA1: Spatial Rationale\ Rational planning to bridge first and second economies and provide adequate land for development\ Land use
M_761
Average turnaround time of land use contraventions detected and attended to within 30 working days.
Count the number of detection from detection of land use contraventions until notices or directives have been issued, for each contravention and calculate the average days
# weeks
MLU 1
week
6 weeks
6 weeks
30 working days,
30 working days,
30 working days,
30 working days,
30 working days,
Notices issued
A register of recording all land contraventions date of detection/reported to date of notice issued
KPA1: Spatial Rationale\ Rational planning to bridge first and second
M_733
Number of Land Use Scheme compiled, approved by Council
Count the Number of Land Use Scheme compiled, approved by
# MLU 0 N/A N/A N/A 1 1 1 1 Council Resolution and the Approved Land use
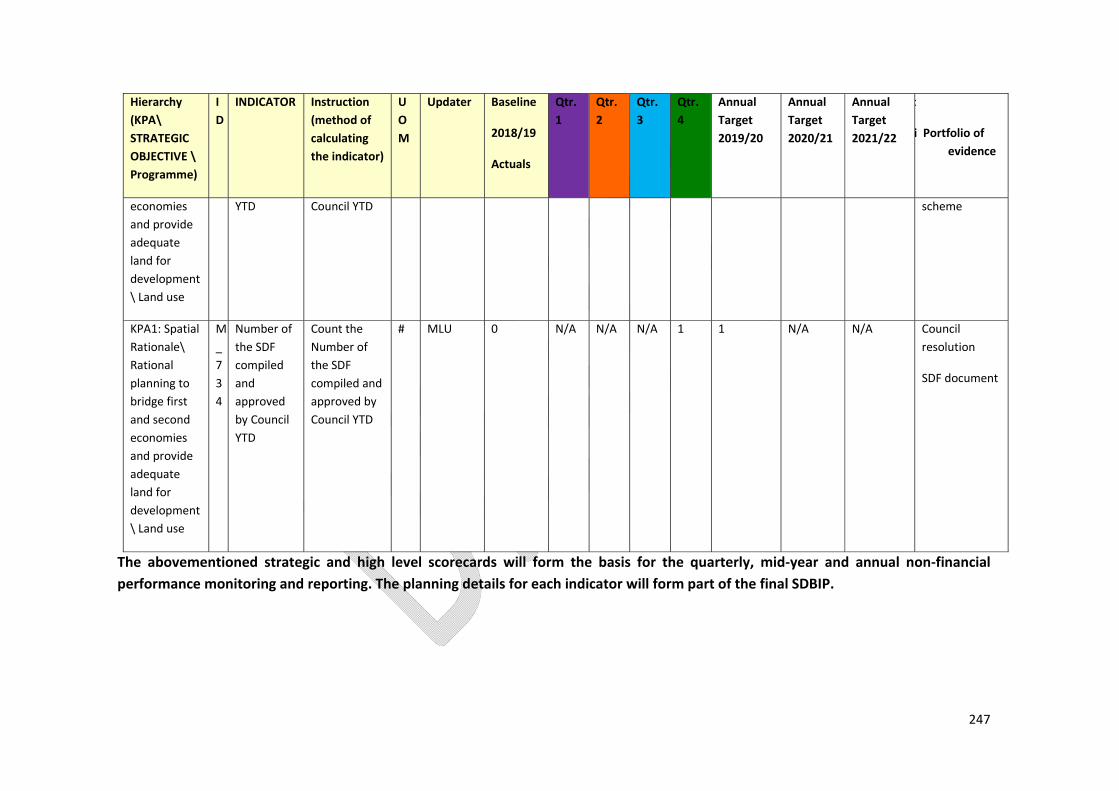
247
Hierarchy (KPA\ STRATEGIC OBJECTIVE \ Programme)
ID
INDICATOR Instruction (method of calculating the indicator)
UOM
Updater Baseline
2018/19
Actuals
Qtr. 1
Qtr. 2
Qtr. 3
Qtr. 4
Annual Target 2019/20
Annual Target 2020/21
Annual Target 2021/22
t
i Portfolio of evidence
economies and provide adequate land for development\ Land use
YTD Council YTD scheme
KPA1: Spatial Rationale\ Rational planning to bridge first and second economies and provide adequate land for development\ Land use
M_734
Number of the SDF compiled and approved by Council YTD
Count the Number of the SDF compiled and approved by Council YTD
# MLU 0 N/A N/A N/A 1 1 N/A N/A Council resolution
SDF document
The abovementioned strategic and high level scorecards will form the basis for the quarterly, mid‐year and annual non‐financial performance monitoring and reporting. The planning details for each indicator will form part of the final SDBIP.

248
CORPORATEANDSUPPORTSERVICES–VOTE3The high level indicators and targets for the Corporate Support Services Directorate are as follows:
Hierarchy (KPA\ STRATEGIC OBJECTIVE \ Programme)
ID
INDICATOR Instruction (method of calculating the indicator)
UOM
Updater Baseline
2018/19
Actuals
Qtr. 1
Qtr. 2
Qtr. 3
Qtr. 4
Annual Target 2019/20
Annual Target 2020/21
Annual Target 2021/22
Portfolio of evidence
KPA5: Transformation and Organisational Development\ Improve functionality, performance and professionalism\ Human Resource Management
M_
404
Number of people from employment equity groups employed in the three highest levels of management YTD*
Count the Number of people from employment equity groups (the groups as identified in the approved employment equity plan) employed in the three highest levels of the municipal organizational structure YTD
# Lep_
MHR
27 26 28 28 28 28 31 31 Appointment letter, org structure, advert , council resolution(sec,57) minutes of panel,),shortlisting minutes/report
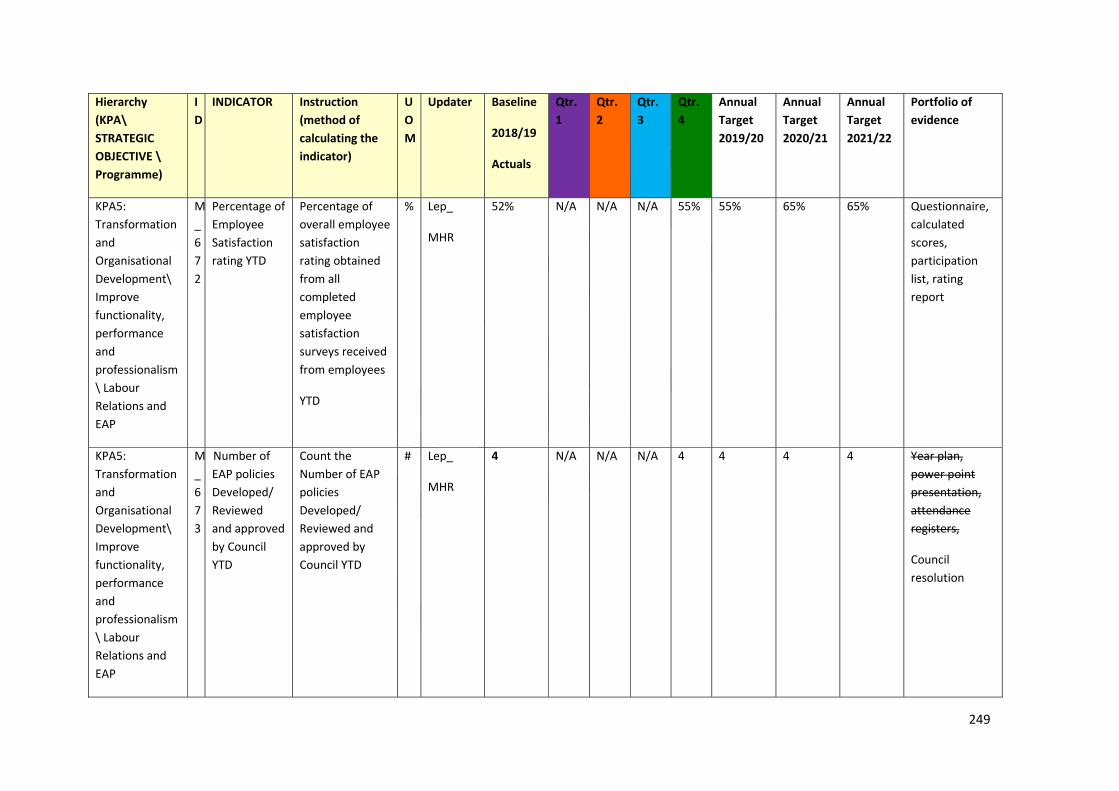
249
Hierarchy (KPA\ STRATEGIC OBJECTIVE \ Programme)
ID
INDICATOR Instruction (method of calculating the indicator)
UOM
Updater Baseline
2018/19
Actuals
Qtr. 1
Qtr. 2
Qtr. 3
Qtr. 4
Annual Target 2019/20
Annual Target 2020/21
Annual Target 2021/22
Portfolio of evidence
KPA5: Transformation and Organisational Development\ Improve functionality, performance and professionalism\ Labour Relations and EAP
M_672
Percentage of Employee Satisfaction rating YTD
Percentage of overall employee satisfaction rating obtained from all completed employee satisfaction surveys received from employees
YTD
% Lep_
MHR
52% N/A N/A N/A 55% 55% 65% 65% Questionnaire, calculated scores, participation list, rating report
KPA5: Transformation and Organisational Development\ Improve functionality, performance and professionalism\ Labour Relations and EAP
M_673
Number of EAP policies Developed/ Reviewed and approved by Council YTD
Count the Number of EAP policies Developed/ Reviewed and approved by Council YTD
# Lep_
MHR
4 N/A N/A N/A 4 4 4 4 Year plan, power point presentation, attendance registers,
Council resolution

250
Hierarchy (KPA\ STRATEGIC OBJECTIVE \ Programme)
ID
INDICATOR Instruction (method of calculating the indicator)
UOM
Updater Baseline
2018/19
Actuals
Qtr. 1
Qtr. 2
Qtr. 3
Qtr. 4
Annual Target 2019/20
Annual Target 2020/21
Annual Target 2021/22
Portfolio of evidence
KPA5: Transformation and Organisational Development\ Improve functionality, performance and professionalism\ Labour Relations and EAP
M_678
Number of LLF meetings held YTD*
Count the Number of LLF meetings held YTD
# Lep_MHR
7 3 5 5 6 6 10 10 Invite, attendance register, minutes, year schedule, resolution register
KPA5: Transformation and Organisational Development\ Improve functionality, performance and professionalism\ Occupational health and Safety
M_680
Number of OHS audits conducted quarterly YTD
Count the Number of OHS audits conducted Quarterly YTD
# Lep_
MHR
4 N/A N/A N/A 1 1 1 4 Quarterly audit reports (observation sheets and contractors inspection checklists)signed off by EMCSSS,
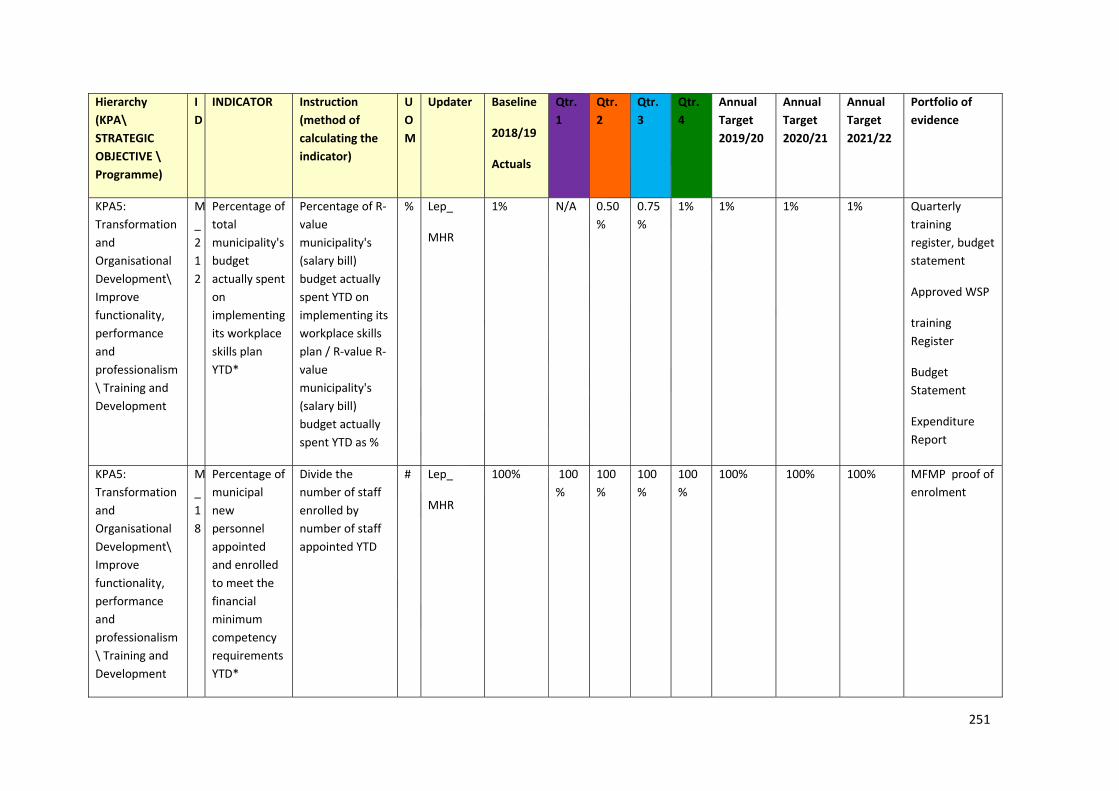
251
Hierarchy (KPA\ STRATEGIC OBJECTIVE \ Programme)
ID
INDICATOR Instruction (method of calculating the indicator)
UOM
Updater Baseline
2018/19
Actuals
Qtr. 1
Qtr. 2
Qtr. 3
Qtr. 4
Annual Target 2019/20
Annual Target 2020/21
Annual Target 2021/22
Portfolio of evidence
KPA5: Transformation and Organisational Development\ Improve functionality, performance and professionalism\ Training and Development
M_212
Percentage of total municipality's budget actually spent on implementing its workplace skills plan YTD*
Percentage of R‐value municipality's (salary bill) budget actually spent YTD on implementing its workplace skills plan / R‐value R‐value municipality's (salary bill) budget actually spent YTD as %
% Lep_
MHR
1% N/A 0.50%
0.75%
1% 1% 1% 1% Quarterly training register, budget statement
Approved WSP
training Register
Budget Statement
Expenditure Report
KPA5: Transformation and Organisational Development\ Improve functionality, performance and professionalism\ Training and Development
M_18
Percentage of municipal new personnel appointed and enrolled to meet the financial minimum competency requirements YTD*
Divide the number of staff enrolled by number of staff appointed YTD
# Lep_
MHR
100% 100%
100%
100%
100%
100% 100% 100% MFMP proof of enrolment

252
Hierarchy (KPA\ STRATEGIC OBJECTIVE \ Programme)
ID
INDICATOR Instruction (method of calculating the indicator)
UOM
Updater Baseline
2018/19
Actuals
Qtr. 1
Qtr. 2
Qtr. 3
Qtr. 4
Annual Target 2019/20
Annual Target 2020/21
Annual Target 2021/22
Portfolio of evidence
KPA5: Transformation and Organisational Development\ Improve functionality, performance and professionalism\ Training and Development
M_19
Number of municipal personnel with technical skills/ capacity (engineering technicians and technicians) YTD*
Count the number of personnel with technical skills against the positions on organisational structure. YTD
# Lep_
MHR
14 15 15 15 15 15 16 18 Org structure indicating vacant and filled positions
KPA5: Transformation and Organisational Development\ Improve functionality, performance and professionalism\ Training and Development
M‐ 0032
Percentage of vacancy rate YTD
Number of vacant positions divide by total number of positions budgeted on the organisational structure YTD
% Lep ‐MHR
10% N/A 8% 7% 6% 6% 6% 6% Adverts, appointment letters, updated organisational structure
Organogram
Recruitment Plan
Adverts
Appointment

253
Hierarchy (KPA\ STRATEGIC OBJECTIVE \ Programme)
ID
INDICATOR Instruction (method of calculating the indicator)
UOM
Updater Baseline
2018/19
Actuals
Qtr. 1
Qtr. 2
Qtr. 3
Qtr. 4
Annual Target 2019/20
Annual Target 2020/21
Annual Target 2021/22
Portfolio of evidence
letters
Calculation Summary of the vacancy Rate percentage
KPA5: Transformation and Organisational Development\ Improve functionality, performance and professionalism\ Training and Development
M_21
Percentage of municipal personnel budget spent YTD*
Divide the actual value spent on personnel remunerations by Total Budget for the Year YTD
% Lep_
MHR
97% 23% 46% 72% 97% 97% 100% 100% Report from BTO Percentage of municipal personnel budget spent (signed off by BTO and EMCSSS)
Transformation and Organisational Development\ Improve functionality, performance and
M‐HR1
Percentage of newly appointed managers who have gone through the competency
Divide the number of newly appointed managers by the number of competency assessment
% Lep‐MHR
100% 100%
100%
100%
100%
100% 100% 100% Appointment letter , competency results
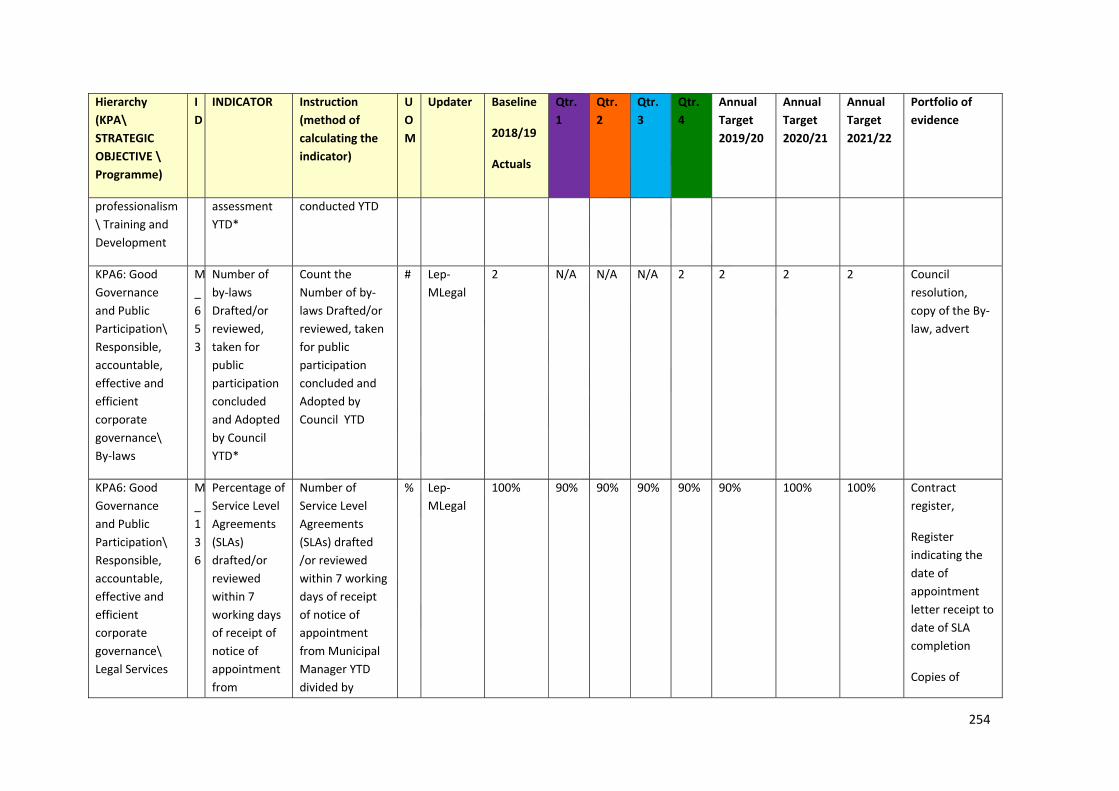
254
Hierarchy (KPA\ STRATEGIC OBJECTIVE \ Programme)
ID
INDICATOR Instruction (method of calculating the indicator)
UOM
Updater Baseline
2018/19
Actuals
Qtr. 1
Qtr. 2
Qtr. 3
Qtr. 4
Annual Target 2019/20
Annual Target 2020/21
Annual Target 2021/22
Portfolio of evidence
professionalism\ Training and Development
assessment YTD*
conducted YTD
KPA6: Good Governance and Public Participation\ Responsible, accountable, effective and efficient corporate governance\ By‐laws
M_653
Number of by‐laws Drafted/or reviewed, taken for public participation concluded and Adopted by Council YTD*
Count the Number of by‐laws Drafted/or reviewed, taken for public participation concluded and Adopted by Council YTD
# Lep‐MLegal
2 N/A N/A N/A 2 2 2 2 Council resolution, copy of the By‐law, advert
KPA6: Good Governance and Public Participation\ Responsible, accountable, effective and efficient corporate governance\ Legal Services
M_136
Percentage of Service Level Agreements (SLAs) drafted/or reviewed within 7 working days of receipt of notice of appointment from
Number of Service Level Agreements (SLAs) drafted /or reviewed within 7 working days of receipt of notice of appointment from Municipal Manager YTD divided by
% Lep‐MLegal
100% 90% 90% 90% 90% 90% 100% 100% Contract register,
Register indicating the date of appointment letter receipt to date of SLA completion
Copies of
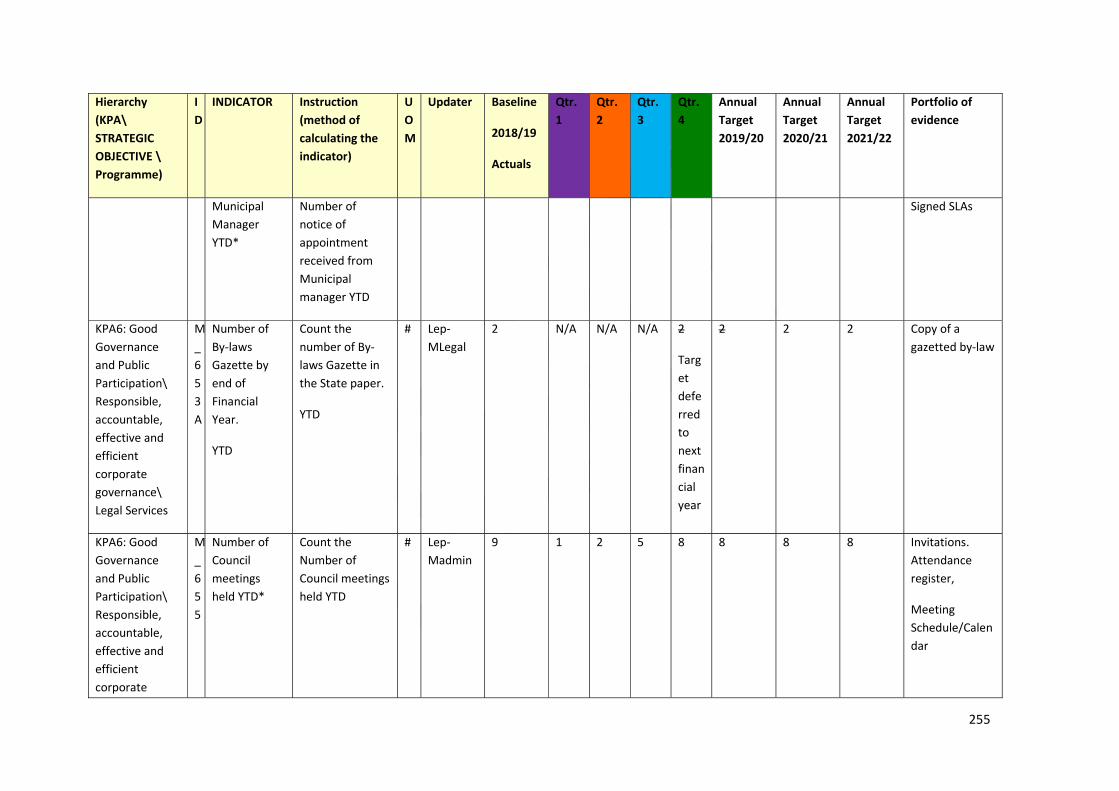
255
Hierarchy (KPA\ STRATEGIC OBJECTIVE \ Programme)
ID
INDICATOR Instruction (method of calculating the indicator)
UOM
Updater Baseline
2018/19
Actuals
Qtr. 1
Qtr. 2
Qtr. 3
Qtr. 4
Annual Target 2019/20
Annual Target 2020/21
Annual Target 2021/22
Portfolio of evidence
Municipal Manager YTD*
Number of notice of appointment received from Municipal manager YTD
Signed SLAs
KPA6: Good Governance and Public Participation\ Responsible, accountable, effective and efficient corporate governance\ Legal Services
M_653A
Number of By‐laws Gazette by end of Financial Year.
YTD
Count the number of By‐laws Gazette in the State paper.
YTD
# Lep‐MLegal
2 N/A N/A N/A 2
Target deferred to next financial year
2 2 2 Copy of a gazetted by‐law
KPA6: Good Governance and Public Participation\ Responsible, accountable, effective and efficient corporate
M_655
Number of Council meetings held YTD*
Count the Number of Council meetings held YTD
# Lep‐Madmin
9 1 2 5 8 8 8 8 Invitations. Attendance register,
Meeting Schedule/Calendar
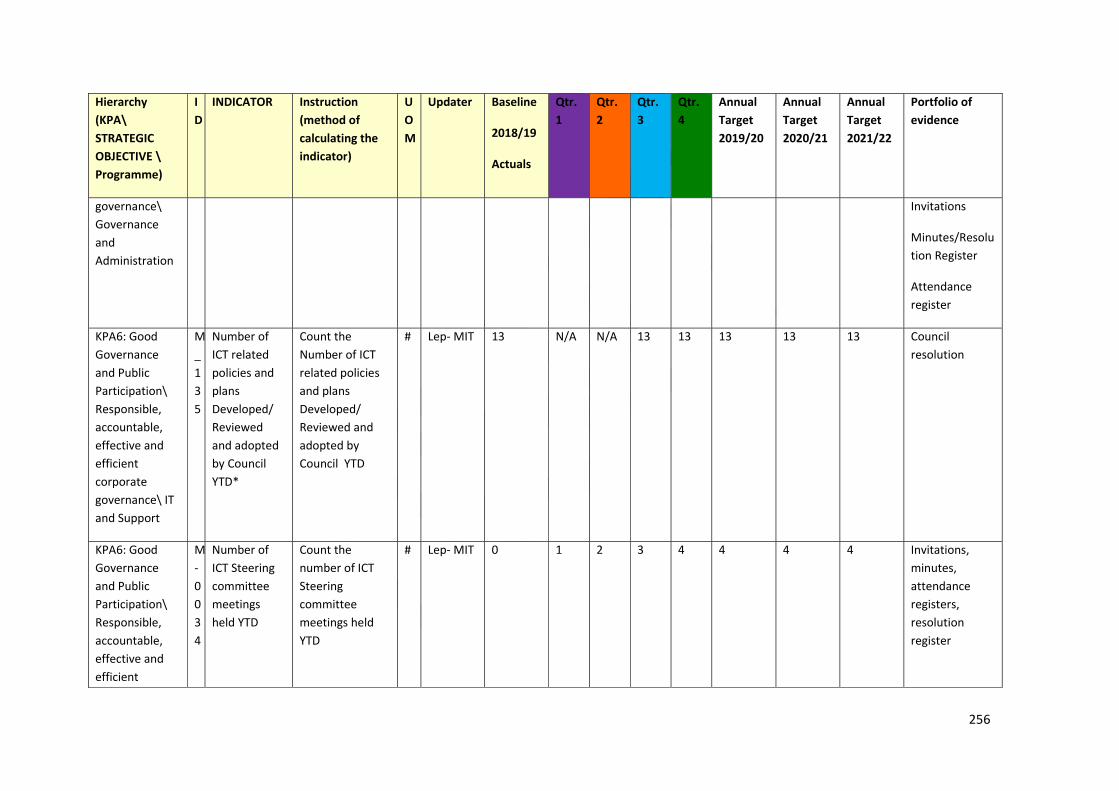
256
Hierarchy (KPA\ STRATEGIC OBJECTIVE \ Programme)
ID
INDICATOR Instruction (method of calculating the indicator)
UOM
Updater Baseline
2018/19
Actuals
Qtr. 1
Qtr. 2
Qtr. 3
Qtr. 4
Annual Target 2019/20
Annual Target 2020/21
Annual Target 2021/22
Portfolio of evidence
governance\ Governance and Administration
Invitations
Minutes/Resolution Register
Attendance register
KPA6: Good Governance and Public Participation\ Responsible, accountable, effective and efficient corporate governance\ IT and Support
M_135
Number of ICT related policies and plans Developed/ Reviewed and adopted by Council YTD*
Count the Number of ICT related policies and plans Developed/ Reviewed and adopted by Council YTD
# Lep‐ MIT 13 N/A N/A 13 13 13 13 13 Council resolution
KPA6: Good Governance and Public Participation\ Responsible, accountable, effective and efficient
M‐0034
Number of ICT Steering committee meetings held YTD
Count the number of ICT Steering committee meetings held YTD
# Lep‐ MIT 0 1 2 3 4 4 4 4 Invitations, minutes, attendance registers, resolution register
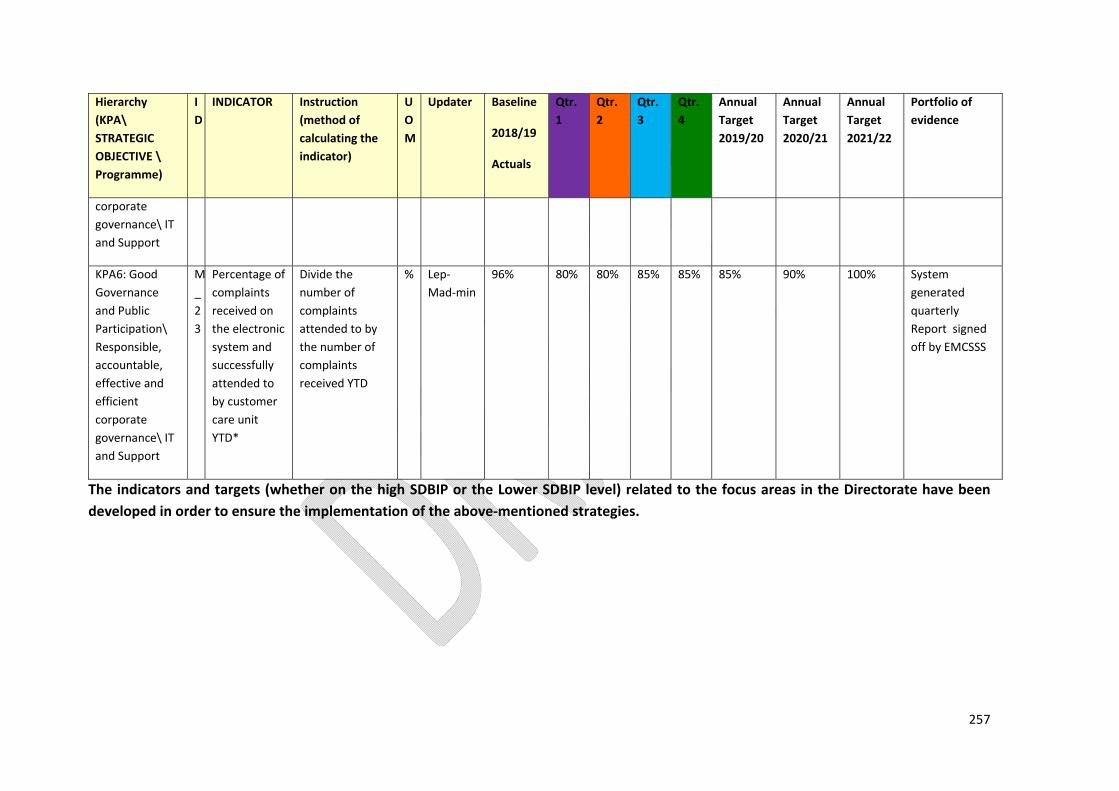
257
Hierarchy (KPA\ STRATEGIC OBJECTIVE \ Programme)
ID
INDICATOR Instruction (method of calculating the indicator)
UOM
Updater Baseline
2018/19
Actuals
Qtr. 1
Qtr. 2
Qtr. 3
Qtr. 4
Annual Target 2019/20
Annual Target 2020/21
Annual Target 2021/22
Portfolio of evidence
corporate governance\ IT and Support
KPA6: Good Governance and Public Participation\ Responsible, accountable, effective and efficient corporate governance\ IT and Support
M_23
Percentage of complaints received on the electronic system and successfully attended to by customer care unit YTD*
Divide the number of complaints attended to by the number of complaints received YTD
% Lep‐Mad‐min
96% 80% 80% 85% 85% 85% 90% 100% System generated quarterly Report signed off by EMCSSS
The indicators and targets (whether on the high SDBIP or the Lower SDBIP level) related to the focus areas in the Directorate have been developed in order to ensure the implementation of the above‐mentioned strategies.

258
BUDGETANDTREASURYOFFICE–VOTE2The high level indicators and targets for the Budget and Treasury Directorate are as follows:
Hierarchy (KPA\STRATEGIC OBJECTIVE \ Programme)
ID
INDICATOR Instruction (method of calculating the indicator)
UOM
Updater Baseline
2018/19
Actuals
Qtr. 1
Qtr. 2
Qtr. 3
Qtr. 4
Annual Target 2019/20
Annual Target 2020/21
Annual Target 2021/22
Portfolio of evidence
KPA3: Financial Viability and Financial Management\ Enhance revenue and financial management\ Asset Management
M_
17
Number of Asset Verification conducted YTD
Count the Number of Asset Verification conducted YTD
# Lep‐MB&R
1 N/A N/A N/A 1 1 1 1 SLA of Appointed Service Provider
Updated Asset Registers
KPA3: Financial Viability and Financial Management\ Enhance revenue and financial management\ Asset Management
M_
630
Percentage Liquidity ratio (R‐value current assets / R‐value current liabilities as percentage) YTD
R‐value current assets / R‐value current liabilities as percentage YTD
% Lep‐MB&R
282% 200%
200%
200%
200%
200% 200% 200% Financial report
KPA3: Financial Viability and Financial Management\ Enhance revenue and financial management\ Budget and Reporting
M_25
Number of quarterly financial reports submitted to Council YTD*
Count the Number of quarterly financial reports submitted to
# Lep‐MB&R
4 1 1 1 1 4 4 4 Financial report,
Quarterly reports to Council
Council

259
Hierarchy (KPA\STRATEGIC OBJECTIVE \ Programme)
ID
INDICATOR Instruction (method of calculating the indicator)
UOM
Updater Baseline
2018/19
Actuals
Qtr. 1
Qtr. 2
Qtr. 3
Qtr. 4
Annual Target 2019/20
Annual Target 2020/21
Annual Target 2021/22
Portfolio of evidence
Council YTD* resolution
KPA3: Financial Viability and Financial Management\ Enhance revenue and financial management\ Budget and Reporting
M_756
Number of Interim financial statements prepared and submitted to Audit Committee YTD
Count the Number of Interim financial statements prepared and submitted to Audit Committee YTD
# Lep‐MB&R
1 N/A N/A 1 N/A 1 1 1 Interim Financial Statements
KPA3: Financial Viability and Financial Management\ Enhance revenue and financial management\ Budget and Reporting
M_281
Number of Annual Financial Statements submitted to the Auditor General on time (by end August) YTD
Count the Number of Annual Financial Statements submitted to the Auditor General on time (by end August) YTD
# Lep‐MB&R
1 1 N/A N/A N/A 1 1 1 Set of Financial Statements(AFS)’,
Proof of submission
KPA3: Financial Viability and Financial Management\ Enhance revenue and financial management\ Budget
M_397
Percentage Cost coverage (R‐value all cash at a particular time plus R‐
R‐value all cash at a particular time plus R‐value investments,
% Lep‐MB&R
134% 200%
200%
200%
200%
200% 200% 200% Financial Report

260
Hierarchy (KPA\STRATEGIC OBJECTIVE \ Programme)
ID
INDICATOR Instruction (method of calculating the indicator)
UOM
Updater Baseline
2018/19
Actuals
Qtr. 1
Qtr. 2
Qtr. 3
Qtr. 4
Annual Target 2019/20
Annual Target 2020/21
Annual Target 2021/22
Portfolio of evidence
and Reporting value investments, divided by R‐value monthly fixed operating expenditure) YTD
divided by R‐value monthly fixed operating expenditure YTD
KPA3: Financial Viability and Financial Management\ Enhance revenue and financial management\ Expenditure Management
M_
11
Percentage of municipal Financial Management Grant spent YTD*
Divide the Actual FMG R/ value spent by Total FMG grant allocation for the Year YTD
% Lep‐MExp
100% 20% 50% 75% 100%
100% 100% 100% Financial Report
KPA3: Financial Viability and Financial Management\ Enhance revenue and financial management\ Expenditure Management
M_
205
Percentage Debt coverage (total R‐value operating revenue received minus R‐value Operating grants, divided by R‐value debt service payments (i.e.
Total R‐value operating revenue received minus R‐value Operating grants, divided by R‐value debt service payments (i.e. interest + redemption)
% Lep‐MExp
1299% 200%
200%
200%
200%
200% 200% 200% Financial Report

261
Hierarchy (KPA\STRATEGIC OBJECTIVE \ Programme)
ID
INDICATOR Instruction (method of calculating the indicator)
UOM
Updater Baseline
2018/19
Actuals
Qtr. 1
Qtr. 2
Qtr. 3
Qtr. 4
Annual Target 2019/20
Annual Target 2020/21
Annual Target 2021/22
Portfolio of evidence
interest + redemption) due within financial year) YTD
due within financial year YTD
KPA3: Financial Viability and Financial Management\ Enhance revenue and financial management\Supply Chain management
M_scm1
Number of tender reports submitted to council per quarter YTD
Count the Number of tender reports submitted to council per quarter YTD
# Lep‐
MSCM
4 1 1 1 1 4 4 4 Tender reports
KPA3: Financial Viability and Financial Management\ Enhance revenue and financial management\Supply Chain management
M_s
cm2
Number of Deviation reports submitted to council per quarter YTD
Count the Number of deviation reports submitted to council per quarter YTD
# Lep‐
MSCM
4 1 1 1 1 4 4 4 Deviation report
KPA3: Financial Viability and Financial Management\ Enhance revenue and financial management\Supply Chain management
M_scm3
Number of stock count done per annum
Count the Number of stock count done per annum
# Lep‐
MSCM
1 N/A N/A N/A 1 1 1 1 Stock taking report

262
Hierarchy (KPA\STRATEGIC OBJECTIVE \ Programme)
ID
INDICATOR Instruction (method of calculating the indicator)
UOM
Updater Baseline
2018/19
Actuals
Qtr. 1
Qtr. 2
Qtr. 3
Qtr. 4
Annual Target 2019/20
Annual Target 2020/21
Annual Target 2021/22
Portfolio of evidence
KPA3: Financial Viability and Financial Management\ Enhance revenue and financial management\ Revenue Management
M_33
Percentage debt collected YTD
R‐value debt collected YTD / R‐value debt owed to the municipality YTD as % (in terms of current financial year billings)
% Lep‐MRev
90% 90% 95% 95% 95% 95% 95% 95% Revenue collection report
KPA3: Financial Viability and Financial Management\ Enhance revenue and financial management\ Revenue Management
M_396
Percentage outstanding service debtors to revenue (R‐value total outstanding service debtors divided by R‐value annual revenue actually received for services) YTD
R‐value total outstanding service debtors divided by R‐value annual revenue actually received for services YTD
% Lep‐MRev
10% 10% 5% 5% 5% 5% 5% 5% Revenue collection report
KPA3: Financial Viability and Financial Management\ Enhance
M_6
Number of credit control policies
Count the Number of credit control
# Lep‐MRev
1 N/A N/A N/A 1 1 1 1 Council resolution
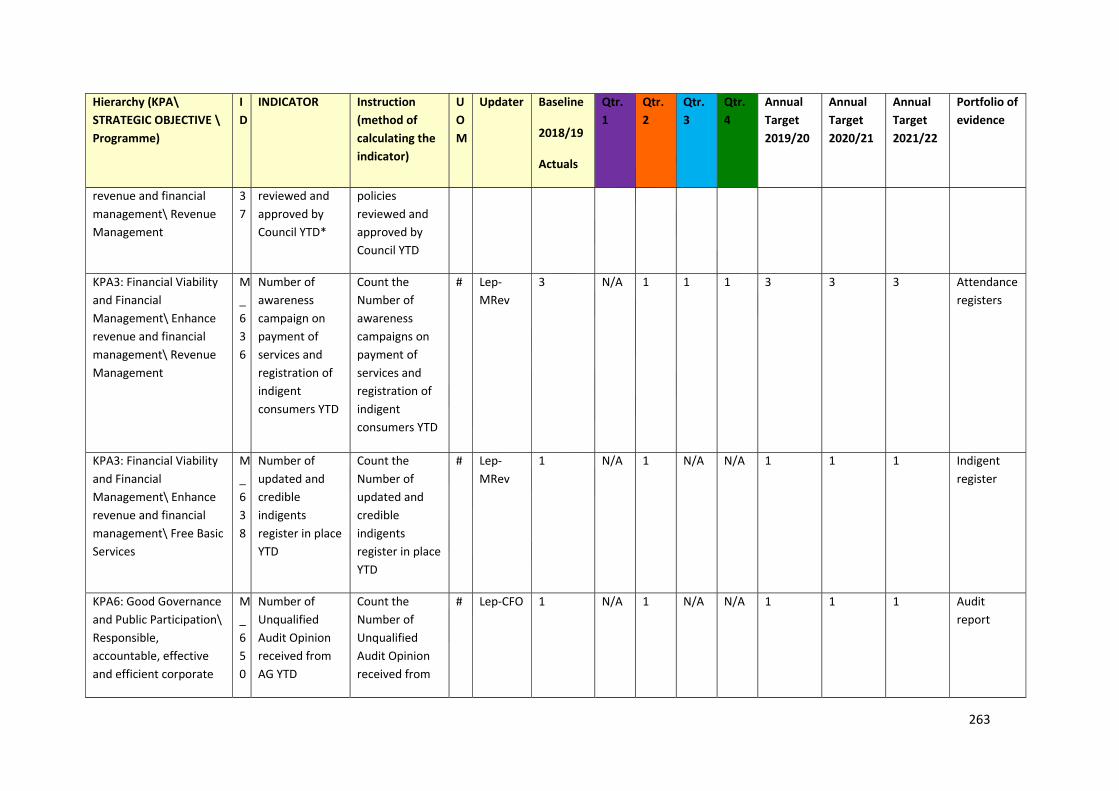
263
Hierarchy (KPA\STRATEGIC OBJECTIVE \ Programme)
ID
INDICATOR Instruction (method of calculating the indicator)
UOM
Updater Baseline
2018/19
Actuals
Qtr. 1
Qtr. 2
Qtr. 3
Qtr. 4
Annual Target 2019/20
Annual Target 2020/21
Annual Target 2021/22
Portfolio of evidence
revenue and financial management\ Revenue Management
37
reviewed and approved by Council YTD*
policies reviewed and approved by Council YTD
KPA3: Financial Viability and Financial Management\ Enhance revenue and financial management\ Revenue Management
M_636
Number of awareness campaign on payment of services and registration of indigent consumers YTD
Count the Number of awareness campaigns on payment of services and registration of indigent consumers YTD
# Lep‐MRev
3 N/A 1
1 1 3 3 3 Attendance registers
KPA3: Financial Viability and Financial Management\ Enhance revenue and financial management\ Free Basic Services
M_638
Number of updated and credible indigents register in place YTD
Count the Number of updated and credible indigents register in place YTD
# Lep‐MRev
1 N/A 1 N/A N/A 1 1 1 Indigent register
KPA6: Good Governance and Public Participation\ Responsible, accountable, effective and efficient corporate
M_650
Number of Unqualified Audit Opinion received from AG YTD
Count the Number of Unqualified Audit Opinion received from
# Lep‐CFO 1 N/A 1 N/A N/A 1 1 1 Audit report
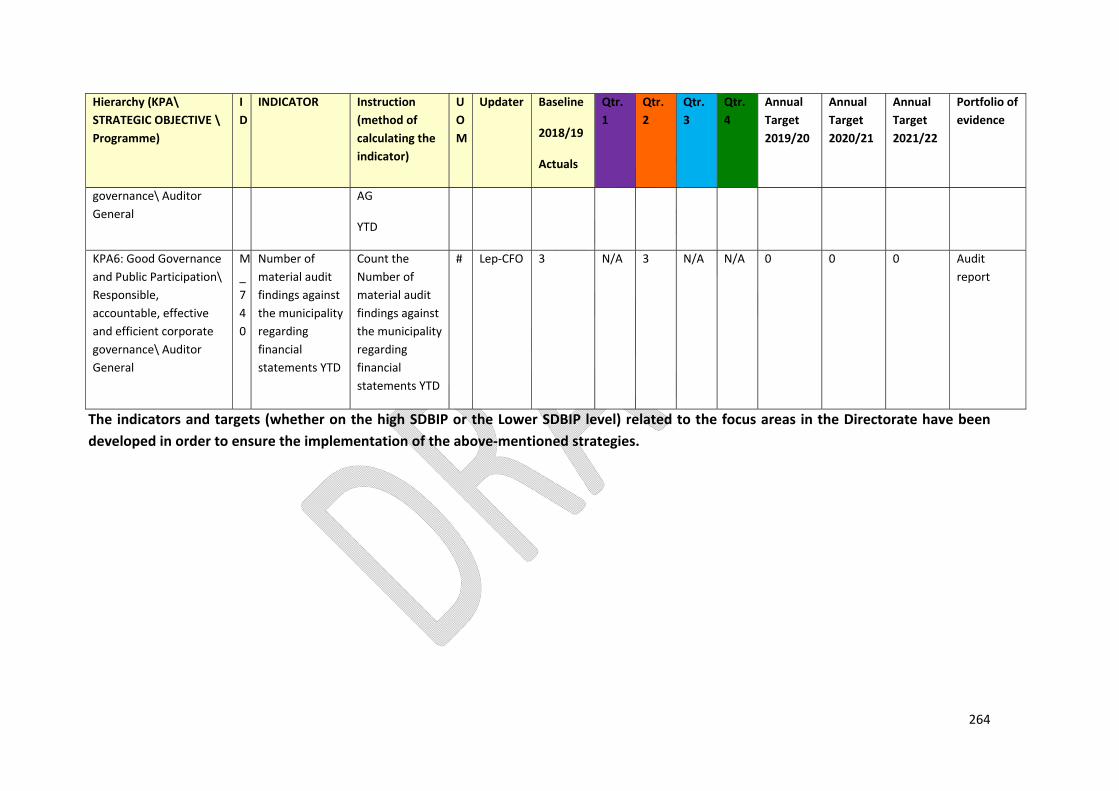
264
Hierarchy (KPA\STRATEGIC OBJECTIVE \ Programme)
ID
INDICATOR Instruction (method of calculating the indicator)
UOM
Updater Baseline
2018/19
Actuals
Qtr. 1
Qtr. 2
Qtr. 3
Qtr. 4
Annual Target 2019/20
Annual Target 2020/21
Annual Target 2021/22
Portfolio of evidence
governance\ Auditor General
AG
YTD
KPA6: Good Governance and Public Participation\ Responsible, accountable, effective and efficient corporate governance\ Auditor General
M_740
Number of material audit findings against the municipality regarding financial statements YTD
Count the Number of material audit findings against the municipality regarding financial statements YTD
# Lep‐CFO 3 N/A 3 N/A N/A 0 0 0 Audit report
The indicators and targets (whether on the high SDBIP or the Lower SDBIP level) related to the focus areas in the Directorate have been developed in order to ensure the implementation of the above‐mentioned strategies.
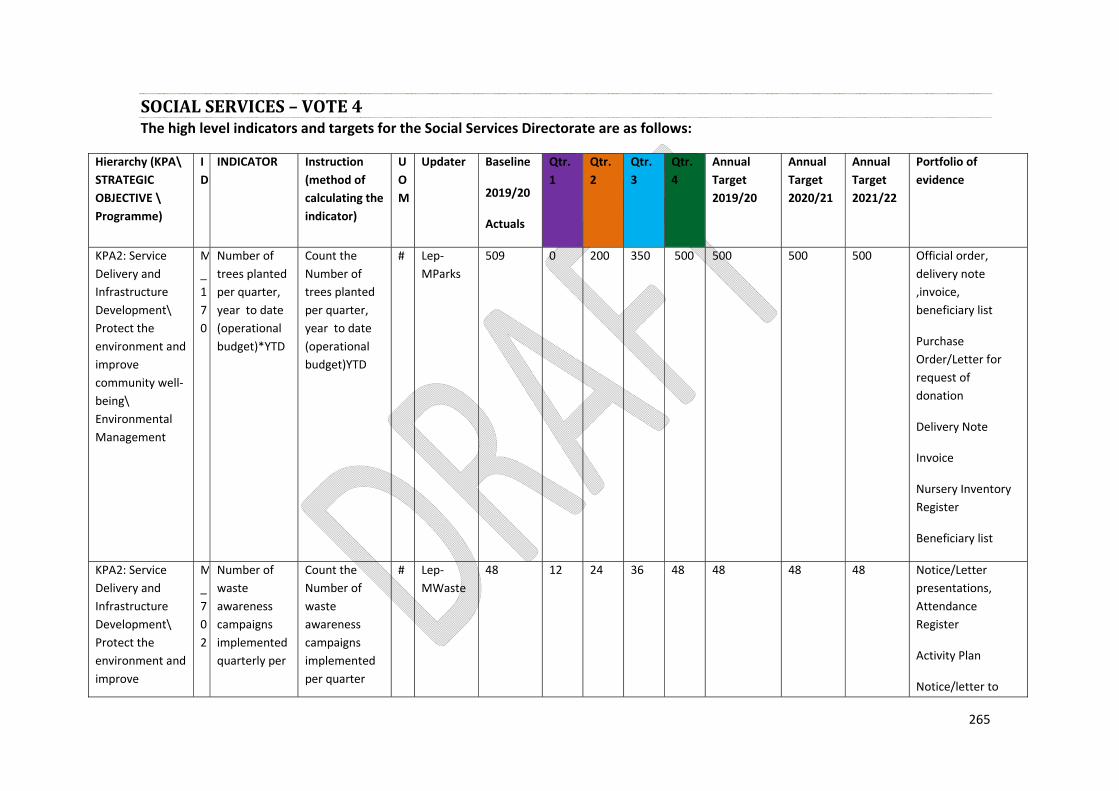
265
SOCIALSERVICES–VOTE4The high level indicators and targets for the Social Services Directorate are as follows:
Hierarchy (KPA\STRATEGIC OBJECTIVE \ Programme)
ID
INDICATOR Instruction (method of calculating the indicator)
UOM
Updater Baseline
2019/20
Actuals
Qtr. 1
Qtr. 2
Qtr. 3
Qtr. 4
Annual Target 2019/20
Annual Target 2020/21
Annual Target 2021/22
Portfolio of evidence
KPA2: Service Delivery and Infrastructure Development\ Protect the environment and improve community well‐being\ Environmental Management
M_170
Number of trees planted per quarter, year to date (operational budget)*YTD
Count the Number of trees planted per quarter, year to date (operational budget)YTD
# Lep‐MParks
509 0 200 350 500 500 500 500 Official order, delivery note ,invoice, beneficiary list
Purchase Order/Letter for request of donation
Delivery Note
Invoice
Nursery Inventory Register
Beneficiary list
KPA2: Service Delivery and Infrastructure Development\ Protect the environment and improve
M_702
Number of waste awareness campaigns implemented quarterly per
Count the Number of waste awareness campaigns implemented per quarter
# Lep‐MWaste
48 12 24 36 48 48 48 48 Notice/Letter presentations, Attendance Register
Activity Plan
Notice/letter to
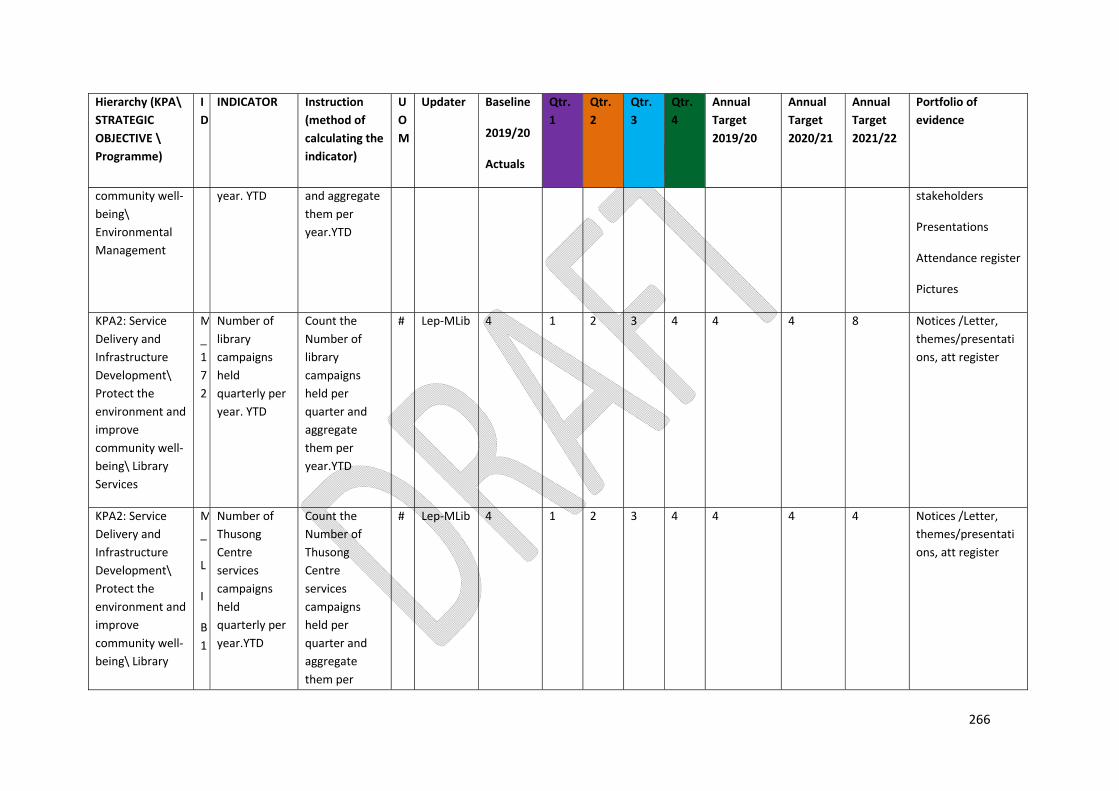
266
Hierarchy (KPA\STRATEGIC OBJECTIVE \ Programme)
ID
INDICATOR Instruction (method of calculating the indicator)
UOM
Updater Baseline
2019/20
Actuals
Qtr. 1
Qtr. 2
Qtr. 3
Qtr. 4
Annual Target 2019/20
Annual Target 2020/21
Annual Target 2021/22
Portfolio of evidence
community well‐being\ Environmental Management
year. YTD and aggregate them per year.YTD
stakeholders
Presentations
Attendance register
Pictures
KPA2: Service Delivery and Infrastructure Development\ Protect the environment and improve community well‐being\ Library Services
M_172
Number of library campaigns held quarterly per year. YTD
Count the Number of library campaigns held per quarter and aggregate them per year.YTD
# Lep‐MLib 4 1 2 3 4 4 4 8 Notices /Letter, themes/presentations, att register
KPA2: Service Delivery and Infrastructure Development\ Protect the environment and improve community well‐being\ Library
M_
L
I
B1
Number of Thusong Centre services campaigns held quarterly per year.YTD
Count the Number of Thusong Centre services campaigns held per quarter and aggregate them per
# Lep‐MLib 4 1 2 3 4 4 4 4 Notices /Letter, themes/presentations, att register
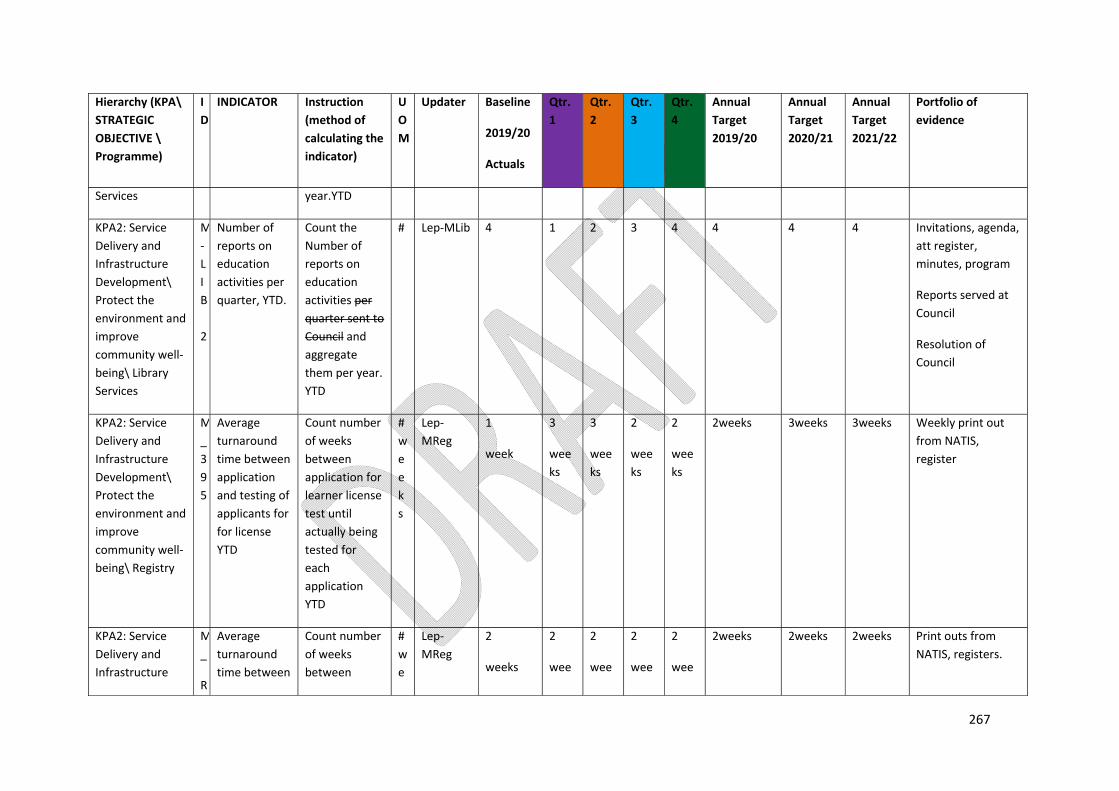
267
Hierarchy (KPA\STRATEGIC OBJECTIVE \ Programme)
ID
INDICATOR Instruction (method of calculating the indicator)
UOM
Updater Baseline
2019/20
Actuals
Qtr. 1
Qtr. 2
Qtr. 3
Qtr. 4
Annual Target 2019/20
Annual Target 2020/21
Annual Target 2021/22
Portfolio of evidence
Services year.YTD
KPA2: Service Delivery and Infrastructure Development\ Protect the environment and improve community well‐being\ Library Services
M‐LIB 2
Number of reports on education activities per quarter, YTD.
Count the Number of reports on education activities per quarter sent to Council and aggregate them per year. YTD
# Lep‐MLib 4 1 2 3 4 4 4 4 Invitations, agenda, att register, minutes, program
Reports served at Council
Resolution of Council
KPA2: Service Delivery and Infrastructure Development\ Protect the environment and improve community well‐being\ Registry
M_395
Average turnaround time between application and testing of applicants for for license YTD
Count number of weeks between application for learner license test until actually being tested for each application YTD
# weeks
Lep‐MReg
1
week
3
weeks
3
weeks
2
weeks
2
weeks
2weeks 3weeks 3weeks Weekly print out from NATIS, register
KPA2: Service Delivery and Infrastructure
M_
R
Average turnaround time between
Count number of weeks between
# we
Lep‐MReg
2
weeks
2
wee
2
wee
2
wee
2
wee
2weeks 2weeks 2weeks Print outs from NATIS, registers.

268
Hierarchy (KPA\STRATEGIC OBJECTIVE \ Programme)
ID
INDICATOR Instruction (method of calculating the indicator)
UOM
Updater Baseline
2019/20
Actuals
Qtr. 1
Qtr. 2
Qtr. 3
Qtr. 4
Annual Target 2019/20
Annual Target 2020/21
Annual Target 2021/22
Portfolio of evidence
Development\Protect the environment and improve community well‐being\ Registry
G 1
application for driver’s license YTD
application for driver’s license test until actually being tested for each application YTD
eks
ks ks ks ks
KPA2: Service Delivery and Infrastructure Development\ Protect the environment and improve community well‐being\ Registry
M_
RG2
Number of stakeholders engagement meetings on public transport activities YTD.
Count the Number of stakeholders engagement meetings on public transport activities per quarter and aggregate them per year
# Lep‐MReg
4 1 2 3 4 4 4 4 Invitations, agenda, att register, minutes, year program , stakeholder data base

269
Hierarchy (KPA\STRATEGIC OBJECTIVE \ Programme)
ID
INDICATOR Instruction (method of calculating the indicator)
UOM
Updater Baseline
2019/20
Actuals
Qtr. 1
Qtr. 2
Qtr. 3
Qtr. 4
Annual Target 2019/20
Annual Target 2020/21
Annual Target 2021/22
Portfolio of evidence
KPA2: Service Delivery and Infrastructure Development\ Protect the environment and improve community well‐being\ Road Safety / Law Enforcement
M_703
Number of speed checks held YTD
Count the Number of speed checks held per Quarter and aggregate them per year. YTD
# Lep‐MTraf
112 36 72
98 134 134 134 134 Speed checks register
Activity Plan/Schedule
Speed checks register
Register/list of Fines/tickets issued
KPA2: Service Delivery and Infrastructure Development\ Protect the environment and improve community well‐being\ Road Safety / Law Enforcement
M_704
Number of joint law enforcement operations with other law enforcement agencies undertaken held YTD.
Count the Number of joint law enforcement operations with other law enforcement agencies undertaken held per Quarter and aggregate them per year.YTD
# Lep‐MTraf
4 1 2 3 4 4 4 4 Invitations, stop& check register, attendance register

270
Hierarchy (KPA\STRATEGIC OBJECTIVE \ Programme)
ID
INDICATOR Instruction (method of calculating the indicator)
UOM
Updater Baseline
2019/20
Actuals
Qtr. 1
Qtr. 2
Qtr. 3
Qtr. 4
Annual Target 2019/20
Annual Target 2020/21
Annual Target 2021/22
Portfolio of evidence
KPA2: Service Delivery and Infrastructure Development\ Protect the environment and improve community well‐being\ Waste Management
M_250
Number of urban household provided with weekly refuse removal, YTD
Count the Number of urban household provided with weekly refuse removal YTD
# Lep‐MWaste
8800 8800 8800 8231
8231 8231 8231 9100 Billing list
KPA2: Service Delivery and Infrastructure Development\ Protect the environment and improve community well‐being\ Waste Management
M_402
Percentage households with access to basic level of solid waste removal, YTD
Count Number of households with access to basic level (weekly kerbside collection) of solid waste removal against Number of household in the municipal area as % YTD
% Lep‐MWaste
55% 55% 55% 55% 55% 55% 65% 100% Calculation sheet, list of urban, rural HH and Informal settlements.
KPA2: Service Delivery and
M_
Number of rural villages
Count the Number of
# Lep‐ 13 13 13 17 17 17 17 20 Log sheets, list of

271
Hierarchy (KPA\STRATEGIC OBJECTIVE \ Programme)
ID
INDICATOR Instruction (method of calculating the indicator)
UOM
Updater Baseline
2019/20
Actuals
Qtr. 1
Qtr. 2
Qtr. 3
Qtr. 4
Annual Target 2019/20
Annual Target 2020/21
Annual Target 2021/22
Portfolio of evidence
Infrastructure Development\ Protect the environment and improve community well‐being\ Waste Management
708
with access to weekly refuse removal services through roll‐on, roll‐off system
rural villages provided with weekly refuse removal services through roll‐on, roll‐off system and community contractors
MWaste villages
Weekly Activity Plan
List of Villages
Bin Numbers
Coordinates
List of Households/Beneficiaries
Log sheets
The indicators and targets (whether on the high SDBIP or the Lower SDBIP level) related to the focus areas in the Directorate have been developed in order to ensure the implementation of the above‐mentioned strategies.

272
INFRASTRUCTURE SERVICES – VOTE 5
The high level indicators and targets for the Infrastructure Directorate are as follows:
Hierarchy (KPA\ STRATEGIC OBJECTIVE \ Programme)
ID
INDICATOR Instruction (method of calculating the indicator)
UOM
Updater Baseline
2017/18
Actuals
Qtr. 1
Qtr. 2
Qtr. 3
Qtr. 4
Annual Target 2019/20
Annual Target 2020/21
Annual Target 2021/22
Portfolio of evidence
KPA2: Service Delivery and Infrastructure Development\ Provide quality and well maintained infrastructural services in all municipal areas\ Electrical Network (Electricity – Maintenance and Upgrading)
M_340
Percentage of Electrical losses YTD*
The following formula should be used to compute benchmark Electrical Losses = KWH billed/KWH purchased from Eskom x100 YTD
% Lep‐MElec
8,65% 12% 12% 10% 10% 10% 8% 5% Electrical loss report
Loss report should indicate all factors that are a contribution to the loss

273
Hierarchy (KPA\ STRATEGIC OBJECTIVE \ Programme)
ID
INDICATOR Instruction (method of calculating the indicator)
UOM
Updater Baseline
2017/18
Actuals
Qtr. 1
Qtr. 2
Qtr. 3
Qtr. 4
Annual Target 2019/20
Annual Target 2020/21
Annual Target 2021/22
Portfolio of evidence
KPA2: Service Delivery and Infrastructure Development\ Provide quality and well maintained infrastructural services in all municipal areas\ Electrical Network (New Infrastructure)
M_401
A
Percentage households with access to basic level of electricity connected by Eskom*YTD
Number of households with access to basic level of electricity against Number of household serviced by Eskom in the municipal area as %YTD
% Lep‐MElec
0% 56% 56% 56% 57% 57% 57% 58% List of serviced households
List and summary of calculation for the reported percentage
KPA2: Service Delivery and Infrastructure Development\ Provide quality and well maintained infrastructural services in all municipal areas\ Electrical
M_401
B
Percentage households with access to basic level of electricity connected by Municipality *( Urban
Number of households with access to basic level of electricity against Number of household serviced by the Municipality in the municipal area as % YTD
% Lep‐MElec
0% 17% 17% 17% 17% 17% 17.5% 17.5% List of serviced households
List and summary of calculation for the reported percentage

274
Hierarchy (KPA\ STRATEGIC OBJECTIVE \ Programme)
ID
INDICATOR Instruction (method of calculating the indicator)
UOM
Updater Baseline
2017/18
Actuals
Qtr. 1
Qtr. 2
Qtr. 3
Qtr. 4
Annual Target 2019/20
Annual Target 2020/21
Annual Target 2021/22
Portfolio of evidence
Network (New Infrastructure)
households) YTD
KPA2: Service Delivery and Infrastructure Development\ Provide quality and well maintained infrastructural services in all municipal areas\ Free Basic Services
M_753
Percentage households without access to basic level of Electricity YTD*( Backlog)
Number of household without access to basic level of Electricity in the municipal area against Number of household serviced by the Municipality in the municipal area YTD
% Lep‐MElec
0% 26.5%
26% 26% 25% 25% 24% 23% List of households not serviced
KPA2: Service Delivery and Infrastructure Development\ Provide quality and well
M_757
Number of infrastructure master plans reviewed
Count the Number of infrastructure master plans reviewed YTD

275
Hierarchy (KPA\ STRATEGIC OBJECTIVE \ Programme)
ID
INDICATOR Instruction (method of calculating the indicator)
UOM
Updater Baseline
2017/18
Actuals
Qtr. 1
Qtr. 2
Qtr. 3
Qtr. 4
Annual Target 2019/20
Annual Target 2020/21
Annual Target 2021/22
Portfolio of evidence
maintained infrastructural services in all municipal areas\ Infrastructure Planning
YTD
# Lep‐PMU/
EMIS
0 N/A N/A N/A 1
N/A
Completion Deferred to next financial year
N/A 1 1 Approved Integrated Infrastructure Master Plan
KPA2: Service Delivery and Infrastructure Development\ Provide quality and well maintained infrastructural services in all municipal areas\ Roads and Storm water –
M_218
Number of villages in which access roads are bladed YTD*
Count the Number of villages in which access roads bladed during period of review YTD
# Lep‐MPW
39 7 14 29 39 39 39 39 1,Grader Log sheet
Road;

276
Hierarchy (KPA\ STRATEGIC OBJECTIVE \ Programme)
ID
INDICATOR Instruction (method of calculating the indicator)
UOM
Updater Baseline
2017/18
Actuals
Qtr. 1
Qtr. 2
Qtr. 3
Qtr. 4
Annual Target 2019/20
Annual Target 2020/21
Annual Target 2021/22
Portfolio of evidence
Maintenance and Upgrading
KPA2: Service Delivery and Infrastructure Development\ Provide quality and well maintained infrastructural services in all municipal areas\ Roads and Storm water – Maintenance and Upgrading
M_74
Total length of kilometers upgraded from gravel road to surfaced road YTD*
Measure the Length of kilometers of gravel roads upgraded to Surfaced road YTD
#km
Lep‐MPW
7km N/A N/A N/A 3 km
3km
3.0km 4.0km Progress Minutes
Approved Budget
Spec report
SLA
Progress reports & Minutes Completion Certificate upon completion of the Road
KPA2: Service Delivery and Infrastructure Development\ Provide quality and well maintained
NM001
Total Percentage of maintenance budget spent on infrastructu
Divide the amount of money spent on maintenance by the total allocated
% Lep‐MPW
0% 15% 45% 70% 90% 90% 90% 100% Expenditure report
Maintenance Plan
Logbook/regi

277
Hierarchy (KPA\ STRATEGIC OBJECTIVE \ Programme)
ID
INDICATOR Instruction (method of calculating the indicator)
UOM
Updater Baseline
2017/18
Actuals
Qtr. 1
Qtr. 2
Qtr. 3
Qtr. 4
Annual Target 2019/20
Annual Target 2020/21
Annual Target 2021/22
Portfolio of evidence
infrastructural services in all municipal areas\ Roads and Storm water – Maintenance and Upgrading
re maintenance by Public works unit YTD*
maintenance budget YTD
ster recording maintained activities
Expenditure Report
KPA2: Service Delivery and Infrastructure Development\ Provide quality and well maintained infrastructural services in all municipal areas\ Sanitation ‐ New Infrastructure
M_400
Percentage households with access to basic level of sanitation YTD*
Count Number of household with access to basic level of sanitation (VIP and waterborne sewerage connections in working condition) against Number of household in the municipal area as Percentage
% Lep‐MSanit
49.25% 50% 50% 55% 55% 55% 60% 80% List of serviced households
Calculation Summary of the percentage
KPA2: Service Delivery and Infrastructure
M_7
Number of Green drop assessment
Count the Number of Green drop
# Lep‐MSanit
1 N/A N/A N/A 1 1 1 1 Sewerage analysis

278
Hierarchy (KPA\ STRATEGIC OBJECTIVE \ Programme)
ID
INDICATOR Instruction (method of calculating the indicator)
UOM
Updater Baseline
2017/18
Actuals
Qtr. 1
Qtr. 2
Qtr. 3
Qtr. 4
Annual Target 2019/20
Annual Target 2020/21
Annual Target 2021/22
Portfolio of evidence
Development\Provide quality and well maintained infrastructural services in all municipal areas\ Waste Water Quality (Green Drop)
58
report submitted conducted by DWS for green drop risk rating YTD
assessment report submitted conducted by DWS for green drop risk rating YTD
report
KPA2: Service Delivery and Infrastructure Development\ Provide quality and well maintained infrastructural services in all municipal areas\ Sanitation \ Free Basic Services
M_752
Percentage households without access to basic level of Sanitation YTD*( Backlog)
Count Number of household without access to basic level of Sanitation in the municipal area against number of household serviced by the Municipality in the municipal area as % YTD(backlog)
% Lep‐MSanit
0% 50% 50% 45% 45% 45% 55% 35% List of households not serviced
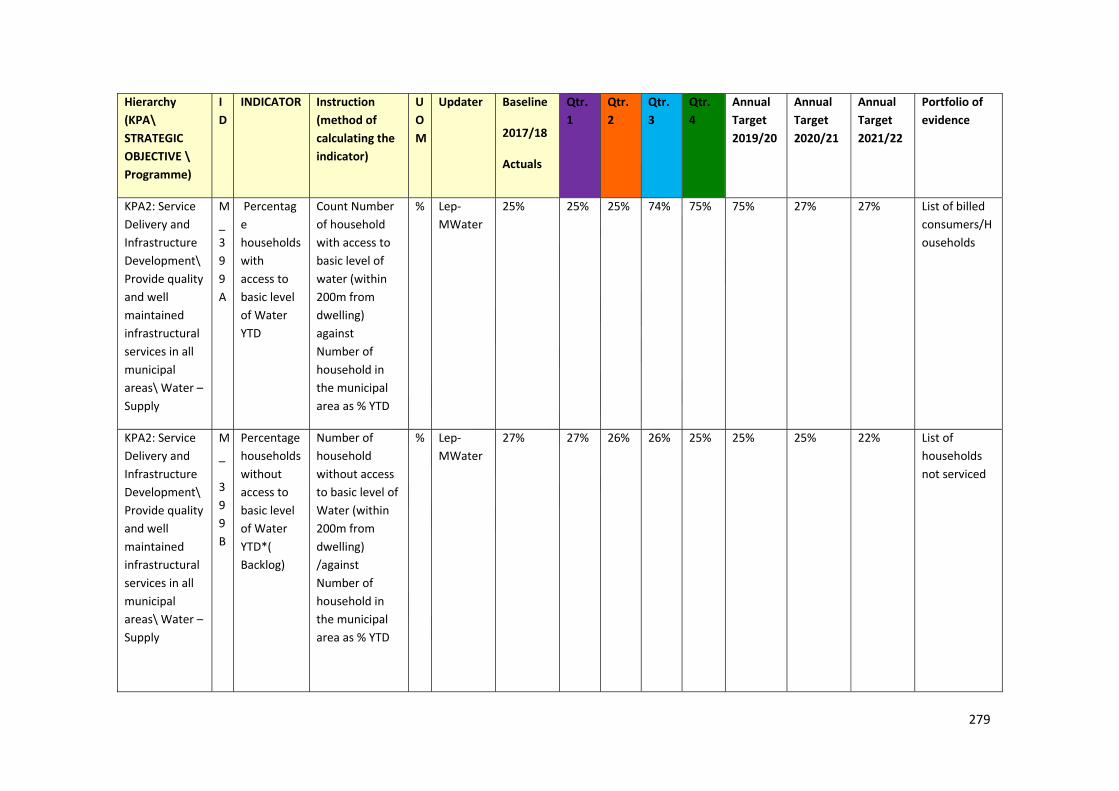
279
Hierarchy (KPA\ STRATEGIC OBJECTIVE \ Programme)
ID
INDICATOR Instruction (method of calculating the indicator)
UOM
Updater Baseline
2017/18
Actuals
Qtr. 1
Qtr. 2
Qtr. 3
Qtr. 4
Annual Target 2019/20
Annual Target 2020/21
Annual Target 2021/22
Portfolio of evidence
KPA2: Service Delivery and Infrastructure Development\ Provide quality and well maintained infrastructural services in all municipal areas\ Water – Supply
M_399A
Percentage households with access to basic level of Water YTD
Count Number of household with access to basic level of water (within 200m from dwelling) against Number of household in the municipal area as % YTD
% Lep‐MWater
25% 25% 25% 74% 75% 75% 27% 27% List of billed consumers/Households
KPA2: Service Delivery and Infrastructure Development\ Provide quality and well maintained infrastructural services in all municipal areas\ Water – Supply
M_
399B
Percentage households without access to basic level of Water YTD*( Backlog)
Number of household without access to basic level of Water (within 200m from dwelling) /against Number of household in the municipal area as % YTD
% Lep‐MWater
27% 27% 26% 26% 25% 25% 25% 22% List of households not serviced
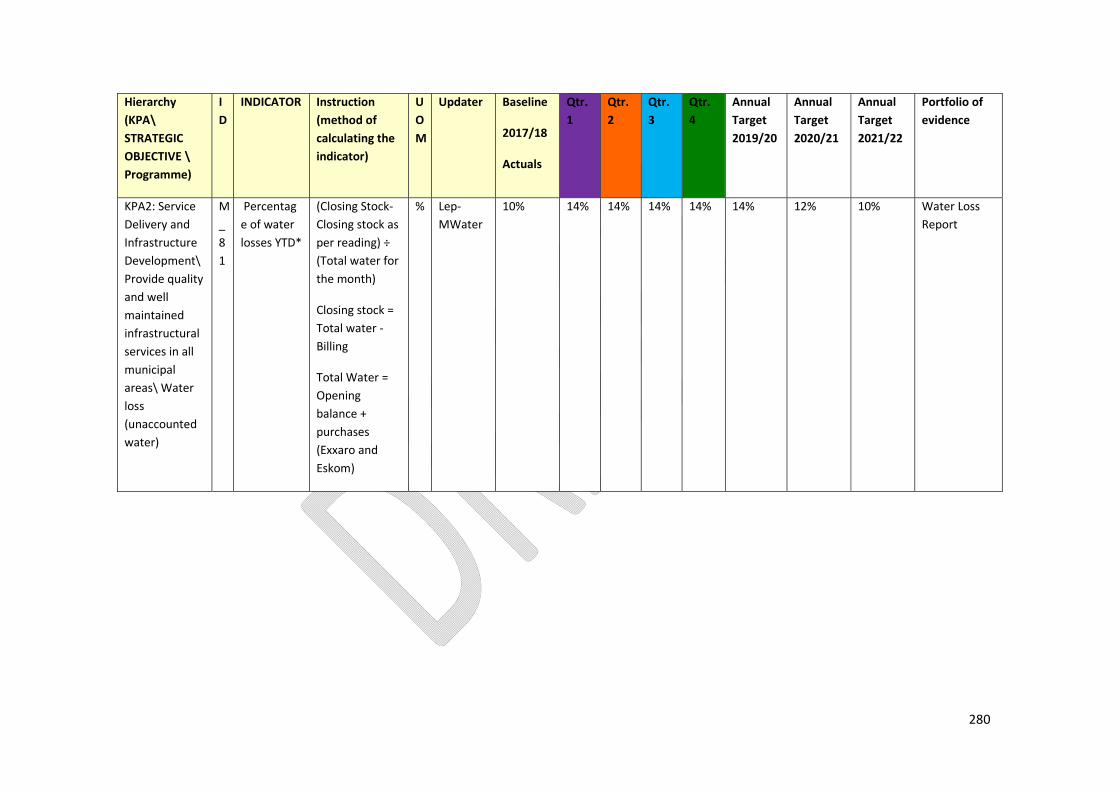
280
Hierarchy (KPA\ STRATEGIC OBJECTIVE \ Programme)
ID
INDICATOR Instruction (method of calculating the indicator)
UOM
Updater Baseline
2017/18
Actuals
Qtr. 1
Qtr. 2
Qtr. 3
Qtr. 4
Annual Target 2019/20
Annual Target 2020/21
Annual Target 2021/22
Portfolio of evidence
KPA2: Service Delivery and Infrastructure Development\ Provide quality and well maintained infrastructural services in all municipal areas\ Water loss (unaccounted water)
M_81
Percentage of water losses YTD*
(Closing Stock‐Closing stock as per reading) ÷ (Total water for the month)
Closing stock = Total water ‐ Billing
Total Water = Opening balance + purchases (Exxaro and Eskom)
% Lep‐MWater
10% 14% 14% 14% 14% 14% 12% 10% Water Loss Report
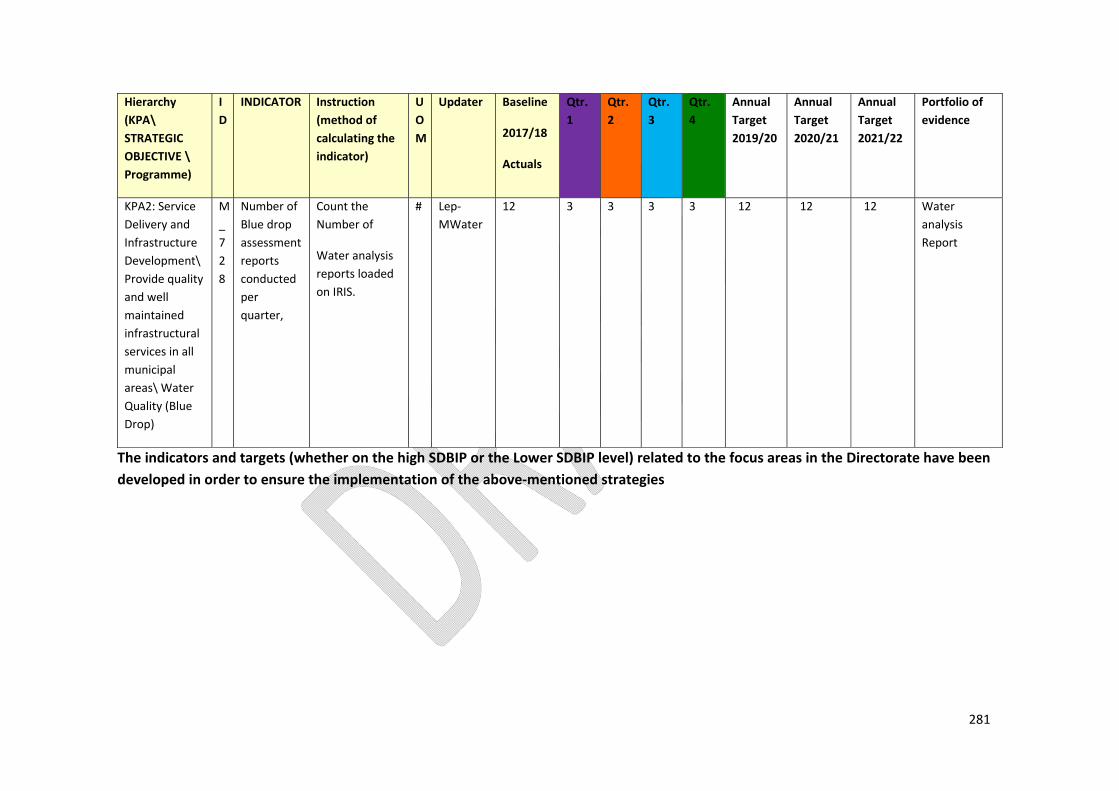
281
Hierarchy (KPA\ STRATEGIC OBJECTIVE \ Programme)
ID
INDICATOR Instruction (method of calculating the indicator)
UOM
Updater Baseline
2017/18
Actuals
Qtr. 1
Qtr. 2
Qtr. 3
Qtr. 4
Annual Target 2019/20
Annual Target 2020/21
Annual Target 2021/22
Portfolio of evidence
KPA2: Service Delivery and Infrastructure Development\ Provide quality and well maintained infrastructural services in all municipal areas\ Water Quality (Blue Drop)
M_728
Number of Blue drop assessment reports conducted per quarter,
Count the Number of
Water analysis reports loaded on IRIS.
# Lep‐MWater
12 3 3 3 3 12 12 12 Water analysis Report
The indicators and targets (whether on the high SDBIP or the Lower SDBIP level) related to the focus areas in the Directorate have been developed in order to ensure the implementation of the above‐mentioned strategies