(draft) ieee 802 nendica report: intelligent lossless data
TRANSCRIPT
Copyright © 2021 IEEE. All rights reserved.
Draft Nendica Report 1-21-0004-01-ICne-draft-dcn-report
1 IEEE SA Industry connections
(Draft) IEEE 802 Nendica Report: Intelligent Lossless Data Center Networks
Editor 1
Name Affiliation
Guo, Liang CAICT/ODCC
Congdon, Paul Huawei
Nendica Chair 2
Name Affiliation
Marks, Roger Huawei
Contributors/Supporters 3
Name Affiliation
Li, Jie CAICT/ODCC
Gao, Feng Baidu
Gu, Rong China Mobile
Zhao, Jizhuang China Telecom
Chen, Chuansheng Tencent
Yin, Yue Huawei
Song, Qingchun Nvidia
Liu, Jun Cisco
He, Zongying Broadcom
Sun, Liyang Huawei
Tang, Guangming Meituan
Quan, Hao Meituan
Tao, Chunlei JD
Wang, Shaopeng CAICT/ODCC
4
5

Copyright © 2021 IEEE. All rights reserved.
Draft Nendica Report 1-21-0004-01-ICne-draft-dcn-report
2 IEEE SA Industry connections
Trademarks and Disclaimers 1
IEEE believes the information in this publication is accurate as of its publication date; such 2 information is subject to change without notice. IEEE is not responsible for any inadvertent errors. 3 4 Copyright © 2021 IEEE. All rights reserved. 5 6 IEEE owns the copyright to this Work in all forms of media. Copyright in the content retrieved, displayed or output 7 from this Work is owned by IEEE and is protected by the copyright laws of the United States and by international 8 treaties. IEEE reserves all rights not expressly granted. 9 10 IEEE is providing the Work to you at no charge. However, the Work is not to be considered within the “Public 11 Domain,” as IEEE is, and at all times shall remain the sole copyright holder in the Work. 12 13 Except as allowed by the copyright laws of the United States of America or applicable international treaties, you 14 may not further copy, prepare, and/or distribute copies of the Work, nor significant portions of the Work, in any 15 form, without prior written permission from IEEE. 16 17 Requests for permission to reprint the Work, in whole or in part, or requests for a license to reproduce and/or 18 distribute the Work, in any form, must be submitted via email to [email protected], or in writing to: 19 20
IEEE SA Licensing and Contracts 21 445 Hoes Lane 22
Piscataway, NJ 08854 23
24 25 26 The Institute of Electrical and Electronics Engineers, Inc. 27 3 Park Avenue, New York, NY 10016-5997, USA 28 29 Copyright © 2021 by The Institute of Electrical and Electronics Engineers, Inc. 30 All rights reserved. Published April 2021. Printed in the United States of America. 31 32 IEEE and 802 are registered trademarks in the U.S. Patent & Trademark Office, owned by The Institute of Electrical and 33 Electronics Engineers, Incorporated. 34 35 PDF: ISBN xxx-x-xxxx-xxxx-x XXXXXXXXXX 36 37 IEEE prohibits discrimination, harassment, and bullying. For more information, visit 38 http://www.ieee.org/web/aboutus/whatis/policies/p9-26.html. 39 40 No part of this publication may be reproduced in any form, in an electronic retrieval system, or otherwise, without the prior 41 written permission of the publisher. 42 43 To order IEEE Press Publications, call 1-800-678-IEEE. 44 Find IEEE standards and standards-related product listings at: http://standards.ieee.org 45
Comments on this report are welcomed by Nendica: the IEEE 802 “Network Enhancements for the Next Decade” Industry Connections Activity: <https://1.ieee802.org/802-nendica>
Comment submission instructions are available at: <https://1.ieee802.org/802-nendica/nendica-dcn>
Comments will be considered for a future revision of this document and may stimulate the development of a new revision.
Copyright © 2021 IEEE. All rights reserved.
1-21-0004-01-ICne-draft-dcn-report
3
NOTICE AND DISCLAIMER OF LIABILITY CONCERNING THE USE OF IEEE SA 1
INDUSTRY CONNECTIONS DOCUMENTS 2
3 This IEEE Standards Association (“IEEE SA”) Industry Connections publication (“Work”) is not a consensus 4 standard document. Specifically, this document is NOT AN IEEE STANDARD. Information contained in this 5 Work has been created by, or obtained from, sources believed to be reliable, and reviewed by members 6 of the IEEE SA Industry Connections activity that produced this Work. IEEE and the IEEE SA Industry 7 Connections activity members expressly disclaim all warranties (express, implied, and statutory) related 8 to this Work, including, but not limited to, the warranties of: merchantability; fitness for a particular 9 purpose; non-infringement; quality, accuracy, effectiveness, currency, or completeness of the Work or 10 content within the Work. In addition, IEEE and the IEEE SA Industry Connections activity members disclaim 11 any and all conditions relating to: results; and workmanlike effort. This IEEE SA Industry Connections 12 document is supplied “AS IS” and “WITH ALL FAULTS.” 13
Although the IEEE SA Industry Connections activity members who have created this Work believe that the 14 information and guidance given in this Work serve as an enhancement to users, all persons must rely upon 15 their own skill and judgment when making use of it. IN NO EVENT SHALL IEEE OR IEEE SA INDUSTRY 16 CONNECTIONS ACTIVITY MEMBERS BE LIABLE FOR ANY ERRORS OR OMISSIONS OR DIRECT, INDIRECT, 17 INCIDENTAL, SPECIAL, EXEMPLARY, OR CONSEQUENTIAL DAMAGES (INCLUDING, BUT NOT LIMITED TO: 18 PROCUREMENT OF SUBSTITUTE GOODS OR SERVICES; LOSS OF USE, DATA, OR PROFITS; OR BUSINESS 19 INTERRUPTION) HOWEVER CAUSED AND ON ANY THEORY OF LIABILITY, WHETHER IN CONTRACT, STRICT 20 LIABILITY, OR TORT (INCLUDING NEGLIGENCE OR OTHERWISE) ARISING IN ANY WAY OUT OF THE USE OF 21 THIS WORK, EVEN IF ADVISED OF THE POSSIBILITY OF SUCH DAMAGE AND REGARDLESS OF WHETHER SUCH 22 DAMAGE WAS FORESEEABLE. 23
Further, information contained in this Work may be protected by intellectual property rights held by third 24 parties or organizations, and the use of this information may require the user to negotiate with any such 25 rights holders in order to legally acquire the rights to do so, and such rights holders may refuse to grant 26 such rights. Attention is also called to the possibility that implementation of any or all of this Work may 27 require use of subject matter covered by patent rights. By publication of this Work, no position is taken 28 by the IEEE with respect to the existence or validity of any patent rights in connection therewith. The IEEE 29 is not responsible for identifying patent rights for which a license may be required, or for conducting 30 inquiries into the legal validity or scope of patents claims. Users are expressly advised that determination 31 of the validity of any patent rights, and the risk of infringement of such rights, is entirely their own 32 responsibility. No commitment to grant licenses under patent rights on a reasonable or non-33 discriminatory basis has been sought or received from any rights holder. The policies and procedures 34 under which this document was created can be viewed at http://standards.ieee.org/about/sasb/iccom/. 35
This Work is published with the understanding that IEEE and the IEEE SA Industry Connections activity 36 members are supplying information through this Work, not attempting to render engineering or other 37 professional services. If such services are required, the assistance of an appropriate professional should 38 be sought. IEEE is not responsible for the statements and opinions advanced in this Work. 39

Copyright © 2021 IEEE. All rights reserved.
1-21-0004-01-ICne-draft-dcn-report
4
1
TAB
LE O
F
CO
NTE
NTS
Editor ..........................................................................................................1
Nendica Chair .............................................................................................1
Contributors/Supporters ............................................................................1
INTRODUCTION .............................................................................................5
Scope ..........................................................................................................5
Purpose .......................................................................................................5
BRINGING THE DATA CENTER TO LIFE ...........................................................5
A new world with data everywhere ...........................................................5
EVOLVING DATA CENTER REQUIREMENTS AND TECHNOLOGY ....................7
Previous Data Center Bridging Standards ..................................................7
Requirements evolution .............................................................................8
Characteristics of AI computing .................................................................9
Evolving technologies .............................................................................. 11
CHALLENGES WITH TODAY’S DATA CENTER NETWORK ............................ 20
High throughput and low latency tradeoff ............................................. 20
Deadlock free lossless network ............................................................... 21
Congestion control issues in large-scale data center networks .............. 23
Configuration complexity of congestion control algorithms .................. 25
NEW TECHNOLOGIES TO ADDRESS NEW DATA CENTER PROBLEMS ......... 27
Hybrid transports for low latency and high throughput ......................... 27
PFC deadlock prevention using topology recognition ............................ 28
Improving Congestion Notification ......................................................... 30
Addressing configuration complexity ...................................................... 32
STANDARDIZATION CONSIDERATIONS ...................................................... 34
CONCLUSION .............................................................................................. 36
CITATIONS ................................................................................................... 37

Copyright © 2021 IEEE. All rights reserved.
Draft Nendica Report 1-21-0004-01-ICne-draft-dcn-report
5 IEEE SA Industry connections
1
Introduction 2
3
This paper is the result of a work item [1] within the IEEE 802 “Network Enhancements for the Next 4 Decade” Industry Connections Activity known as Nendica. The paper extends a previous report, 5 “IEEE 802 Nendica Report: The Lossless Network for Data Centers” published on August 17, 2018 6 [2]. This update provides additional background on evolving use cases in modern data centers and 7 proposes solutions to additional problems identified by this paper. 8
Scope 9
The scope of this report is the exploration of networking technologies to support the requirements 10 of modern data center networks that include support for high performance computing and artificial 11 intelligence applications. Solutions to address challenges created by evolving requirements and new 12 age technologies are proposed. Standardization considerations are identified. 13
Purpose 14
The purpose of this report is to frame high-level solutions to issues and challenges with modern 15 data center Networks. The report includes background and technical analyses of current data 16 center environments as they are applied to the evolving needs of target applications. The report 17 highlights new technologies that are changing the dynamics and operation of the data center 18 Network. The results of the analysis lead to identification and recommendation of future 19 standardization activities. 20
Bringing the data center to life 21
A new world with data everywhere 22
Digital transformation is driving change in both our personal and professional lives. Workflows and 23 personal interactions are turning to digital processes and automated tools that are enabled by the 24 Cloud, Mobility, and the Internet of Things. The intelligence behind the digital transformation is 25 Artificial Intelligence (AI). Data centers running AI applications with massive amounts of data are 26 recasting that data into pertinent information, automated human interactions, and refined decision 27 making. The need to interact with the data center in real-time is more important than ever in 28 today’s world where augmented reality, voice recognition, and contextual searching demand 29 immediate results. Data center networks must deliver unprecedented levels of performance, scale, 30 and reliability to meet these real-time demands. 31
Data centers in the cloud era focused on application transformation and the rapid deployment of 32 services. During the AI era, data centers are the source of information and algorithms for the real-33
2
1

Copyright © 2021 IEEE. All rights reserved.
Draft Nendica Report 1-21-0004-01-ICne-draft-dcn-report
6 IEEE SA Industry connections
time digital transformation of our digital lives. The combination of high-speed storage and AI 1 distributed computing render big data into fast data, access by humans, machines, and things. A 2 high-performance, large scale data center network without packet loss is critical to the smooth 3 operation of digital transformation. 4
For high-performance applications, such as AI, key measures of network performance include 5 throughput, latency, and congestion. Throughput is dependent on the total capacity of the network 6 to quickly transmit a large amount of data. Latency refers to the total delay for a transaction across 7 the data center network. When the traffic load exceeds network capacity, congestion occurs. Packet 8 loss is a factor that seriously affects both throughput and latency. 9
Currently, digital transformation of various industries is accelerating. It is estimated that 64% of 10 enterprises have become the explorers and practitioners of digital transformation [3]. Among 2000 11 multinational companies, 67% of CEOs have made digitalization the core of their corporate 12 strategies [4]. The drive towards digital transformation in the real-time world is leading the data 13 center network to support a ‘Data-Centric’ model of computing. 14
A large amount of data will be generated during the digitalization process, becoming a core asset, 15 and enabling the emergence of artificial intelligence applications. The Huawei Global Industry 16 Vision predicts that data volume will reach 180 ZB in 2025 [5]. However, data is not the “end-in-17 itself”. Knowledge and wisdom extracted from data are eternal values. The proportion of 18 unstructured data (such as raw voice, video, and image data) increases continuously, and will 19
Figure 1 – Digital Transformation in the Era of AI
AICloud
Figure 2 – Emerging Artificial Intelligence Applications
Audio/VideoPercentage of unstructured data
Unstructured Data
180 ZB
Massive Data
Data generated annually:8.6 ZB (2015) → 180 ZB (2025)
95%
Network
HDD → SSD → SCM
ComputingCPU → GPU → AI chip
AI
Storage
Performance Innovations
40 → 100→ 400 GbE
Copyright © 2021 IEEE. All rights reserved.
Draft Nendica Report 1-21-0004-01-ICne-draft-dcn-report
7 IEEE SA Industry connections
account for 95% of all data in the future. Current big data analytic methods are unable to keep pace 1 with the growth of data and performance innovations are needed to extract the value from the raw 2 data. An AI approach based on deep learning can filter out massive amounts of invalid data and 3 automatically extract useful information, providing more efficient decision-making and behavior 4 guidance. 5
The cloud data center architecture improved the performance and scale of applications in general. 6 The cloud platform allows rapid distribution of IT resources to create an application-centric service 7 model. In the AI era, the applications are consuming unprecedented amounts of data and the cloud 8 data center architecture is augmented with necessary performance innovations to handle the load. 9 Seamlessly introducing these innovations along with new AI applications can be tricky in an existing 10 cloud data center. Understanding how to efficiently process data based on the needs of AI 11 applications is a key focus area. Orchestrating the flow of data between the storage and computing 12 resources of the applications is a critical success factor. 13
Evolving data center requirements and 14
technology 15
Previous Data Center Bridging Standards 16
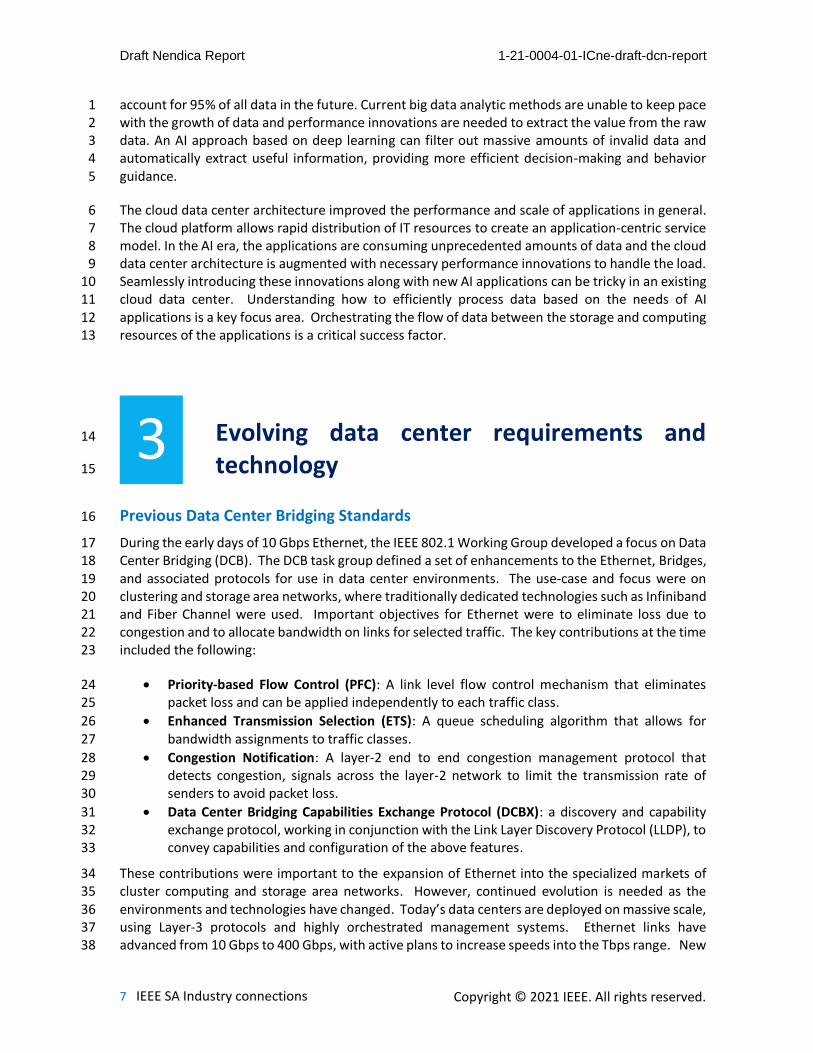
During the early days of 10 Gbps Ethernet, the IEEE 802.1 Working Group developed a focus on Data 17 Center Bridging (DCB). The DCB task group defined a set of enhancements to the Ethernet, Bridges, 18 and associated protocols for use in data center environments. The use-case and focus were on 19 clustering and storage area networks, where traditionally dedicated technologies such as Infiniband 20 and Fiber Channel were used. Important objectives for Ethernet were to eliminate loss due to 21 congestion and to allocate bandwidth on links for selected traffic. The key contributions at the time 22 included the following: 23
• Priority-based Flow Control (PFC): A link level flow control mechanism that eliminates 24 packet loss and can be applied independently to each traffic class. 25
• Enhanced Transmission Selection (ETS): A queue scheduling algorithm that allows for 26 bandwidth assignments to traffic classes. 27
• Congestion Notification: A layer-2 end to end congestion management protocol that 28 detects congestion, signals across the layer-2 network to limit the transmission rate of 29 senders to avoid packet loss. 30
• Data Center Bridging Capabilities Exchange Protocol (DCBX): a discovery and capability 31 exchange protocol, working in conjunction with the Link Layer Discovery Protocol (LLDP), to 32 convey capabilities and configuration of the above features. 33
These contributions were important to the expansion of Ethernet into the specialized markets of 34 cluster computing and storage area networks. However, continued evolution is needed as the 35 environments and technologies have changed. Today’s data centers are deployed on massive scale, 36 using Layer-3 protocols and highly orchestrated management systems. Ethernet links have 37 advanced from 10 Gbps to 400 Gbps, with active plans to increase speeds into the Tbps range. New 38
3

Copyright © 2021 IEEE. All rights reserved.
Draft Nendica Report 1-21-0004-01-ICne-draft-dcn-report
8 IEEE SA Industry connections
applications, such as Artificial Intelligence (AI) are placing new demands on the infrastructure and 1 driving architectural changes. Continued innovation is needed to further expand the use of Ethernet 2 in modern data center environments. 3
Requirements evolution 4
AI applications put pressure on the data center network. Consider AI training for self-driving cars 5 as an example. The deep learning algorithm relies heavily on massive data and high-performance 6 computing capabilities. The training data collected each day is approaching the petabyte level (1PB 7 = 1024 TB), and if traditional hard disk storage and common CPUs were used to process the data, it 8 could take at least one year to complete the training process. This is clearly impractical. To improve 9 AI data processing efficiency, revolutionary changes are needed in the storage and computing fields. 10 For example, storage performance needs to improve by an order of magnitude to achieve more 11 than 1 million input/output operations per second (IOPS) [6]. 12
To meet real-time data access requirements, storage media has evolved from hard disk drives 13 (HDDs) to solid-state drives (SSDs) to storage-class memory (SCMs). This has reduced storage 14 medium latency by more than 1000 times. Without similar improvements in network latency, these 15 storage improvements cannot be realized and simply move the bottleneck from the media to the 16 network. With networked SSD drives, the communication latency accounts for more than 60% of 17 the total storage end-to-end latency. With the move to SCM drives, this percentage could increase 18 to 85% unless improvements in network performance are achieved. This creates a scenario where 19 the precious storage media is idle more than half of the time. When you consider recent 20 improvements in both storage media and AI computing processors together, the communication 21 latency accounts for more than 50% of the total latency, further hindering improvements and 22 wasting resources [7]. 23
AI applications and environments are growing in scale and complexity. For example, there were 7 24 ExaFLOPS and 60 million parameters in Microsoft’s Resnet of 2015. Baidu used 20 ExaFLOPS and 25 300 million parameters when training their deep speech system in 2016. In 2017, the Google NMT 26 used 105 ExaFLOPS and 8.7 billion parameters [8]. New characteristics of AI computing are requiring 27 an evolution of data center network. 28
Traditional protocols are no longer able to satisfy the requirements of new applications that serve 29 our daily lives. In a simple example, the online food take-out industry at Meitan has increased nearly 30 500% in the last four years. The number of transactions has increased from 2.149 billion to 12.36 31 billion where those transactions all occur within a few hours at peak mealtimes. The Meituan 32 Intelligent Scheduling System is responsible for orchestrating a complex multi-person, multi-point 33 real-time decision-making process for end-users, businesses and over 600,000 delivery drivers. The 34 drivers report positioning data 5 billion times a day that are used to calculate optional paths for the 35 drivers and deliver optimal solutions within 0.55 milliseconds. When the back-end servers use 36 TCP/IP protocols, the amount of data copied between kernel buffers, application buffers and NIC 37 buffers stresses the CPU and memory bus resources causing increased delay and an inability to meet 38 the application requirements. The newer Remote Direct Memory Access (RDMA) protocol 39 eliminates data copies and frees CPU resources to perform driver path and take-out order 40 calculations at scale. The improved efficiency of RDMA puts more pressure on the network, moving 41 the bottleneck to the data center network infrastructure where low-latency and lossless behavior 42 become the new critical requirements. 43

Copyright © 2021 IEEE. All rights reserved.
Draft Nendica Report 1-21-0004-01-ICne-draft-dcn-report
9 IEEE SA Industry connections
Characteristics of AI computing 1
Traditional data center services (web, database, and file storage) are transaction-based and the 2 calculated results are often deterministic. For such tasks, there is little correlation or dependency 3 between a single transaction and the associated network communication. The occurrence and 4 duration of the traditional transactions are random. AI computing, however, is different. It is an 5 optimization problem with iterative convergence. This causes high spatial correlation within the 6 data sets and computing algorithms and creates temporal correlations between communication 7 flows. 8
AI computing works on big data and demands fast data. To achieve this, it must operate in parallel 9 to “divide-and-conquer” the problem. The computing model and input data sets are large (e.g in a 10 100 MB node, the AI model with 10K rules requires more than 4 TB memory). A single server cannot 11 provide enough storage capacity and processing resources to handle the problem sequentially. 12 Concurrent AI computing and storage nodes are required to shorten the processing time. This 13 distributed AI computing and storage requirement highlights the need for a fast, efficient, and 14 lossless data center network that has the flexibility to support two distinct parallel modes of 15 operation: model parallel computing and data parallel computing. 16
Model Parallel Computing 17
In model parallel computing, each node computes one part of the overall algorithm. Each node 18 processes the same set of data, but with a different portion of the algorithm, resulting in an estimate 19 for a differing set of parameters. The nodes exchange their estimates to converge upon the best 20 estimate for all the data parameters. With model parallel computing, there is an initial distribution 21 of the common data set to a distributed number of nodes, followed by a collection of individual 22 parameters from each of the participating nodes. Figure 3 shows how parameters of the overall 23 model may be distributed across computing nodes in a model parallel mode of operation. 24
Data Parallel Computing 25
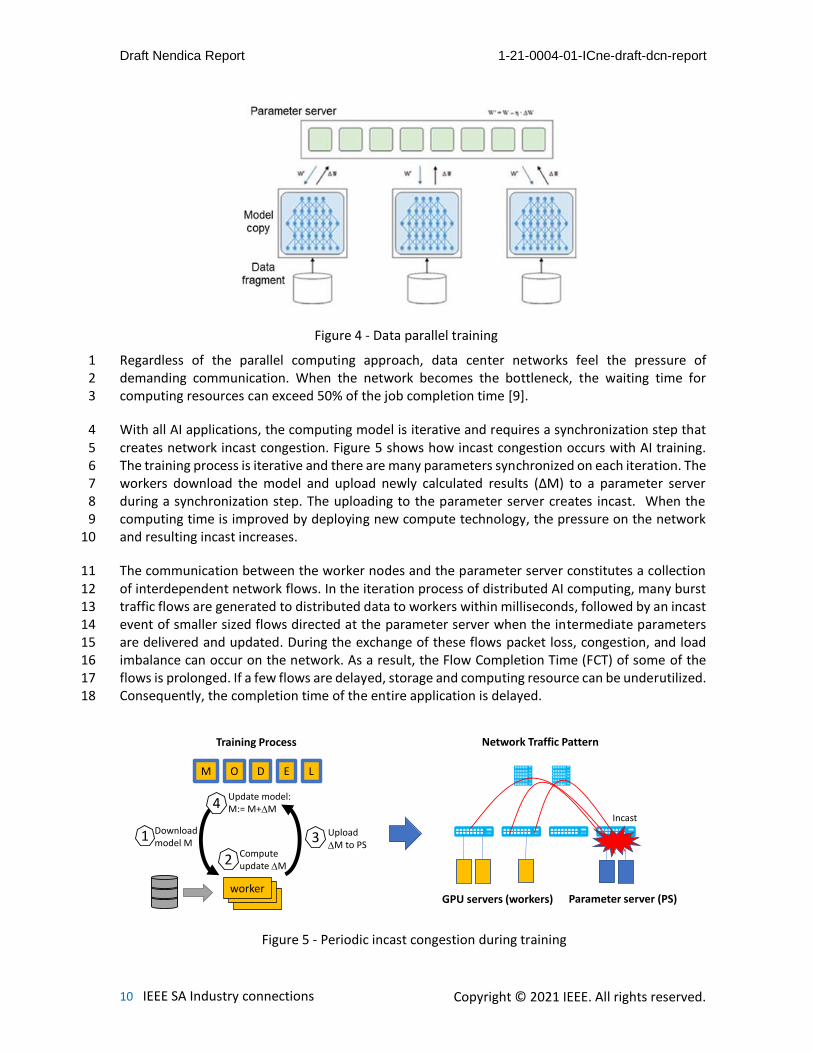
In data parallel computing, each node loads the entire AI algorithm model, but only processes part 26 of the input data. Each node is trying to estimate the same set of parameters using a different view 27 of the data. When a node completes a round of calculations, the parameters are weighted and 28 aggregated by a common parameter server as seen in Figure 4. The weighted parameter update 29 requires that all nodes upload the information synchronously. 30
Figure 3 - Model parallel training
Copyright © 2021 IEEE. All rights reserved.
Draft Nendica Report 1-21-0004-01-ICne-draft-dcn-report
10 IEEE SA Industry connections
Regardless of the parallel computing approach, data center networks feel the pressure of 1 demanding communication. When the network becomes the bottleneck, the waiting time for 2 computing resources can exceed 50% of the job completion time [9]. 3
With all AI applications, the computing model is iterative and requires a synchronization step that 4 creates network incast congestion. Figure 5 shows how incast congestion occurs with AI training. 5 The training process is iterative and there are many parameters synchronized on each iteration. The 6 workers download the model and upload newly calculated results (ΔM) to a parameter server 7 during a synchronization step. The uploading to the parameter server creates incast. When the 8 computing time is improved by deploying new compute technology, the pressure on the network 9 and resulting incast increases. 10
The communication between the worker nodes and the parameter server constitutes a collection 11 of interdependent network flows. In the iteration process of distributed AI computing, many burst 12 traffic flows are generated to distributed data to workers within milliseconds, followed by an incast 13 event of smaller sized flows directed at the parameter server when the intermediate parameters 14 are delivered and updated. During the exchange of these flows packet loss, congestion, and load 15 imbalance can occur on the network. As a result, the Flow Completion Time (FCT) of some of the 16 flows is prolonged. If a few flows are delayed, storage and computing resource can be underutilized. 17 Consequently, the completion time of the entire application is delayed. 18
Figure 4 - Data parallel training
Figure 5 - Periodic incast congestion during training
GPU servers (workers) Parameter server (PS)
Incast
Network Traffic Pattern
M O D E L
Download model M
1Computeupdate M2
Upload M to PS
3
Update model: M:= M+M4
workerworkerworker
Training Process

Copyright © 2021 IEEE. All rights reserved.
Draft Nendica Report 1-21-0004-01-ICne-draft-dcn-report
11 IEEE SA Industry connections
Distributed AI computing is synchronous, and it is desirable for the jobs to have a predictable 1 completion time. When there is no congestion, dynamic latency across the network is small 2 allowing the average FCT to be predictable and therefor the performance of the entire application 3 is predictable. When congestion causes dynamic latency to increase to the point of causing packet 4 loss, FCT can be very unpredictable. Flows that complete in a time that is much greater than the 5 average completion contributes to what is known as tail latency. Tail latency is the small percentage 6 of response times from a system, out of all of responses to the input/output (I/O) requests it serves, 7 that take the longest in comparison to the bulk of its response times. Reducing tail latency as much 8 as possible is extremely critical to the success of parallel algorithms and the whole distributed 9 computing system. To maximize the use of computing resources in the data center, tail latency 10 should be addressed. 11
Evolving technologies 12
Progress can be seen when evolving requirements and evolving technologies harmonize. New 13 requirements often drive the development of new technologies and new technologies often enable 14 new use cases that lead to, yet again, a new set of requirements. Breakthroughs in networked 15 storage, distributed computing, system architecture and network protocols are enabling the 16 advancement of the next generation data center. 17
SSDs and NVMeoF: High throughput, low-latency network 18
In networked storage, a file is distributed to multiple storage servers for IO acceleration and 19 redundancy. When a data center application reads a file, it accesses different parts of data from 20 different servers concurrently. The data is aggregated through a data center switch at nearly the 21 same time. When a data center application writes a file, the writing of data can trigger a series of 22 storage transactions between distributed and redundant storage nodes. The entire sequence of 23 transactions must complete before the original write action is satisfied. Figure 6 shows an example 24 of data center communication triggered by the networked storage service model. 25
The example highlights the importance of the network enabling both high throughput and low 26 latency simultaneously. The bulk data being written to the primary storage server is transmitted 27 multiple times to the replicas. The small sized acknowledgments and commit messages must be 28 sequenced and ultimately delivered to the originating client before the transaction can complete, 29 emphasizing the need for ultra-low latency. 30
Figure 6 - Networked storage service model
Copyright © 2021 IEEE. All rights reserved.
Draft Nendica Report 1-21-0004-01-ICne-draft-dcn-report
12 IEEE SA Industry connections
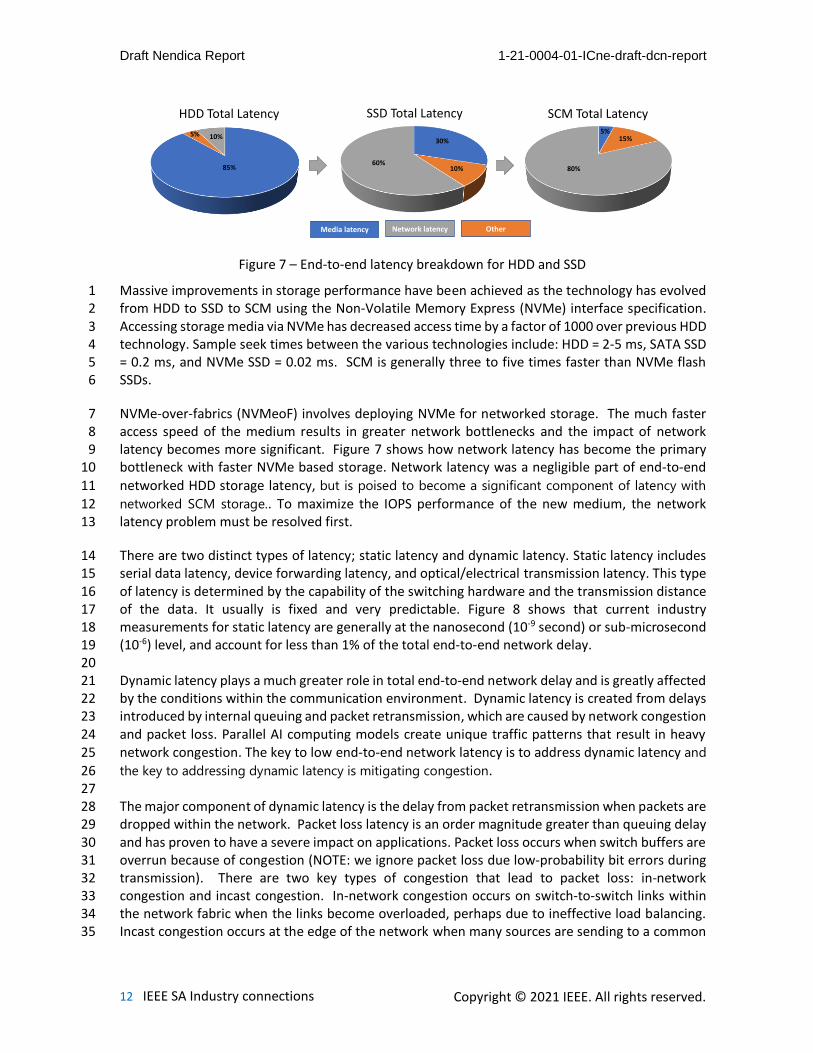
Massive improvements in storage performance have been achieved as the technology has evolved 1 from HDD to SSD to SCM using the Non-Volatile Memory Express (NVMe) interface specification. 2 Accessing storage media via NVMe has decreased access time by a factor of 1000 over previous HDD 3 technology. Sample seek times between the various technologies include: HDD = 2-5 ms, SATA SSD 4 = 0.2 ms, and NVMe SSD = 0.02 ms. SCM is generally three to five times faster than NVMe flash 5 SSDs. 6
NVMe-over-fabrics (NVMeoF) involves deploying NVMe for networked storage. The much faster 7 access speed of the medium results in greater network bottlenecks and the impact of network 8 latency becomes more significant. Figure 7 shows how network latency has become the primary 9 bottleneck with faster NVMe based storage. Network latency was a negligible part of end-to-end 10
networked HDD storage latency, but is poised to become a significant component of latency with 11
networked SCM storage.. To maximize the IOPS performance of the new medium, the network 12 latency problem must be resolved first. 13
There are two distinct types of latency; static latency and dynamic latency. Static latency includes 14 serial data latency, device forwarding latency, and optical/electrical transmission latency. This type 15 of latency is determined by the capability of the switching hardware and the transmission distance 16 of the data. It usually is fixed and very predictable. Figure 8 shows that current industry 17 measurements for static latency are generally at the nanosecond (10-9 second) or sub-microsecond 18 (10-6) level, and account for less than 1% of the total end-to-end network delay. 19 20 Dynamic latency plays a much greater role in total end-to-end network delay and is greatly affected 21 by the conditions within the communication environment. Dynamic latency is created from delays 22 introduced by internal queuing and packet retransmission, which are caused by network congestion 23 and packet loss. Parallel AI computing models create unique traffic patterns that result in heavy 24 network congestion. The key to low end-to-end network latency is to address dynamic latency and 25
the key to addressing dynamic latency is mitigating congestion. 26 27 The major component of dynamic latency is the delay from packet retransmission when packets are 28 dropped within the network. Packet loss latency is an order magnitude greater than queuing delay 29 and has proven to have a severe impact on applications. Packet loss occurs when switch buffers are 30 overrun because of congestion (NOTE: we ignore packet loss due low-probability bit errors during 31 transmission). There are two key types of congestion that lead to packet loss: in-network 32 congestion and incast congestion. In-network congestion occurs on switch-to-switch links within 33 the network fabric when the links become overloaded, perhaps due to ineffective load balancing. 34 Incast congestion occurs at the edge of the network when many sources are sending to a common 35
Figure 7 – End-to-end latency breakdown for HDD and SSD
Media latency Network latency Other
60%10%
30%
85%
10%5%
HDD Total Latency SSD Total Latency
80%
5%15%
SCM Total Latency

Copyright © 2021 IEEE. All rights reserved.
Draft Nendica Report 1-21-0004-01-ICne-draft-dcn-report
13 IEEE SA Industry connections
destination at the same time. AI computing models inherently have a phase when data is 1 aggregated after a processing iteration from which incast congestion (many-to-one) easily occurs. 2
GPUs: Ultra-low latency network for parallel computing 3
Today’s AI computing architecture includes a hybrid mix of Central Processing Units (CPUs) and 4 Graphics Processing Units (GPUs). GPUs, originally invented to help render video games at 5 exceptional speeds, have found a new home in the data center. The GPU is a processor with 6 thousands of cores capable of performing millions of mathematical operations in parallel. All AI 7 learning algorithms perform complex statistical computations and deal with a huge number of 8 matrix multiplication operations – perfectly suited for a GPU. However, to scale the AI computing 9 architecture to meet the needs of today’s AI applications in a data center, the GPUs must be 10 distributed and networked. This places stringent requirements on communication volume and 11 performance. 12
Facebook recently tested the distributed machine learning platform Caffe2, in which the latest 13 multi-GPU servers are used for parallel acceleration. In the test, computing tasks on eight servers 14 resulted in underutilized resources on the 100 Gbit/s InfiniBand network. The presence of the 15
Figure 8 – Network Latency Breakdown
Queuing latency (50 μs) Switching latency (3 μs)
Transmission latency (0.3 μs)Packet loss latency (5000 μs)
Dynamic Network Latency Static Network Latency
End-to-end Network Latency Breakdown
Figure 9 – Distributed AI Computing Architecture
Copyright © 2021 IEEE. All rights reserved.
Draft Nendica Report 1-21-0004-01-ICne-draft-dcn-report
14 IEEE SA Industry connections
network and network contention reduced the performance of the solution to less than linear scale 1 [10]. Consequently, network performance greatly restricts horizontal extension of the AI system. 2
GPUs provide much higher memory bandwidth than today’s CPU architectures. Nodes with multiple 3 GPUs are now commonly used in high-performance computing because of their power efficiency 4 and hardware parallelism. Figure 9 illustrates an architecture with multi-GPU nodes, each of which 5 consists of a host (CPUs) and several GPU devices connected by a PCI-e switch or NVLink. Each GPU 6 can directly access its local relatively large device memory, much smaller and faster shared memory, 7 and a small, pinned area of the host node’s DRAM, called zero-copy memory [11]. 8
SmartNICs 9
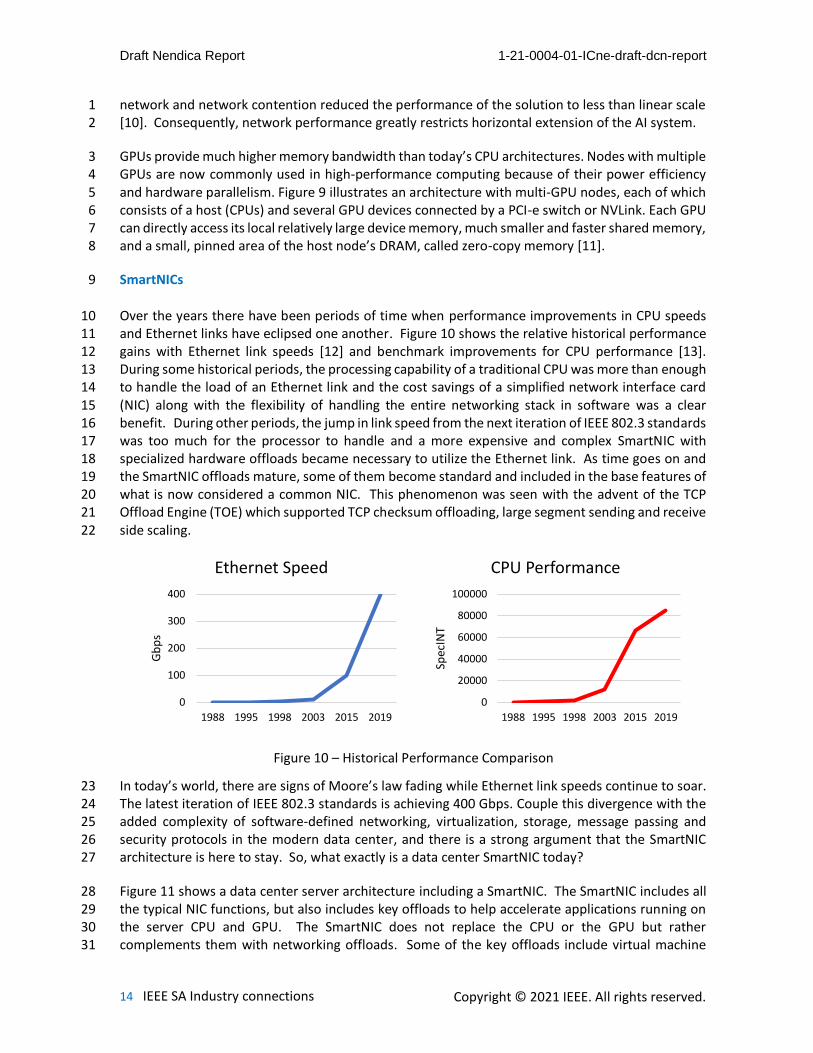
Over the years there have been periods of time when performance improvements in CPU speeds 10 and Ethernet links have eclipsed one another. Figure 10 shows the relative historical performance 11 gains with Ethernet link speeds [12] and benchmark improvements for CPU performance [13]. 12 During some historical periods, the processing capability of a traditional CPU was more than enough 13 to handle the load of an Ethernet link and the cost savings of a simplified network interface card 14 (NIC) along with the flexibility of handling the entire networking stack in software was a clear 15 benefit. During other periods, the jump in link speed from the next iteration of IEEE 802.3 standards 16 was too much for the processor to handle and a more expensive and complex SmartNIC with 17 specialized hardware offloads became necessary to utilize the Ethernet link. As time goes on and 18 the SmartNIC offloads mature, some of them become standard and included in the base features of 19 what is now considered a common NIC. This phenomenon was seen with the advent of the TCP 20 Offload Engine (TOE) which supported TCP checksum offloading, large segment sending and receive 21 side scaling. 22
In today’s world, there are signs of Moore’s law fading while Ethernet link speeds continue to soar. 23 The latest iteration of IEEE 802.3 standards is achieving 400 Gbps. Couple this divergence with the 24 added complexity of software-defined networking, virtualization, storage, message passing and 25 security protocols in the modern data center, and there is a strong argument that the SmartNIC 26 architecture is here to stay. So, what exactly is a data center SmartNIC today? 27
Figure 11 shows a data center server architecture including a SmartNIC. The SmartNIC includes all 28 the typical NIC functions, but also includes key offloads to help accelerate applications running on 29 the server CPU and GPU. The SmartNIC does not replace the CPU or the GPU but rather 30 complements them with networking offloads. Some of the key offloads include virtual machine 31
Figure 10 – Historical Performance Comparison
0
100
200
300
400
1988 1995 1998 2003 2015 2019
Gb
ps
Ethernet Speed
0
20000
40000
60000
80000
100000
1988 1995 1998 2003 2015 2019
Spec
INT
CPU Performance

Copyright © 2021 IEEE. All rights reserved.
Draft Nendica Report 1-21-0004-01-ICne-draft-dcn-report
15 IEEE SA Industry connections
interface support, flexible match-action processing of packets, overlay tunnel termination and 1 origination, encryption, traffic metering, shaping and per-flow statistics. Additionally, SmartNICs 2 often include entire protocol offloads and direct data placement to support RDMA and NVMe-oF 3 storage interfaces. 4
One new critical component of today’s SmartNIC is programmability. A criticism of SmartNICs in 5 the past was their inability to keep pace with the rapidly changing networking environment. The 6 early cloud data center environments favored using the CPU for most networking functions because 7 the required feature set for the NIC was evolving faster than the development cycle of the 8 hardware. Today’s SmartNICs however have an open and flexible programming environment. They 9 are essentially a computer in front of the computer with an open source development environment 10 based on Linux and other software-defined networking tools such as Open vSwitch [14]. It is 11 essential that SmartNICs integrate seamlessly into the open source ecosystem to enable rapid 12 feature development and leverage. 13
SmartNICs in the data center increase the overall utilization and load on the network. They can 14 exacerbate the effects of congestion by fully and rapidly saturating a network link. At the same 15 time, they can respond quickly to congestion signals from the network to alleviate intermittent 16 impact and avoid packet loss. The programmability of the SmartNIC allows it to adapt to new 17 protocols that can coordinate with the network to avoid conditions such as incast. 18
Remote Direct Memory Access (RDMA) 19
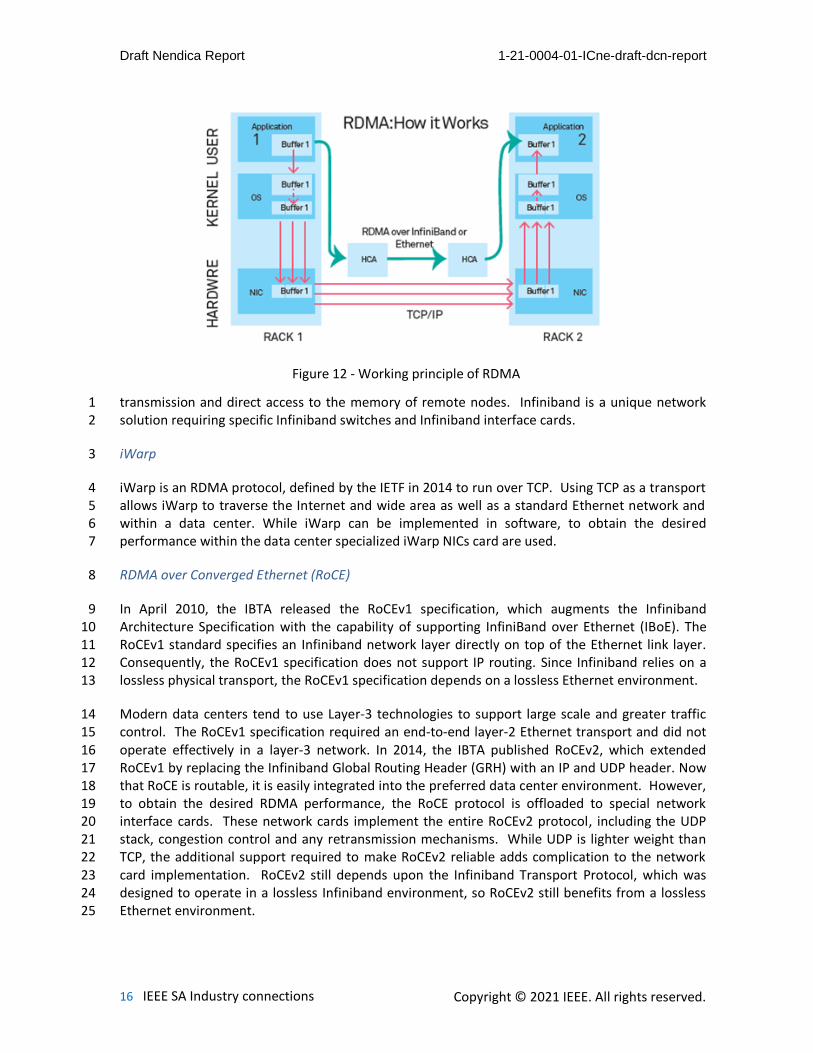
RDMA is a new technology designed to solve the high latency problem of server-side data processing 20 in network applications. With RDMA data transfers directly from one computer's memory to 21 another without the intervention of either’s operating system. This allows for high bandwidth, low 22 latency network communication and is particularly suitable for use in massively parallel computer 23 environments. Figure 12 shows the principles of the RDMA protocol. 24
There are three different transports for the RDMA protocol: Infiniband, iWarp and RoCEv1/RoCEv2. 25
Infiniband 26
In 2000, the InfiniBand Trade Association (IBTA) released the initial Infiniband specification with 27 support for RDMA. Infiniband is tailored for an efficient hardware design that ensures reliable data 28
Figure 11 – Server Architecture with SmartNIC
Copyright © 2021 IEEE. All rights reserved.
Draft Nendica Report 1-21-0004-01-ICne-draft-dcn-report
16 IEEE SA Industry connections
transmission and direct access to the memory of remote nodes. Infiniband is a unique network 1 solution requiring specific Infiniband switches and Infiniband interface cards. 2
iWarp 3
iWarp is an RDMA protocol, defined by the IETF in 2014 to run over TCP. Using TCP as a transport 4 allows iWarp to traverse the Internet and wide area as well as a standard Ethernet network and 5 within a data center. While iWarp can be implemented in software, to obtain the desired 6 performance within the data center specialized iWarp NICs card are used. 7
RDMA over Converged Ethernet (RoCE) 8
In April 2010, the IBTA released the RoCEv1 specification, which augments the Infiniband 9 Architecture Specification with the capability of supporting InfiniBand over Ethernet (IBoE). The 10 RoCEv1 standard specifies an Infiniband network layer directly on top of the Ethernet link layer. 11 Consequently, the RoCEv1 specification does not support IP routing. Since Infiniband relies on a 12 lossless physical transport, the RoCEv1 specification depends on a lossless Ethernet environment. 13
Modern data centers tend to use Layer-3 technologies to support large scale and greater traffic 14 control. The RoCEv1 specification required an end-to-end layer-2 Ethernet transport and did not 15 operate effectively in a layer-3 network. In 2014, the IBTA published RoCEv2, which extended 16 RoCEv1 by replacing the Infiniband Global Routing Header (GRH) with an IP and UDP header. Now 17 that RoCE is routable, it is easily integrated into the preferred data center environment. However, 18 to obtain the desired RDMA performance, the RoCE protocol is offloaded to special network 19 interface cards. These network cards implement the entire RoCEv2 protocol, including the UDP 20 stack, congestion control and any retransmission mechanisms. While UDP is lighter weight than 21 TCP, the additional support required to make RoCEv2 reliable adds complication to the network 22 card implementation. RoCEv2 still depends upon the Infiniband Transport Protocol, which was 23 designed to operate in a lossless Infiniband environment, so RoCEv2 still benefits from a lossless 24 Ethernet environment. 25
Figure 12 - Working principle of RDMA

Copyright © 2021 IEEE. All rights reserved.
Draft Nendica Report 1-21-0004-01-ICne-draft-dcn-report
17 IEEE SA Industry connections
Figure 13 shows the most common RDMA protocol stacks and their associated standards bodies. 1 Table 1 compares the details of different implementations. RDMA has become the protocol of 2 choice for high-speed storage, AI and Machine Learning applications in large scale cloud data 3 centers. There are real world examples of tens of thousands of servers running RDMA in production. 4 Applications have reported impressive performance improvements by adopting RDMA [15]. For 5 example, distributed training for machine learning has accelerated more than 100 times and the 6 I/O speed of networked SSD storage has improved more than 50 times using RDMA for 7 communications as opposed to TCP/IP. These improvements majorly stem from the hardware 8 offloading characteristic of RDMA. 9
GPU DirectRDMA 10
Combining two good ideas can often create a breakthrough idea. GPU DirectRDMA comprises the 11 PeerDirect technology of PCIe and the RDMA technology of the network to deliver data directly to 12
Technology Data Rates
(Gbit/s) Latency Key Technology Advantage Disadvantage
TCP/IP over
Ethernet
10, 25, 40, 50,
56, 100, or
200
500-
1000 ns
TCP/IP
Socket programming
interface
Wide application scope,
low price, and good
compatibility
Low network usage, poor average
performance, and unstable link
transmission rate
Infiniband 40, 56, 100, or
200
300-
500 ns
InfiniBand network
protocol and architecture
Verbs programming
interface
Good performance
Large-scale networks not
supported, and specific NICs and
switches required
RoCE/RoCEv2 40, 56, 100, or
200
300-
500 ns
InfiniBand network layer
or transport layer and
Ethernet link layer
Verbs programming
interface
Compatibility with
traditional Ethernet
technologies, cost-
effectiveness, and good
performance
Specific NICs required
Still have many challenges to
Omni-Path 100 100 ns
OPA network
architecture
Verbs programming
interface
Good performance Single manufacturer and specific
NICs and switches required
Table 1 – Comparison of RDMA Network Technologies
Figure 13 – RDMA protocol stacks and standards
EthernetInfiniBandLink Layer
Ethernet Ethernet
IP IP
UDP TCPInfiniBand
Network LayerInfiniBand
Network Layer
InfiniBandTransport Protocol
InfiniBandTransport Protocol
InfiniBandTransport Protocol
iWARPProtocol
RDMA API (VERBs)
Upper Layer Protocols / Applications
IEEE 802
IBTA
IETF
OFA
Standards & SW

Copyright © 2021 IEEE. All rights reserved.
Draft Nendica Report 1-21-0004-01-ICne-draft-dcn-report
18 IEEE SA Industry connections
a GPU memory. This technology can by supported by any PCIe peer which provides access to its 1 memory, such as NVIDIA GPU, XEON PHI, AMD GPU, FPGA, and so on. 2
GPU communications uses “pinned” buffers for data movement. A SmartNIC may also use “pinned” 3 memory to communicate with a remote “pinned” memory across the network. These two types of 4 “pinned” memory are separate sections of host memory that are dedicated to the GPU and the 5 SmartNIC. 6
Before GPU DirectRDMA, when one GPU transferred data to another GPU in a remote server, the 7 source GPU needed to copy the data from GPU memory to CPU memory which was pinned by the 8 GPU. Then the host CPU copied the data from the GPU pinned memory to memory pinned by the 9 SmartNIC. Next, the SmartNIC used RDMA to transmit the data to the remote server across the 10 network. On the remote server side, the reverse process took place. The data arrived at the memory 11 pinned by the SmartNIC, then the CPU copied the data to the memory pinned by the GPU, and 12 eventually the data arrived at the remote GPU memory. Figure 14 shows the GPU-to-GPU data copy 13 process before the existence of GPU DirectRDMA. 14
While the cost of copying data between the GPU and CPU is much lower than the cost of using TCP 15 to pass the data between GPUs, it still suffers from a several issues: 16
1. Consumption of CPU resources. The CPU may become a bottleneck during the data copy. 17
Figure 14 - The Data Transfer Before GPU DirectRDMA
Picture 15 - The Data Transfer Using GPU Direct

Copyright © 2021 IEEE. All rights reserved.
Draft Nendica Report 1-21-0004-01-ICne-draft-dcn-report
19 IEEE SA Industry connections
2. Increased latency and reduced bandwidth. The additional memory copies take time and 1
reduce I/O bandwidth. 2
3. Host memory consumption. Multiple sets of pinned buffers reduce available host memory 3
which impacts application performance and increases system TCO. 4
Optimizations such as write-combining and overlapping GPU computation with data transfer allow 5 the network and the GPU to share “pinned” buffers. This eliminates the need to make a redundant 6 copy of the data in host memory and allows the data to be directly transferred via RDMA. On the 7 receiver side the data is directly written to the GPU pinned host buffer after arriving via RDMA. This 8 technique eliminates buffer copies between the CPU and the GPU and is known as GPU Direct 9 technology. 10
A further optimization is to create an RDMA channel between the local GPU memory and the 11 remote GPU memory to eliminate CPU bandwidth and latency bottlenecks. This results in 12 significantly improved communication efficiency between GPUs in remote nodes. For this 13 optimization to work, the CPU coordinates RDMA communication tasks for the GPU and SmartNIC. 14 The SmartNIC directly accesses GPU memory to send and receive data to a remote GPU memory. 15 This technique is known as GPU DirectRDMA technology. 16
Figure 16 - The Data Transfer Using GPU DirectRDMA
Figure 17 - GPU DirectRDMA Performance (From OSU)

Copyright © 2021 IEEE. All rights reserved.
Draft Nendica Report 1-21-0004-01-ICne-draft-dcn-report
20 IEEE SA Industry connections
Figure 17 shows how GPU DirectRDMA technology improves GPU communication performance by 1 a factor of 10 over the traditional approach. These improvements have made GPU DirectRDMA 2 technology a mandatory component of HPC and AI applications, improving both performance and 3 scalability. 4
Challenges with today’s data center network 5
6
High throughput and low latency tradeoff 7
Simultaneously achieving both low latency and high throughput in a large-scale data center is 8 difficult. To achieve low latency, it is necessary to allow flows to begin transferring at line rate while 9 at the same time maintaining near empty switch queues. Aggressively starting flows at line rate 10 allows them to consume all available network bandwidth instantly and can lead to extreme 11 congestion at convergence points. Deep switch buffers absorb temporary congestion to avoid 12 packet loss but delay the delivery of latency sensitive packets. While deep switch buffers provide 13 more resources for balancing the tradeoff between low latency and high throughput it is 14 increasingly difficult to build switches with deep buffers. Switch capacity continues to increase with 15 link speeds and higher port density, but the buffer size of commodity switching chips cannot keep 16 pace. Figure 18 shows hardware trends for top-of-the-line data center switches chips manufactured 17 by Broadcom [16]. 18
Using a low ECN marking threshold can help slow aggressive flows and keep switch queue levels 19 empty, but this reduces throughput. High throughput flows benefit from larger switch queues and 20 higher ECN marking thresholds to prevent overreacting to temporary congestion and slowing down 21 unnecessarily. 22
4
Figure 18 – Switch Chip Buffer Trends
Trident2 (2012)
Tomahawk (2014) Tomahawk2
(2016)
Tomahawk3 (2018)
0
10
20
30
40
50
60
70
80
90
0 2 4 6 8 1 0 1 2
BU
FFER
SIZ
E /
CA
PA
CIT
Y
SWITCH CAPACITY (TBPS)
BUFFERING AND SWITCH CAPACITY

Copyright © 2021 IEEE. All rights reserved.
Draft Nendica Report 1-21-0004-01-ICne-draft-dcn-report
21 IEEE SA Industry connections
Experimentation shows the tradeoff between high throughput and low latency exists after varying 1 algorithms, parameters, traffic patterns and link loads [15]. Figure 19 from [15] shows how flow 2 completion times (FCT) are delayed beyond their theoretical minimum FCT when using different 3 ECN marking thresholds (Kmin, Kmax ) during a controlled experiment using a public RDMA 4 WebSearch traffic workload as the input. Lower values for Kmin and Kmax will cause ECN markings 5 to occur more quickly and force flows to slow down more aggressively. As seen in the figure, when 6 using low ECN thresholds, small flows which are latency-sensitive have lower FCT slowdown, while 7 big flows which are typically bandwidth-hungry suffer from larger FCT slowdown. The trend is more 8 obvious when the network load is higher (Figure 19-b when the average link load is 50%). 9
Deadlock free lossless network 10
RDMA advantages over TCP include low latency, high throughput, and low CPU usage. However, 11 unlike TCP, RDMA needs a lossless network; i.e. there should be no packet loss due to buffer 12 overflow at the switches [17]. The RoCE protocol runs on top of UDP with a go-back N retransmission 13 strategy that severely impacts performance when retransmission is invoked. As such, RoCE requires 14 Priority-based Flow Control (IEEE Std 802.1Q-2018, Clause 36 [18]) to ensure that no packet loss 15 occurs in the data center network. Figure 20 from [19] shows how the RoCE service throughput 16 decreases rapidly with increasing packet loss rate. Loosing as little as one in one thousand packets 17 decreases RoCE service performance by roughly 30%. 18
Priority-based Flow Control (PFC) prevents packet loss due to buffer overflow by pausing the 19 upstream sending device when the receiving device input buffer occupancy exceeds a specified 20 threshold. While this provides the necessary lossless environment for RoCE, there are problems 21 with the large-scale use of PFC. One such problem is the possibility of a PFC deadlock. 22
Deadlocks in lossless networks using PFC style backpressure have been studied for many years [20, 23 21, 22]. A PFC deadlock occurs when there is a cyclic buffer dependency (CBD) among switches in 24 the data center network. The CBD is created when a dependent switch, in a sequence of switches, 25 is waiting for the availability of buffers in other switches before transmitting a packet. If the switches 26 involved in the CBD are using PFC and the sequence of switches are physically connected in a loop, 27 a PFC deadlock can occur. RDMA flows in a Clos data center network are distributed across multiple 28 equal cost paths to achieve the highest possible throughput and lowest latency. While there are no 29
Figure 19 – FCT slowdown distribution with different ECN thresholds, using WebSearch

Copyright © 2021 IEEE. All rights reserved.
Draft Nendica Report 1-21-0004-01-ICne-draft-dcn-report
22 IEEE SA Industry connections
loops in the logical topology, these paths naturally contain loops in the physical topology. A PFC 1 deadlock in the network can completely halt network traffic. 2
Consider the example in Figure 21. The figure shows four phases of PFC deadlock creation. In phase 3 1, four flows are equally load balanced across the Clos fabric and the network is running smoothly. 4 In phase 2, the red cross indicates a transient or permanent fault in the topology, such as link failure, 5 port failure, or route failure. Due to the failure, in the example, traffic between H1 and H7 (green 6 and yellow lines) is re-routed. The re-routing pushes more traffic through leaves 2 and 3 causing a 7 potential overflow in spine 1 and spine 2 as shown in phase 2. In the example we assume the 8 pressure on spine 1 occurs first. To avoid loss, the spine 1 switch issues PFC towards leaf 3, shown 9 in phase 3. Traffic in leaf 3 now backs up, causing further backups around the topology and a 10 cascade of PFC messages along the loop backward towards the original point of congestion. Phase 11 4 shows the resulting PFC deadlock. 12
When the network size is small, the probability of PFC deadlock is low. However, at larger scale and 13 with the high-performance requirements of the RoCE protocol, the probability of PFC deadlock 14 increases significantly. Achieving larger scale and optimal performance is a key objective of the 15
Figure 21 – Example PFC Deadlock
Spine1 Spine2
Leaf1 Leaf2 Leaf3 Leaf4
H2H1 H4H3 H6H5 H8H7
1
Spine1 Spine2
Leaf1 Leaf2 Leaf3 Leaf4
H2H1 H4H3 H6H5 H8H7
× ×
2 Spine1 Spine2
Leaf1 Leaf2 Leaf3 Leaf4
H2H1 H4H3 H6H5 H8H7
× ×
Congestion
4 PFC
PFC
PFC
PFC
3
4
1
2
Spine1 Spine2
Leaf1 Leaf2 Leaf3 Leaf4
H2H1 H4H3 H6H5 H8H7
× ×
PFC
Congestion3 1
Figure 20 – Impact of packet loss on RDMA throughput

Copyright © 2021 IEEE. All rights reserved.
Draft Nendica Report 1-21-0004-01-ICne-draft-dcn-report
23 IEEE SA Industry connections
Intelligent Lossless Data Center Network of the future. Section 5 discusses a possible new 1 technology for PFC deadlock prevention. 2
Congestion control issues in large-scale data center networks 3
RDMA technology was initially used by customers in constrained, conservative, small scale 4 environments such as high-performance cluster computing or targeted storage networks. Tuning 5 the resources required for the dedicated environment was manageable by the network operator, 6 at least to some degree. However, the performance advantages of RDMA have proven useful in 7 many application environments and there is a strong desire to use RDMA in a large-scale. Figure 22 8 shows an example of a large-scale RoCE network. In the example, the entire data center network is 9 based on Ethernet. The computing cluster and storage cluster use the RDMA protocol while the X86 10 server cluster uses traditional TCP/IP. 11
In the large-scale data center network scenario, TCP and RoCE traffic can traverse common parts of 12 the network for several different reasons. Traditional web-based applications using high-speed 13 storage backends mix end-user TCP requests with RDMA storage requests to read and write data. 14 The management and software-defined control plane of RDMA devices is typically based on TCP 15 while using RoCE for data communications. AI/ML applications use RoCE to interconnect GPUs and 16 CPUs, but still may be using TCP-based storage solutions. This leads to multiple combinations of 17 TCP and RoCE between computing-and-computing, storage-and-storage, and computing-and-18 storage systems. 19
In theory, separating TCP and RoCE traffic within the network should be easy. IEEE Std 802.1Q 20 defines 8 classes of service that can map to 8 queues with differing queue scheduling algorithms. 21 Different switch queues can be used to isolate the different traffic types. While the queues and the 22 buffer management are implemented in hardware on the switch chip, there is a performance and 23 cost tradeoff problem with the memory. Allocating sufficient dedicated memory to each queue on 24 each port to absorb microbursts of traffic without incurring packet loss can be too expensive and 25
Figure 22 – RoCE application in large-scale data center networks
…
…
GPU
GPU
…
GPU
GPU
…
GPU
GPU
Ethernet Data Center
Storage ClusterGPU Server Cluster
…
…
CPU
CPU
…
CPU
CPU
…
CPU
CPU
Ethernet Data Center
X86 Server Cluster
Spine
Leaf Leaf Leaf
Spine
CPU
CPU
CPU
CPU
CPU
CPU
Ethernet switch for data plane
Storage Storage
Ethernet switch for management plane
Spine
Management Plane
Leaf Leaf Leaf
RoCE
RoCE TCP
RoCE

Copyright © 2021 IEEE. All rights reserved.
Draft Nendica Report 1-21-0004-01-ICne-draft-dcn-report
24 IEEE SA Industry connections
technically challenging as the number of ports per switch chip goes up. To address this tradeoff, 1 switch chip vendors implement a smart buffering mechanism that allows for a hybrid of fixed and 2 shared buffers. 3
The core idea of smart buffering is the creation of a dynamic shared buffer. The goal is to optimize 4 buffer utilization and burst absorption by reducing the number of dedicated buffers while providing 5 a dynamic and self-tuning shared pool across all ports to handle temporary bursts [23]. 6
An example smart buffer architecture, as shown in Figure 23. Each port has a fixed number of 7 dedicated buffers for each of its queues and a common dynamic pool of centralized surplus buffers. 8 The approach considers that congestion in a typical data center environment is localized to a subset 9 of egress ports at any given point in time and rarely occurs on all ports simultaneously. This 10 assumption allows the centralized on-chip buffer to “right-size” the memory usage for overall cost 11 and power consumption while still providing resources to congested ports exactly when needed by 12 deploying self-tuning thresholds. 13
Contrasted with static per-port buffer allocation schemes found in other switch architectures, the 14 smart buffer approach significantly improves buffer utilization and enables better performance for 15 data center applications. However, the shared dynamic pool has consequences on traffic class 16 isolation in congested situations. TCP and RoCE flows may impact one another when they traverse 17 common links, even if they are using separate traffic classes on those links. TCP and RoCE use 18 different congestion control mechanisms, different re-transmission strategies and different traffic 19 class configuration (lossless verse lossy). The algorithms and configurations can lead to unfair 20 sharing of the common resource. Figure 23 shows the problem when the switch is under heavy 21 load. Network operators allocate the network bandwidth to different traffic classes based on the 22 service requirements of the network, but over time and during periods of congestion the bandwidth 23
Figure 23 – TCP and RoCE coexistence with smart buffering.
Allocated
Consumed
TCP RoCE TCP RoCE TCP RoCE
Light Load Moderate Load Heavy Load
Copyright © 2021 IEEE. All rights reserved.
Draft Nendica Report 1-21-0004-01-ICne-draft-dcn-report
25 IEEE SA Industry connections
allocations cannot be met. The different congestion control methods create different traffic 1 behavior that impacts the smart buffering mechanism’s ability to fairly allocated the dynamic shared 2 buffer pool. In this case, TCP preempts RoCE bandwidth, even when it is assigned to separate traffic 3 classes. The RoCE flow completion delay has been seen to increase by 100 times. ODCC conducted 4 several tests to verify the problem of traffic coexistence [24]. 5
Configuration complexity of congestion control algorithms 6
Historically, HPC data center networks were small in scale and optimized through manual 7 configuration. However, a goal of the Intelligent Lossless Data Center Network is to enable HPC and 8 AI data centers to grow to cloud scale and be provisioned through automation. Manual 9 configuration and hand tuning parameters are not possible at cloud scale, but the proper operation 10 of the HPC data center requires network wide consistent configuration of several attributes. Some 11 of the key attributes include: 12
• Consistent mapping of network priorities to switch traffic classes (i.e. switch queues). 13
• Consistent assignment of application traffic to network priorities. 14
• Consistent enablement of PFC on lossless traffic classes. 15
• Bandwidth allocations for traffic classes using Enhanced Transmission Scheduling (ETS). 16
• Buffer threshold settings for PFC and ensuring there is enough headroom to avoid loss. 17
• Buffer threshold settings for ECN marking. 18 19 The IEEE 802.1 Working Group defined the Data Center Bridging eXchange protocol (DCBX) to 20 automate the discovery, configuration, and misconfiguration detection of many of the data center 21 network configuration attributes. DCBX leverages the Link Layer Discovery Protocol (LLDP) to 22 exchange a subset of configuration attributes with a network peer, and if the peer is ‘willing’ to 23 accept recommended settings, the two peers can create a consistent configuration. This consistent 24 configuration can propagate across the entire data center network if all devices are running DCBX. 25 The protocol, however, does not exchange all key attributes for a data center network. In particular, 26 it does not enable the automatic setting of buffer thresholds, which can be quite complex to 27 determine and critical to the proper operation of the network. 28 29
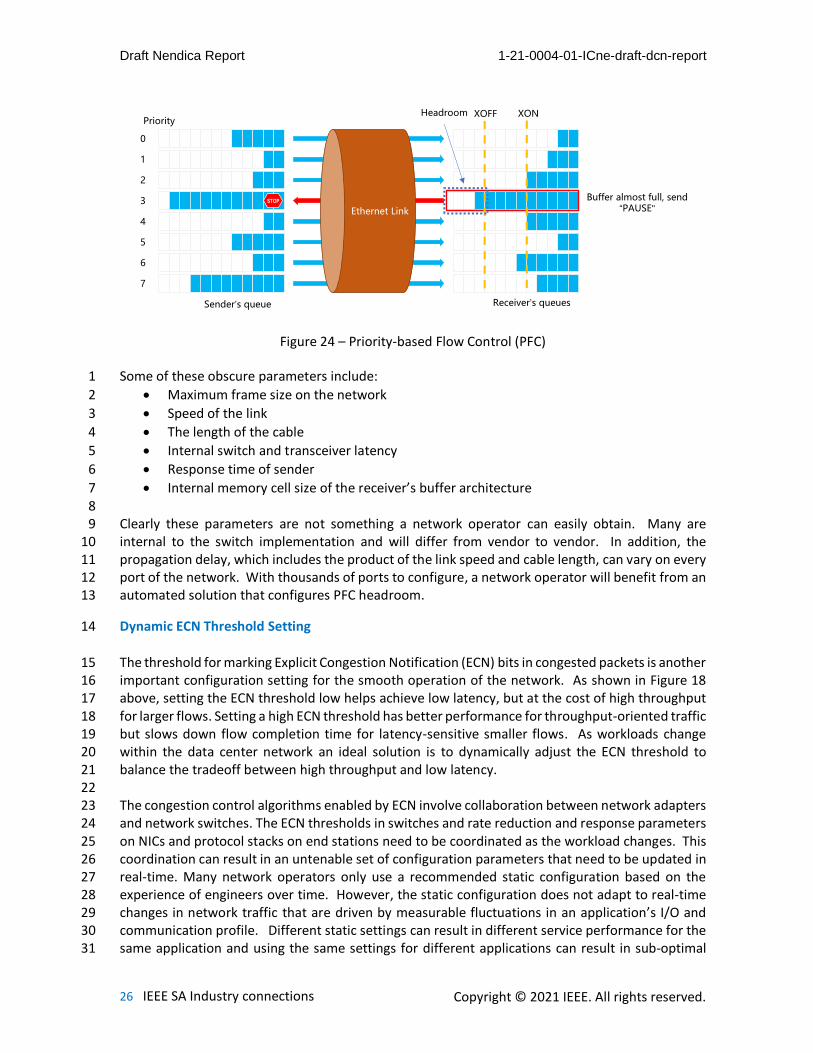
Adaptive PFC Headroom Calculation 30
The PFC buffer threshold determines when pause frames are sent as seen in Figure 24. If the 31 receiver’s buffer fills past the XOFF threshold, the receiver sends a pause frame. When the buffer 32 drains and empties below the XON threshold, the receiver may send an un-pause frame canceling 33 the previous pause or it may simply let the original pause timeout. The XOFF threshold must be set 34 in such a way to allow in-flight frames to be received. The buffer memory available beyond the 35 XOFF threshold is often called headroom and must be available to ensure lossless operation. Finding 36 the best XON/XOFF thresholds can be tricky. Overestimating the threshold is not practical because 37 it wastes precious switch memory and reduces the number of lossless traffic classes that can be 38 supported. Underestimating the threshold leads to packet loss and poor performance for protocols 39 such as RoCE. Finding the optimal setting is difficult because it requires the complex calculation of 40 many obscure parameters [25]. 41 42 43 44
Copyright © 2021 IEEE. All rights reserved.
Draft Nendica Report 1-21-0004-01-ICne-draft-dcn-report
26 IEEE SA Industry connections
Some of these obscure parameters include: 1
• Maximum frame size on the network 2
• Speed of the link 3
• The length of the cable 4
• Internal switch and transceiver latency 5
• Response time of sender 6
• Internal memory cell size of the receiver’s buffer architecture 7 8 Clearly these parameters are not something a network operator can easily obtain. Many are 9 internal to the switch implementation and will differ from vendor to vendor. In addition, the 10 propagation delay, which includes the product of the link speed and cable length, can vary on every 11 port of the network. With thousands of ports to configure, a network operator will benefit from an 12 automated solution that configures PFC headroom. 13
Dynamic ECN Threshold Setting 14
The threshold for marking Explicit Congestion Notification (ECN) bits in congested packets is another 15 important configuration setting for the smooth operation of the network. As shown in Figure 18 16 above, setting the ECN threshold low helps achieve low latency, but at the cost of high throughput 17 for larger flows. Setting a high ECN threshold has better performance for throughput-oriented traffic 18 but slows down flow completion time for latency-sensitive smaller flows. As workloads change 19 within the data center network an ideal solution is to dynamically adjust the ECN threshold to 20 balance the tradeoff between high throughput and low latency. 21 22 The congestion control algorithms enabled by ECN involve collaboration between network adapters 23 and network switches. The ECN thresholds in switches and rate reduction and response parameters 24 on NICs and protocol stacks on end stations need to be coordinated as the workload changes. This 25 coordination can result in an untenable set of configuration parameters that need to be updated in 26 real-time. Many network operators only use a recommended static configuration based on the 27 experience of engineers over time. However, the static configuration does not adapt to real-time 28 changes in network traffic that are driven by measurable fluctuations in an application’s I/O and 29 communication profile. Different static settings can result in different service performance for the 30 same application and using the same settings for different applications can result in sub-optimal 31
Figure 24 – Priority-based Flow Control (PFC)
0
1
2
3
4
5
6
7
STOP
Priority
Sender’s queue Receiver’s queues
Buffer almost full, send “PAUSE"Ethernet Link
XOFF XONHeadroom
Copyright © 2021 IEEE. All rights reserved.
Draft Nendica Report 1-21-0004-01-ICne-draft-dcn-report
27 IEEE SA Industry connections
performance for the aggregate of applications on the data center network. Measuring the 1 characteristics of network traffic for the set of the application I/O and communication profiles can 2 lead to a predictive algorithm that dynamically adjusts the ECN threshold in switches and the rate 3 reduction and response parameters at end-stations. 4
New technologies to address new data 5
center problems 6
7
Hybrid transports for low latency and high throughput 8
Traditional data center transport protocols, such as DCTCP [26] and RoCEv2 with DCQCN [19] are 9 sender driven. They attempt to measure and match the instantaneous bandwidth available along 10 the path by pushing data into the channel and awaiting feedback or measurements from the 11 receiver. They continue to push more and more data into the channel until congestion is 12 experienced, at which point they reduce their sending rate to avoid packet loss. There can be many 13 methods of determining when congestion is experienced and how to adjust the sending rate, but 14 the basic premise of sender driven transports is the same – continue to adjust the sending rate up 15 or down based upon an estimation of the available channel bandwidth. This is a very well-known 16 and mature approach to transport congestion control that has been shown to be successful in highly 17 diverse networks such as the Internet. Accurately estimating of the available bandwidth depends, 18 not only, on detecting congestion, but on creating it. Congestion signal delays and untimely 19 adjustments to the sending rate can cause fluctuations to queue depths, leading to variance in 20 throughput and latency. Large buffers in routers and switches can absorb these fluctuations to 21 avoid packet loss. 22
A receiver driven transport, such as ExpressPass [27], can be used to avoid fluctuations in queue 23 depths and minimize buffering along the path from sender to receiver. With receiver driven 24 transports, the sender’s transmissions are paced by the receiver’s schedule. A request-grant or 25 credit-based protocol is used to pace the sender and avoid congestion while fully utilizing network 26 bandwidth. The approach is especially good at handling incast congestion where the receiver is 27 overrun by multiple simultaneous senders. The challenge with receiver driven transports is that the 28 receiver must now estimate the available bandwidth along the path. Similar techniques for 29 congestion detection can be used and the receiver driven approach as the advantage of receiving 30 those congestion signals first. Perhaps a more significant challenge with receiver driven transports 31 is the inherent delay built into the initial buffer request by the sender. The initial request-grant 32 exchange penalizes small flows which, in most cases, are latency sensitive and constitute the 33 majority of flows in the data center network. 34
A hybrid driven transport, such as NDP [28] or Homa [29], attempts to borrow the best qualities 35 from sender driven and receiver driven transports to reduce latency and increase throughput by 36 avoiding congestion. A hybrid approach allows the sender to transmit a certain amount of 37 unscheduled traffic into the network without waiting for a buffer grant by the receiver, but then it 38
5

Copyright © 2021 IEEE. All rights reserved.
Draft Nendica Report 1-21-0004-01-ICne-draft-dcn-report
28 IEEE SA Industry connections
must transition to a scheduled receiver driven approach after the unscheduled traffic is sent. The 1 unscheduled traffic has no additional latency penalties and benefits small flows but can create 2 minor fluctuations in buffer occupancy which can lead to moderate packet loss. Since the amount 3 of unscheduled traffic is small, the overall buffer occupancy remains low which leads to more 4 bounded latency and low packet loss. Adjusting the amount of unscheduled traffic based on 5 heuristics helps tune the network for high throughput and low latency while maintaining low buffer 6 utilization. Figure 25 shows the high-level approach to each of the different transport types and a 7 conceptual graph of buffer utilization over time. 8
PFC deadlock prevention using topology recognition 9
Traffic on a well-balanced Clos networks is loop free and typically flows from uplink to downlink at 10 ingress and downlink to uplink at egress. However, rerouting occurs when transient link faults are 11 detected, and traffic may flow from uplink to uplink as shown in Figure 21. According to [22], the 12 probability of rerouted traffic is approximately 10−5. While 10−5 is not a high probability, given the 13 large traffic volume and the large scale of data center networks the chance of a deadlock occurring 14 is possible and even the slightest probability of a deadlock can have dramatic consequences. PFC 15 deadlocks are real! The larger the scale, the higher the probability of PFC deadlock, and the lower 16 the service availability from this critical resource. 17
A mechanism to prevent PFC deadlock involves discovering and avoiding CBD loops. The core idea 18 of the deadlock-free algorithm is to break the circular dependency by identifying traffic flows that 19 create it. The first step in achieving this is to discover the topology and understand the port 20 orientation of every switch port in the network. An innovative distributed topology and role auto-21 discovery protocol is used to identify network locations and roles of across the data center network. 22
The topology and role discovery protocol automatically determines a device’s level within the 23 topology and the orientation of each of the device’s ports. The level within the topology is defined 24 as the number of hops from the edge of the network. For example, a server or storage endpoint is 25 at level 0 and the top-of-rack switch connected to that server or storage endpoint is at level 1. The 26
Figure 25 – Transport styles with conceptual network buffering implications
SWSender Receiver
Detection
Rate Control
congestionexperienced
Feedback
Sending
SWSender Receiver
Grant
Sending
Request
SWSender Receiver
Scheduled Sending
Unscheduled Sending
Grant
Q
T0 RTT
Qmax
FluctuationQ
T0 RTT
Qmax
Minimal buffering
Q
T0 RTT
Qmax
Heuristic determined unscheduled traffic subject to environment changes
Sender Driven Receiver Driven Hybrid Driven

Copyright © 2021 IEEE. All rights reserved.
Draft Nendica Report 1-21-0004-01-ICne-draft-dcn-report
29 IEEE SA Industry connections
port orientation of a port can be either an uplink, downlink or a crosslink. An uplink orientation, for 1 example, is determined for a port of a device that is connected to another device at a higher level. 2
The protocol starts out by recognizing known conditions. Servers and storage endpoints are always 3 at level 0 and their port orientation is always an uplink. Switches are initialized without any 4 knowledge of their level or port orientation, but as the information is propagated by a discovery 5 protocol, the algorithm converges upon an accurate view. Figure 26 shows the resulting topology 6 and role discovery in a simple Clos network. 7
Once the protocol has recognized the topology and port roles, the deadlock free mechanism can 8 identify potential CBD points in the network and adapt the forwarding plane to break the buffer 9 dependencies. Figure 27 shows how potential CBD points in the topology can be recognized. In a 10 properly operating Clos network, there is no CBD and flows will typically traverse a switch ingress 11 and egress port pair that has three of four possible port orientation combinations. The flow may 12 pass from a port oriented as a downlink to a port oriented as an uplink. In the spine of the network, 13 the flow may pass from a port oriented as a downlink to another port oriented as a downlink. 14 Finally, as the flow reaches its destination, the flow may pass from a port oriented as an uplink to a 15 port oriented as a downlink. A CBD may exist in the case where a flow has been rerouted and now 16 passes from a port oriented as an uplink to another port oriented as an uplink. 17
After recognizing the CBD point, the forwarding plane is responsible for breaking the CBD. The CBD 18 exists because a set of flows are using the same traffic class and are traversing a series of switches 19 that now form a loop due to the flow rerouting. The buffer dependency is the shared buffer memory 20
Figure 27 – Identifying CBD points in rerouted flows.
Level 0
Level 1
Level 2
up
down
up
down
up
down
up
down
up
down
up
down
Level 0
Level 1
Level 2
up
down
up
down
up
down
up
down
up
down
up
down
down->down
down->up up->down
X X
up->up
Conventional CLOS Flows Rerouted CLOS Flows
Figure 26 – Topology and Role Discovery
Discovery protocol exchange automatically determines:
1. Topology level of devices in network• 0 = End-station or server edge• 1 = Leaf• n+1 = Spine
2. Port orientation for each link• Uplink• Downlink• Crosslink
HINT: Servers are always at level 0 with uplinks.
Level 0
Level 1
Level 2
up
down
up
down
up
down
up
down
up
down
up
down

Copyright © 2021 IEEE. All rights reserved.
Draft Nendica Report 1-21-0004-01-ICne-draft-dcn-report
30 IEEE SA Industry connections
of the common traffic class (i.e. switch queue). To break the CBD, packets of the rerouted flow need 1 to be forwarded to a separate queue. These packets can be identified because they are flowing from 2 a port oriented as an uplink to another port oriented as an uplink. Figure 28 illustrates the process 3 of queue remapping within the switch. In the example, the remapping of the green flow to an 4 isolated queue will lead the elimination of PFC deadlock. The different flows can safely pass-through 5 different queues at the point of a potential CBD. 6
ODCC, in participation with many network vendors, conducted tests to verify the deadlock free 7 algorithm [24]. 8
Improving Congestion Notification 9
A state-of-the-art congestion control mechanism for the RoCEv2 protocols in today’s data centers 10 is Data Center Quantized Congestion Notification (DCQCN) [19]. DCQCN combines the use of ECN 11 and PFC to enable a large-scale lossless data center network. Figure 29 shows the three key 12 components of DCQCN; a reaction point (RP), a congestion point (CP) and a notification point (NP). 13
Reaction Point (RP) 14
The RP is responsible for regulating the injection rate of packets into the network. It is typically 15 implemented on the sending NIC and responds to Congestion Notification Packets (CNP) sent by the 16 NP when congestion is detected in the network. When a CNP is received, the RP will decrease the 17 current rate of injection. If the RP does not receive a CNP within a specified period, it will increase 18 the transmit rate using a quantized algorithm specified by DCQCN. 19
Congestion Point (CP) 20
A CP is included in the switches along the path between the transmitter (RP) and the receiver (NP). 21 The CP is responsible for marking packets with ECN when congestion is detected at an egress queue. 22
Figure 28 – Queue switch according to CBD reroute flow recognition.
re-routed traffic
normal traffic
isolated queue
monitored queue
Figure 29 – Three parts of RoCE congestion control using DCQCN
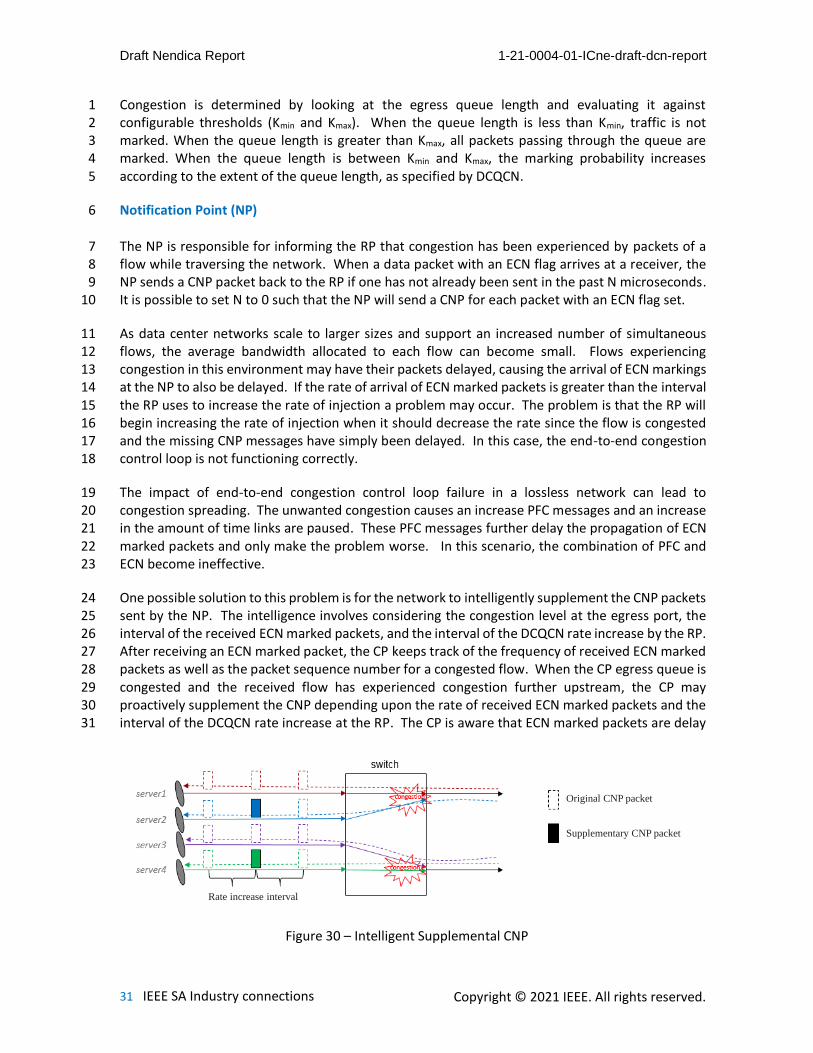
Copyright © 2021 IEEE. All rights reserved.
Draft Nendica Report 1-21-0004-01-ICne-draft-dcn-report
31 IEEE SA Industry connections
Congestion is determined by looking at the egress queue length and evaluating it against 1 configurable thresholds (Kmin and Kmax). When the queue length is less than Kmin, traffic is not 2 marked. When the queue length is greater than Kmax, all packets passing through the queue are 3 marked. When the queue length is between Kmin and Kmax, the marking probability increases 4 according to the extent of the queue length, as specified by DCQCN. 5
Notification Point (NP) 6
The NP is responsible for informing the RP that congestion has been experienced by packets of a 7 flow while traversing the network. When a data packet with an ECN flag arrives at a receiver, the 8 NP sends a CNP packet back to the RP if one has not already been sent in the past N microseconds. 9 It is possible to set N to 0 such that the NP will send a CNP for each packet with an ECN flag set. 10
As data center networks scale to larger sizes and support an increased number of simultaneous 11 flows, the average bandwidth allocated to each flow can become small. Flows experiencing 12 congestion in this environment may have their packets delayed, causing the arrival of ECN markings 13 at the NP to also be delayed. If the rate of arrival of ECN marked packets is greater than the interval 14 the RP uses to increase the rate of injection a problem may occur. The problem is that the RP will 15 begin increasing the rate of injection when it should decrease the rate since the flow is congested 16 and the missing CNP messages have simply been delayed. In this case, the end-to-end congestion 17 control loop is not functioning correctly. 18
The impact of end-to-end congestion control loop failure in a lossless network can lead to 19 congestion spreading. The unwanted congestion causes an increase PFC messages and an increase 20 in the amount of time links are paused. These PFC messages further delay the propagation of ECN 21 marked packets and only make the problem worse. In this scenario, the combination of PFC and 22 ECN become ineffective. 23
One possible solution to this problem is for the network to intelligently supplement the CNP packets 24 sent by the NP. The intelligence involves considering the congestion level at the egress port, the 25 interval of the received ECN marked packets, and the interval of the DCQCN rate increase by the RP. 26 After receiving an ECN marked packet, the CP keeps track of the frequency of received ECN marked 27 packets as well as the packet sequence number for a congested flow. When the CP egress queue is 28 congested and the received flow has experienced congestion further upstream, the CP may 29 proactively supplement the CNP depending upon the rate of received ECN marked packets and the 30 interval of the DCQCN rate increase at the RP. The CP is aware that ECN marked packets are delay 31
Figure 30 – Intelligent Supplemental CNP
Original CNP packet
Supplementary CNP packet
Rate increase interval

Copyright © 2021 IEEE. All rights reserved.
Draft Nendica Report 1-21-0004-01-ICne-draft-dcn-report
32 IEEE SA Industry connections
and that subsequent CNP packets from the NP will be further delayed, so the supplemental CNP 1 messages prevent the end-to-end congestion control loop failure. The supplemental CNP operation 2 is performed only when the CP egress queue is severely congested, thus latency and throughput are 3 not affected when DCQCN is operating in a normal non-congested state. The solution is shown in 4 Figure 30. 5
ODCC tested the enhanced congestion control mechanism and the effect is beneficial [30]. 6 According to the test results, performance is improved by more than 30% (TCP:RoCE = 9:1 scenario). 7
Addressing configuration complexity of congestion control algorithms 8
With thousands of switches and tens of thousands of ports to configure, network operators need 9 automated solutions to properly configure the parameters responsible for managing congestion 10 control in the data center network. The Data Center Exchange Protocol (DCBX) defined by IEEE 11 802.1 made great strides in simplifying some of the configuration and error detection, however, 12 more is needed. Automated solutions for setting and adapting switch buffer thresholds are needed. 13
Buffer optimization to reduce the complexity of PFC headroom configuration 14
The key to successful PFC XOFF threshold setting is assuring there is enough headroom to absorb 15 the in-flight data once the pause frame has been issued. There is a natural delay between the time 16 when the pause frame can be sent, and the sender stops transmitting data. The headroom must 17 provide enough buffer to receive data during this delay, but the calculation for the amount of 18 memory needed can be quite complex. Annex N of IEEE Std 802.1Q-2018 [18] provides the technical 19 details of this calculation. Many of the components of the delay are internal to the switch 20 implementations and remain relatively static. For example, interface and higher-layer delay do not 21 vary for a particular configuration and implementation. These static components of delay can be 22 communicated between peers on the network, but currently there is no standard protocol that 23 allows this. The propagation delay for the medium is dependent upon the transmission speed and 24 the length of the cable. To accurately obtain this component of delay a measurement is required. 25
The Time Sensitive Networking (TSN) Task Group of the IEEE 802.1 Working Group has defined IEEE 26 Std 802.1AS-2020 Timing and Synchronization for Time-Sensitive Application [31]. A small subset 27 of this specification, along with optional time-stamping support in IEEE Std 802.3 can be used to 28 measure cable delay between two peers on a point-to-point link. IEEE Std 802.1AS, however, 29 targets time-sensitive applications in constrained environments such as audio/visual, industrial, and 30 automotive networks. Its primary focus is to enable a Precision Time Protocol (PTP) used to 31 synchronize clocks throughout the computer network. While a fine-grained synchronized clock 32 could be valuable in a data center, the burden for supporting the complete set of IEEE Std 802.1AS 33 functions in data center switching silicon could be onerous. The delay measurement facilities of IEEE 34 Std 802.1AS, on the other hand, are useful in the data center to assist in the auto-configuration of 35 PFC thresholds. Having the ability to discover and communicate this capability between peers, 36 along with other DCBX attributes, would be necessary for full automation of the configuration 37 settings. 38
39
40

Copyright © 2021 IEEE. All rights reserved.
Draft Nendica Report 1-21-0004-01-ICne-draft-dcn-report
33 IEEE SA Industry connections
Intelligent ECN threshold optimization 1
The ECN threshold determines how aggressively a switch will indicate that packets are experiencing 2 congestion and subsequently how frequently the sending station may need to adjust transmission 3 rate. The optimal threshold setting depends on the current state of the network and the types of 4 communication flows that are competing for common resources. As previously discussed, a low 5 threshold setting can benefit latency-sensitive smaller flows and a high threshold setting can have 6 better performance for throughput-sensitive larger traffic flows. The mix of these flows and their 7 communication patterns is constantly changing but has been shown to be predictable using 8 machine learning techniques that model application traffic behavior [32] [33] [34]. A machine 9 learning model that predicts data center network traffic patterns could be used to dynamically 10 adjust ECN thresholds to optimize the trade-off between low-latency and high-throughput. The 11 unfair sharing of the dynamic pool of memory in the smart buffering scheme can also be address by 12 dynamically adjusting the ECN threshold differently for TCP and RoCE traffic. 13
To train a model of network traffic patterns in the data center an AI/ML system needs an abundance 14 of real-time data from the network. The data acquisition system needs to capture the temporal 15 relationships between network devices across the data center at large scale. Traditional network 16 monitoring systems based on SNMP and/or NetConf use polling to “pull” data from the devices. 17 This approach has scaling issues, increases network traffic and makes it more difficult to correlate 18 the collected data. What is needed is a telemetry stream of essential parameters flowing directly 19 from the network devices. Telemetry is a network monitoring technology developed to collect 20 performance data quickly from physical or virtual devices. Telemetry differs from traditional 21 network monitoring technologies as it enables network devices to “push” high-precision 22 performance data to a data repository in real time and at high speeds. This improves the utilization 23 of device and network resources during data collection. 24
Using the telemetry stream of data from network devices, an AI/ML system can build a model that 25 monitors the congestion status of all queues on the entire network. The stream of parameters can 26 be used to train and retrain the network model, allowing inference engines on the network devices 27 to predict changes in the data center environment and self-adjust their ECN threshold. Inputs to the 28 model can extend well beyond the existing counters obtained by traditional network monitoring 29 systems. Essential input parameters might include: 30
• A snapshot of the incast ratio (N:1) at an egress port 31
• The mix of mice and elephants flows at an ingress port 32
• The rate change in switch buffer occupancy 33
Other more traditional network metrics might include: 34
• Port-level information 35 o Sent and received bytes 36 o Sent and received packets 37 o Discarded packets in the transmit and receive directions 38 o Received unicast packets, multicast packets, and broadcast packets 39 o Sent unicast packets, multicast packets, and broadcast packets 40 o Sent and received error packets 41 o Ingress port bandwidth usage and egress port bandwidth usage 42 o ECN packets 43
Copyright © 2021 IEEE. All rights reserved.
Draft Nendica Report 1-21-0004-01-ICne-draft-dcn-report
34 IEEE SA Industry connections
• Queue-level information 1 o Egress queue buffer utilization 2 o Headroom buffer utilization 3 o Received PFC frames 4 o Sent PFC frames 5
Another type of telemetry, known as in-band telemetry, provides real-time information about an 6 individual packet’s experience as it traverses the network. The information is collected and 7 embedded into the packet headers by the switch data plane without involving the control plane. 8 The amount of information collected is more limited than traditional telemetry because it must be 9 included with the contents of the original data packet, which has a finite size. However, the 10 information within the packet is directly related to the network state that the packet observed 11 during its existence within the network. Each hop along the path can be instructed to insert local 12 data representing the switch hop’s state. Essential information might contain: 13
• Ingress and egress port numbers 14
• Local timestamps at ingress and egress 15
• Egress link utilization 16
• Egress queue buffer utilization 17
An AI model that takes real-time telemetry input from the local device can predict the adjustments 18 needed to the ECN threshold for the desired balance between low-latency and high-throughput. 19 The in-band telemetry signals can be examined with an objective of rapidly communicating 20 appropriate congestion signals to the sending sources thus avoiding packet loss and long tail latency 21 with flow completion times. 22
Standardization Considerations 23
24
Two important standards development organizations for the future technologies discussed above 25 are the IEEE 802 LAN/MAN Standards Committee and the Internet Engineering Task Force (IETF). 26
The IEEE 802 LAN/MAN Standards Committee develops and maintains networking standards and 27 recommended practices for local, metropolitan, and other area networks, using an open and 28 accredited process, and advocates them on a global basis. The most widely used and relevant 29 standards to this report are for Ethernet, Bridging, Virtual Bridged LANs and Time Sensitive 30 Networking. The IEEE 802.1 Working Group provides the focus for Bridging, Virtual Bridged LANs 31 and Time Sensitive Networking. 32
The Internet Engineering Task Force (IETF) is the premier Internet standards body, developing open 33 standards through open processes. The IETF is a large open international community of network 34 designers, operators, vendors, and researchers concerned with the evolution of the Internet 35 architecture and the smooth operation of the Internet. The technical work of the IETF is done in 36 Working Groups, which are organized by topic into several Areas. The most relevant IETF Areas for 37 the future technologies discussed above are likely the Internet Area (int), the Routing Area (rgt) and 38
6

Copyright © 2021 IEEE. All rights reserved.
Draft Nendica Report 1-21-0004-01-ICne-draft-dcn-report
35 IEEE SA Industry connections
the Transport Area (tsv). A parallel organization to the IETF is the Internet Research Task Force (IRTF) 1 which focuses on longer term research issues related to the Internet. The IRTF is comprised of 2 several focused and long-term Research Groups, of which the most relevant for this report are the 3 Internet Congestion Control Research Group (iccrg) and the Computing in the Network Research 4 Group (coinrg). 5
The IEEE 802 and IETF/IRTF have a long history of working together on developing inter-related 6 standards and technology. A standing coordination function between the Internet Architecture 7 Board (IAB) of the IETF and the leadership of the IEEE 802 Working Groups is currently place [35]. 8 Traditionally these two organizations were aligned by layers of the ISO stack, where IEEE 802 9 focused on layer 2 and IETF on layer 3 and above. The lines have blurred over the years, but the 10 two organizations have continued to work together, sharing information, and developing unique 11 and valuable standards. 12
Transport protocols are typically the domain of the IETF, however providing signals from the 13 network could be a result of specifications from IEEE 802.1. A new hybrid transport that optimizes 14 the tradeoff between low latency and high throughput could likely be investigated in the IRTF’s 15 Internet Congestion Control Research Group (iccrg). A proposed standard from this research would 16 most likley be developed by the IETF’s Transport Area (tsv). The key to success for the hybrid 17 transport is knowning how to best estimate the amount of unscheduled traffic for the channel and 18 how to rate control the senders in an incast scenario. Congestion signals and resource status along 19 the communication path could be provided by the network switches themselves. In-band telemetry 20 or enhanced ECN signaling by the network switches could provide the needed information and 21 represents an opportunity for specification by the IEEE 802.1 Working Group. 22
PFC deadlock prevention requires an awareness of the network topology and an ability to break a 23 CBD caused by re-routed flows. P802.1Qcz Congestion Isolation has specified a mechanism using 24 LLDP to automatically recognize the level of a switch within the topology as well as the orientation 25 of each port (e.g. uplink, downlink, crosslink). A missing specification is how to recognize flows that 26 are at risk of creating a CBD and how mitigate the CBD. The mechanism specified by P802.1Qcz to 27 adjust the priority of a congesting flow could be used to adjust the priority of a flow at risk of 28 creating a CBD. Further specificion of how to use these mechanisms for PFC deadlock prevention 29 could be done by the IEEE 802.1 WG. 30
Network supplemented CNPs, discussed above, augment the DCQCN protocol which currently has 31 no formal specification. Since DCQCN works in conjunction with RoCEv2, the Infiniband Trade 32 Association (IBTA) would be the natural standards organization to complete these enhancements. 33 The general idea of network supplemented CNPs could also be applied to a new IETF hybrid 34 transport protocol and most likely would be investigated by ICCRG and TSVWG. A third alternative 35 is to consider updating the mechanism defined by IEEE Std 802.1Q-2018 in Clause 30 through Clause 36 32 – Congestion Notification. To make Congestion Notification relevant in today’s modern data 37 centers the Congestion Notification Messages (CNM) would need to be Layer-3 and routable. 38
Automatically setting the PFC XON/XOFF thresholds requires an accurate measurement of the 39 delays between two ends of a link in the data center. An adaptive PFC headroom algorithm could 40 be defined by the IEEE 802.1 Working Group using or augmenting the facilities already defined by 41 IEEE Std 802.3 for timestamping and IEEE Std 802.1AS for path delay measurements. A solution for 42 the data center is needed to reduce the overhead of lossless mode configuration and the associated 43

Copyright © 2021 IEEE. All rights reserved.
Draft Nendica Report 1-21-0004-01-ICne-draft-dcn-report
36 IEEE SA Industry connections
chance of error. A mechanism to communicate this capability between peers and an update to the 1 current description of how to manually calculate headroom are excellent candidates for an 2 amendment to IEEE Std 802.1Q. 3
Adjusting the ECN threshold automatically is dependent on recognizing and prediciting the current 4 congestive state of the data center network. A rapid response to changing congestion status is 5 needed, but traditional network management approaches can not react quickly enough. Network 6 devices that are armed with an AI model to assist in this prediction rely on the model being well 7 trained from an accurate set of real-time data. Network telemetry can provide a new view of the 8 network state, whether that telemetry data is in-band or streamed from the network devices 9 themselves. Standards for telemetry at Layer-3 and above have historically been specified by the 10 IETF. Currently the IP Performance Measurement (ippm) group within the IETF TSV area is defining 11 In-situ Operations, Administration, and Maintenance (IOAM) [36] that provides in-band telemetry 12 at Layer-3. There are also other related and competing specifications for Layer-3 in-band telemetry 13 [37] [38]. In some environments a Layer-2 solution working in conjunction with Layer-3 may be 14 more appropriate and require standard specifications to support interoperatbility. This in-band 15 telemetry could be defined by the IEEE 802.1 Working Group. The Operations and Management 16 Area Working Group (opsawg) in the IETF Operations and Management area (ops) is working on a 17 framework for Network Telemetry [39]. This framework is looking at various techniques for remote 18 data collection, correlation, and consumption. For the framework to be successful it is necessary to 19 specify the information that can be extracted from the network. Supporting specifications by Layer-20 2 devices will be needed from the IEEE 802 and specifications for Layer-3 and above devices will be 21 needed by the IETF. 22
Conclusion 23
24
Data center networks must continue to scale and innovate with new technologies to keep pace with 25 the evolving needs of high-speed computing and storage used for AI and Machine Learning 26 applications. This paper expanded upon the previous report [2] with the exploration of technical 27 challenges and potential new solutions for today’s cloud scale high performance computing data 28 centers. We discussed new hybrid transport protocols that better balance the needs of both high 29 throughput and low latency communications for AI and Machine Learning. We described a solution 30 for PFC deadlock prevention using a topology recognition algorithm that leverages the existing and 31 widely deployed Link Layer Discovery Protocol (LLDP). We explored ways to reduce the feedback 32 cycle for congestion notification messages by allows the switches to supplement congestion 33 signaling. We also described approaches to reduce the complexity of switch buffer threshold 34 configuration using automated protocols and artificial intelligence models developed from advance 35 telemetry systems. Together these innovations, with the commitment to openness and 36 standardization, can advance the use of Ethernet as the premier network fabric for modern cloud 37 scale high performance data centers. 38
39
7
Copyright © 2021 IEEE. All rights reserved.
Draft Nendica Report 1-21-0004-01-ICne-draft-dcn-report
37 IEEE SA Industry connections
Citations 1
2
[1] IEEE, "Nendica Work Item: Data Center Networks," [Online]. Available: https://1.ieee802.org/nendica-DCN/. [Accessed 14 05 2020].
[2] IEEE, "IEEE 802 Nendica Report: The Lossless Network for Data Centers," 17 8 2018. [Online]. Available: https://xploreqa.ieee.org/servlet/opac?punumber=8462817. [Accessed 13 05 2020].
[3] Orange, "Finding the competitive edge with digital transformation," 03 June 2015. [Online]. Available: https://www.orange-business.com/en/magazine/finding-the-competitive-edge-with-digital-transformation. [Accessed 1 09 2020].
[4] J. Wiles, "Mobilize Every Function in the Organization for Digitalization," Gartner, 03 December 2018. [Online]. Available: https://www.gartner.com/smarterwithgartner/mobilize-every-function-in-the-organization-for-digitalization/. [Accessed 10 June 2020].
[5] Huawei, "Huawei Predicts 10 Megatrends for 2025," Huawei, 08 August 2019. [Online]. Available: https://www.huawei.com/en/press-events/news/2019/8/huawei-predicts-10-megatrends-2025. [Accessed 10 June 2020].
[6] J. Handy and T. Coughlin, "Survey: Users Share Their Storage," 12 2014. [Online]. Available: https://www.snia.org/sites/default/files/SNIA%20IOPS%20Survey%20White%20Paper.pdf. [Accessed 14 05 2020].
[7] Huawei, "AI, This Is the Intelligent and Lossless Data Center Network You Want!," 13 March 2019. [Online]. Available: https://www.cio.com/article/3347337/ai-this-is-the-intelligent-and-lossless-data-center-network-you-want.html. [Accessed 14 05 2020].
[8] E. K. Karuppiah, "Real World Problem Simplification Using Deep Learning / AI," 2 November 2017. [Online]. Available: https://www.fujitsu.com/sg/Images/8.3.2%20FAC2017Track3_EttikanKaruppiah_RealWorldProblemSimplificationUsingDeepLearningAI%20.pdf. [Accessed 14 05 2020].
[9] O. Cardona, "Towards Hyperscale High Performance Computing with RDMA," 12 June 2019. [Online]. Available: https://pc.nanog.org/static/published/meetings/NANOG76/1999/20190612_Cardona_Towards_Hyperscale_High_v1.pdf. [Accessed 14 05 2020].
[10] T. P. Morgan, "Machine Learning Gets An Infiniband Boost With Caffe2," 19 April 2017. [Online]. Available: https://www.nextplatform.com/2017/04/19/machine-learning-gets-infiniband-boost-caffe2/. [Accessed 14 05 2020].
8
Copyright © 2021 IEEE. All rights reserved.
Draft Nendica Report 1-21-0004-01-ICne-draft-dcn-report
38 IEEE SA Industry connections
[11] Z. Jai, Y. Kwon, G. Shipman, P. McCormick, M. Erez and A. Aiken, "A distributed multi-GPU system for fast graph processing," in VLDB Endownment, 2017.
[12] Wikipedia, "IEEE 802.3," 5 June 2020. [Online]. Available: https://en.wikipedia.org/wiki/IEEE_802.3. [Accessed 22 July 2020].
[13] K. Rupp, "42 Years of Microprocessor Trend Data," February 2018. [Online]. Available: https://www.karlrupp.net/2018/02/42-years-of-microprocessor-trend-data/. [Accessed 22 July 2020].
[14] The Linux Foundation, "Open vSwitch," 2016. [Online]. Available: https://www.openvswitch.org/. [Accessed 23 July 2020].
[15] Y. Li, R. Miao, H. H. Liu, Y. Zhuang, F. Feng, L. Tang, Z. Cao, M. Zhang, F. Kelly, M. Alizadeh and M. Yu, "HPCC: high precision congestion control," in Proceedings of the ACM Special Interest Group on Data Communication (SIGCOMM ’19), New York, NY, USA, 2019.
[16] P. Goyal, P. Shah, N. Sharma, M. Alizadeh and T. Anderson, "Backpressure Flow Control," in Proceedings of the 2019 Workshop on Buffer Sizing (BS '19), New York, NY, USA, 2019.
[17] C. Guo, H. Wu, Z. Deng, G. Soni, J. Ye, J. Padhye and M. Lipshteyn, "RDMA over Commodity Ethernet at Scale," in In Proceedings of the 2016 ACM SIGCOMM Conference (SIGCOMM ’16), 2016.
[18] IEEE, IEEE Std 802.1Q-2018, IEEE Standard for Local and Metropolitan Area Networks — Bridges and Bridged Networks, IEEE Computer Society, 2018.
[19] Y. Zhu, H. Eran, D. Firestone, C. L. M. Guo, Y. Liron, J. Padhye, S. Raindel, M. H. Yahia and M. Zhang, "Congestion Control for Large-Scale RDMA Deployments," in Proceedings of the 2015 ACM Conference on Special Interest Group on Data Communication (SIGCOMM '15), London, United Kingdom, 2015.
[20] M. Karok, J. Golestani and D. Lee, "Prevention of deadlocks and livelocks in lossless backpressured packet networks," IEEE/ACM Transactions on Networking, vol. 11, no. 6, p. 11, 2003.
[21] S. Hu, Y. Zhu, P. Cheng, C. Guo, K. Yan, J. Padhye and K. Chen, "Deadlocks in datacenter networks: Why do they form, and how to avoid them," in Proceedings of the 15th ACM Workshop on Hot Topics in Networks, 2016.
[22] S. Hu, Y. Zhu, P. Cheng, C. Guo, K. Tan, J. Padhye and K. Chen, "Tagger: Practical PFC Deadlock Prevention in Data Center Networks," in In Proceedings of the 13th International Conference on emerging Networking EXperiments and Technologies (CoNEXT ’17), 2017.
[23] S. Das and R. Sankar, "Broadcom Smart-Buffer Technology in Data Center Switches for Cost-Effective Performance Scaling of Cloud Applications," April 2012. [Online]. Available:

Copyright © 2021 IEEE. All rights reserved.
Draft Nendica Report 1-21-0004-01-ICne-draft-dcn-report
39 IEEE SA Industry connections
https://docs.broadcom.com/docs-and-downloads/collateral/etp/SBT-ETP100.pdf. [Accessed 24 June 2020].
[24] ODCC, "ODCC lossless network test report (final draft)," 02 September 2020. [Online]. Available: http://www.odcc.org.cn/auth/v-1300974311558307841.html. [Accessed 03 09 2020].
[25] Cisco Systems, Inc, "Priority Flow Control: Build Reliable Layer 2 Infrastructure," 2009. [Online]. Available: https://www.cisco.com/c/en/us/products/collateral/switches/nexus-7000-series-switches/white_paper_c11-542809.pdf. [Accessed 15 12 2020].
[26] M. Alizadeh, A. Greenberg, D. Maltz, J. Padhye, P. Patel, B. Prabhakar, S. Sengupta and M. Sridharan, "Data center TCP (DCTCP)," in ACM SIGCOMM 2010 conference (SIGCOMM '10), New York, 2010.
[27] I. Cho, K. Jang and D. Han, "Credit-Scheduled Delay-Bounded Congestion Control for Datacenters," in Proceedings of the Conference of the ACM Special Interest Group on Data Communication (SIGCOMM '17), New York, 2017.
[28] M. Handley, C. Raiciu, A. Agache, A. Voinescu, A. W. A. G. Moore and M. Wojcik, "Re-architecting datacenter networks and stacks for low latency and high performance," in SIGCOMM '17, Los Angeles, 2017.
[29] B. Montazeri, Y. Li, M. Alizadeh and J. Ousterhout, "Homa: A Receiver-Driven Low-Latency Transport Protocol Using Network Priorities," 26 03 2018. [Online]. Available: https://arxiv.org/abs/1803.09615v1. [Accessed 22 05 2018].
[30] ODCC, "Lossless Network Test Specifications," 03 September 2019. [Online]. Available: http://www.odcc.org.cn/download/p-1169553273830920194.html. [Accessed 01 09 2020].
[31] IEEE, IEEE Std 802.1AS-2020, IEEE Standard for Local and Metropolitan Area Networks — Timing and Synchronization for Time-Sensitive Applications, IEEE Computer Society, 2020.
[32] L. Nie, D. Jiang, L. Guo, S. Yu and H. Song, "Traffic Matrix Prediction and Estimation Based on Deep Learning for Data Center Networks," in 2016 IEEE Globecom Workshops (GC Wkshps), Washington, DC, 2016.
[33] X. Cao, Y. Zhong, Y. Zhou, J. Wang, C. Zhu and W. Zhang, "Interactive Temporal Recurrent Convolution Network for Traffic Prediction in Data Centers," IEEE Access, vol. 6, pp. 5276-5289, 2018.
[34] A. Mozo, B. Ordozgoiti and S. Gomez-Canaval, "Forecasting short-term data center network traffic load with convolutional neural networks," PLoS ONE, vol. 13(2), no. e0191939. https://doi.org/10.1371/journal.pone.0191939, 2018.

Copyright © 2021 IEEE. All rights reserved.
Draft Nendica Report 1-21-0004-01-ICne-draft-dcn-report
40 IEEE SA Industry connections
[35] IETF, "IEEE 802 and IETF Coordination Guide," 6 7 2017. [Online]. Available: https://trac.ietf.org/trac/iesg/wiki/IEEE802andIETFCoordinationGuide. [Accessed 1 2 2018].
[36] IETF, "Data Fields for In-situ OAM," 17 12 2020. [Online]. Available: https://datatracker.ietf.org/doc/draft-ietf-ippm-ioam-data/. [Accessed 06 01 2021].
[37] Alibaba; Arista; Barefoot Networks; Dell; Intel; Marvell; Netronome; VMware, "In-band Network Telemetry (INT) Dataplane Specification," 20 04 2018. [Online]. Available: https://github.com/p4lang/p4-applications/blob/e5d0c4f4c9fe548e83ad91adbd38847c7dce6cfe/docs/INT.pdf. [Accessed 06 01 2021].
[38] J. Kumar, S. Anubolu, J. Lemon, R. Manur, H. Holbrook, A. Ghanwani, D. Cai, H. Ou, Y. Li and X. Wang, "Inband Flow Analyzer," 24 04 2020. [Online]. Available: https://tools.ietf.org/html/draft-kumar-ippm-ifa-02. [Accessed 06 01 2021].
[39] IETF, "Network Telemetry Framework," 17 12 2020. [Online]. Available: https://datatracker.ietf.org/doc/draft-ietf-opsawg-ntf/. [Accessed 06 01 2021].
1
2