draft final report of fracking inquiry climate action
TRANSCRIPT

Climate Action Darwin Response to Draft Final Report of Fracking Inquiry
February 4 2018 By Grusha Leeman, Charlie Ward and others
Firstly, thank you once again for taking the time to consider the opinions of the local community group Climate Action Darwin (CAD), representing thousands of Territorians.
In this, our final written submission to the Inquiry, CAD has devoted its energy to responding specifically to Chapter 9 of the Draft Final Report, on Greenhouse Gas Emissions. Evidently this is CAD’s area of special interest and expertise and we assume that others will respond adequately to the other parts of the report.
We are pleased that the Panel recognises that greenhouse gases are important enough to warrant a chapter of this report devoted to their management.
CAD has two aims in this critique of the Inquiry’s Draft Final Report into fracking in the NT. The first is to reiterate that the consequences of climate change are too dire to allow more fossil fuel extraction. The second is to refute the Panel’s finding that GHG emissions from unconventional shale gas extraction in the Northern Territory would total 3.3% of production, were the industry to be expanded. In this submission, we demonstrate that these emission are likely to be yet higher.
Just as the Panel used many steps to come to their conclusion, we will step through the issues as they are presented in Chapter 9.
Greenhouse gases [section 9.1.2] CAD is pleased that the Panel’s Draft Final Report contains a review of key GHG findings, but it is regrettable that the most up-to-date data has been omitted. For example, atmospheric methane reached a new high of approximately 1,853 parts per billion (ppb) in 2016, 257% of the pre-industrial level, yet your 1
report states that the increase has only been 154%. Similarly, carbon dioxide concentrations are currently nearly 408ppm (12th Jan 2018) and the 400ppm milestone was first reported in May 2013, although it was 2 3
not the average globally until 2015. We can but hope that although it is suggested in the report that we are still at 399 ppm, the other information in the report is more current.
CAD takes issue with the Panel’s finding that: “only a small proportion of annual methane emissions from all sources (natural and anthropogenic) remain in the atmosphere and contribute to the annual warming effect”. Besides the World Meteorological Organization describing methane as “the second most 4
important long-lived greenhouse gas” over a 20 year period, methane is considered to be 86 times more powerful than carbon dioxide. Although methane’s lifespan is around 12 years, it breaks down into carbon dioxide and water, both greenhouse gases. Methane doesn’t disappear: its effect on the climate is ensured upon its release.
Global methane levels are rising very quickly: see Figure 1.
1 https://public.wmo.int/en/media/press-release/greenhouse-gas-concentrations-surge-new-record 2 https://www.co2.earth/ 3 https://www.theguardian.com/environment/2013/may/10/carbon-dioxide-highest-level-greenhouse-gas 4 https://public.wmo.int/en/media/press-release/greenhouse-gas-concentrations-surge-new-record
1
Climate Action Darwin Submission #650

Figure 1: Global methane levels are not tapering off. Source: https://thinkprogress.org/nasa-study-fracking-global-warming-0fa0c5b5f5c7/
Global Warming Potential The IPCC's Fifth Assessment Report, published in 2014, prescribed the 100-year methane global warming potential (GWP) of 28–36 and the 20-year GWP of 84–87. However, the IPCC's Fourth Assessment Report, had the GWPs for methane at 21 for 100 years and 56 for 20 years.
The use of the 20-year global warming potential (GWP20) allows for a much needed emphasis on the near term impacts of a gas, which we must now focus on. We have dithered for too long. Lowering methane emissions has a greater impact on keeping our global temperature in check in this short time frame rather than the longer term.
Too often policymakers ignore methane's warming potential over 20 years (GWP20). When assembling a nation's emissions inventory, this has the effect of stretching out methane's warming impacts over a century, making the gas appear more benign than it is.5
Much of the data quoted by the Panel, for instance Figure 9.1, Table 9.1 (footnote 67), Table 9.2, and the greenhouse inventory figures from 2015 explicitly state they use outdated the hundred year GWP of only 25; therefore, they under-represent the emissions that are actually expected. Indeed, this could partially explain why the amount of Australian data is so much smaller than found elsewhere (page 200).
Since the GWP of methane has drastically increased over successive IPCC Reports, it is not inconceivable that the 6th IPCC Report would again increase the methane GWP.
CAD Recommendation 1: That the panel reconfigures its calculations with the GWP.20 6
Key Risks [section 9.2] CAD commends the Panel for considering the key climate-related risks of greenhouse gases (GHG). However, the Panel chooses to limit the scope to the far horizon: “and the consequential impact on to global climate change.” It is the Northern Territory - the jurisdiction making this important decision - and
5 https://www.scientificamerican.com/article/how-bad-of-a-greenhouse-gas-is-methane/ 6 See Explanation of CAD recommendations on page 21
2

Australia here we Australians have more ability to control our pollution than on a global scale. Probably, most things considered in the NT when compared to a global scale are insignificant. This does not make them insignificant for the NT or Australia as a whole. Climate change is demonstrably not a local problem: all emissions are locally and globally significant. It is the responsibility of decision-makers to consider the scale of increased emissions for the NT, Australia and the world.
CAD Recommendation 2: That there be consideration of the increased GHG emissions from 7
unconventional shale gas extraction in the Northern Territory for not only the Territory and Australia, but the world.
Upstream Emissions [section 9.3] Regarding upstream emissions, the Inquiry found that: “The application of available emission reduction technologies can result in typically 23% lower upstream GHG emissions and an overall 31% reduction in methane emissions …” Emphasis must be placed here on the word can. The report’s exploration of the efficacy of available emission reduction technologies is inadequate.
The recent introduction of emissions reduction tools again demonstrates just how poorly managed the unconventional gas industry has been. The Industry’s modus operandi is to avoid scrutiny and regulation. CAD has little confidence that sufficient resources would be devoted to policing it in remote NT. The regulation of the mining industry in the Northern Territory to date has been characterised by poor performance and an obvious lack of capacity. From small, short-term operations to the high-profile Ranger mine, the NT Government (NTG) has historically shown itself to be unable to effectively enforce the industry’s compliance with supposed regulatory or rehabilitation requirements. (See for example, the 2010 Montara Oil Spill and the ongoing mismanagement of the McArthur River Mine ). 8 9
The NTG doesn't have the capacity, staff power or, to date, willingness to effectively monitor many hundreds of well sites, nor the inclination to act effectively when breaches are identified. To assume otherwise is wishful thinking.
Greenhouse gas pollution produced during exploration may also be significant, though the Draft Final Report’s recognition of this is inconsistent. A study the Panel considered in Section 9.2 ignores exploration pollution, yet section 9.4 admits: “emissions that are released during the shale gas exploration stage, such as venting during flowback, can be significant and they must be minimised.” (page 197).
Regarding other sources of upstream emissions, the Draft Final Report states that: “Variability between natural gas sources can lead to substantial differences in emissions. ...the average upstream emission rate can be significantly (72%) higher.” (page 197) The draft report has not described how conditions of NT shale gas fields meet or deviate from that standard, and how much higher average emissions may in fact be.
The Panel has under-calculated migratory fugitive emissions beyond the well pad area and this remains a concerning source of GHG emissions.
CAD Recommendation 3: Examine the efficacy of the emission reduction technologies. 10
7 See Explanation of CAD recommendations on page 21 8 https://www.crikey.com.au/2010/11/25/nt-the-montara-oil-spill-and-the-regulatory-dog-that-didnt-bark/ 9 https://www.theguardian.com/environment/2017/dec/21/thousands-of-tonnes-of-dangerous-mining-waste-dumped-in-wrong-place 10 See Explanation of CAD recommendations on page 21
3

Measured methane levels [Section 9.4.1] Commendably, the Panel has considered the Melbourne Energy Institute Report “A review of current and 11
future methane emissions from Australian unconventional oil and gas production, October 2016” in which methane emissions were said to range from 0.22 to 17% of total methane production. Yet, by stating on page 197, “The high figure (17%) is not representative of emissions from gas-field operations”, it seems the findings of this important and relevant report have been quickly disregarded. 17% emissions and higher may be unusual but they have occurred and could occur again. More importantly, the MEI found many studies in which methane emissions were moderate to high: 2 to 8%, 2.3 to 7.7%, 3 to 17%, 4 to 7%, 6 to 12%, 9%, 10%, 12% of total gas production. The prevalence of such figures should not simply be ignored. Apparently, the Panel has justified its disregard for alarming levels of pollution caused by hydraulic fracturing by asserting that measurement techniques “are subject to error”. “In particular, it is difficult, if not almost impossible, to distinguish between the many sources of emissions when considering the results from ‘top-down’ investigations” (page 197). However, the many studies using a variety of measurement types cannot be disregarded. For example, a 2015 NASA study “conducted an airborne campaign... with the next-generation … 12
near-infrared and … thermal infrared imaging spectrometers to better understand the source of methane by measuring methane plumes…” They found the: “ airborne observing strategy and its ability to locate previously unknown point sources in real time provides an efficient and effective method to identify and mitigate major emissions contributors over a wide geographic area.” It has been calculated in Colorado by Pétron, Frost et al.(2012) that inventories underestimated methane emissions by "at least a factor of two and possibly by up to a factor of 4.6 times”. 13
Under-reporting and high levels of leaking methane are also seen across Canada. There is evidence both Canadian and USA governments are slowing and limiting their attempts to reign in the prolific polluters in the oil and gas industry, and the Panel has not explained how or why the situation will differ in Australia. 14
CAD concurs with Karlis Muehlenbachs of the University of Alberta who specialises in tracing stray gases from oil and gas fields, and doubts that oil and gas regulators have the gumption or the resources to do baseline atmospheric monitoring. For years, Muehlenbachs has proposed that governments mandate monitoring, through isotopic fingerprinting of methane, ethane and propane from producing wells, abandoned wells, natural seeps and water wells in order to protect groundwater prior to drilling and fracking, yet has found there is no will to fix North America’s leaky natural gas production systems. As 15
noted, NT governments have to this point also shown themselves little able to effectively regulate, monitor or rehabilitate the mining industry. Researchers from Southern Cross University used sophisticated equipment to measure methane emissions and their results were concerning . "We found... concentrations outside the gas fields were about 1.7 parts 16
per million; when we were looking inside the gas fields we found spikes up to 6.5 parts per million."
11 http://energy.unimelb.edu.au/__data/assets/pdf_file/0019/2136223/MEI-Review-of-Methane-Emissions-26-October-2016.pdf 12 http://www.pnas.org/content/113/35/9734.full 13 http://energy.unimelb.edu.au/__data/assets/pdf_file/0019/2136223/MEI-Review-of-Methane-Emissions-26-October-2016.pdf 14 http://www.resilience.org/stories/2017-05-31/canadas-methane-leakage-massively-reported-studies-find/ 15 https://thetyee.ca/News/2014/05/06/Shale-Gas-Methane-Leaks/ 16 http://www.abc.net.au/news/2017-02-28/methane-emissions-from-coal-seam-gas-climate-change/8310932
4
We wonder why acknowledgement of such evidence in missing from the report? A strong case for dismissing available top-down data has not been made.
How much methane is leaking from the coal seam gas fields in Australia? Nobody really knows.
A CSIRO study only focused on the coal seam gas well-heads, not the vast infrastructure of seams and pipelines that now spread throughout the Surat Basin in Queensland. Then, instead of completing the study or measuring leaks and locating the hotspots, GISERA's latest research is focussing on "naturally occurring emissions" of methane; perhaps that is because they failed to do baseline studies and there is lax regulation around measuring, let alone controlling, fugitive emissions.
Recognising concerns with the measuring techniques does not mean that the whole issue of migratory fugitive emissions beyond the wellpad should be ignored.
Inventory Levels [Section 9.4.2] It is disturbing the Inquiry makes only a brief reference to the reporting scheme and there is no discussion of the inadequacies of the National Greenhouse and Energy Reporting Technical Guidelines, or the problems of relying on partially old and selectively sought emission factors. “There is significant uncertainty about methane-emission estimates reported by oil and gas producers to the Australian government, and by the Australian government to the United Nations. The United Nations has requested that Australia improve its methodologies.” 17
Indeed, the Australian National Greenhouse Accounts 2017 emission factors still used the out-of-date GWP100 of 25 for methane. 18
Instead of using direct measurement Australian methane-emission, reporting of methane emissions relies significantly on assumed emissions factors. “The assumptions used to estimate methane emissions include some that are outdated, and some that lack demonstrated relevance to the Australian unconventional oil and gas industry.” The fugitive emission factors used do not distinguish between different methods of 19
obtaining gas whether they be conventional, coal seam or shale gas activities, but should because they differ; for example, the number of wells varies considerably. There is no publicly available measurement data with which to compare the assumed emission factor values.
A 2015 NASA study may explain some of the under-estimation: “To estimate methane emissions from oil and gas facilities, the Environmental Protection Agency uses a[n] ... approach that assumes a normal distribution of emissions for each process used in extraction, processing, and distribution. In reality, ... a relatively small percent of the sources in a given field may dominate the overall budget..., it suggests that mitigation of field-wide emissions... will be less costly because it only requires identifying and fixing a few emitters.” It also makes it crystal clear that the USA EPA process is inadequate. 20
A comprehensive independent audit There has as yet been no comprehensive, independently verifiable audit of gas emissions from 21
Australia's unconventional gas industry since Australian Government greenhouse-gas reporting
17 http://energy.unimelb.edu.au/__data/assets/pdf_file/0019/2136223/MEI-Review-of-Methane-Emissions-26-October-2016.pdf 18 www.environment.gov.au/system/files/resources/files/national-greenhouse-accounts-factors-july-2017.pdf 19 http://energy.unimelb.edu.au/__data/assets/pdf_file/0019/2136223/MEI-Review-of-Methane-Emissions-26-October-2016.pdf 20 http://www.pnas.org/content/113/35/9734.full#F10 21 The Melbourne Energy Institute reported this in 2016
5
requirements were established in 2009, despite significant expansion in the industry. CSIRO has also reported that, "reliable measurements on Australian oil and gas production facilities are yet to be made." 22
Even though the Draft Final Report does state that some Australian emission factors have changed, including some that have been increased, such as “the emission factors for gathering and boosting stations and for processing plants… and those for transmission and storage systems”, some have stayed the same: “the existing… emission factor is retained for pipelines...” Others have been reduced: “emission factors for well completions and well workovers... now identical to that of the US EPA … reducing the estimates for these emissions from the previous approach.” (page 199). Indeed, the Draft Final Report explains that at least some of the data that the Panel has relied upon to 23
calculate future GHG emissions are below many other credible sources, yet these sources have nonetheless been retained. Consequently, without clarification that these were the best available and most relevant data and that there has been a thorough audit, it remains impossible to trust the data. If methane emissions from unconventional oil and gas production are being significantly underreported, this could have a large impact on Australia's national greenhouse accounts. We require various top-down monitoring, ground-truthed by robust data, and a publically viewable, independently verified robust and comprehensive audit of the Australian gas reporting requirements to inform enforcement of emissions guidelines, offsets and regulatory action. It’s time for real data and not assumed figures. There should, however, also be studies and estimates made for the emissions that occur beyond the wellhead, pipelines and other facilities of the industry. The total emissions, not just a portion of them, should be considered.
CAD Recommendation 4: That there be a comprehensive audit of gas reporting requirements, to 24
inform enforcement of emissions guidelines, offsets and regulatory action.
Global Focus - [Table 9.3] The responsibility of the NT Government is completely obfuscated if potential GHG emissions from the development of unconventional gas extraction (UCG) in the NT are compared as a proportion of net global emissions as a measure of risk. As the Panel is allegedly aware, climate change is both nationally and temporally unbounded. That is to say that the impacts of GHG emissions on the atmosphere will continue to affect Northern Territory residents wherever and whenever they were released.. Many issues in the NT, whilst regionally significant, would be likely to be found insignificant on a global scale. Effectively, the Panel is saying that because the effect of the NT potential emissions from UCG extraction will be universal (felt by the all the world’s citizens and the biosphere), delayed, and a small proportion of the total effect, they are acceptable.
22 http://energy.unimelb.edu.au/__data/assets/pdf_file/0019/2136223/MEI-Review-of-Methane-Emissions-26-October-2016.pdf 23 “General leakage of methane during the shale gas production phase also remains at 0.047 t CH4/kt of processed natural gas (~0.0047%), based on the 2009 American Petroleum Institute and a (2014) CSIRO study. However, this factor is well below the value (0.073%) estimated by Littlefield et al. The CSIRO study was conducted across a limited dataset of 43 CSG wells, and the report notes that the values measured are lower than observed for the US shale gas industry; for example, they found the leak rate from Australian pneumatic devices to be 0.12 ± 0.18 g/min, while Allen et al. measure a value of 5.9 ± 2.4 g/min and the API 2009 Compendium uses 4.6 ± 0.66 g/min” (page 199). 24 See Explanation of CAD recommendations on page 21
6

If the Panel recommends that risk is assessed as a potential proportion of net global methane emissions by NTG authorities, would it not, hypothetically, recommend this approach to any and all instrumentalities considering introducing this industry? Once many jurisdictions like the NT decided to introduce UCG extraction on the basis proposed by the Panel, then the faulty basis of this reasoning would be revealed. A ‘small proportion’ of emissions could become the majority or the entirety of global emissions. However, it is completely contrary to compare the NT emissions on a global stage whilst omitting the portion of the emissions that are the greatest part - the 80% anticipated for export and combustion. Then there’s the losses whilst converting the LNG, transportation losses and possibly pipe losses at the destination as well. The Panel cannot have it both ways.
Report Recommendation 9.1 CAD welcomes efforts being made to swiftly introduce some controls, but questions why the standards of the USA were chosen. Was there any assessment as to whether these are the best available performance standards? The brevity of the timeline for responding to this Report makes full understanding of the ramifications of the USA EPA New Source Performance Standards of 2012 and 2016 difficult. In the 2016 Norton Rose Fulbright article “US EPA issues climate change regulations for oil and gas” where they were explaining 25
the details of new changes to fugitive emissions, there were some disturbing statements. 26
1. Firstly, suggesting there were no previous limits: “Adds fugitive emission requirements to production well sites and compressor stations by requiring periodic... surveys and the repair of identified fugitive emissions sources.
2. Secondly, their frequency is poor: “Inspections would be required on a semiannual basis for well sites and a quarterly basis for compressor stations.”
3. Thirdly, although “leaks would be visually confirmed with an optical gas imaging device, but the repair threshold is stringent (500 ppm),” there is no mention over what period.
4. Fourthly, why would inadequate practices be invited by excluding “well sites with only one or more wellheads.”
5. Fifthly, allowing “repairs may be delayed for up to two years if it is technically infeasible to complete the repair within 30 days,” invites excuses to excessively extend repairs to cut costs.
6. And lastly, there is this aspect of the plan: “The monitoring plan must cover all affected facilities within an area defined by the owner or operator.” Surely leaving the owners to define the plan will result in a plan that is as minimal and lenient as possible. Cost minimizing behavior is applauded. In addition, as remains the culture, there is a blindness to look beyond the wellpads. Ignoring the flaming taps and bubbling rivers in a multitude of other locations where the gas seeps out following fracking makes a farce of the whole monitoring regime. This is why the owners and operators should not be the ones judging what is to be monitored.
A very quick perusal of regulations from the USA shows they clearly do not have a level of practice that should be accepted in the Northern Territory. Surely the emphasis for the Northern Territory should be to avoid the obvious deficiencies in practice elsewhere and exceed the standards adopted in the USA. What do they do in Europe?
25 http://www.nortonrosefulbright.com/knowledge/publications/139552/us-epa-issues-climate-change-regulations-for-oil-and-gas 26 On May 12, 2016, the USA Environmental Protection Agency issued New Source Performance Standard (“NSPS”) Subpart OOOOa, the agency’s climate change regulations for methane and volatile organic compound (“VOC”) emissions for the oil and natural gas sector.
7
CAD Recommendation 5: Assess and adopt of the world best performance standards. 27
Baseline monitoring [section 9.5] There still seems to be little comprehension that exploration - i.e. drilling into gas contained in the ground - could increase the levels of methane found. When so-called pre-production baseline monitoring finally commences, as the Report states meekly: “Baseline monitoring of methane levels in the soil and atmosphere in the vicinity of any new onshore shale gas development needs to be undertaken before any natural gas production commences.” (page 203) This is very important. Onshore gas has much higher exploration burden than many other resource exploitation activities. It is time to cease the evasion of regulation for the exploration and pre-production of UGF. Baseline data must preclude any further activity. Still, it is stated as if it is a good thing: “The Panel notes that Santos is also planning a baseline methane monitoring assessment in the Beetaloo Sub-basin” (page 203). Yet it is way too late for baseline data, as they have been drilling there for decades with over half dozen recent drills to release methane and have recently fractured at least one of them . Real baseline data must be conducted before drilling has been 28
conducted. Any monitoring done now must be cognisant of the fact that background levels are highly likely to be elevated due to lax exploration practices and poor regulatory processes. It is possible this is an oversight by the Panel as several pages later (on page 207), it is encouraging to see that the Draft Final Report states: “baseline monitoring should be conducted at least a year prior to production (and desirably exploration)…” Please ensure this is included in the section on baseline monitoring.
Report Recommendation 9.3 A bit further on in the Report is Recommendation 9.3, it is evident that the Panel does not really recognise rigorous baseline monitoring as an important activity. It would make much more sense for baseline monitoring of methane concentrations be undertaken for at least one year prior to the commencement of shale gas exploration, not production. To avoid any uncertainty, we'd say "before any further activity". According to Southern Cross University researcher Dr Douglas Tait, "What you need to do is get into those areas before you start development and before you start to alter the hydrology and geology of an area." 29
CAD Recommendation 6: That thorough baseline studies be conducted before any drilling or any 30
further activity.
Migratory Emissions Migratory emissions are fugitive emissions that occur beyond the well-pad. Migratory emissions are largely ignored in the Inquiry’s Draft Final Report, though many other reports suggest they may be significant.
27 See Explanation of CAD recommendations on page 21 28 http://www.paltar.com.au/AGES2017_DC.pdf 29 http://www.abc.net.au/news/2017-02-28/methane-emissions-from-coal-seam-gas-climate-change/8310932 30 See Explanation of CAD recommendations on page 21
8
“Poor well integrity can potentially lead to the migration of gas into surrounding aquifers, wells, waterbores and the surface. Fugitive methane emissions can also occur during other stages of gas production such as storage, piping and treatment.” 31
“There is ... the possibility that depressurisation... as a result of dewatering could result in gas migrating through existing geological faults, water bores, abandoned exploration wells or even the soil. This potentially significant source of methane leakage that is not covered at all under the National Inventory Report, but can be measured through atmospheric testing and modelling.” 32
Clearly these emissions must be studied and estimates made of their flow and efforts made to avoid and repair them. CAD questions the industry’s and the NTG’s interest in, or ability, to do this.
Reports of fracked, flammable water are true The tap water shown burning in the American documentary film Gasland (2010) had been clean drinking water and was contaminated by fracking chemicals. Yet the Draft Report states: “These background methane levels mean that images such as those shown in the film Gasland, where the water from a tap is ignited, need to be treated with caution before attributing the source to unconventional gas operations.” (page 203) The reservoir in question was shown to be contaminated with fracking fluids in 2010. A USA 33
federal report by the Agency for Toxic Substances and Disease Registry (ATSDR), part of the Center for Disease Control (CDC), “lists 10 contaminants, including arsenic, lithium and 4-chlorophenyl phenyl ether, that are “chemicals of health concern,” at the levels found in Carter Road wells. The report also, found 34
that five homes there were at “immediate risk of fire or explosion” because of methane in their water, and that another dozen showed lower, but still unhealthy, elevated levels of methane, metals, salts and total dissolved solids. The report found the water was not safe to drink: “some of the chemicals in the private water wells at this site at levels high enough to affect health (27 private water wells), pose a physical hazard (17 private water wells) or affect general water quality so that it may be unsuitable for drinking.” 35
Reports of fracking causing bubbling rivers are true If the bubbling of methane from the Condamine River in Queensland were a natural phenomenon it would have been more widely known, a tourist site perhaps; and the presence of nearby fracking should surely be considered as a likely cause. To suggest it could well be merely due to “changes in river water flows or natural changes in groundwater flows” is clearly grasping for a non-fracking answer that is just not plausible. Whilst fracking was occurring nearby, the amount of methane released through bubbling in the Condamine River quadrupled between 2013 and 2016. Melbourne University's chair of geology Mike Sandiford said : "CSG is one of the actors and it's an actor that has increased activity quite recently, so 36
there is certainly a correlation."
What is concerning is that this could happen in the NT if we allow fracking to proceed.
Note also these fugitive emissions could well be massive and the migratory fugitive emissions beyond the wellpads are not considered in any inventories at all. “If it is the case that there are a whole lot of atmospheric methane emissions from onshore gas development not currently being measured, it raises big
31 The NSW Chief Scientist and Engineer found that there is a significant level of uncertainty over the amount of fugitive emissions across the lifecycle of production and the accuracy with which they are measured. www.parliament.vic.gov.au/SCEP/GAS/Report.pdf 32 http://energy.unimelb.edu.au/__data/assets/pdf_file/0019/2136223/MEI-Review-of-Methane-Emissions-26-October-2016.pdf 33 http://files.dep.state.pa.us/OilGas/OilGasLandingPageFiles/FinalCO&A121510.pdf 34 http://www.atsdr.cdc.gov/hac/pha/DimockGroundwaterSite/Dimock_Groundwater_Site_HC_05-24-2016_508.pdf 35 https://www.ecowatch.com/new-federal-report-shows-dimock-water-was-unsafe-to-drink-after-all-1891161660.html 36 http://www.abc.net.au/news/2017-04-17/csg-could-increase-methane-emissions-near-condamine-river/8445758
9

questions about Australia's ability to meet the commitments it made to reduce greenhouse gas emissions under the Paris Accord — let alone far more ambitious goals likely to come.” 37
CAD Recommendation 7: Study, estimate and seek remedies for migratory fugitive emissions. 38
Methane leaks erase climate benefit of gas [section 9.5.2] Thanks to the Panel for pointing out just how tawdry the regulation of this Industry can be. One of the most glaring examples is the paltry Queensland code of practice which only assesses for leaks every 5 years. However, concerningly, the Draft Final Report states: “Submissions from industry indicate that they have a preference for the Queensland Government’s Code of Practice approach to leak detection and repair. DPIR has indicated to the Panel that it will adopt this practice, with some possible customisation.” (page 204) Surely, in every instance that gas is mined, best practice technology and methodologies need to be applied to leak prevention and monitoring. Research has found that leaks from oil and gas production, particularly fracking, are contributing significantly to rapidly rising methane emissions. A review of more than 200 studies confirmed that methane emissions in the USA are considerably higher than official estimates : “Leaks from the nation’s natural gas system are an important part of the problem. The recent jump in methane emissions from oil and gas production ... is “substantially larger” than previously thought. And that means natural gas is not a climate solution.” 39
The climate benefits of switching from coal-fired power to gas is diminished due to even a very small leakage rate of methane in the natural gas supply chain. Wishful thinking and industry estimates do not actually make fracked gas a good climate strategy.
Regional measurements [section 9.5.4] It is concerning that using a methane detector attached to a vehicle could be discounted as useless in the NT. “… surveys were restricted to existing roads, which limited coverage. Such a restriction is likely to be of even greater concern in the NT, where the road network is restricted.” (page 205) All fracking activities require roads which could be used for this purpose, even in the Northern Territory.
Offsets and facility wide emissions [section 9.5.5] “It is likely that any new unconventional shale gas production facilities developed in the NT will be covered by the safeguard mechanism.” (page 206). This leaves a possibility that in the scenario of a fracking industry being established in the NT, that it will not be subject to the safeguard mechanism. CAD are not convinced of the efficacy of the NGER scheme due to their use of “emissions factors”, which are likely to be incorrect. Offsets should be a certainty, not a likelihood. In addition, the proposed scheme is inadequate as the offsets should be linked to actual measurements like top-down monitoring.
37 http://www.abc.net.au/news/2017-02-28/methane-emissions-from-coal-seam-gas-climate-change/8310932 38 See Explanation of CAD recommendations on page 21 39 https://thinkprogress.org/nasa-study-fracking-global-warming-0fa0c5b5f5c7/
10

Rather than using “financial incentives to encourage companies to find their own least cost and effective emission reduction approaches”, we should consider the NT’s good experience of multiple-benefit offset activities such as habitat management and bushfire abatement. Multiple benefits could include: employing Territorians, empowering traditional owners to work on country, and protecting habitat value. Authorisation should be dependant on ongoing completion of the offset mission. , 40 41
CAD Recommendation 8: Multiple benefit offsets should be mandatory. 42
Code of practice [section 9.5.6] Although it is pleasing to see mention of baseline data to be taken before exploration if possible, it is disappointing this is merely a token note rather than an actual recommendation. Note that flux towers could be 10 metres tall and well spread out - i.e. permanent long distant eyesores. Is it possible drones might not be better? Five years is too long a frequency even for regional scale measurements as super emitters may be missed by other methods, and we cannot afford to treat our planet as an emissions dumping ground. It is no longer acceptable to allow “monitoring [to]... be the responsibility of the gas company,” even with “auditing ... by a statutorily appointed regulator,... the Commonwealth Clean Energy Regulator”. (page 207) Letting mines self-monitor pollution levels invites deception, rewards poor monitoring performance and so is not acceptable. "Fudging the figures has been going on for a long time. Guys have seen plastic bags over sensors. It's scary when you see that kind of thing. Unfortunately, you've got a few guys in the industry who are a bit less than moral and others are downright idiots." said Mr Oliver, a mine manager who believes an independent body should be established to do the monitoring. 43
Therefore, CAD insists that if there must be fracking, it is frequently independently monitored, and that monitoring paid for by the industry. Although the Panel suggests that “a formal, site-wide leak inspection and repair program should be conducted at least every two years.” (page 207), CAD requests that an annual frequency would bring us closer to ensuring “that emissions not detected by the monitoring stations are minimised and that community confidence is maintained.” The equipment should be state of the art and the best range of techniques available should be used. Note up to a year is still a very long time for freely leaking GHG emissions. It is excellent that the lowest levels from best practice in USA are chosen, but can they be detected? See what Origin said in Section 9.5.2. This really is just not enough: “This leak inspection and repair program should be the responsibility of the operating company, but with auditing, as noted above, by a statutorily appointed regulator.” There are always economic pressures from above to minimize costs on the ground and this can result in less than excellent environmental efforts, as these are too often viewed as an unnecessary burden. Just like the
40 http://www.energynewsbulletin.net/australia/news/1098135/uncertainty-over-another-inpex-indigenous-project 41 ttp://www.abc.net.au/news/2016-03-31/inpex-joint-venture-seeks-to-dump-federal-environmental-projects/7289310?pfmredir=sm 42 See Explanation of CAD recommendations on page 21 43 https://www.qt.com.au/news/self-monitoring-dust-invites-corruption-its-inviti/3053363/
11

traffic slows down when a police car with speed cameras is in view, so might this polluting industry if there were to be more of an oversight presence. As a minimum, random but frequent audits with stringent penalties for breaches could mean that greater vigilance in keeping abreast of fugitive emissions.
Risk assessment [section 9.5.7]
Report Recommendation 9.2 This recommendation about developing a code of practice would be improved if the reporting started from the very beginning: baseline monitoring before any drills come instead of: “once production of any onshore shale gas commences.” Clearly beginning base monitoring at least one year before production, as has already happened in some cases, would be better. It is essential that the code of practice, baseline measurements and top-down methodologies are determined before any more activity occurs.
It is vital that as a part of the code of practice, there be a specific regulation to limit the amount of methane that can be emitted. “Currently in Australia, there are no specific federal or state regulations that limit, for climate or environmental protection reasons, the amount of methane that can be emitted by the oil and gas industry.” 44
Report Recommendation 9.4 Although it is good that baseline and ongoing monitoring be the responsibility of the regulator, undertaken by an independent third party, and funded by industry, it must be properly funded. It is disappointing to see monitoring curtailed for one aspect in order to pursue another aspect due to a lack of funding.
But do remember, monitoring isn’t a prevention or a cure for pollution unless stringent parameters, responses and real penalties are implemented.
CAD Recommendation 9: There must be properly funded monitoring with stringent penalties. 45
Report Recommendation 9.5 It is good that all monitoring results will be swiftly published online. The public would also need to see totals per quarter and annually, and how these compare to baselines and other places, so the results are easy to interpret.
Report Recommendation 9.6 The emission concentration limits need to be related to a significant deviation from the baseline regional survey. There seems to be an attitude in some of the USA studies that only the hotspots need to be repaired because in the past none of them were repaired. Consequently, those studies appear to ignore all the minor plumes which may account for half the fugitive emissions. This is just not acceptable. The concentration limits need to be as low as possible with the best equipment.
There needs to be clear time parameters for the gas company to immediately report, investigate and repair the source of the deviation. Monitoring, reporting and investigating are not very useful if there isn’t also swift and rigorous repair conducted as soon as possible. The regulator must be well-staffed so they can be
44 http://energy.unimelb.edu.au/__data/assets/pdf_file/0019/2136223/MEI-Review-of-Methane-Emissions-26-October-2016.pdf 45 See Explanation of CAD recommendations on page 21
12

vigilant to ensure they get it done properly and promptly; then the re-monitoring and reporting until it is all clear. Perhaps a temporary fix may be needed to limit the size of the emissions when more time is needed for a proper repair. Taking up to two years to action a repair, as required by the USA code, is unacceptable. It is inadequate that “make good provisions be undertaken by industry” (only) “where necessary.” Please 46
be clear under which circumstances it would not be necessary to repair a leak that exceeds limits. There also needs to be provision for re-monitoring and reporting until it is all clear.
Life cycle GHG emissions from a new gas field [section 9.6] The Draft Final Report doesn't look at the downstream emissions - yet we should take responsibility for where these fossil fuels are burned. GHG emissions from any new onshore shale gas field in the NT (producing 1,000 TJ/day or 365 PJ/y) would contribute around 5% of Australian GHG emissions (page 209). This is too much when we need to be reducing by at least 26%. As “the assessed risk of life cycle GHG emissions from a new shale gas industry in the NT, before any further mitigation, is ‘medium’” is considered appropriate in that it predicates action. However, it is incorrect that ”there is little opportunity to reduce GHG from the downstream stage”. CAD would like to share with you an excellent method: ban fracking. “The focus for risk reduction for life cycle GHG emissions must be on reducing upstream methane emissions,” yet still no effort has been made to curb the possibly massive migratory fugitive emissions from beyond the wellpads and pipelines… Unfortunately, we can’t have it both ways. We can’t both exclude foreign downstream emissions, whilst measuring the upstream emissions on the global scale. We should be considering the full life cycle impact of 100% of produced fuel, as the atmosphere has no climate boundaries. It is illogical to at first dismiss consideration of the full carbon burden of gas fracked for export, but then to dilute the domestic emissions in global data.
Massive quantity of GHG emissions [section 9.6.1] The emissions figures in Table 9.4 involve large emissions of GHG at a time when we should be headed for zero emissions from new fossil fueled projects. CAD takes issue with the following statement: “It is not appropriate to account for these overseas emissions against Australian emissions, but rather against the importing country’s emission inventory” (footnote 153). There is no justification for this big claim because it presumes a robust emissions trading environment that does not exist. The main customer (USA) has rejected the Paris Agreement. Our current federal Government is firmly opposed to a carbon tax. Therefore, ethically, Australia must take responsibility for any polluting fuel it exports. It is (or should be again) our responsibility not to export uranium to countries that make bombs. If we were being truly responsible, we would not export gas at all, because even if our gas were to actually displace
46 Recommendation 9.6
13
coal, the gas would then be displacing sustainable clean energy sources and therefore still adding to the climate catastrophe. CAD does not agree with the line of argument that accepts coal’s GHG emissions as a benchmark. Gas would not be any more welcome if it happened to be slightly less dirty than coal. We should be comparing gas to zero-emission renewable technology. NT gas certainly is too dirty to use, irrespective of any comparison to coal. Using the figures provided in the Draft Final Report, a new shale gasfield would substantially increase the methane emissions from fossil fuels in Australia, at a time when we should be lowering them.
Life cycle GHG emissions: electricity production [section 9.7] Yet again, the Panel has relied on this statement: “the life cycle GHG emissions from shale gas generated electricity are 50-60% of that from coal generated electricity. Natural gas combined cycle gas turbine power plants (CCGT) have a lower climate impact than supercritical pulverised coal power, provided methane emission rates are lower than 3.3%” (page 211) Firstly, in Australia there are currently twice as many open cycle gas turbines as CCGT ones, so the 47
climate impact wouldn’t be as positive as the Draft Report infers. Secondly, comparing anything to the dirtiest fuel source scarcely justifies it. Thirdly, the co-gen pathway is an unnecessary, expensive and climate polluting diversion from the road to renewables which we are inevitably on. And fourthly, if all the upstream emissions were properly assessed they may well be over the critical 3.3%. Climate Action Darwin supports the Panel’s finding that “the total life cycle GHG emissions from renewable energy sources are much lower… than those from fossil fuels…; supercritical coal fired electricity releases about 20 times more GHG per megawatt-hour than solar electricity.” (page 211) This is clearly where we should all be focusing all our attentions and resources. However, the Draft Final Report also noted that Open Cycle Gas Turbines, the most common gas plants in Australia, have emissions approaching those of the best coal plants (page 212). The GHG emissions of the ultra HELE coal was 816 kg CO2e/ MWh, whilst that of the Open Cycle Gas Turbine OCGTs was 776 kg CO2e/ MWh]. Gas is highly polluting. The Panel’s conclusion that, “in the short to medium term, the Australian National Electricity Market is likely to require higher levels of flexible, gas fired generation, which can provide a reliable, low emissions substitute for ageing coal fired generation, and can provide essential security services to rapidly respond and complement variable renewable electricity generation” (page 211), is outdated and incorrect. It fails to take into account that we have the introduction of Tesla batteries to the Australian energy grid, and that regardless of its marketing, gas is not a low-emitting fuel source.
Gas versus coal [section 9.7.2] CAD wholly rejects the Panel’s focus on the dirtiest of fuel sources. Our members fail to understand what the relevance of coal is to an Inquiry about gas, and reject the Panel’s conclusions based on your comparisons. Compared to the worst fuel source, anything would probably be better, maybe even leaky shale gas fracking. Yet the Panel insists: “... as long as CH4 emission rates are lower than 3.3%, CCGT power plants have a lower climate impact (in terms of cumulative radiative forcing) than supercritical, pulverised coal power” (page 212). However, “because methane traps 86 times as much heat as CO2 over
47 Added up from each states Wikipedia gas plant pages
14

a 20-year period, even a very small leakage rate of methane from the natural gas supply chain can have a large climate impact — enough to gut the entire benefit of switching from coal-fired power to gas for a long, long time.” 48
The Panel acknowledges: “...upstream CH4 emissions can reduce the life cycle GHG advantage of natural gas fired power plants” (p212). It is not impossible for the methane percentage rates to go over the 3.3% ceiling as they have been found to do many times before. It is conceivable that if all the unaccounted emissions along the exploration, through the combustion and decommissioning parts of the lifecycle of shale gas production and including the migratory emissions that perpetually escape notice, were accounted for, real life levels of emissions (not estimates) would bring the numbers up considerably. Although there are now such thing as Reduced Emissions Completions, the effectiveness of those technologies is unknown and they are not rolled out to halt all sources of fugitive emissions. Indeed, there is more research being undertaken into technologies to make further emissions cuts. 49
The Panel reports that it has been calculated that “the upstream methane emission rate would have to be greater than 4.4% of natural gas production for CCGT to be worse than supercritical, pulverised coal power generation for a 20-year GWP” (page 212). Yet figures of double 4.4% have been measured before so even with greater care, this is not inconceivable, particularly taking into consideration the unmentioned migratory fugitive emissions.
There is also the fact that not all gas plants are the best kind; Open Cycles are more common than the more efficient Combined Cycle power stations. And as is clearly shown in Table 9.6, Open Cycle gas 50
plants produce nearly double the GHG emissions as the lauded Combined Cycle plants which limits the sales pitch. As the more common OCGTs are only marginally better (in terms of climate pollution) than the best coal power plants (Table 9.6) and it is impossible to direct where the NTs shale gas ends up, it is not such a clean fuel.
Without a robust trading scheme there are no incentives for gas to actually replace coal. There is, however, a real likelihood gas could delay the inevitable surge of renewables.
Renewables are better than gas [section 9.7.3] CAD maintains, as the Panel notes, that it is “claimed that it is cheaper to employ solar and wind power, and pumped hydro and batteries to provide baseload power and manage energy supply/demand fluctuations, which are the major functions of gas in the electricity system.” A new International Renewable Energy Agency (IRENA) study found: “New onshore wind and solar energy projects are set to deliver electricity more cheaply than fossil fuels plants, with other green technologies also rapidly gaining a cost advantage over dirty fuels.” 51
In a warmer Australia, where heatwaves are widespread and regular, solar power is superior to gas and coal plants. Deputy Director of The Australia Institute, Ebony Bennett said: "Solar not only significantly reduces peak demand, it delays the peak. And we need more renewable energy to take the pressure off. ... Gas and coal-fired power stations don't cope well with the heat. Thermal electricity generation, including thermal coal and combined cycle gas, require cooling to function. In heatwaves, cooling obviously becomes difficult and many power stations fail to produce at their full capacity, or they "trip" and fail in part or in full. 52
48 https://thinkprogress.org/methane-leaks-erase-climate-benefit-of-fracked-gas-countless-studies-find-8b060b2b395d/ 49 http://www.worldoil.com/news/2017/9/18/major-energy-companies-reducing-emissions-without-government-oversight 50 https://www.alintaenergy.com.au/energise/electricity/a-brief-introduction-to-gas-fired-electricity 51 https://www.afp.com/en/news/2265/fossil-fuels-blown-away-wind-cost-terms-study-doc-we49s3 52 www.canberratimes.com.au/comment/solar-energy-shines-as-heatwaves-switch-off-gas-and-coal-plants-20180112-h0hfkj.html
15

When the Draft Report states that “investment decisions involve numerous other factors not reflected in the LCOE values” (page 213), is this a reference to the pervasive unscrupulous reaches of the fossil fuel industry into every corner of government?
Future electricity generation mix and the role of gas [section 9.7.4] As South Australia has shown with their giant lithium ion Tesla battery, we no longer need expensive dirty gas fired generators to fast ramp. The fastest such conventional emergency generators take to get fired up and operating is about 10 to 15 minutes whereas “the battery delivered 100 megawatts into the national electricity grid in 140 milliseconds.” 53
The reasoning in the Draft Final Report that we require gas because “rapid changes in power output from variable renewable energy generation need to be balanced with generation technology that has the ability to ...‘fast ramp’ ” (page 214), is now outdated. The tesla battery is so successful there are plans for many more to be built, including here in the Northern Territory. Concerningly, the Panel goes on to say “which can provide a reliable, low emissions substitute for ageing coal fired generation...” (page 214). However, gas does not have low emissions. Lower than coal, sometimes only marginally lower, is not ‘low’; it could be described as having lower emissions than the dirtiest, but that is not hard and does not mean it is low. Lastly, the notion that gas is a bridging fuel as we wean from coal is fallacious, as natural gas plants do not replace only coal plants. They often replace clean power sources like solar, wind and even energy efficiency. 54
Methane emissions from abandoned shale gas wells [section 9.8] It is good to know that decommissioned wells have a lower average emission rate than abandoned wells but disappointing the rate is not zero. There is a need to improve the integrity performance of decommissioned wells over the long term, such as over a thousand years - it is vital we limit the intergenerational impacts.
Quantity of emissions [section 9.8.1] As it has been “found that methane flow rates from plugged wells were not always lower than methane flow rates at unplugged wells”, and “the leaks develop early (within a decade) in the post-production life of a decommissioned well” (page 215), it is clear greater efforts can be made to secure the GHG emissions from old wells. Indeed “methane emissions from abandoned oil and gas wells can be significant.” These findings are very concerning to CAD as the Northern Territory does not have any history of effective mine rehabilitation. Abandoned legacy mines are not just an issue in the USA where “it was estimated that, including abandoned oil and gas wells, the US inventory would increase national CH4 emissions from oil and gas activity by 1.9-4.3%” (page 215); such abandoned mines have also been mentioned in Australia. There must be a systematic approach to ensure all legacy wells are properly plugged, particularly as sometimes emissions have been seriously high.
53 www.news.com.au/technology/environment/thats-a-record-south-australias-tesla-battery-responds-to-coalfired-plant-failure/news 54 https://thinkprogress.org/methane-leaks-erase-climate-benefit-of-fracked-gas-countless-studies-find-8b060b2b395d/
16

It would be best if the Northern Territory were to follow European standards regarding the length of plugs: “the Queensland Department of Natural Resources and Mines specifies that cement plugs should be a minimum length of 30 m, whereas European codes specify plugs to be 50 m to 100m” (page 216).
Report Recommendation 5.1 Clearly we also need a requirement for ongoing monitoring of methane emissions post-abandonment. The number and skills of Northern Territory staff will need a massive boost to be able to conduct these tests and ensure all is being done properly, but currently doesn’t have capacity to take this on.
Risk assessment summary [section 9.9] When calculating risk on a global scale “on the basis that climate change is a global problem” (page 218), the total emissions for the total lifecycle of the gas must be considered. By assessing risk globally, the local situation, where undoubtedly the present fossil fuel projects dominate the Northern Territory’s already huge emissions tally, is being disregarded. Ignoring the local situation, let alone adding new projects, means we can continue polluting to our heart’s content because there is no need to control our pollution locally. Unlike most other jurisdictions, the NT has no carbon emission targets. This is because the NT has the laxest regulations in the country. To get into line, the NT needs to account for its pollution levels and work on strategies to limit them. Not accounting for pollution does not make it disappear. CAD recommends that the Panel includes accounts of how any future fracking operations would affect the Northern Territory’s GHG accounts. In this case, it would be beneficial to contrast the lifecycle and the domestic emissions, as seems to be favoured by the Panel. CAD agrees with the Panel that climate change is indeed a global problem that should also be considered globally, but in doing so we cannot dismiss all the exported fuel where the majority of the GHG emissions are produced. To continue to ignore the exported fuel in a risk assessment means that the assessment is delusive. CAD requests that the flawed risk assessment be reassessed properly. Imagine if every fossil fuel project around the world was assessed in that way (only a tiny percent of global emissions, nothing to see here.) There would be thousands of new oil/coal/gas projects opening up at the very time that we know, as a global society, we need to reduce emissions. It is only by using this faulty method of risk assessment that governments and proponents can continue to approve these types of projects. This is exactly the sort of thinking that continues to make the problems worse. The climate change risk table completely ignores the catastrophic risks brought by climate change, and 55
therefore the 'low risk' output is not reflective of the science. In addition, separating out the component pollutions and assessing them individually dilutes their impacts. The climate cares not from whence the pollution was sourced and as such, should be assessed as a block. Emissions from shale gasfields in the NT are not of 'low consequence' 56
The suggestion “it is not necessary to formally invoke the precautionary principle” (page 218) displays a clear lack of comprehension of precaution; for example, looking to see if there is a car when crossing the road even if it is quiet - taking a precaution even when the risk is low. Here, the risk is not low as it is nearly all life on the planet that would suffer.
55 Page 22 https://frackinginquiry.nt.gov.au/inquiry-reports?a=465921 56 as stated in the risk table on page 22 https://frackinginquiry.nt.gov.au/inquiry-reports?a=465921
17

CAD Recommendation 10: That the risk assessments be reassessed with the total emissions 57
included.
Hot and Polluted A very recent thousand page draft UN report, prepared by hundreds of scientists stated: “On current trends, Earth's thermometer will cross the 1.5 °C threshold in the 2040s… The greenhouse gas emissions guaranteeing that outcome will have been released within 10 to 15 years.” 58
The shale gas currently kept safely underground in the Northern Territory could be part of these GHG emissions - or we could ban fracking as the logical way to avoid catastrophic climate change.
Figure 2. Global Temperatures are already sometimes intolerably hot and the wonderful news is it can remain that way. (Merely sometimes intolerably hot). But only if we follow a yellow path with a Low Emissions Scenario. However, the yellow paths are the most challenging, and will take some outstanding and courageous leadership. It necessitates the fossil fuel industry to speedily and entirely phase down. Fracking the NT is following the red line where quickly the global temperature becomes increasingly inconceivable in the lives of today's children. 59
57 See Explanation of CAD recommendations on page 21 58 https://au.news.yahoo.com/a/38588568/1-5-c-climate-goal-very-unlikely-but-doable-draft-un-report/?cmp=st 59 https://jpratt27/2018/01/15/climatechange-2017-should-send-shivers-down-the-spines-of-policy-makers-auspol-stopadani/
18
Ice (cryosphere) scientists are concerned about imminent irreversible thresholds. “The consensus figure for the irreversible melting of Greenland is at 1.6°C.” West Antarctica isn’t far ahead. Note where 1.6°C is 60 61
situated in the graph above. Warming is likely to be greater than the projections of the Intergovernmental Panel on Climate Change (IPCC), on which climate policy-making and carbon budgets are generally based, according to two significant pieces of work released in 2017. 62
“If these works are correct, then the pledges made under the Paris Accord would not produce warming of around 3°C as is widely discussed, but a figure closer to and even above 4°C.” 63
The problem is that the notion that future climate changes may be faster and hotter than those projected by climate models is rarely understood. If we are to address the real climate challenge, we simply cannot frack any more.
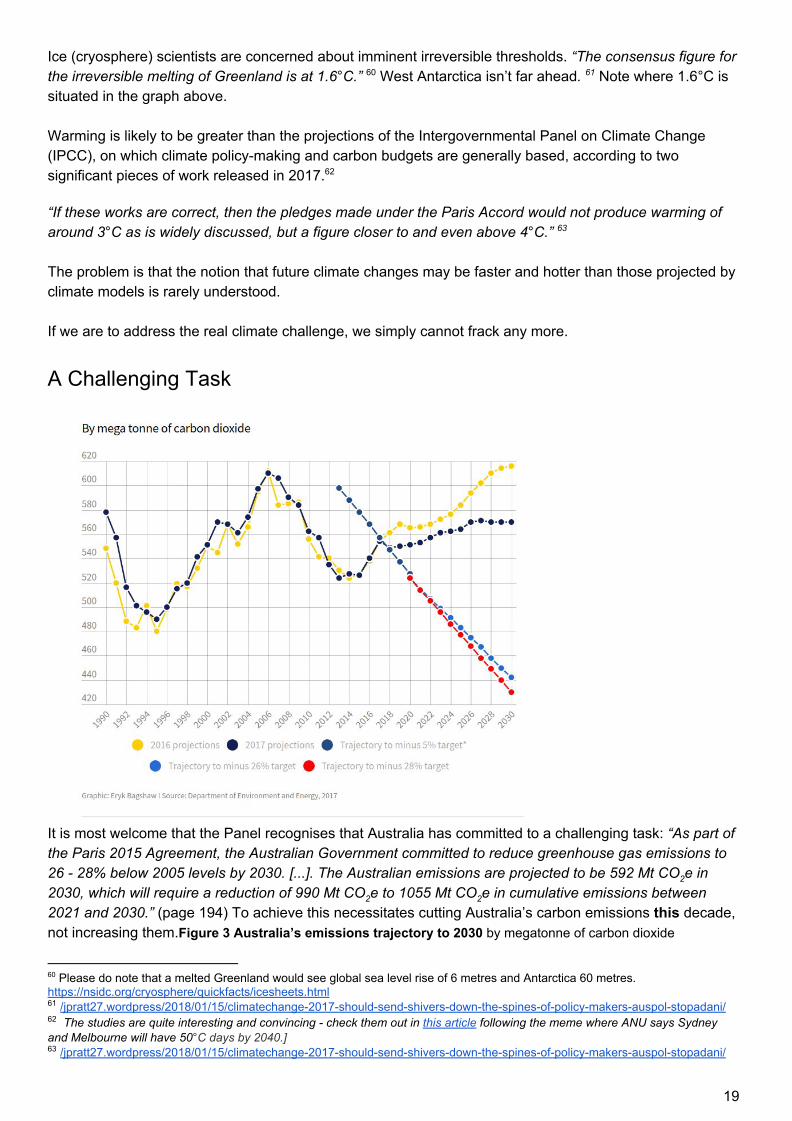
A Challenging Task
It is most welcome that the Panel recognises that Australia has committed to a challenging task: “As part of the Paris 2015 Agreement, the Australian Government committed to reduce greenhouse gas emissions to 26 - 28% below 2005 levels by 2030. [...]. The Australian emissions are projected to be 592 Mt CO2e in 2030, which will require a reduction of 990 Mt CO2e to 1055 Mt CO2e in cumulative emissions between 2021 and 2030.” (page 194) To achieve this necessitates cutting Australia’s carbon emissions this decade, not increasing them.Figure 3 Australia’s emissions trajectory to 2030 by megatonne of carbon dioxide
60 Please do note that a melted Greenland would see global sea level rise of 6 metres and Antarctica 60 metres. https://nsidc.org/cryosphere/quickfacts/icesheets.html 61 /jpratt27.wordpress/2018/01/15/climatechange-2017-should-send-shivers-down-the-spines-of-policy-makers-auspol-stopadani/ 62 The studies are quite interesting and convincing - check them out in this article following the meme where ANU says Sydney and Melbourne will have 50°C days by 2040.] 63 /jpratt27.wordpress/2018/01/15/climatechange-2017-should-send-shivers-down-the-spines-of-policy-makers-auspol-stopadani/
19

Source: www.theage.com.au/business/comment-and-analysis/cooking-the-books-on-climate-change-policy- We have a responsibility to reduce our pollution, especially when we consider the concerning trajectories of the previous graph. To follow the light blue and red projections, we cannot allow new fossil fuel projects. 64
The abatement level required to fulfil the Paris Agreement is now so great that, according to independent analysis, we need to take all cars off the road or cows off farms immediately. 65
This coming decade requires a mammoth effort, starting with admission that we have a problem, followed by bringing forward cuts in pollution that we had previously considered could be done later. Any uncertainty around the strength of impacts is grounds for more ambitious emission reduction measures, rather than delaying those measures. Restricting global warming to 1.5 degrees is the only prudent threshold to avoid catastrophic outcomes. The inevitable conclusion is that there is no room for new fossil fuel developments if we are to be confident about avoiding more dangerous climate change. The window of opportunity for ‘transition fuels’, such as gas, has now passed and zero-emissions energy sources are now the only defensible option. The emissions from large-scale shale gasfields across the Northern Territory would be counter-productive to bringing down our emissions and should be avoided.
Conclusion - our climate is already too polluted to withstand more fracking In this submission, we have shown that the scientific evidence directly contradicts the Panel’s conclusion that “methane and GHG emissions from any new onshore shale gas field in the NT” comprise “an acceptable risk”. We have shown that unconventional gas extraction - whether regulated or not - greatly contributes to climate change, and therefore comprises a risk that is unacceptable at this point in history. Consider this from the International Energy Agency: “Because energy accounts for two-thirds of total greenhouse gas emissions and 80% of CO2, any effort to reduce emissions and mitigate climate change must include the energy sector.” Similarly, World Meteorological Organization Secretary-General Petteri 66
Taalas said in 2017 “Without rapid cuts in CO2 and other greenhouse gas emissions, we will be heading for dangerous temperature increases by the end of this century, well above the target set by the Paris climate change agreement. Future generations will inherit a much more inhospitable planet.” Likewise, the 67
Legislative Council’s Environment and Planning Committee of the Victorian Government found in its 68
Inquiry into Unconventional Gas in Victoria that: “Unconventional gas is not a renewable source of energy, it is polluting, contributes to climate change, and is not required as a fuel to transition between fossil fuels and renewables…. A permanent ban on unconventional gas activities would also ensure that fugitive emissions would not be a contributor to greenhouse gas emissions.” 69
All of these statements are equally true in the Territory context. Analysis of the Panel’s proposed risk mitigation strategies regarding both downstream and upstream emissions of GHG caused by unconventional gas extraction have not convinced Climate Action Darwin to
64 http://www.theage.com.au/business/comment-and-analysis/cooking-the-books-on-climate-change-policy-20171229-h0ba0h.html 65 http://www.theage.com.au/business/comment-and-analysis/cooking-the-books-on-climate-change-policy-20171229-h0ba0h.html 66 https://www.iea.org/topics/climatechange/ 67 https://public.wmo.int/en/media/press-release/greenhouse-gas-concentrations-surge-new-record 68 On August 30, 2016 69 https://www.parliament.vic.gov.au/images/stories/committees/SCEP/GAS/Report/EPC_58-03_Text_WEB.pdf
20
alter our view: that further fracking in the Northern Territory will contribute significantly to climate change, and is therefore unacceptable.
Along with the majority of contributors to this Inquiry and the majority of residents of the Northern Territory, we request the Panel to alter its recommendations that fracking is safe, and instead redirect its formidable skills to outlining alternatives.
CAD Recommendation 11: That fracking be banned in the Northern Territory.
Explanation of CAD recommendations These first ten CAD Recommendations are aimed to display major gaps in Chapter 9 of the Draft Final Report and are only required should are overarching recommendation: number 11, that fracking be banned be ignored. Under no circumstances should CAD be understood to be advocating further mining for gas in the NT.
CAD Recommendation 1: That the panel reconfigures its calculations with the GWP.20
CAD Recommendation 2: That there be consideration of the increased GHG emissions from unconventional shale gas extraction in the Northern Territory for not only the Territory and Australia, but the world.
CAD Recommendation 3: Examine the efficacy of the emission reduction technologies.
CAD Recommendation 4: That there be a comprehensive audit of gas reporting requirements, to inform enforcement of emissions guidelines, offsets and regulatory action.
CAD Recommendation 5: Assess and adopt of the world best performance standards.
CAD Recommendation 6: That thorough baseline studies be conducted before any drilling or any further activity.
CAD Recommendation 7: Study, estimate and seek remedies for migratory fugitive emissions.
CAD Recommendation 8: Multiple benefit offsets should be mandatory.
CAD Recommendation 9: There must be properly funded monitoring with stringent penalties.
CAD Recommendation 10: That the risk assessments be reassessed with the total emissions included.
CAD Recommendation 11: That fracking be banned in the Northern Territory.
21