draft conservation advice for salt-wedge estuaries ... · web viewwater from the ocean with a...
TRANSCRIPT
Draft Conservation Advice for Salt-wedge Estuaries Ecological Community
Environment Protection and Biodiversity Conservation Act 1999 (EPBC Act) (s266B)
DRAFT FINAL (15/6/2017)
<Approved> Conservation Advice (including Listing Advice) for the Assemblages of species associated with open-coast salt-wedge estuaries of western and central Victoria ecological community
1. The Threatened Species Scientific Committee (the Committee) was established under the EPBC Act and has obligations to present advice to the Minister for the Environment (the Minister) in relation to the listing and conservation of threatened ecological communities, including under sections 189, 194N and 266B of the EPBC Act.
2. If approved <The Committee provided its advice on Assemblages of species associated with open-coast salt-wedge estuaries of western and central Victoria ecological community to the Minister as a draft of this Conservation Advice in 2017. The Committee recommended that:
the ecological community merits listing as <endangered> under the EPBC Act; and
a recovery plan is not required for the ecological community at this time.
3. [If approved] In 2017, the Minister accepted the Committee’s advice, adopting this document as the approved Conservation Advice. The Minister amended the list of threatened ecological communities under section 184 of the EPBC Act to include Assemblages of species associated with open-coast salt-wedge estuaries of western and central Victoria ecological community in the Endangered category.>
4. A draft Conservation Advice for this ecological community was made available for expert and public comment for a minimum of 30 business days. <The Committee and Minister had regard to all public and expert comment that was relevant to the consideration of the ecological community.>
5. This <approved> Conservation Advice has been developed based on the best available information at the time <it was approved>; this includes scientific literature, advice from consultations, and existing plans, records or management prescriptions for this ecological community.
1

Table of Contents
1. DESCRIPTION OF THE ECOLOGICAL COMMUNITY..............................................71.1. Name of the ecological community and associated rationale.......................................81.2. Location, physical environment, climate and hydrodynamics.....................................81.3. Reference Condition...................................................................................................131.4. Biota............................................................................................................................13
1.4.1. Flora and Protista......................................................................................................131.4.2. Fauna........................................................................................................................14
2. GUIDANCE FOR DETERMINING WHETHER THE SALT-WEDGE ESTUARIES ECOLOGICAL COMMUNITY PROTECTED UNDER THE EPBC ACT IS PRESENT. 16
2.1. Overview....................................................................................................................162.2. Key Diagnostic Characteristics..................................................................................162.3. Boundaries and Buffer Zones.....................................................................................162.4. Surrounding environment and landscape/seascape context........................................182.5. Area critical to the survival of the ecological community..........................................18
3. SUMMARY OF NATIONAL CONTEXT.........................................................................204. SUMMARY OF THREATS................................................................................................235. RECOMMENDATIONS BY THE THREATENED SPECIES SCIENTIFIC COMMITTEE..............................................................................................................................27
5.1. Recommendation on eligibility for listing against EPBC Act criteria.......................275.2. Recommendation on Recovery Plan...........................................................................29
6. PRIORITY RESEARCH AND CONSERVATION ACTIONS......................................306.1. Priority protection, conservation management and recovery actions.........................30
6.1.1. Protect.......................................................................................................................306.1.2. Restore......................................................................................................................316.1.3. Communication and Engagement.............................................................................32
6.2. Monitoring and Research priorities............................................................................336.3. Offsets.........................................................................................................................346.4. Existing plans/management prescriptions relevant to the ecological community......34
APPENDIX A: LISTS OF KEY BIOTA FROM THE ECOLOGICAL COMMUNITY.....36APPENDIX B: DETAILED DESCRIPTION OF NATIONAL CONTEXT..........................43
B1: Bioregional distribution.......................................................................................43B2: Other existing protection.....................................................................................44B3: Relationship to state listed vegetation classifications..........................................45B4: Nationally threatened species likely to occur in or near the ecological community....................................................................................................................................46B5: Birds under international agreements..................................................................47B6: Existing plans/management prescriptions relevant to the ecological community....................................................................................................................................48
APPENDIX C: RELEVANT HYDROLOGY, BIOLOGY AND ECOLOGY.......................49
2

C1: Overview..............................................................................................................49C2: Hydrology............................................................................................................49C3: General ecology and function..............................................................................54
APPENDIX D – DETAILED DESCRIPTION OF THREATS...............................................59D1: Flow regime modification...................................................................................59D1.1: Water extraction...............................................................................................59D1.2: Estuary entrance modification (artificial opening)...........................................60D1.3: Regulatory infrastructure..................................................................................61D2: Climate change and related impacts....................................................................63D3: Land use and declining water quality..................................................................65D3.1: Increased erosion, turbidity and sedimentation................................................65D3.2: Eutrophication and algal blooms......................................................................66D3.3: Acid flows and blackwater events....................................................................67D3.4: Increased pollution...........................................................................................68D4: Pathogens and pests.............................................................................................69D4.1: Disease (pathogens and parasites)....................................................................69D4.2: Invasive species................................................................................................69D5: Extractive and recreational activities...................................................................70D5.1: Fishing – commercial and recreational.............................................................70D5.2: Mining and extraction activities – coal and sand.............................................71D5.3: Recreation – boating.........................................................................................71
APPENDIX E: DETAILED ASSESSMENT OF ELIGIBILITY FOR LISTING AGAINST THE EPBC ACT CRITERIA......................................................................................................73
E1: Criterion 1 – Decline in geographic distribution.................................................73E2: Criterion 2 – Limited geographic distribution coupled with demonstrable threat....................................................................................................................................74E3: Criterion 3 – Loss or decline of functionally important species..........................79E4: Criterion 4 – Reduction in community integrity..................................................80E5: Criterion 5 - Rate of continuing detrimental change: Impacts of Climate Change – Sea Level Rise and Increasing Temperature...........................................................96E6: Criterion 6 – Quantitative analysis showing probability of extinction..............101
7. BIBLIOGRAPHY...............................................................................................................102
3

Glossary
acid flow During drought the water table can drop and expose the iron sulfide layer of soil (where present) which oxidises. Prolonged rain can wash substantial quantities of sulfuric acid and aluminium from these acidic soils into waterways. The result is an acid flow which can cause a fish kill event.
anoxic/hypoxic Strictly, the absence of oxygen but in these estuaries it applies to waters having dissolved oxygen concentrations of less than 1 – 2 ppm. (i.e. anoxia, O2 < 0.2 mgO2/L; hypoxia, O2 < 2 mgO2/L;) (Phil et al. 1991).
anthropogenic Caused or influenced by humans.
benthos, benthic organism
Flora and fauna that live on or in the bottom substrate of a waterway (i.e. estuary).
berm The sand accumulated at the mouth of a waterway (i.e. estuary).
biota Living organisms.
blackwater event A natural event that occurs when returning floodwater (usually after an extended dry period and build-up of leaf litter) contains elevated levels of dissolved organic carbon.The black colour results from the release of carbon compounds (including tannins) as the organic matter decays. Oxygen is consumed by the decaying process and the water column can become oxygen depleted leading to stress or death of aquatic organisms like fish.
calanoid copepod Calanoida is an order of copepods. The order includes around 40 families with about 1800 species of marine, estuarine and freshwater copepods. Calanoid copepods are dominant in the plankton in many parts of the world's oceans and estuaries.
catchment The area from which a surface watercourse derives its freshwater (i.e. from precipitation draining into the waterway).
ciliate Common name for the members of the phylum Ciliophora; protozoans (or protists) that are characterized by the presence of hair-like organelles called cilia.
copepod A kind of zooplankton; small or microscopic aquatic crustacean of the large class Copepoda.
desmid Single-celled freshwater algae of the family Desmidiaceae, characterized by a division of the body into mirror-image halves joined by a bridge containing the nucleus, and having a spiny or bristly exterior.
diapause A period of suspended development in an organism (usually an invertebrate), especially during unfavourable environmental conditions. Dormancy is not broken until after a certain period of time (the refractory period) has occurred. Has a longer period of viability than quiescent dormancy; often years.
diatom 1. A single-celled alga which has a cell wall of silica. Many kinds are planktonic, and extensive fossil deposits have been found.
dinoflagellate 1. A single-celled organism with two flagella, occurring in large numbers in marine plankton and also found in fresh water.
discharge A measure of the water flow, expressed as volume per unit of time, at a particular point (e.g. a river gauging station).
dormant Having normal physical functions suspended or slowed down for a period of time; in or as if in a deep sleep.
endemic Native or restricted to a certain place.
4
epifauna Animals that live on the floor of a waterbody.
epiphyte A plant that grows on another plant, especially one that is not parasitic.
estuary That portion of a river system which usually has contact with the sea, and is therefore potentially tidal, and which exhibits, within the confines of the land, a transition in physical, chemical and biological characteristics from fresh water to sea water (Newton 1994).
eutrophic Waters enriched in nutrients (mainly nitrogen and phosphorus compounds).
fish kill A localized and sudden die-off of fish populations which may also be associated with more generalized mortality of aquatic life.
freshwater Water with a salinity of less than 0.5 part per thousand (ppt).
habitat The living place of an organism or community, characterised by its physical, chemical, and/or biotic properties.
halocline The typically thin boundary layer between the less dense upper fresher waters and deeper, denser more saline waters. A mixing zone, in which salinity increases more rapidly with depth than in the layers above and below it.
harpacticoid copepod
Harpacticoida is an order of copepods. They are distinguished from other copepods by the presence of only a very short pair of first antennae. There are over 3000 species and the majority are benthic (bottom dwelling). Harpacticoids are the second largest meiofaunal group in marine and estuarine sediments after nematodes.
holoplankton Organisms that are planktonic (they live in the water column and cannot swim against a current) for their entire life cycle. Holoplankton dwell in the pelagic zone as opposed to the benthic zone. Holoplankton include both phytoplankton and zooplankton and vary in size.
hydrology The study of the movement, distribution, and quality of water on Earth.
hypersaline Water with a salinity that exceeds that of seawater.
hypoxic A condition of oxygen deficiency but in these estuaries an oxygen concentration < 2 mg O2/L.
IMCRA Integrated Marine and Coastal Regionalisation of Australia
infauna Benthic animals that live in sediments of the ocean, rivers, estuaries or lakes; of any size.
iridovirus A group of viruses, of the genus Iridovirus that show a blue or purple iridescence.
lagoon A broad, shallow water body that may or may not have an opening to the sea.
macroinvertebrate An animal without a backbone and typically larger than 0.5 mm in size (e.g. snails, clams, worms).
marinisation In the context of this Conservation Advice, refers to the conversion to functionally a marine system (i.e. with mixed salinity of close to marine levels, and a distinct lack of salinity stratification).
Mediterranean climate
A climate distinguished by relatively wet, mild winters and dry, warm to hot summers. Typically found between 30° and 45° latitudes.
meiofauna/ meiobenthic
Minute benthic invertebrates that live in bottom sediments of waterbodies or on algae; they can pass through a 1 mm sieve and are retained in a 45μm mesh.
meroplankton Planktonic organisms which spend a portion of their lives in the benthic region
5

of the ocean. These organisms do not remain as plankton permanently, rather, they are planktonic components in transition, which eventually become larger organisms. Meroplankton consists of larval stages of organisms such as sea urchins, starfish, crustaceans and dinoflagellates and diatoms.
mg/L A concentration unit – milligrams per litre. A milligram is one thousandth of a gram.
microphytobenthos The microscopic, unicellular eukaryotic algae and the prokaryotic Cyanobacteria which live on sediment surfaces.
nekton 1. Aquatic animals that are able to swim and move independently of water currents.
nutrients Elements essential for life – in natural waters usually one or more of nitrogen (N), phosphorus (P) and silica (Si) are present in low, limiting concentrations.
perched Typically refers to lakes/wetlands/lagoons that sit above the groundwater table and are not connected to it.
phytoplankton 1. Plankton consisting of microscopic plants.
protist Belonging to the kingdom Protista. These are the eukaryotic organisms (organisms with a nucleus) that are not animals, plants or fungi. They may occur as unicellular, multicellular, coenocytic, or colonial organisms. They include: (1) protozoa, the animal-like protists, (2) algae, the plant-like protists, and (3) slime moulds and water moulds, the fungus-like protists.
quiescent dormancy
Has a shorter period of viability than a diapause dormancy (e.g. of copepod dormant eggs).
riparian Area that is the interface between land and a river or stream. Plant habitats and communities along the river margins and banks are called riparian vegetation.
riverine Having the characteristics of a river.
salinity A measure of the total quantity of dissolved salts in water. For the purposes of this Advice, salinity is given as parts per thousand (ppt) (i.e. by weight).
salt-wedge An intrusion of sea water along the bed of the estuary which becomes thinner with distance upstream. The physical separation of marine and riverine derived water within an estuary with the denser salty marine water sitting beneath the riverine water and forming a wedge.
seagrass Flowering plants of the Order Alismatales that live in marine and estuarine waters. They are grass-like, grow underwater and tend to occur in ‘beds’.
sea water Water from the ocean with a salinity of around 35 ppt (generally 34 – 37 ppt).
sediment Particulate solid material accumulated on the river/estuary bottom.
stratification Water stratification occurs when water masses with different densities and properties occur, which is typically driven by salinity and temperature. Such layers can act as barriers to water mixing – e.g. salinity (halocline); oxygen (chemocline); density (pycnocline); temperature (thermocline).
turbidity The degree of cloudiness in water that is caused by the presence of suspended solids.
zooplankton 1. Plankton consisting of small animals, such as rotifers, copepods and krill, and the immature stages of larger animals.
6
Conservation objective:
To mitigate the risk of extinction of the Assemblages of species associated with open-coast salt-wedge estuaries of western and central Victoria ecological community, and help recover and maintain its biodiversity and function, through the protections provided under the Environment Protection and Biodiversity Conservation Act 1999 and by guiding implementation of management and recovery through the recommended priority conservation and research actions (see section 6).
1. DESCRIPTION OF THE ECOLOGICAL COMMUNITY
The ecological community is the assemblage of native plants, animals and micro-organisms that are associated with the dynamic salt-wedge estuary systems associated with the Mediterranean climate, microtidal regime (< 2 m), high wave energy coastline of western and central Victoria. The ecological community is currently known from 25 estuaries in the region defined by the border between South Australia and Victoria and the most southerly point of Wilsons Promontory.
Geomorphically, the estuaries where the ecological community occurs are drowned river-valley and barrier built systems. They are generally narrow and shallow, although some may have wider lagoons or deeper pools along their length. The mouths of the estuaries are west- and east-facing and typically form a sandbar (or berm) which may overlay a sill. These estuaries are influenced by seasonal longshore sand drift and characterised by intermittent mouths (sometimes open and sometimes closed).
Salt-wedge estuaries are usually highly stratified, with saline bottom waters forming a ‘salt-wedge’ below the inflowing fresh layer of riverine waters. The wedge of heavier marine waters is introduced into the estuary by wave energy and tides. Importantly, there is typically a well-formed halocline boundary between the two water-column layers, which may vary in size from a few centimetres to 1–1.5 m (Sherwood 1983; Newton 1994; Mondon et al. 2003). Mixing at this boundary causes the surface layer to entrain saltwater and become more saline as it moves towards the sea. To compensate for the entrained saltwater, there is a slow movement of the deeper saltwater layer upstream. Over a standard annual hydrological cycle, the salt-wedge may be in one of three main phases: emplacement (i.e. formation); presence, or; reduction (i.e. retreat) which may extend to complete flushing (Newton 1994, 1996). A detailed discussion of the hydrological cycle of salt-wedge estuaries is at Appendix C2.
The dynamic nature of salt-wedge estuaries has important implications for their inherent physical and chemical parameters, and ultimately for their biological structure and ecological functioning. Some assemblages of biota are dependent on the dynamics of these salt-wedge estuaries for their existence, refuge, increased productivity and reproductive success. The ecological community is characterised by a core component of estuarine-endemic (‘true estuarine’) taxa, along with an associated component of coastal, estuarine, brackish and freshwater taxa that may reside in the estuary for periods of time and/or utilise the estuary for specific purposes (e.g. reproduction, feeding, refuge, migration). The composition and abundance of taxa may vary between the different salt-wedge estuaries, as well as at different phases of salt-wedge emplacement, presence or reduction (see Section 1.5). Further information on the biology and ecology of the ecological community is at Appendix C3 and C4.
7

1.1. Name of the ecological community and associated rationale
The ecological community is named Assemblages of species associated with open-coast salt-wedge estuaries of western and central Victoria ecological community (hereafter referred to as the ‘Salt-wedge Estuaries ecological community’ or the ‘ecological community’).
The description of the ecological community has been refined from an original public nomination to list a broader ecological community, ‘The community of estuarine species dependent on salt-wedge estuaries of southern Australia’ that was placed on the 2012 Finalised Priority Assessment List.
The original nomination contained 157 potential salt-wedge estuaries in Victoria, Tasmania, South Australia, southern New South Wales and southern Western Australia. These estuaries can be classified into ‘natural’ subsets across the geographical expanse of southern Australia based on differences in climate, oceanography (i.e. influence of major currents, wave and tidal energy), biogeography (i.e. speciation patterns, paleo-barriers) and threats (McSweeney et al. 2017).
In particular, biogeography is recognised as an important framework for describing patterns of biodiversity (Edmunds et al. 2000; Waters et al. 2010). This Salt-wedge Estuaries ecological community therefore spans a unique region defined by the overlap of the Flindersian and Maugean marine biogeographical provinces (after Bennett & Pope 1953 in Edmunds et al. 2000) (Figure 1). This region has a distinctive east to west pattern for many marine taxonomic groups, with lineages of marine invertebrates common to central and western Victoria typically not detected east of Wilsons Promontory (Edmunds et al. 2000; O’Hara & Poore 2000; Waters & Roy 2003; Hirst 2004, Waters et al. 2010; Colgan 2016). Walters et al. (2005) suggest that the flow characteristics of the East Australian Current and Leeuwin Current have helped to maintain this biogeographical disjunction (see also Chiswell et al. 2003).
This Conservation Advice and Listing Assessment is focused on a ‘naturally’ occurring subset of estuaries, that is, the salt-wedge estuaries of central and western Victoria. The grouping of 25 salt-wedge estuaries that the ecological community occurs within, in the main, concur with classification studies of Victoria’s estuaries (Barton 2003, 2006; Barton et al. 2008). Of a range of factors investigated, the nature of the coast (open or sheltered) and direction of the coastline, were considered most practical for grouping Victoria’s estuaries for biological factors and management purposes (Barton et al. 2008). In relation to Barton’s et al. (2008) groupings, this ecological community occurs within salt-wedge estuaries on the open-coast in the South Australia and Victoria border to Cape Otway group (with west facing mouths), the Cape Otway to just before Port Phillip Bay group (with east facing mouths), and east of Westernport Bay to Wilsons Promontory (with west facing mouths).
1.2. Location, physical environment, climate and hydrodynamics
The Salt-wedge Estuaries ecological community occurs along the western and central coastlines of Victoria between the border of South Australia and Victoria and South Point of Wilsons Promontory (see Map 1). Growing evidence supports that Wilsons Promontory has considerable biogeographical significance for Australia’s southern temperate marine region (Waters et al. 2005). Wilsons Promontory represents the northern extension of a granite ridge in the Bass Strait region that was not breached until sea levels exceeded -50 m around 10 000 years ago (Davies 1974). It is considered a biogeographical disjunction, or palaeogeographical barrier (i.e. the
8
Bassian Isthmus), for Australia’s temperate marine fauna (Waters et al. 2004, 2005, 2010; Colgan 2016).
The ecological community lies adjacent to the IMCRA v4.0 Marine Bioregions of Otway, Central Victoria and a small section of Flinders (Figure 2). There are no salt-wedge estuaries in the South Australian component of the Otway bioregion, although a small component of the Glenelg River passes briefly into terrestrial South Australia. The distance from the Glenelg River (the most westerly estuary) to Growlers Creek (the most easterly estuary) along the coastline is 743 km (including the straits of Port Phillip Bay and Western Port Bay, which combined are 32.5 km). The latitude and longitude, lengths of salt-wedge penetration, average width and estimated surface area of each estuary that the ecological community occurs within are provided in Table 1.
The region of the ecological community corresponds with a temperate, maritime and Mediterranean climate which is characterised by peak late-winter to early-spring rainfall, and warm, dry summers. This ‘winter-wet, summer-dry’ pattern results in seasonal changes in river/estuary discharge. Peak discharges in late-winter to early-spring (August–September) are typically up to twenty times higher than the autumn minima in March–April (Mondon et al. 2003) (Figure 3). The Victorian coast west of Wilsons Promontory receives rainfall of around 500–700 mm per year, usually with a winter maximum (Grose et al. 2015). The variation in freshwater input results in significant seasonal changes to salinity within estuaries (Sherwood 1985) and also influences the length of salt-wedge penetration (Mondon et al. 2003).
9

10

Table 1: The location coordinates and physical description of each estuary that the ecological community occurs within, from the South Australia/Victoria border to Wilsons Promontory. [Note: To contain the listed entity, estuaries need to be ≥ 1 km in length and ≥ 1.5 m in depth, and are also excluded if they are too modified/marinised prior to listing].
Estuary Length (km) *
Mouth Longitude Latitude Av. Width#
(m)
Estimated Surface
Area (ha)
Glenelg River 67.9 Intermittent 140.988595 -38.059238 81552.0
Surry River 7.0 Intermittent 141.703086 -38.259308 26 18.0
Fitzroy River 12.9 Intermittent 141.855085 -38.262486 28 36.5
Eumeralla River (Lake Yambuk) 8.1 Intermittent 142.044417 -38.337988
124100.0
Merri River (East) 7.4 Intermittent 142.471169 -38.40158 361 54.1
Hopkins River 9.6 Intermittent 142.508439 -38.40219 170 163.3
Curdies Inlet 18.6 Intermittent 142.880747 -38.608183 186 346.6
Port Campbell Creek 2.8 Intermittent
142.990555 -38.620555 811.6
Sherbrook River 1.9 Intermittent 143.032400 -38.385500 263.0
Gellibrand River 13.8 Intermittent 143.156592 -38.706124 28 33.7
Johanna River 2.4 Intermittent 143.387777 -38.769999 124 1.9
Aire River 8.0 Intermittent 143.460526 -38.806664 361 103.0
Barham River 2.8 Intermittent 143.675635 -38.762782 170 13.6
Kennett River 1.2 Intermittent 143.853611 -38.668055 13 1.5Wye River 1.0 Intermittent 143.890000 -38.636666 5 0.5
St George River 1.5 Intermittent 143.975277 -38.536666 17 2.5
Erskine River 1.0 Intermittent 143.978333 -38.533888 33 3.3
Painkalac Creek 3.6 Intermittent 144.100911 -38.468704 3512.5
Anglesea River 2.6 Intermittent 144.191308 -38.414485 65 17.0
Spring Creek 2.1 Intermittent 144.318653 -38.343317 20 4.1
Thompson Creek 5.5 Intermittent 144.377109 -38.303062 47 25.8
Powlett River 8.6 Intermittent 145.511527 -38.584201 35 30.0
Darby River 1.1 Intermittent 146.269 -38.973 21 2.4
Tidal River 2.4 Intermittent 146.314445 -39.032913 34 8.2
Growlers Creek 1.3 Intermittent 146.341 -39.061 55 7.1
TOTAL 1542.2
* Maximum length of salt-wedge penetration, average estuary width, (after Mondon et al. 2003, Barton et al. 2008 and Pope et al. 2015). Note: for estimated surface area of estuary, polygons were derived from Vicmap Hydro watercourses and water area parcels with additional seaward boundaries derived from the vcst25g_coastline database. Estuary Head position and mouth type reviewed and surveyed as described in metadata of Pope et al. (2015).
# Average width determined by back calculation of estimated surface area using mapping techniques and known length of salt-wedge estuary (A. Pope pers. comm. 2016).
11
12
MAP 1: DISTRIBUTION MAP

Mean Monthly Discharge (Gigalitres)
020406080
100120140160180200
Jan Mar May Jul Sep NovMonth
Q(G
L/m
onth
)
GellibrandGlenelgHopkinsBarwon
Figure 3. Variation in discharge levels with season at the Gellibrand, Glenelg, Hopkins and Barwon rivers (Mondon et al. 2003). (Note, the Barwon River estuary is not part of the ecological community).
Salt-wedge hydrodynamics
The main factors that drive salt-wedge dynamics and the diversity, distribution and habitat of biota in the ecological community are hydrology, salinity, regional climate, transport of sediment, nutrients and carbon, and connectivity (Newton 1994; Rogers & Ralph 2011; Pope et al. 2015). These factors combine to influence processes such as salinity stratification, water mixing, erosion, and transport and deposition of sediments and organisms.
The basic ecological processes are subject to disturbances including water extraction, river regulation and climate change. Ecosystems and biota have a degree of resilience, and given time, can adapt to cope with many disturbances. However, there are limits that, once exceeded, may change the ecological character and functional integrity of the ecological community.
1.3. Reference Condition
Establishing an appropriate reference condition is important to enable robust detection of any significant deviations in condition and appropriate management responses (Hallet et al. in press). With respect to the Salt-wedge Estuaries ecological community, the use of pre-European (or pre-regulation) conditions is not practical. Rather, a useful reference condition for the ecological community may be the ‘typical’ period of flow regime and salt-wedge dynamics as experienced in the mid to late 1980s and early 1990s (i.e. prior to the Millennium Drought). The Hopkins River estuary has been studied extensively (Barton et al. 2008) and was found to be in a ‘typical’ and highly productive condition during that period (Newton 1994, 1996; Walsh 1994; Walsh & Mitchell 1995). The Hopkins River estuary during that period thereby constitutes an effectively functioning reference condition for the Salt-wedge Estuaries ecological community.
1.4. Biota
Figure 4 illustrates the functional groups that make up an ecological community (DEE & TSSC 2017). The core species of an ecological community include those that are dominant; frequently occurring; endemic or functionally important (green zone in Figure 4). It is the co-occurrence of these species in a particular area that makes an ecological community unique. Transitory,
13

migratory or opportunistic species may form part of the ecological community (blue, purple and orange zones in Figure 4). Contra-indicative or stray species are not considered part of the ecological community (red zone in Figure 4).
1.4.1. Flora and Protista
Primary producers of the ecological community, or its buffer zones, include phytoplankton and protists (see Appendix A1 and Table 2). These occur in the water-column, on associated substrates, on submerged or intermittently submerged riparian vegetation along the estuary margins (e.g. Phragmites australis, Ruppia spp., Potamogeton crispus, Triglochin procera) and on seagrass beds in lower to mid reaches (e.g. Zostera muelleri) (Newton 1994; Walsh 1994; Ierodiaconou & Laurenson 2002). Flora and protista species are likely to vary across the different estuaries within the ecological community. Fringing wetlands adjacent to the main channel may occur and, although not part of the ecological community, are included in associated buffer zones.
Phytoplankton are typical marine and estuarine flora, the majority of which are diatoms (Rouse 1998). In the Hopkins River estuary, Rouse (1998) recorded 55 species of diatom and seven species of dinoflagellate (see Appendix A1). Common and often abundant diatoms of the ecological community are likely to be species of genera Pleurosigma and Synedra, which occur in the water-column and in benthic and epiphytic habitats (i.e. microphytobenthos). Other common members of the microphytobenthos are the diatoms Navicula and Nitzschia species. The colony forming diatoms Melosira and Nitzschia (Bacillaria) paradoxa may also be common in the water-column. Dinoflagellates are present in the Hopkins River and most likely the other estuaries, with Prorocentrum minimum, Dinophysis caudata and Ebria tripartita often abundant in low flow periods (Newton 1994; Rouse 1998). Nanophytoplankton (2–20 µm) is likely to form a dominant fraction at times (Newton 1994; Perissinotto et al. 2010). During high flow periods, freshwater blue-green algae (e.g. Oscillatoria, Ankistrodesmus), green algae (e.g. Oocystis and Eudorina) and desmids (e.g. Closterium and Staurastrum) are likely to be present in the water-column. Other protists such as anaerobic ciliates and photosynthetic sulphur bacteria may also be important in the deeper anaerobic/anoxic waters (Rouse 1998).
14

Figure 4: Illustrative mixture of species comprising an ecological community (DEE & TSSC 2017).
1.4.2. Fauna
Salt-wedge estuaries provide habitat and food resources for a diverse range of faunal species that make up the ecological community. Zooplankton, principally copepods, constitute the major secondary producers and drivers of productivity in the ecological community. Copepods live permanently in the water column (i.e. holoplankton), while a large proportion of the zooplankton assemblage consists of the larvae of benthic and nektonic fauna (i.e. meroplankton). Meiofauna (e.g. harpacticoid copepods, amphipods), the small invertebrates that inhabit aquatic sediments and submerged vegetation, are also important in the transfer of energy through the ecosystem. Larger benthic and nektonic fauna include polychaete worms, molluscs, crabs, shrimp and fish. Estuarine fish species such as Acanthopagrus butcheri (black bream) and Macquaria colonorum (estuary perch) are apex predators. Functional groups and dominant taxa of the ecological community are provided in Table 2, Appendix A2 (zooplankton) and Appendix A3 (fish).
Table 2: Functional groups and/or dominant taxa that utilise the western and central Victorian salt-wedge estuaries and form the faunal components of the ecological community (Newton 1994, 1996; Walsh & Mitchell 1995; Arundel 2003; R Shiel pers. comm. 2016; see Appendix A).
TAXA - Type TAXA - ExamplesCore Estuarine Endemics (green and orange zones in Figure 4 -typically species which live & propagate only in the estuary proper; true estuarine species; often keystone species)
Diatoms - benthic (e.g. Pleurosigma, Synedra), colonial (e.g. Melosira) and pelagic (e.g. Chaetoceros)
Holoplankton grazers (secondary producers) – Calanoid copepods (e.g. Gippslandia estuarina and Gladioferens pectinatus)
Holoplankton predators – Calanoid copepods (e.g. Sulcanus conflictus); Cnidarian (Australomedusa baylii)
Meroplankton (larvae of benthic and nektonic fauna) – crab zoea (e.g. Amarinus laevis and A. paralacustris); spionid polychaete larvae (e.g. Carazziella victoriensis, Prionospio tatura, Orthoprionospio cirriformia); caridean shrimp larvae (e.g. Paratya australiensis); bivalve larvae; fish larvae
Meiobenthic/Phytal – Harpacticoid copepods (e.g. Ectinosomatid spp.,
15

Mesochra spp., Amphiascoides spp. nov., Onychocamptus chathamensis, Australonannopus aestuarinus)
Macro-invertebrate benthos –spionid polychaete (e.g. Carazziella victoriensis, Prionospio tatura, Orthoprionospio cirriformia), shrimp (e.g. Paratya australiensis estuarine form)
Nekton - Fish – Acanthopagrus butcheri (black bream), gobies (e.g. Pseudogobius olorum (bluespot goby))
Estuary Dwellers/Residents (blue and orange zones in Figure 4 - common/abundant species that may live and reproduce in the estuary but are not necessarily estuarine-endemic)
Dinoflagellates (mostly marine neritic forms (e.g. Dinophysis caudate) Seagrasses (e.g. Zostera muelleri and Heterozostera tasmanica) Rotifers – brackish species (e.g. Brachionus plicatilis, Lecane spp., Keratella
spp.) Meiofauna/Benthic Macroinvertebrates – harpacticoid copepods, cyclopoid
copepods, ostracods, nematodes, polychaetes (e.g. Australonereis ehlersi (nereid)), molluscs (e.g. Soletellina alba), crabs (e.g. Amarinus spp.); caridean shrimp (e.g. Macrobrachium intermedium, Palaemon serenus)
Nekton - Fish – Macquaria colonorum (estuary perch), gobies (e.g. Arenigobius bifrenatus (bridled goby)), and gudgeons (e.g. Philypnodon grandiceps (flat-head gudgeons))
Seasonal Dependents/ Opportunists (purple and orange zones in Figure 4 - species that utilise the estuary (and associated riparian and wetland zones) periodically for migrations, and/or opportunistically for reproduction, or feeding)
Freshwater phytoplankton (during high flows) diatoms, algae, blue-green algae Rotifers – freshwater species (e.g. Brachionus spp., Keratella spp. Cladocerans – e.g. Daphnia spp., Bosmina meridionalis, Alona spp. Marine/Freshwater fish – for nursery function/reproduction (e.g. marine
Engraulis australis (anchovy)); Galaxias maculatus (common galaxias)); Prototroctes maraena (Australian grayling))
Euryhaline-marine group – e.g. larvacean, Oikopleura dioica; Catostylus mosaicus (jelly blubber)
Birds – various waterbirds and waders (some migratory), and riparian passerines, raptors, parrots
Incidental Strays (red and orange zones in Figure 4)
Note: NOT THE ecological community but may occur in the estuary at times
Freshwater strays (i.e. during flood events) – Calanoid copepods (e.g. Brachionus spp.); rotifers (e.g. Brachionus spp., Keratella spp., Filinia longiseta); cladocerans (e.g. Alona spp., Bosmina meridionalis, Chydoris spp., Daphnia spp.)
Marine strays (i.e. from adjacent marine waters during peak tides, astronomical surges) – copepods (e.g. Acartia, Oithona); polychaetes (e.g. Carazziella spp., Polydora spp.); fish larvae (e.g. Clinidae, Tetraodontidae, Tripterygiidae); seabirds (e.g. gannet, shearwater)
2. GUIDANCE FOR DETERMINING WHETHER THE SALT-WEDGE ESTUARIES ECOLOGICAL COMMUNITY PROTECTED UNDER THE EPBC ACT IS PRESENT
2.1. Overview
National listings complement State environment laws by enhancing the protection of those components of Australia’s biodiversity most at risk of extinction. Key diagnostic characteristics assist in identifying the threatened ecological community protected under national environment law, the EPBC Act.
For some nationally-listed ecological communities, condition classes and thresholds are specified to focus legal protection on patches that remain in relatively good condition, and retain their natural composition and ecological function to a large degree. Due to the largely dynamic nature of the Salt-Wedge Estuaries ecological community and the importance of longitudinal and lateral connectivity, the Committee determined that, in this case, condition thresholds do not apply.
16

2.2. Key Diagnostic Characteristics
The listed ecological community has the key diagnostic characteristics as outlined in Table 3. The key diagnostic characteristics are a summary of the main features from the description for the ecological community. They assist with determining whether the ecological community is present at a particular time and place. The main features of the ‘physical expression’ of the ecological community serve as a proxy for the diagnostic biological components mentioned in the bottom row of Table 3 (i.e. where a salt-wedge is present, an assemblage of the biotic components of the ecological community is likely to occur) and described more fully in Table 2 and Appendix A.
2.3. Boundaries and Buffer Zones
The estuaries of the ecological community each have well defined boundaries, both longitudinally (i.e. mouth to upstream limit of salt-wedge penetration) and laterally (i.e. the river channel, banks and submerged or intermittently submerged riparian and wetland vegetation).
A common method for reducing or eliminating impacts to aquatic resources from adjacent land uses and other pressures is to maintain buffers around the resources. Providing riparian buffers of sufficient width, especially in the headwaters, protects and improves water quality by intercepting and trapping non-point source pollutants and sediments in surface and shallow subsurface water flow (Wenger 1999; Fischer et al. 2000). Some higher level benefits of buffer zones include: maintaining ecological integrity, minimising edge effects, building resilience against climate change and protecting groundwater (Newton 2012). There are four types of buffer zone proposed for the ecological community - upstream, downstream, laterally and groundwater.
Further detail on the distribution range, boundaries and buffer zones of the ecological community are provided in Table 4.
17

Table 3: Key Diagnostic Characteristics (KDCs) of the Salt-wedge Estuaries ecological community. Aspect Key Diagnostic CommentIMCRA Marine Bioregion
Mesoscale bioregions of Otway, Central or Flinders, Victoria
There are no South Australian salt-wedge estuaries in the ecological community.
Province Overlap region of Flindersian and Maugean biogeographic provinces
Occurs from South Australia and Victoria border to Wilsons Promontory.
Coast Adjacent to the southern Australian coastline
Open
Within the state of Victoria Open-coast as opposed to an Embayment or Inlet.
Climate Temperate and typically ‘Mediterranean’ – with peak rainfall in late-winter to early-spring and with warm, dry summers
Overlaps with Koppen climate types Csb (Warm-summer Mediterranean) and Cfb (Oceanic, with milder, cloudy winters). [Note: Along the coast, summers and winters are milder due to the nearby presence of cold ocean currents]
Geomorphic Estuary Type
Mainly drowned river valley, barrier built Typically linear but sometimes with lagoons. May have entrance berm/sill.
Estuary Length ≥ 1 kilometre Need a minimum length to ensure adequate dimensions for functional wedge to form.
Width Linear, relatively narrow (apart from lagoons), often with bends
18 estuaries with average width of < 100 m,7 estuaries with average width within 120-400 m
Depth Mainly relatively shallow, but may have some deep pools or basins along length
Wave Energy High wave energy; Wave dominated system As opposed to tide dominated.
Tidal Energy Low tidal energy; microtidal (< 2 m) system Does not include meso-tidal or augmented tidal conditions.
Hydrology River dominated; Net-flow seaward River dominance may wane during extended drought and periods of extreme low freshwater flow.
Salinity A high degree of vertical salinity stratification for much of the time.Dynamic salt-wedge present at least a proportion of the time leading to the three essential phases of: Salt-wedge formation/emplacement Salt-wedge presence/stagnation Salt-wedge retreat/flushing/removal
Estuaries that are naturally fully mixed for most of the time are not the ecological community. All three phases of salt-wedge dynamics need to occur at times to ensure the sustainable health of the ecological community. The time period of each stage will be largely driven by rainfall and river discharge and is variable and unpredictable.A salt wedge will form in these estuaries when flow conditions abate and allow seawater to penetrate them. Given the region's Mediterranean climate such conditions are met in the majority of years. However, longer-term exceptions may occur during extended drought conditions.
Mouth Opening Intermittent (naturally) West or East facing (not South)
Naturally occurring mouth opening and closure is a function of climate, rainfall and discharge. Note: a permanently open or permanently closed mouth is not ideal to ecology/productivity.
Mouth Morphology
Typically presence of a sandbar (berm) and sometimes a sill (rockbar)
A sandbar or berm is formed at the mouth by the high wave energy coast and longshore sand drift. There may be an underlying sill. The sandbar (and sill) influences and often limits tidal exchange of organisms and materials seaward.
Biota (fauna & flora)
Likely to contain species presented in Table 2 and Appendix A (including taxa that may only occur in the ecological community)
There will be variations in species composition across different estuaries. Fringing wetlands adjacent to the main channel may occur and although not part of the ecological community are included in associated buffer zones.
18

2.4. Surrounding environment and landscape/seascape context
In the context of actions that may have 'significant impacts' and require assessment under the EPBC Act, it is important to consider the environment that surrounds the ecological community.
The following indicators are some of the key considerations when assessing the impacts of actions or proposed actions under the EPBC Act, or when considering recovery, management and funding priorities for a particular estuary or area of the ecological community:
adequate hydrological flows (river and tide), with supporting natural seasonal characteristics, (winter/spring) for ecological function, management and monitoring of the intermittent nature of the estuary mouth (including ‘appropriate’ artificial opening), and occurrence of the necessary stages of the dynamic salt-wedge hydrological cycle;
weirs and tidal barrages impede the movement of mobile species and the longitudinal extent of the salt wedge,
fringing wetlands, healthy submerged and riparian vegetation and intact river/estuary banks, including terrestrial native vegetation, support healthy function of the ecological community,
evidence of recruitment of keystone native species or the presence of a range of age cohorts, (e.g. for black bream, shrimp, seagrass and dominant copepods) is indicative of ecosystem health,
species richness, as shown by the variety and proportion of native flora and fauna present, also indicative of ecosystem health and resilience,
presence of listed threatened species, indicative importance as habitat critical to the survival of those species, and
areas of minimal weeds and feral animals that act as buffer zones for the ecological community.
2.5. Area critical to the survival of the ecological community
Areas that meet the key diagnostic characteristics plus an appropriate buffer zone (or other area of influence) are considered critical to the survival of the ecological community.
Of critical importance to the survival of the ecological community is a hydrological regime sufficient to ensure salinity stratification and salt-wedge dynamics, and connectivity and ecological function between the estuary, river and ocean (and floodplain wetland components where applicable).
The area critical to the survival of the ecological community is also considered to be:
the parent river and tributary systems of the estuaries within the ecological community
seasonally submerged and inundated riparian and wetland (where applicable) vegetation associated with each estuary within the ecological community
the beach, sand dune and sandbar structures, and native vegetation that form part of, or are adjacent to, each estuary entrance (mouth) and therefore influence condition of the mouth
the sediments (or cliffs/ridges where applicable) and native vegetation of the banks and associated floodplain (where applicable) of each estuary, and
19

the coastal, tidal marine waters adjacent to each estuary mouth.
20
Table 4: Boundaries and buffer zones for the Salt-wedge Estuaries ecological community.Aspect Boundary Comment
Coastline The Otway & Central Marine Bioregion (IMCRA) which extends along part of the Victorian coastline
No salt-wedge estuaries occur in the South Australia component of the bioregion with the exception of a very small section of the Glenelg, which has its mouth and the majority of its length in Victoria.
Estuary Distribution Range
The 25 estuaries involved in the ecological community occur from just east of the South Australian Border to just west of South Point, Wilsons Promontory
The coastline distance between the Glenelg in the west and Growlers Creek in the east is about 743 km.
Landward boundary per salt-wedge estuary in the ecological community
Defined by the maximum (natural) upstream limit of salt-wedge penetration.
This is usually just before or equivalent to the length of tidal penetration/influence. Some estuaries may have natural landward boundary limits e.g. old lava flow at Tooram Stones for the Hopkins.
Seaward boundary per salt-wedge estuary in the ecological community
Defined by the line drawn between the seaward edge on each side of the estuary mouth.
During high flow periods there may be a ‘plume’ of estuarine/fresh water that extends from the estuary into the adjacent ocean. The plume outside the mouth no longer forms part of the ecological community but does form part of the marine buffer zone.
Vertical The water-column from the surface of the estuary/river to the boundary layer with the bottom substrate, and
The bottom substrate of the estuary from the mouth to the landward boundary.
Lateral The entire channel (or lagoon) width to the littoral margins on each side, including the extent of typically submerged littoral vegetation and seagrass beds.
If downstream seagrass beds are exposed at low tide they still remain part of the ecological community.
Buffer Zones Upstream of the salt-wedge limit is considered a ‘zone of influence’ for the ecological community. Therefore the entire parent river catchment system and tributaries upstream, together with their riparian vegetation, should be considered as a buffer zone.
The adjacent marine region to a radius of 1000 m outside of the estuary mouth, including ocean, beach and dune areas.
A lateral buffer zone of a minimum of 50 m from the lateral edge of the estuary into the typically exposed adjacent riparian zone and associated wetlands (Boyd 2001), intertidal, mud and sand flats, beach and foreshore environments up to the limit that these are affected by extremes in tidal or riverine flood events.*
A 200 m minimum buffer zone for groundwater#. An appropriate buffer may be 2000 m for example.
The buffer zones are not considered part of the ecological community and therefore in their own right do not trigger the EPBC Act. However they should be considered when determining likely ‘significant impact’ on the ecological community.The lateral buffer zone helps to protect bank stability and water quality, and reduce nutrient and sediment inputs, especially from adjacent urban areas. Similar buffer zone distances have been applied to several other ecological communities listed as threatened under the EPBC Act (Newton 2012). The groundwater buffer zone aims to protect against groundwater drawdown and protect inflowing groundwater quality. The variable size depends on the intensity of the likely impacts of the threat (Newton 2012).
* (After Adam et al. 1992)# (After Newton 2012).
21

3. SUMMARY OF NATIONAL CONTEXT
Estuaries and ecosystem services
Estuaries and their wetlands are highly productive areas and ecologically important as they provide habitat and resources for biota, including spawning and nursery areas for fish and invertebrate species, and breeding and foraging areas for birds. Apart from their ecological importance, estuaries are multiple-use resources, being tourist attractions, supporting economic activities and are also valued for recreation (Baron et al. 2003; Costanza et al. 1997). Ecosystem services include flood control, transportation, recreation, purification of human and industrial wastes, and production of fish and other foods or marketable goods (De Groot et al. 2012). Over the long term, resilient, intact ecosystems are more likely to retain the adaptive capacity to sustain production of these services in the face of environmental disruptions such as climate change. Such services are often impossible to replace when aquatic systems become too degraded (Baron et al. 2003).
Bioregional and NRM distribution
The Salt-wedge Estuaries ecological community spans four Interim Biogeographic Regionalisation for Australia (IBRA) bioregions and six IBRA subregions (DEE 2017) (see Appendix B1). The ecological community is located in the three Natural Resource Management (NRM) regions of Corangamite, Glenelg Hopkins and West Gippsland.
EPBC Act protection
The Salt-wedge Estuaries ecological community is relevant to several matters of national environmental significance and other matters protected by the EPBC Act. Parts of the ecological community contain, or are located adjacent to, National Heritage Places, marine reserves and important wetlands. The ecological community also contains and provides habitat and resources for a range of nationally listed threatened and migratory species.
National Heritage Places
There are two listed National Heritage places that occur within the same area as the Salt-wedge Estuaries ecological community (DEE 2017); the Great Ocean Road and Scenic Environs, and the Budj Bim National Heritage Landscape (see Indigenous and cultural context discussion below).
Commonwealth marine reserves
Commonwealth Marine Reserves are managed for the primary purpose of conserving biodiversity, while also allowing for the sustainable use of natural resources in some areas (Director of National Parks 2013). The Apollo Commonwealth Marine Reserve is located outside of the coastal waters zone (Director of National Parks 2013) and therefore the Salt-wedge Estuaries ecological community is not represented within the reserve. However, some species that occur in the reserve, such as Engraulis australis (Australian anchovy), opportunistically utilise the estuaries of the ecological community for feeding and reproduction (Hoedt & Dimmlich 1995).
Ramsar wetlands and nationally important wetlands
There are no Ramsar wetlands located within the boundaries of the Salt-wedge Estuaries ecological community (DEE 2017). However, Piccaninnie Ponds Karst Ramsar wetland is
22

located less than 5 km to the west of Glenelg River estuary in South Australia; Corner Inlet Ramsar wetland is located 5 km to the east of Darby River and Tidal River; Western Port Ramsar wetland is located 10 km west of Powlett River; and Port Phillip Bay (Western Shoreline) and Bellarine Peninsula Ramsar wetland is located 5 km east of Thompson Creek (DEE 2017).
There are several Nationally Important Wetlands located within the region of the ecological community. These are: Glenelg Estuary, Glenelg River, Lower Merri River Wetlands, Aire River, Lower Aire River Wetlands, Yambuk Wetlands Reserve (Eumeralla River) and Princetown Wetlands (Gellibrand River) (DEE 2016). These wetlands and estuaries provide important habitat for migratory bird species, which are protected under international agreements.
Relationships to EPBC Act listed ecological communities
The Salt-wedge Estuaries ecological community differs from most other EPBC Act listed communities by its coastal position in the landscape that is subject to both freshwater discharge and marine tidal influence. There is currently one nationally-listed coastal wetland ecological community, the Subtropical and Temperate Coastal Saltmarsh, which may overlap or form a component within the Salt-wedge Estuaries ecological community (TSSC 2013).
Five other nationally-listed ecological communities have some occurrences that may be located in the vicinity of the riparian zone of the estuaries and/or parent river catchment systems of the Salt-wedge Estuaries ecological community (DEE 2017). These are terrestrial ecological communities which may provide habitat for species that utilise the estuaries of the ecological community for foraging. However, these communities are expected to have limited linkages to the Salt-wedge Estuaries ecological community. These ecological communities are:
Natural Damp Grassland of the Victorian Coastal Plains Grassy Eucalypt Woodland of the Victorian Volcanic Plain Natural Temperate Grassland of the Victorian Volcanic Plain Seasonal Herbaceous Wetlands (Freshwater) of the Temperate Lowland Plains White Box-Yellow Box-Blakely's Red Gum Grassy Woodland and Derived Native
Grassland.
The Giant Kelp Marine Forests of South East Australia is a nationally-listed marine ecological community found in the waters off the coast of Victoria in the Otway, Flinders and Central Victoria bioregions. However, this community is offshore and does not directly connect with the Salt-wedge Estuaries ecological community.
Other existing protection
Level of protection in reserves
The estuaries of the ecological community occur within the boundaries of a range of protected areas – at both state and national level (DEE 2017; Parks Victoria 2017; see Appendix B2). In addition, the Aire River and Glenelg River estuaries are listed as Heritage Rivers under the Heritage Rivers Act 1992 (Victoria). In some areas, the Heritage Rivers Act can prohibit or restrict activities such as constructing barriers, diversion of water, some clearing practices, plantation establishments and domestic animal grazing.
Relationship to state listed vegetation classifications
Victoria formally lists ecological communities as threatened under the Flora and Fauna Guarantee Act 1988. There are no estuarine ecological communities listed in Victoria.
23

Victoria classifies vegetation using a system of Ecological Vegetation Classes (EVCs). The salt-wedge estuaries ecological community best corresponds with two EVCs that are limited to the coastal bioregions in Victoria:
EVC 9 Coastal saltmarsh aggregate, and EVC 10 Estuarine wetland.
Victoria allocates a bioregional conservation status for each EVC in each bioregion that is based on levels of extent and decline (DSE 2007). The status of EVCs 9 and 10 is at Appendix B3.
Nationally threatened species likely to occur in the ecological community
The ecological community contains, and provides habitat and resources for, a wide range of threatened species under the EPBC Act and under the Victorian Flora and Fauna Guarantee Act 1988. A list of threatened species that are likely to occur within the ecological community is at Appendix B4. Many of these species utilise the ecological community and its buffer zones but are not permanent residents or known to be integral to the functioning of the ecological community.
Birds under international agreements
The ecological community is considered to provide critical habitat for several wetland and coastal waterbirds that come under various international agreements. A list of the EPBC Act listed migratory bird species likely to occur in the ecological community is at Appendix B5.
Indigenous and cultural context
The western and central Victorian region has been occupied by Aboriginal people for over 30 000 years (CCMA 2014, 2015). The Salt-wedge Estuaries ecological community, and surrounding areas, would have been occupied by Aboriginal people owing to the proximity to the coastline, access to freshwater, and supply of plant and animal resources (CCMA 2012; GHCMA 2004, 2005). The estuaries would have also been of particular importance for travel and ceremonial activities (CCMA 2014). There are around eight Indigenous nations and their constituent groups in the region of the ecological community, including the Buandig, Gunditjmara, Giraiwurung, Gadubanud, Wathaurong, Boonwurring and Wadawurrung people (AIATSIS 2017).
The Tyrenndarra Indigenous Protected Area (IPA), located in the Fitzroy River catchment, forms part of the Budj Bim National Heritage Landscape and is sacred to the Gunditjmara people (Builth 2004; GHCMA 2006a). The Tyrendarra IPA features the remains of a large, settled Aboriginal community, which systematically farmed eels for food and trade through traditional aquaculture works (weirs, channels and eel traps) (Framlingham 2004; GHCMA 2006a).
Similarly, the Hopkins River has been identified as a significant food source, particularly eels, for local tribes (Framlingham 2004; GHCMA 2005). Stone fish traps have been recorded along the Hopkins River adjacent to apparently natural outcrops of basalt and areas where the river narrows (Hotchin 1980; Schell 1995).
Deen Maar IPA is a coastal property located on the south-west coast of Victoria, bounded by the Eumeralla River and Bass Strait, near the community of Yambuk. It holds spiritual significance to local Aboriginal people and has a spiritual and visual connection with Deen Maar Island (Lady Julia Percy Island) (Framlingham 2004). Remains from conflicts between squatters and Aboriginal people occur on the site (Framlingham 2004). The Deen Maar IPA was also the traditional home of Peek Whurrong speakers of the Dhauwurdwurung (Gunditjmara) Nation, and
24

provided abalone, eels, wild ducks, kangaroos, and plants for food, medicine and housing materials (Framlingham 2004).
Along the coastline, the most common Aboriginal sites are shell middens, where discarded shells have accumulated over time (CCMA 2014). These middens also contain animal bones, artefacts and charcoal. The most common inland Aboriginal sites in the Corangamite region are stone artefact scatters, with campfire remains, scar trees, fish traps and stone houses less common (CCMA 2014).
Existing plans and management prescriptions
A list of existing plans and management prescriptions related to the Salt-wedge Estuaries ecological community is at Appendix B6.
25

4. SUMMARY OF THREATS
The distribution of the Salt-wedge Estuaries ecological community is in an area of relatively high coastline utilisation (including agricultural activities and town centres) which makes this ecological community susceptible to a variety of environmental stressors. The key threats to the ecological community are summarised below. A detailed discussion of the key threats is at Appendix D. A list of corresponding priority conservation and research actions for the ecological community is at Section 6.
Modification of flow regime
The Salt-wedge Estuaries ecological community is threatened by modified freshwater flow regime as a result of the following activities:
Water extraction : Within the catchments of the ecological community, water is extracted and diverted away from parent river systems for domestic, agricultural and industrial use. The impacts of water extraction on the ecological community include reduced downstream freshwater flows to estuaries, altered seasonal flow patterns, reduced flushing of estuaries, longer periods of mouth closure and poor water quality. More than half of the estuaries within the ecological community are directly threatened by water extraction. An additional 25 percent of estuaries within the ecological community are considered to be potentially threatened by water extraction (see Figure 5a).
Artificial opening of estuary entrances : Within the ecological community, 60 percent of estuaries are threatened by the mechanical opening of estuary entrances (see Figure 5b). Artificial opening is undertaken to prevent flooding to surrounding land. However, this activity can cause the top freshwater layer of the salt-wedge estuary to be lost (drained out to sea), leaving behind the poorly oxygenated saline layer. This results in mortality of biota (e.g. fish kills) and disruption to biological processes, including faunal migration and spawning.
Infrastructure : Regulatory infrastructure, such as reservoirs and weirs, and other major infrastructure, such as bridges, can form physical barriers, significantly alter natural flow regimes and alter natural physical and biological in-stream processes. Most estuaries within the ecological community contain regulatory and/or other infrastructure within the estuary itself or parent river system. It is considered that 40 percent of the estuaries within the ecological community are threatened by altered hydrological processes and restriction on movement of biota due to regulatory infrastructure, the main types being reservoirs and diversion weirs.
Climate change
The effects of human-induced climate change, including reduced rainfall, rising temperature, sea level rise, increased storm activity and ocean acidification, are anticipated to significantly threaten the ecological community. Over time, these changing environmental factors are predicted to substantially alter the spatial extent, hydrology, water quality, ecological processes and aquatic biota of salt-wedge estuaries. Given the occurrence of other stressors, the ecological community is likely to be particularly sensitive to the added impacts of climate change. All 25 estuaries in the Salt-wedge Estuaries ecological community are considered to be threatened by climate change.
26

Reduction in water quality
Intensification of land use for urbanisation, industry and agriculture (including clearing of vegetation) has a significant impact on estuarine water quality. Within the ecological community, 92 percent of the estuaries are affected by land use (see Figure 5c). The key impacts to the Salt-wedge Estuaries ecological community from land use are:
Eutrophication and algal blooms : accelerated nutrient input from land use activities (e.g. agriculture) has led to increased frequency of algal blooms in the ecological community. The implications of algal blooms include altered levels of dissolved oxygen, shading of seagrasses, toxicity and mortality of aquatic organisms. Within the ecological community, almost 90 percent of estuaries are threatened by increasing rates of eutrophication and algal blooms (see Figure 5d).
Erosion, sedimentation and turbidity : land use activities have resulted in increased rates of erosion, runoff and sediment entering the waterways of the ecological community. The implications of increased erosion, turbidity and sedimentation of estuaries include degradation of aquatic habitat, smothering of seagrass and benthic biota, and altered biological processes (e.g. reduced photosynthesis, growth and development, and oxygen uptake). Within the ecological community, almost 70 percent of estuaries are considered to be threatened by increasing rates of erosion, sedimentation and turbidity, with an additional 24 percent of estuaries potentially threatened (see Figure 5e).
Acid flows and blackwater events : acid flows (from exposed acid sulphate soils) and blackwater events (from high levels of organic matter) have significant impacts on the biota of affected estuaries. The implications include widespread mortality of aquatic organisms (e.g. fish kills). Although only 16 percent of estuaries within the ecological community are currently threatened by acid flows and blackwater events, 80 percent of estuaries within the ecological community are considered to be potentially threatened by these events in the future.
Pollution : direct and indirect pollution of estuaries from land use activities has resulted in degradation of aquatic habitat and reduced water quality (e.g. acidification, eutrophication and hypoxia). Within the ecological community, 80 percent of estuaries are considered to be threatened by pollution (see Figure 5f).
Pathogens and parasites
Disease causing pathogens and parasites are a significant threat to estuarine communities as they can alter species’ physiology, behaviour and reproduction, and cause widespread mortality in affected populations. Four estuaries within the Salt-wedge Estuaries ecological community are currently known to be affected by pathogens and parasites. The remaining estuaries of the ecological community are considered to be potentially threatened in the future.
Invasive species
Estuarine communities are often threatened by invasive species, the implications of which include competition for resources, predation on native species, and alteration and degradation of habitat. Just over half of the estuaries within the ecological community are considered to be substantially threatened by invasive species (see Figure 5g).
27

Extractive and recreational activities
The key extractive and recreational activities that threaten or potentially threaten the Salt-wedge Estuaries ecological community are:
Commercial and recreational fishing : The level of impact from fishing is reduced through state-based regulation. However, all estuaries within the ecological community are threatened by the cumulative effects of overfishing and unlawful, poor fishing practices, the implications of which includedepletion of numbers, habitat disturbance and pollution.
Mining and sand extraction : At least one estuary, the Anglesea River, is threatened by the ongoing impacts of coal mining, and another estuary, the Glenelg River, is threatened by upstream sand extraction.
Recreational boating : Just under half of the estuaries within the ecological community are threatened by unintended consequences from recreational motor boating, such as seagrass disturbance and bank erosion.
Figure 5a Figure 5b
28
56%
24%
20%
Estuaries threatened by water extraction
Threatened Potentially threatened Not threatened
60%
40%
Estuaries threatened by artificial opening
Figure 5c Figure 5d
Figure 5e Figure 5f
29
68%
24%
8%
Estuaries threatened by erosion, turbidity and sedimentation
80%
12%
8%
Estuaries threatened by pollution
92%
8%
Estuaries threatened by land use
88%
4%8%
Estuaries threatened by eutrophication and algal blooms

Figure 5g
Figure 5a-g: Pie charts showing percentage of estuaries in the Salt-Wedge Estuaries ecological community that are threatened with extinction by the identified key threats. See Table E3 and Appendix D for more detailed information on threats to the ecological community, including references.
30
52%48%
Estuaries threatened by invasive species

5. RECOMMENDATIONS BY THE THREATENED SPECIES SCIENTIFIC COMMITTEE
5.1. Recommendation on eligibility for listing against EPBC Act criteria
The Regulations of the EPBC Act provide six criteria to determine whether an ecological community is eligible for listing. The assessment of the Salt-wedge Estuaries ecological community against the criteria is summarised below. A comprehensive assessment of eligibility for listing against the EPBC Act criteria is provided at Appendix E.
Criterion 1 – Decline in geographic distribution
Criterion 1 is met if the ecological community’s geographic distribution has substantially declined.
Within the past 50 years, there has been some decline in geographic distribution (area of occupancy) of the ecological community. For example, in the west, the estuaries of Wattle Hill Creek and the Moyne River have been permanently opened and modified to such a degree that they have become marinised systems (i.e. marine dominated) and are considered irreversibly lost to the ecological community. However, at present, the Committee does not consider decline in the geographic distribution of the ecological community to be substantial (i.e. >30% lost). Therefore the ecological community is not eligible for listing under this criterion.
Criterion 2 –Limited geographic distribution coupled with demonstrable threat
Criterion 2 is met if the ecological community has a limited geographic distribution and the nature of that distribution, when coupled with demonstrable threat/s, makes it likely that the threat/s could cause it to become extinct.
The ecological community has a naturally restricted geographic distribution (area of occupancy < 100km2). It consists of a series of relatively linear, narrow and short estuarine sections of the parent river systems. The naturally restricted geographic distribution and specific physico-chemical regime of these highly stratified, dynamic salt-wedge systems, combined with demonstrable, ongoing, compounding and often intensifying, multiple threats represent a significant risk of the loss (extinction) of the Salt-wedge Estuaries ecological community. Certain threats, such as permanent oceanic breaching, permanent mouth opening or closure (natural or artificial), significant water extraction or diversion, could lead to the loss of a number of individual salt-wedge estuary systems in the ‘immediate’ future (e.g. through marinisation and replacement of estuarine biota with coastal marine species). The determination is that the ecological community overall could be lost in the near future therefore the relevant elements of Criterion 2 have been met to make it eligible for listing as Endangered.
Criterion 3 – Loss or decline of functionally important species
Criterion 3 is met if there has been a substantial decline in a population of a native species that is likely to play a major role in the ecological community, to the extent that restoration of the ecological community is not likely to be possible in the medium-term future.
It is acknowledged that there has been significant decline or loss of keystone species within the ecological community (see Criterion 4) over the past 10 to 20 years. For example, the ecosystem engineer Zostera muelleri and the calanoid copepod Gippslandia estuarina have become almost locally extinct in the Hopkins River estuary. However there are currently insufficient data to
31

determine the level of loss or decline of these functionally important species across the range of the ecological community. Therefore, for the purposes of the current assessment, there is insufficient information to determine the eligibility of the ecological community for listing under this criterion.
Criterion 4 – Reduction in community integrity
Criterion 4 is met if there has been a substantial reduction in an ecological community’s integrity across most of its geographic distribution, as indicated by a substantial degradation of the community or its habitat, or by a substantial disruption of important community processes.
The combined impact of multiple and cumulative threats (in particular water extraction, climate change, agricultural/urban development, and pathogens) have reduced the integrity of the ecological community through:
disruption or loss of natural salt-wedge dynamics
o loss or decline in the annual hydrological cycle of salt-wedge: including loss or projected reduction in salinity stratification and increased threat of marinisation; loss or projected reduction in area of functional halocline; loss of natural flushing floods
o decline in functional intermittent mouth condition (Appendix C2), including more extended periods of closure and inappropriate ‘artificial’ opening
o loss of connectivity between the estuary and the ocean (through increased mouth closure), and the estuary and the river and associated riparian and wetland floodplains (through decreased flows at the appropriate season)
declining water quality
loss of keystone biodiversity and related function
decline or loss of fish spawning cues and habitat, and compromised survival of estuarine fish larvae, and
infection of copepods by ‘new’ viral pathogens.
These reductions in integrity have impaired the resilience and function of the ecological community right across its range. This will further exacerbate the continued and combined impacts of the various threats. In particular, the disruption to salt-wedge dynamics, the loss of keystone and ecosystem engineer species, and widespread pathogen infection are cause for concern.
The Committee considers that the change in integrity experienced by Salt-wedge Estuaries ecological community is severe and restoration across the extent of the ecological community is unlikely in the near future. Therefore, the ecological community is eligible for listing as Endangered under this criterion.
Criterion 5 – Rate of continuing detrimental change
Criterion 5 is met if there is either (or both): a serious rate of continuing decline in an ecological community’s geographic distribution, or of a population of a native species that is believed to
32

play a major role in the community; or a serious intensification across most of its geographic distribution in degradation, or disruption of important community processes.
Sea levels continue to rise and the IPCC reports that climate change-related sea level rise is projected to accelerate in the 21st century (Church et al. 2013b). This detrimental change represents a serious intensification of sea level rise across the ecological community's geographic distribution.
Similarly, the rate of temperature rise, both atmospheric (which affects estuarine surface waters) and sea surface temperature (which affects seawater entering the estuaries of the ecological community), has intensified and is projected to continue rising at an increasing rate.
In particular, temperature is a key driver of physiological and behavioural functioning of estuarine biota, and may lead to disruption of key ecological processes, including:
primary and secondary productivity nutrient cycling spawning/reproductive behaviour, and the hatching of dormant life history stages.
The rate of continuing detrimental change in the ecological community is substantial as indicated by a serious intensification in the disruption of a key drivers of important community processes, i.e. salt-wedge dynamics, salinity stratification, salinity regime and mouth condition. In light of the substantial rate of continuing detrimental change of these two key climate change impacts, rising sea level and rising temperature, and their projected continuing change, the ecological community is eligible for listing as Vulnerable under this criterion.
Criterion 6 – Quantitative analysis showing probability of extinction
There are no quantitative data available to assess this ecological community under this criterion. Therefore, for the purposes of the current assessment, there is insufficient information to determine the eligibility of the ecological community for listing under this criterion.
5.2. Recommendation on Recovery Plan
A Recovery Plan is not recommended at this time because the Conservation Advice sufficiently outlines the priority research and conservation actions needed for the Assemblages of species associated with open-coast salt-wedge estuaries of western and central Victoria ecological community. There are also a number of existing documents, including management plans, for conservation and threat abatement that support these recovery actions. Additionally, the Estuary Entrance Management Support System (EEMSS 2007) is used to advise the Victorian government of all risks to assets and natural resources associated with opening an estuary artificially. The benefits of listing the ecological community and implementation of the recovery and threat abatement priorities and actions are specified in this Conservation Advice. It is recommended that the priority research and conservation actions in the Conservation Advice and this decision be considered for review within five years, after evaluating the effectiveness and completeness of the actions.
33

6. PRIORITY RESEARCH AND CONSERVATION ACTIONS
Conservation objective
The conservation objective is to mitigate the risk of extinction of the Salt-wedge Estuaries ecological community, assist recovery and maintain its biodiversity and function, through:
protection under the EPBC Act; and
implementation of management and recovery through the recommended priority conservation and research actions (as outlined below).
The three key approaches to achieve the conservation objective are:
PROTECT the ecological community to prevent further loss of extent and condition.
RESTORE the ecological community within its original range by active abatement of threats and other conservation initiatives.
COMMUNICATE, ENGAGE WITH AND SUPPORT researchers, catchment management authorities (CMAs), land and water managers, land use planners, landholders and community members, including the Indigenous community, to increase understanding of the value and function of the ecological community and encourage their efforts in its protection and recovery.
In assessment of activities that may have a significant impact on the ecological community, the relevant actions listed below should be considered when determining recommendations, including conditions of approval. Applications to Australian Government funding programs should consider prioritising the restorative activities that work toward a healthy and sustainable ecological community.
6.1. Priority protection, conservation management and recovery actions
Priority actions are recommended for the abatement of threats and to support recovery and rehabilitation (where appropriate) of the ecological community. Actions inconsistent with these recommendations that are likely to significantly affect the ecological community should be avoided.
6.1.1. Protect
Hydrology and water quality
High priorities
Maintain the natural, three phase flow regime required for salt-wedge dynamics by ensuring that estuary mouths remain open at frequencies, for durations, and with passing flows, sufficient to maintain natural seasonal hydrological regimes. The EEMSS (2007) should be used to provide guidance on artificial opening of estuary mouths.
Ensure that surface water and ground water extraction, major riverine regulatory infrastructure (e.g. reservoirs) and other infrastructure (e.g. bridges) do not significantly alter the current hydrology of estuaries within the ecological community.
34

Minimise water quality impacts caused by run-off into rivers and estuaries, including pollution, increased nutrients (leading to eutrophication), chemical contamination, turbidity and sedimentation within estuaries by protecting buffer zones and implementing measures to reduce erosion within river catchments.
Other priorities
Develop and implement strategies to mitigate and manage acid flows and undertake risk assessments to identify areas of potential and active acid sulphate soils.
Habitat disturbance and modification
Prevent impacts to native vegetation, fauna and substrate from any actions within, adjacent to or near the ecological community by planning for, avoiding or mitigating off-site impacts. Apply recommended buffers (refer to Table 4) around the ecological community and avoid activities that could cause significant change to hydrology or water quality e.g. dredging, deposition of spoil, aquaculture facilities or major construction projects such as marinas. Wider buffers may be required where there is larger scale landscape change.
Climate Change
Enhance the resilience of the ecological community to the impacts of climate change by reducing other pressures.
Invasive Species
Eradicate or manage threatening weed infestations, such as willows, associated with riparian and adjacent wetland vegetation using appropriate methods.
Ensure that chemicals or other mechanisms used to eradicate weeds in the surrounding landscape do not have adverse impacts on the ecological community.
Pathogens and parasites
Minimise outbreaks of viruses (e.g. iridovirus in copepods) and fungal disease (e.g. Epizootic Ulcerative Syndrome or Red Spot Disease in fish) within the ecological community by maintaining optimum water quality and reducing other disturbance pressures.
6.1.2. Restore
Implement appropriate management to improve water quality and restore natural river flows with seasonal high and low flow cycles that support the periodic seasonal salt-wedge flushing and formation to build resilience of the ecological community and facilitate natural ecological function.
Undertake restoration of riparian and buffer zones, seagrass, Ruppia beds and other in-stream habitat areas (including low-flow refuges) where they have been degraded or lost.
35
In conjunction with appropriate research and monitoring, consider reintroduction of lost or depleted biota, including keystone species.
6.1.3. Communication and Engagement
Education, information and local regulation
Develop a communication strategy, education programs, information products and signage to help local communities, planners and managers recognise:
- when the Salt-wedge Estuaries ecological community is present and why it is important to protect it
- how to appropriately support and manage the ecological community to enhance its biodiversity and ecology, including responsible management of the estuary mouth, and
- responsibilities under state and local regulations and the EPBC Act.
Promote knowledge about deoxygenation, blackwater events and fish kills, how these events impact the ecological community and strategies to mitigate these impacts (recognising that these events can also occur naturally).
Promote awareness and protection of the Salt-wedge Estuaries ecological community with relevant agencies and industries. For example with:
- state and local government planning authorities (such as CMAs), to ensure that planning takes the protection of rivers and estuaries into account, with due regard to principles for long-term conservation
- community groups, such as Estuary Watch
- local councils and state authorities, to ensure water extraction, riverine regulatory infrastructure and actions undertaken within or adjacent to the ecological community, do not adversely impact the ecological community
- landholders and farmers, to minimise water quality impacts from agricultural land use, such as pollution from chemicals and fertilisers, increased turbidity from erosion and altered hydrology, and
- recreational fishers and fishing industry, to ensure that fishing practices do not adversely impact the ecological community.
Incentives and support
Support opportunities for traditional owners or other members of the Indigenous community to engage with and manage the ecological community.
Encourage local participation in recovery efforts (e.g. revegetation of seagrass beds and riparian zones), removing threats and actively maintaining the ecological community. Support on-ground action and integrated management for invasive flora and fauna, including common carp, willows and weeds.
Develop coordinated incentive projects to encourage conservation and stewardship on adjacent private land and those with significant tributaries flowing into the ecological community and link with other programs and activities, especially those managed by regional catchment councils.
6.2. Monitoring and Research priorities36
Targeted research, monitoring and relevant community-based programs are required to inform the protection and management of the Salt-wedge Estuaries ecological community. The efforts of individuals and groups with responsibilities for planning, on-ground management and data collection should be coordinated so that results can be applied across the various estuarine systems within the ecological community. A centralised repository or shared data warehouse arrangement would facilitate this approach. High priority monitoring and research activities to inform protection, conservation, adaptive management and restoration of the ecological community include, but are not limited to, the following:
Monitoring
Install telemetry stations in estuaries that do not already have them installed to regularly capture profiles and surface measurements of physico-chemical parameters.
Undertake regular analysis of physicochemical data from estuaries within the ecological community to determine trends and opportunities to improve water quality and build resilience of the ecological community to ongoing threats.
Record and make available both discharge data and water extraction data for each estuary in the ecological community.
Monitor and record occurrences of algal blooms, blackwater events, acid flows and fish kills in a centralised database.
Monitor and record incursions of invasive species (including, but not limited to fish) across the ecological community.
Support the development of an Index of Estuary Condition and its application to the ecological community.
Undertake periodic surveys of seagrass and other macrophytes across the ecological community to assess their status.
Undertake surveys to quantify recreational catches of native fish species within the ecological community to determine whether management actions are required.
Monitor changes in condition, including response to all types of management actions and use this information to increase understanding of the ecological community and inform recommendations for future management.
Research
Gain a greater understanding of estuary mouth dynamics in relation to natural opening and closing behaviour versus artificial opening of the estuaries, including regular, long-term recording and analysis of related data.
Establish environmental flow requirements for each system and ensure this informs future water resource plans.
Continue to investigate the threat of disease in the ecological community, including iridovirus infection in mesozooplankton. Determine which estuaries are affected, and if possible, identify causal factors and preventative measures. Determine the levels of impact of disease on secondary productivity and estuarine fish recruitment.
37

Develop control methods to reduce or eradicate invasive fish species in the estuaries and parent river systems of the ecological community. Undertake trials to assess effectiveness and appropriateness of control methods prior to implementation.
Investigate the disappearance of significant coverage of seagrass and macrophytes where these are known to occur (e.g. Hopkins estuary).
Continue to build an understanding of the risks associated with climate change, including sea level rise, increasing temperature, and future flood risk.
Assess the vulnerability of the ecological community to climate change and long-term drought, and investigate ways to improve resilience through threat abatement and management actions.
Determine the importance of groundwater inflow to the ecological community, particularly with regard to freshwater discharge.
6.3. Offsets
Offsets are defined as measures that aim to compensate for the residual adverse impacts of an action on the environment. Further damage to the Assemblages of species associated with open-coast salt-wedge estuaries of western and central Victoria ecological community should not occur. As the ecological outcomes of offsetting activities are generally uncertain, offsetting should only be proposed as an attempt to compensate for damage to the ecological community that is deemed unavoidable. Areas that already meet the key diagnostic characteristics are protected by this listing, so are not to be used as an offset unless there is a substantial net benefit. With regard to any proposed actions involving offsets for the Salt-wedge Estuaries ecological community, the aims are to:
ensure that offsets are consistent with the wording and intent of the EPBC Act Environmental Offsets Policy (Commonwealth of Australia 2012), including:
- ‘like-for-like’ principles based on meeting the overall definition of the ecological community and considering the particular species composition and other habitat and landscape features at a particular site
- how proposed offsets will address key priority actions outlined in this Conservation Advice and any other relevant recovery plans, threat abatement plans and any other Commonwealth management plans
maintain (or increase) the overall quality and ecological function of the remaining extent of the ecological community and surrounding catchments and improve formal protection through a combination of the following measures:
- placement of areas of the ecological community and adjacent mature vegetation in formal reserve tenure or other conservation-related land tenure for protection and management in perpetuity, and/or
- improve the condition and ecological function of salt-wedge estuaries, for example, by enhancing riverine water quality and riparian zone condition, to ensure that any offset sites add additional value to the remaining extent.
38

6.4. Existing plans/management prescriptions relevant to the ecological community
There is no approved state recovery plan for the ecological community as defined in this listing. However, management prescriptions exist in the form of estuary management plans for individual estuaries. A list of these plans is at Appendix B6.
39

APPENDICES
APPENDIX A: LISTS OF KEY BIOTA FROM THE ECOLOGICAL COMMUNITY
Table A1: Taxonomic list of phytoplankton and protists from the Hopkins River estuary (Rouse 1998).
Phylum Dinophyta (Dinoflagellates) Genus Amphidinium
Amphidinium sp.Genus Alexandrium
Alexandrium cf. minutumGenus Dinophysis
Dinophysis acuminateDinophysis cf. caudate
Genus EbriaEbria iripartita
Genus ProrocentrumProrocentrum minimum
Uncertain dinoflagellate taxaOxyrrirus marina
Phylum Bacillariophyta (Diatoms)Genus Achnanthes
Achnanthes brevipesAchnanthes sp. 1
Genus AchnanthesAchnanthes brevipesAchnanthes sp. 1
Genus AmphoraAmphora cf. ventricosaAmphora holsaticaAmphora sp. 1
Genus BacillariaBacillaria paradoxa
Genus CaloneisCaloneis cf. brevis
Genus Campyloneiscf. Campyloneis sp. 1
Genus CerataulinaCerataulina pelagica
Genus ChaetocerosChaetoceros lorenzianus
Genus CocconeisCocconeis scutellum var. parva
Genus CtenophoraCtenophora pulchellaCtenophora cf. fasciculata
Genus CyclotellaCyclotella meneginiana
Genus DiploneisDiploneis cf. smithii var. rhombicaDiploneis cf. subovalisDiploneis cf. didyma
Genus EntomoneisEntomoneis cf. tenuistriata
Genus GyrosigmaGyrosigma cf. fusciolaGyrosigma cf. perthenseGyrosigma cf. spenceriiGyrosigma cf. balticum
Genus HantzschiaHantzschia cf. virgata
Genus HyalodiscusHyalodiscus cf. lentiginosus
Genus Paraliacf. Paralia sp. 1cf. Paralia sp. 2
Genus PleurosigmaPleurosigma cf. formosumPleurosigma cf. fluviicvgnorum
Genus RhizosoleniaRhizosolenia setigera
Genus RhopalodiaRhopalodia cf. gibberulaRhopalodia sp. 1
Genus SurirellaSurirella sp. 1Sirirella sp. 2
Genus Thalassionemacf. Thalassionema nitzshioides
Genus ThalassiosiraThalassiosira cf. eccentricThalassiosira lacustrisThalassiosira weissflogii
Genus TryblionellaTryblionella cf. hungarica
Phylum Prymnesiophyta (Prymnesiophytes) (=Haptophyta/Haptophytes)
Genus PleurochrysisPleurochrysis carierae
CiliatesGenus ColepsGenus CondylostomaGenus CristigeraGenus FrontoniaGenus PlagiopogonGenus PlagiopylaGenus ProrodonGenus SonderiaGenus TracheloraphisGenus Urotricha
Freshwater ProtistaChlorophyta
Genus AnkistrodesmusGenus BinucleariaGenus BotryococcusGenus OocytisGenus ScenedesmusGenus Staurastrum
ChrysophytaGenus MallomonasGenus Synura
Photosynthetic bacteriacf. Chromatium sp.
40
Genus MelosiraMelosira octogonaMelosira sp. 1Melosira sp. 2cf. Melosira sp. 1
Genus NaviculaNavicula cf. clamansNavicula (Fallacia) cf. florinaeNavicula cf. granuiataNavicula (Fallacia) lyraNavicula cf. punctulataNavicula yarrensiscf. Navicula sp. 1
Genus NeidiumNeidium cf. productum
Genus NitzschiaNitzschia cf. pungensNitzschia cf. obtusa var. scalpelliformis
Genus OdontellaOdontella cf. levis
41

Table A2: Systematic Scheme - Hopkins River estuary zooplankton, 1983-1985 (Newton 1994) (Note, indet. = indeterminate identification).PROTOZOA Sarcomastogophora Foraminiferida indet. foraminiferans
Ciliophora Tintinnida indet. tintinnidsCOELENTERATA Hydrozoa Limnomedusae Australomedusa baylii
indet. medusaCTENOPHORA indet. ctenophoresPLATYHELMINTHES Turbullaria Digenea furcocercous cercaria larvaeNEMERTINEA pilidium larvaeNEMATODA indet. nematodesKINORHYNCHA cf. Pycnophyes sp.ROTIFERA Asplanchnidae Asplanchna cf. bightwelli
Brachionidae Brachionus angularisB. cf. budapestinensisB. nilsoniB. novaezealandiaB. plicatilisB. quadrientatus melheniindet. Brachionus spp.Keratella australisK. procurvaK. cf. quadrataK. shieliK. slackiK. cf. valgaindet. Keratella spp.Notholca cf. squamula
Epiphanidae Epiphanes sp.Filiniidae Filinia longisetaLecanidae Lecane ohioensis f. ichthyouraMytilinidae Lophocharis salpinaSynchaetidae cf. Synchaeta sp.Testudinellidae Pompholyx sp.Trichocercidae Trichocerca cf. bicristata
indet. rotifersANNELIDA Polychaeta indet. trochophores
indet. larvaeNereid sp?
Oligochaeta Naididae? indet. sp.MOLLUSCA Bivalvia Lamellibranchia indet. larvae
Gastropoda Prosobranchia indet. larvaeARTHROPODA-CRUSTACEA Cladocera Bosminidae Bosmina meridionalis
Chydoridae Alona cf. rectangulaA. rectangula novaezealandiaA. (Biapertura) karuaCamptocercus australisChydoris sp.Pleuroxus cf. inermisindet. spp.
Daphniidae Daphnia carinataD. lumholtzi
Ostracoda Paracypria sp.Sarscypridopsis sp.indet. spp.
COPEPODA-Calanoida Acartiidae Acartia tranteri
Centropagidae Boeckella triarticulataCalamoecia ampullaC. gibbosaCentropages australiensisGippslandia estuarinaGladioferens pectinatusIsias uncipes
Paracalanidae Bestiola similis
42

Table A2 (continued): Systematic Scheme - Hopkins River estuary zooplankton.
Paracalanus indicusSulcanidae Sulcanus conflictus
-Cyclopoida Ergasilidae Ergasilus australiensisE. lizaeErgasilus sp. nov.
Cyclopidae Eucyclops sp. nov.Halicyclops sp.Macrocyclops albidusMetacyclops sp. nov.Paracyclops chiltoni
Oithonidae Oithona rigidaO. similis
? indet. semi-parasitic sp. A-Harpacticoida Ameridae gen. nov. sp. nov.
indet. spp.Canthocamptidae Canthocamptus australicus
C. hirsutusEpactophanes richardiMesochra parvaMesochra sp. AMesochra sp. B
Canuellidae indet. sp.Cletodidae Australonannopus aestuarinus
indet. sp.Darcythompsoniidae gen. nov. sp. nov.Diosaccidae Amphiascoides sp. nov.
Miscegenus sp.Robertgurneya sp.Schizopera sp.Stenhelia sp.indet. spp.
Ectinosomatidae sp. 1sp. 2sp. 3Microsetella rosea
Harpacticidae Zausopsis mirabiliscf. Zausopsis cf. luederitziindet. sp.
Laophontidae Onychocamptus chathamensisindet. sp.
Peltidiidae indet. spp.Phyllognathopodidae Phyllognathopus sp.Tachidiidae Euterpina acutifronsThalestridae indet. sp.Tisbidae Scutellidium sp.
Tisbe sp.Isopoda indet. isopodsAmphipoda Calliopidae Paracalliope sp.
Corophiidae Megamphopus sp.Photis sp.
Eusiridae Tethygenia cf. wamindaHyperidea indet. sp.
indet. amphipodsMysidacea Mysidae Tenagomysis sp.Cumacea Diastylidae Dimorphostylis colefaxiCirripedia indet. cypris larvaeDECAPODABrachyura Grapsidae cf. Helograpsus haswellianus
indet. spp.Hymenosomatidae Amarinus laevis
A. paralacustris
43
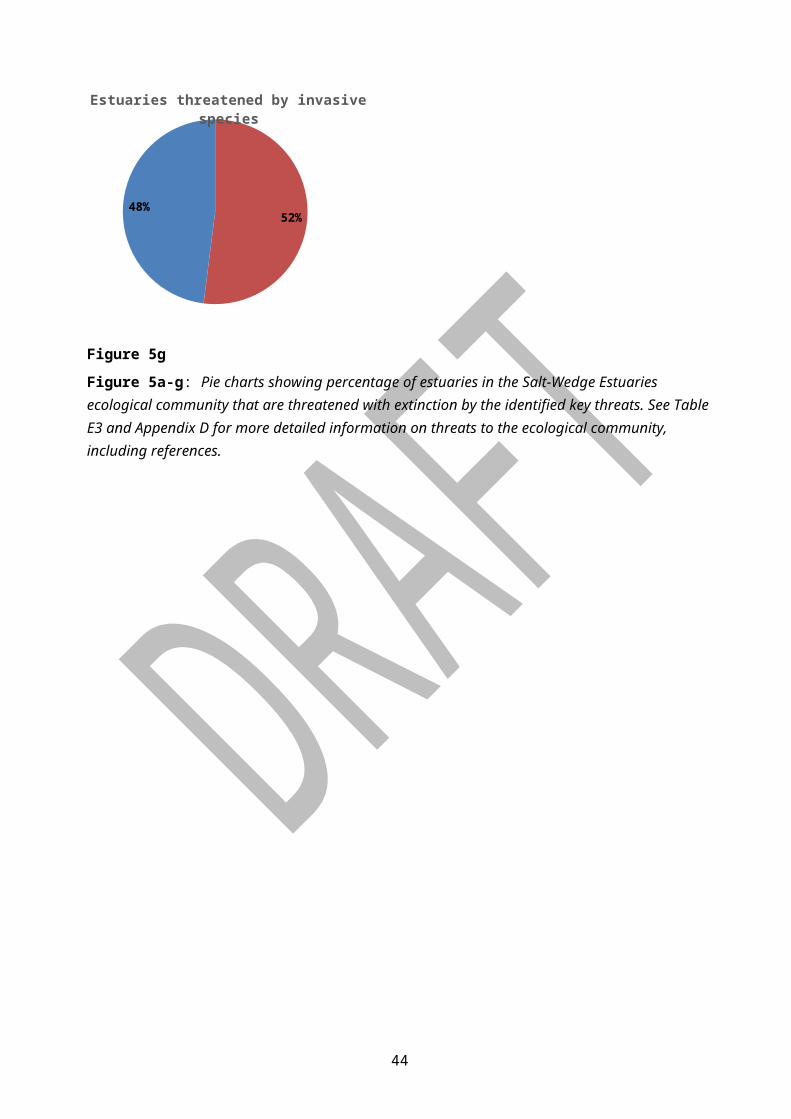
Table A2 (continued): Systematic Scheme - Hopkins River estuary zooplankton.
Elamena or Trigonoplax sp.Caridea Atyidae Paratya australiensis
Palemonidae Macrobrachium intermediumPenaeidea Lucifer hanseniThalassinidea Callianassidae Callianassa sp.
indet. pandalid/hypolytid-INSECTA
Diptera chironomid larvaeCollembola springtailsEphemeroptera may-fly larvae
-ARACHNIDA Hydracarina indet. mites
BRYOZOA cyphonautes larvae
CHORDATA-UROCHORDATA Larvacea Oikopleura dioica
-VERTEBRATA Teleosti (larvae) cf. Atherinidae indet. larvaecf. Clinidae indet. larvaeEleotridae cf. Philypnodon grandiceps
(larvae type C)Engraulididae Engraulis australis
(eggs and larvae)Galaxidae Galaxius maculatus
(juvenile)Gobiidae type A1 cf. Pseudogobius olorum
larvaetype A2 cf. Arenigobius bifrinatuslarvaetype B cf. Favonigobius tamarensis
larvaePercichthyidae Macquaria colonorum
(eggs and larvae)Sparidae Acanthopagrus butcheri
(eggs and larvae)cf. Tetraodontidae indet. larvaecf. Tripterygiidae indet. larvae
44
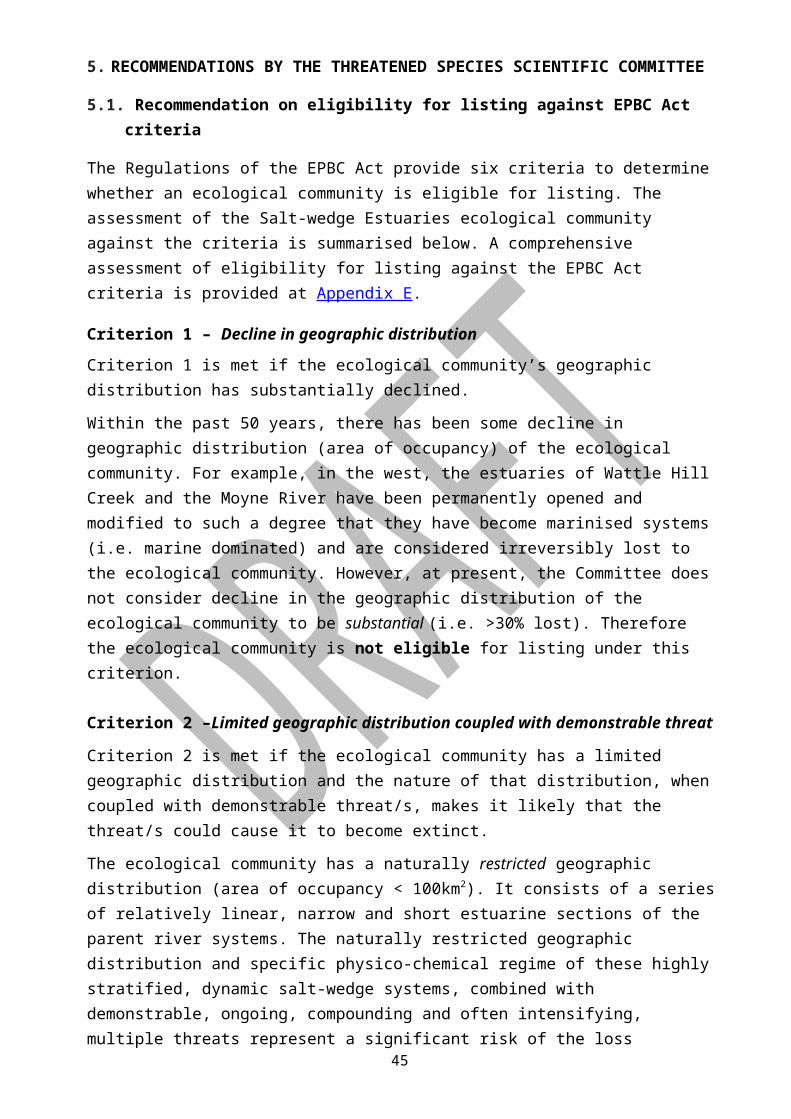
Table A3: Fish recorded in the Gellibrand, Hopkins and Surry estuaries (after Koehn & O'Connor 1990; Newton 1994; Barton & Sherwood 2004; Becker 2007; Lloyd et al. 2008; West Gippsland CMA 2015).
Estuary Fish Group Sub-Types Common Name Taxonomic NameEstuarine Residents n/a black bream C,R
bluespot gobybridled gobyestuary perch C,R
flat-headed gudgeonhalfbridled gobyScary’s southern longfin gobyTamar goby
Acanthopagrus butcheriPseudogobius olorumArenigobius bifrenatusMacquaria colonorumPhilypnodon grandicepsArenigobius frenatusTasmanogobius lastiFavonigobius lateralisAfurcagobius tamarensis
Estuarine Dependent Marine Derived (Anadromous)
congolli (tupong) C,R
elongate hardyheadKing George whiting C,R
mulloway C,R
pikehead hardyheadpouched lampreyshortheaded lampreysilver fishsmallmouth hardyhead
Pseudaphritis urvilliiAtherinosoma elongataSillaginoides punctataArgyrosomus japonicasKestratherina esoxGeotria australisMordacia mordaxLeptatherina presbyteroidesAtherinosoma microstoma
Freshwater Derived (Catadromous)
Australian grayling#
climbing galaxiascommon galaxias (jollytail)eastern dwarf galaxiasshortfinned eel C,R
spotted galaxiasTasmanian mudfish
Prototroctes maraenaGalaxias brevipinnisGalaxias maculatusGalaxiella pusillaAnguilla australisGalaxias truttaceusNeochanna cleaveri
Estuarine Opportunists/ Strays
Marine Derived(Anadromous)
anchovybearded red codblue morwong C,R
blue sprat C,R
bluethroat wrassedusky flathead C,R
dusky morwongeastern Australian salmon C,R
eastern fortesqueglobefishgreenback flounder C,R
knifesnout pipefishlittle weed whitinglongsnout flounder C,R
luderick C,R
old wifepilchard C
prickly toadfishred gurnardsand flathead C,R
sand mulletsandy spratsea mullet C,R
silver morwong C,R
silver trevally C,R
sixspine leatherjacket C,R
skipjack trevally C,R
smooth toadfishsnapper C,R
soldiersouthern bluespotted flathead C,R
southern fiddler raysouthern pygmy leatherjacketsouthern red scorpionfish
Engraulis australisPseudophycis barbataNemadactylus valenciennesiSpratelloides robustusNotolabrus tetricusPlatycephalus fuscusDactylophora nigricansArripis truttaCentropogon australisDiodon nicthemerusRhombosolea tapirinaHypselognathus rostratusNeoodax balteatusAmmotretis rostratusGirella tricuspidataEnoplosus armatusSardinops sagaxContusus brevicaudusChelidonichthys kumuPlatycephalus bassensisMyxus elongatusHyperlophus vittatusMugil cephalusNemadactylus douglasiiPseudocaranx dentexMeuschenia freycinetiPseudocaranx wrightiTetractenos glaberChrysophrys auratusGymnapistes marmoratusPlatycephalus speculatorTrygonorrhina dumeriliiBrachaluteres jacksonianusScorpaena papillosa
45

southern sea garfishspotted pipefishtailor C,R
tommy ruff C,R
toothbrush leatherjacketwestern Australian salmonwidebody pipefishyellow-eye mullet C,R
yellowfin goby (alien fish species)
Hyporhamphus melanochirStigmatopora argusPomatomus saltatrixArripis georgianusAcanthaluteres vittigerArripis truttaceusStigmatopora nigraAldrichetta forsteriAcanthogobius flavimanus
Freshwater Derived (Catadromous)
Australian smeltriver blackfish R
southern pygmy perchvariegated pygmy perchwestern carp gudgeonYarra pygmy perch
Retropinna semoniGadopsis marmoratusNannoperca australisNannoperca variegataHypseleotris klunzingeriNannoperca obscura
Not the ecological community (alien species)
Freshwater Derived (Catadromous)
brown trout R (alien fish species)gambusia (alien fish species)rainbow trout R (alien fish species)redfin (alien fish species)roach (alien fish species)tench (alien fish species)
Salmo trutta
Gambusia holbrookiOncorhynchus mykiss
Perca fluviatilisRutilus rutilusTinca tinca
# Australian grayling is listed as vulnerable under the Victorian FFG Act and the Australian Government’s EPBC ActC These species have commercial fisheries valueR These species have recreational fisheries value
46

APPENDIX B: DETAILED DESCRIPTION OF NATIONAL CONTEXT
B1: Bioregional distribution
Table B1: IBRA bioregions and subregions of the ecological community.Estuary Bioregion SubregionGlenelg River Naracoorte Coastal Plain Glenelg Plain Surry River South East Coastal Plain Warrnambool PlainFitzroy River South East Coastal Plain Warrnambool PlainEumeralla River South East Coastal Plain Warrnambool PlainMerri River South East Coastal Plain Warrnambool PlainHopkins River South East Coastal Plain Warrnambool PlainCurdies River South East Coastal Plain Warrnambool PlainSherbrook River South East Coastal Plain Warrnambool PlainGellibrand River South East Coastal Plain Warrnambool Plain Johanna River South East Coastal Plain Otway PlainAire River South East Coastal Plain Otway Plain Barham River South East Coastal Plain Otway Plain Kennett River South Eastern Highlands Otway RangesWye River South Eastern Highlands Otway RangesSt George River South Eastern Highlands Otway RangesErskine River South Eastern Highlands Otway RangesPainkalac Creek South East Coastal Plain Otway PlainAnglesea River South East Coastal Plain Otway PlainSpring Creek South East Coastal Plain Otway PlainThompson Creek South East Coastal Plain Otway PlainPowlett River South East Coastal Plain Gippsland PlainDarby River South East Coastal Plain Gippsland PlainTidal River Flinders Wilsons PromontoryGrowlers Creek Flinders Wilsons Promontory
47
B2: Other existing protection
Table B2: National and state protected areas for the salt-wedge estuaries ecological community (Parks Victoria 2017).
Estuary Protected land areas Protected marine areasGrowlers Creek Wilsons Promontory National Park (Southern
Wilsons Promontory Remote and Natural Area)
Wilsons Promontory Marine National Park
Tidal River Wilsons Promontory National Park Wilsons Promontory Marine ParkDarby River Wilsons Promontory National Park (Southern
Wilsons Promontory Remote and Natural Area)
Wilsons Promontory Marine Park
Powlett River Kilcunda Nature Conservation Reserve Kilcunda – Hamers Haven Coastal Reserve
Thompson Creek Breamlea Flora and Fauna Reserve -Spring Creek - -Anglesea River - -Painkalac Creek - Eagle Rock Marine SanctuaryErskine River - -St George River Great Otway National Park -Wye River Great Otway National Park -Kennett River Great Otway National Park -Barham River Barham Paradise Scenic Reserve -Aire River Great Otway National Park
Aire River Wildlife Reserve-
Johanna River Great Otway National Park -Gellibrand River Great Otway National Park
Port Campbell National ParkPrincetown Wildlife Reserve
Twelve Apostles Marine National Park
Sherbrook River Port Campbell National Park -Port Campbell Creek Port Campbell National Park -Curdies River Port Campbell National Park -Hopkins River - -Merri River - Merri Marine SanctuaryEumeralla River (Lake Yambuk)
Deen Maar Indigenous Protected AreaYambuk Wetlands Nature Conservation ReserveEumeralla (Yambuk Coastal Reserve)
Eumeralla (Yambuk Coastal Reserve)
Fitzroy River Fitzroy River streamside ReserveNarrawong Coastal ReserveTyrendarra Flora ReserveTyrendarra Indigenous Protected Area
-
Surrey River Narrawong Coastal Reserve Narrawong Coastal ReserveGlenelg River Discovery Bay Coastal Park (VIC)
Lower Glenelg National Park (VIC)Lower Glenelg River Conservation Park (SA)Glenelg River Streamside ReserveNelson Streamside Reserve
-
48

B3: Relationship to state listed vegetation classifications
Table B3. Bioregional conservation status (as at 2007) for two EVCs that best correspond to the Salt-wedge Estuaries ecological community (DSE 2007).
Victorian bioregion Bioregional conservation statusEVC 9 Coastal saltmarsh EVC 10 Estuarine wetland
Glenelg Plain n/a n/aWarrnambool Plain n/a DepletedOtway Ranges n/a EndangeredOtway Plain Endangered EndangeredGippsland Plain Least concern Least concernWilsons Promontory Least concern Rare
49

B4: Nationally threatened species likely to occur in or near the ecological community
Table B4: Nationally threatened flora and fauna species that have been observed, or are likely to occur, in or near the Salt-wedge Estuaries ecological community (as at March 2017) (DEE 2017). [Known occurrences of some species may be in landscapes or vegetation communities nearby to the ecological community].
Taxon Common name EPBC Act listing
Victorian listing
BirdsBotaurus poiciloptilus Australasian bittern E ThreatenedCalidris ferruginea curlew sandpiper CE E (Advisory List 2013)Calidris tenuirostris great knot CE ThreatenedCharadrius mongolus lesser sand plover E CE (Advisory List 2013)Limosa lapponica baueri bar-tailed godwit (baueri) V -Neophema chrysogaster orange-bellied parrot CE ThreatenedNumenius madagascariensis eastern curlew CE V (Advisory List 2013)Rostratula australis Australian painted snipe E ThreatenedSternula nereis nereis fairy tern (Australian) V ThreatenedThinornis rubricollis rubricollis hooded plover (eastern) V V (Advisory List 2013)MammalsAntechinus minimus maritimus swamp antechinus (coastal
Victoria and far south-eastern South Australia)
V Threatened
Mastocomys fuscus mordicus broad-toothed rat (mainland) V -Miniopterus orianae bassanii southern bent-wing bat CE ThreatenedPotorous tridactylus tridactylus long-nosed potoroo (SE
mainland)V Threatened
Pseudomys novaehollandiae New Holland mouse V ThreatenedMacroinvertebratesEuastacus bispinosus Glenelg spiny freshwater crayfish E ThreatenedSharksCarcharodon carcharias white shark V ThreatenedFishGalaxiella pusilla eastern dwarf galaxias V ThreatenedPrototroctes maraena Australian grayling V ThreatenedAmphibians Litoria raniformis southern bell frog V ThreatenedPlantsCaladenia orientalis eastern spider orchid E ThreatenedHaloragis exalata subsp. exalata wingless raspwort V V (Advisory List 2014)Prasophyllum frenchii maroon leek-orchid E ThreatenedPrasophyllum spicatum dense leek-orchid V E (Advisory List 2014)Pterostylis cucullata leafy greenhood V ThreatenedPterostylis tenuissima swamp greenhood V V (Advisory List 2013)Senecio psilocarpus swamp fireweed V V (Advisory List 2014)Xerochrysum palustre swamp everlasting V Threatened
CE – Critically EndangeredE - EndangeredV - Vulnerable
50

B5: Birds under international agreements
As a party to the Bonn Convention, Australia has agreed to protect migratory species and to negotiate and implement agreements for the conservation and management of migratory species with other range states, including cooperation and support of research relating to migratory species:
the agreement between the Government of Australia and the Government of Japan for the Protection of Migratory Birds in Danger of Extinction and their Environment 1974 (JAMBA)
the agreement between the Government of Australia and the Government of the People’s Republic of China for the Protection of Migratory Birds in Danger of Extinction and their Environment 1986 (CAMBA), and
the agreement between the Government of Australia and the Government of the Republic of Korea for the Protection of Migratory Birds 2007 (ROKAMBA).
The Salt-wedge Estuaries ecological community provides critical habitat for several wetland and coastal water birds that are listed under these various international agreements (DEE 2017).
Table: B5: Migratory bird species that have been observed, or are likely to occur, in the ecological community or the riparian zone (DEE 2017) include:
Actitis hypoleucos (common sandpiper) Myiagra cyanoleuca (satin flycatcher)Ardenna tenuirostris (short-tailed shearwater) Numenius minutus (little curlew)Arenaria interpres (ruddy turnstone) Numenius phaeopus (whimbrel)Apus pacificus (fork-tailed swift) Hirundapus caudacutus (white-throated needletail)Ardenna carneipes (flesh-footed shearwater) Pandion cristatus (eastern osprey)Calidris acuminata (sharp-tailed sandpiper) Pluvialis fulva (Pacific golden plover)Calidris alba (sanderling) Pluvialis squatarola (grey plover)Calidris melanotos (pectoral sandpiper) Rhipidura rufifrons (rufous fantail)Calidris ruficollis (red-necked stint) Tringa brevipes (grey-tailed tattler)Charadrius bicinctus (double-banded plover) Tringa stagnatilis (marsh sandpiper, little greenshank)Gallinago hardwickii (Latham's snipe) Tringa nebularia (common greenshank)Limosa lapponica (bar-tailed godwit) Xenus cinereus (Terek sandpiper)Limosa limosa (black-tailed godwit)
51

B6: Existing plans/management prescriptions relevant to the ecological community
Table B6: Existing plans relevant to the salt-wedge estuaries ecological community (complete references available at section 7 – Bibliography).
Name of plan Author
Aire River Estuary Management Plan 2015-2023 Corangamite Catchment Management Authority (2015)
Annual climate statement 2015 Bureau of Meteorology (2016)
Climate Change in Australia – Projections for Australia’s NRM Regions CSIRO
Coast Adapt – Sea-level rise information for all Australian coastal councils National Climate Change Adaption Research Facility
Corangamite Marine and Biodiversity Coastal Strategy Corangamite Catchment Management Authority (2009)
Corangamite Native Vegetation Plan 2003-2008 Corangamite Catchment Management Authority (2005)
Corangamite Wetland Strategy 2006 – 2011 Corangamite Catchment Management Authority (2006)
Curdies Estuary Management Plan Water Technology (2008)
Data Analysis and Interpretation Gellibrand River Estuary 2007-2012 Corangamite Catchment Management Authority (2013)
Estuary Entrance Management Support System (EEMSS) database Arundel H (2007)
Fitzroy Estuary Management Plan. Glenelg Hopkins Catchment Management Authority (2006)
Glenelg Estuary Management Plan Glenelg Hopkins Catchment Management Authority (2006)
Great Otway National park and Otway Forest Park Management Plan 2009 Parks Victoria (2009)
Hopkins Estuary Management Plan Glenelg Hopkins Management Authority (2005)
Merri Estuary Management Plan Glenelg Hopkins Catchment Management Authority (2008)
Port Campbell National Park and Bay of Islands Coastal Park Management Plan 1998
Parks Victoria (1998)
Surry Estuary Management Plan Glenelg Hopkins Catchment Management Authority (2007)
Twelve Apostles Marine National Park Management Plan 2006 Parks Victoria (2006a)
Victorian Index of Estuary Condition: Recommended themes and measures
Arundel HP, Pope AJ & Quinn GP (2009)
Victorian Waterway Management Strategy. Department of Environment and Primary Industries (2013)
Victoria’s System of Marine National Parks and Marine Sanctuaries – Management Strategy 2003-2010
Parks Victoria (2003)
Wilson’s Promontory Marine National Park Management Plan 2002. Parks Victoria, Melbourne
Parks Victoria (2006b)
Wilson’s Promontory National Park Management Plan 2002 Parks Victoria (2002)
Yambuk Lake Estuary and Wetlands Management Plan Glenelg Hopkins Management Authority (2004)
52
APPENDIX C: RELEVANT HYDROLOGY, BIOLOGY AND ECOLOGY
C1: Overview
Salt-wedge estuaries contain a diverse range of species and functional groups which occupy niches within the spectrum of freshwater to highly saline water (Newton 2008). Estuarine systems are constantly responding to various influences under a variety of time scales. Regular cyclic variations, such as semidiurnal tides and spring-neap tides are superimposed with daily to seasonal to annual climatic variations in temperature and rainfall (and therefore flow). These various factors combine to influence processes such as salinity stratification (vertical and longitudinal), water mixing, erosion, and transport and deposition of sediments and other particles, including organisms. For example: semidiurnal tidal variations in sea level cyclically flood and expose the intertidal mudflats and marshes of the lower reaches of estuaries; and peak seasonal discharge may completely flush out a stagnating salt-wedge, enabling a new one to form when flood waters subside.
To understand the implications of disturbance and threat (Appendix D), the key aspects of the hydrology, biology and ecology of the ecological community are elaborated below. This discussion supports the criterion assessment at Appendix E.
C2: Hydrology
Typical annual hydrological cycle of an open-coast salt-wedge estuary
In general, dynamic patterns of flow that are maintained within the natural range of variation will promote the integrity and sustainability of aquatic ecosystems (ESA 2003). Several studies have demonstrated a ‘typical’ pattern of flow, or annual hydrological cycle, for the salt-wedge estuaries within the ecological community (e.g. Hopkins, Glenelg, and Gellibrand) (Sherwood 1983, 1985; Newton 1994). There are two main periods within a typical annual hydrological cycle (Sherwood 1983, 1985; Newton 1994, 1996; see Figure C1):
1) Low-flow period – characterised by salt-wedge ‘emplacement’, ‘presence’ and subsequent stagnation. This period generally occurs over late-spring to early-winter, and is characterised by minimum discharge and maximum water temperatures. Early in this period is the transitional phase of salt-wedge emplacement. Tidal intrusion results in a gradual increase in salinity along the estuary, leading to the formation of a new salt-wedge and increasingly stronger stratification and halocline formation (Figure C2). The sharpness of the halocline boundary indicates there is little exchange between the fresh and saltwater layers (Barton & Sherwood 2004; Sherwood et al. 2008). These new saline waters are well oxygenated. During the later low-flow period mouth constriction or closure can occur, leading to reduced exchange with adjacent marine waters. Restriction of the mouth results from the gradual deposition of sands from coastal wave energy which is exacerbated if a sill is present.
Highest salinities and temperatures generally occur in late-summer and autumn. At this time, the salt-wedge is relatively stable and may gradually stagnate, resulting in deoxygenation of deeper waters and potential build-up of hydrogen sulfide and ammonia in the deepest waters. This may stimulate a phosphate ‘buffering’ mechanism, causing phosphate to be released from the anoxic reduced sediments and bacterial respiration (Newton 1994; Barton & Sherwood 2004; Sherwood et al. 2008). In addition, thermal stratification is often pronounced, with the salt-wedge cooler than surface waters in late-spring/summer and warmer during autumn/winter.
53

2) High-flow period – usually characterised by maximum discharge, retreat of the salt-wedge, and often complete flushing of all saline waters from the estuary (Figure C1). Each salt-wedge estuary has a critical level of discharge (i.e. minimum flow needed to ‘flush’ the estuary) which results in flushing of all saline waters from the system within one to a few days. For example, that known for the Gellibrand is 600 ML/day, Hopkins is 4000 ML/day and Glenelg is 6000 ML/day (Sherwood 1983, 1985; Barton & Sherwood 2004). This period has minimum salinities and temperatures and usually occurs in late winter to early spring. During floods, river flow may be quite turbulent with high velocities, resulting in vigorous vertical mixing. This combined with a short residence time of flood waters, can lead to uniformity of parameters such as salinity and dissolved oxygen throughout the estuary. Flood waters introduce high levels of particulate matter into the estuary and increase turbidity. Flood waters also introduce considerable concentrations of nutrients adsorbed to particulates.
Figure C1: Generalised hydrodynamic cycle of central and western Victorian salt-wedge estuaries (Sherwood 1985; Newton 1994).
54

Figure C2: Longitudinal profile of the Hopkins River estuary showing: On Left - progression of a new salt-wedge after winter flushing, and sharpness of the halocline boundary layer. [Note: The 1, 5, 25 and 30 ppt salinity isotherms are shown]; and on Right - summer salt-wedge presence. [Note: The 15, 25, 25 and 30 ppt salinity isotherms are shown].
Intermittent mouth condition
Intermittent opening and closing of the mouth is a defining feature of the salt-wedge estuaries ecological community (Mondon et al. 2003). The natural process of mouth closure can influence water quality and other aspects of estuary function, and may lead to the following (Barton & Sherwood 2004; Pope et al. 2015):
Cessation of tidal exchanges with the ocean, resulting in prolonged periods of conditions which favour salinity and temperature stratification, and eventually may lead to oxygen and nutrient depletion in deep waters.
Cessation of migration of organisms (e.g. fish larvae) between river/estuary and sea.
Increases in water level, from river flows, which may result in flooding of wetland habitats, and submergence of farm pastures, roads and infrastructure.
There is no obvious pattern to the timing of mouth closure (Barton & Sherwood 2004; Sherwood et al. 2008). A number of factors interact to make the mouths of salt-wedge estuaries susceptible to closing (Moverley & Hirst 1999; Ranasinghe & Pattiaratchi 2003):
1) Sand deposition in the estuary mouths is high. These estuaries discharge into high-energy wave areas where large volumes of sand are moved along the coast by longshore and cross-shore currents, episodic storm surges and along the beach by wind. Factors such as astronomical tidal amplitude, wind speed and direction, and wave height all directly affect the amount and direction of oceanic energy that can shift sand along the coast (Haines & Thom 2007; Sherwood et al. 2008; Lloyd et al. 2009; McLean & Hinwood 2011). On Victoria’s western and central coast, even small changes in sea level or wave height can cause significant changes in the location of sand deposition (Sherwood et al. 2008).
2) Inlet currents interact with longshore sediment transport and cross-shore transport which leads to the deposition of sediment across the inlet entrance (Ranasinghe & Pattiaratchi 2003; Perissinotto et al. 2010).
3) Most of the estuaries are relatively shallow and may fill quickly (e.g. Eyre 1998).
4) These estuaries have a small tidal range and weak tidal currents that may not be strong enough to keep the mouth open.
55

In contrast to mouth closure, mouth breaching occurs when water levels overtop the berm during high river flow. Breaching is generally accompanied by scouring of estuarine sediment and an increased silt load and turbidity during the outflow phase. Importantly, breaching of the sand-barrier leads to a sudden change in water level as stored water is flushed from the system (Perissinotto et al. 2010). Such mouth discharges may be important nutrient sources for adjacent coastal waters although they can also be problematic if estuarine waters have become deoxygenated or acidic (Barton & Sherwood 2004; Arundel et al. 2008; Becker et al. 2009).
Salinity, flow, mouth status and community structure
Flow and salinity are the primary community structuring forces in estuaries (Newton 1994, 1996; Hirst 2004; Rovira et al. 2009). Factors that collectively influence the flow and salinity regime of estuaries include climate, relative inputs of freshwater and seawater, coastal topography, currents and estuarine morphology (Deeley & Paling 1999). Freshwater flow is an important process resulting in stratification and transport of sediments and nutrients that promote retention of organisms and primary productivity in estuaries (Cloern et al. 1983). For example, density gradients (i.e. haloclines) can prevent vertical mixing by acting as a physical and biological barrier (Kurup et al. 1998).
Estuaries are home to a range of species with varying physiological tolerances, particularly to salinity. Hirst (2004) found that species diversity is often associated with changes in salinity, partly because a greater range of species is able to coexist at higher salinities. Euryhaline and estuarine fauna are generally widely distributed within estuaries and capable of tolerating a broad range of physicochemical conditions. By comparison, stenohaline species, which are marine in origin, are often restricted to a narrower band of salinities generally found closer to the entrance of estuaries.
Physical conditions such as flooding depth, salinity, groundwater moisture and scour all influence plant distribution and vary in relation to elevation, proximity to the estuarine channel and distance from the river mouth (Lloyd et al. 2008). There are normally zones that feature consistent vegetation structure and composition related to their range of tolerances to physical conditions.
Community structure and biomass in estuaries with intermittent mouths are determined by the interactive effects of freshwater inflow, water temperature and mouth status (Froneman 2004). Microalgae are key primary producers in intermittently open estuaries and microphytobenthic biomass is often much higher than in permanently open systems. During the closed phase, the absence of tidal currents, clearer water and greater light penetration can result in the proliferation of submerged macrophytes, such as seagrass beds. Zooplankton are primary consumers in the water-column, within the upper sediment, and as part of the meiobenthos on submerged vegetation (Newton 1994). The salt-wedge is a site of intense biological productivity that may, for example, enhance the survival of fish larvae (North & Houde 2003). The dominance of estuarine and estuarine-dependent marine fish species is an indication of the important nursery function of these intermittent systems. Marine juvenile fish recruit into salt-wedge estuaries when the mouth opens and during marine overwash events when waves from the sea wash over the sandbar at the mouth.
56
Connectivity
Connectivity relates to the longitudinal and lateral hydrological connections between a salt-wedge estuary and its adjacent environments – the ocean, the parent river system, the floodplain and associated wetlands. These connections support a myriad of ecological functions and interactions and the movement of biota and matter, including native fish (Zampatti et al. 2011).
The estuary channel, unlike the adjacent floodplain, is generally characterised by flowing water (currents), unstable sediments and a relatively shallow photic zone. The channel is the main conduit for transport of water, sediment, nutrients and other material, and is a corridor for dispersal and migration of biota. In the lower estuary there is potential for exchange of organisms and particulates with the adjacent coastal waters; and in the upper estuary there is potential for exchange with the riverine habitat. The littoral zone of the estuary, at the channel edge, supports a narrow band of emergent and submerged plants that forms a refuge for many animals, in particular meiofauna and macroinvertebrates, and is often a place of higher biodiversity. Floodplain wetlands occur along a water-availability gradient that governs the zones where particular plant and animal species may occur (Brock 1994).
C3: General ecology and function
Interactions, processes and productivity
Estuaries are complex ecosystems, characterised by a network of interactions and processes occurring between water flow and circulation (i.e. hydrological cycles driven by river discharge and tides), physical and chemical inputs, and biological communities as shown by the model in Figure C3.
Figure C3: Tropho-dynamic model of an estuary showing the complexity of pathways between trophic levels of organisms and the physical processes that influence the estuarine environment (Newton 1994).
57

Phytoplankton
Phytoplankton are an important food source for zooplankton and constitute an important carbon source for local benthic and pelagic food webs in salt-wedge estuaries. They also provide an essential link between inorganic compounds and organic matter available to the higher trophic levels and top predators (Miller et al. 1996; Mortazavi et al. 2000).
Zooplankton and copepod ecology
Zooplankton have an important role in aquatic food webs and provide an important pathway for the transfer of energy (Grange et al. 2000 and papers therein). The grazing of phytoplankton by zooplankton provides a critical link between primary producers and higher trophic levels (e.g. adult and larval fish, crabs and shrimp) within the ecological community (Newton 1995; Daase et al. 2013). In addition, nutrient excretion by zooplankton contributes to the nutrient requirements of phytoplankton (Newton 1995).
The zooplankton community contains adult or larval representatives of organisms from all major habitat-types within estuaries (i.e. water column, halocline, substrate, seagrass beds, and littoral vegetation). Many species of zooplankton can perform pronounced vertical migratory behaviour (usually driven by day/night or tidal cues), which means they can come into close contact with the sediments and bottom dwelling plants and animals, thus making all these components of estuaries trophically connected.
The most numerous component of estuarine zooplankton is ‘holoplankton’ which live permanently in the planktonic habitat of the water column. Important holoplankton forms are copepods (minute crustaceans), cladocerans and rotifers. Copepods consistently dominate the zooplankton fauna (typically 80 percent or more by numbers) (Miller 1983; Newton 1994). The tiny carnivorous medusa, Australomedusa baylii is another important holoplankton species occurring in estuaries (Bayly 1971; Newton 1994). The other major zooplankton component is the ‘meroplankton’ which are temporary members. These are the larval stages of animals that live in the water column or bottom substrate as adults, for example, fish, crabs, shrimps, gastropods, bivalves and polychaete worms. Many Australian fish species of commercial and recreational importance depend on estuaries during at least one stage of their life cycle (Lenanton & Potter 1987; Meynecke et al. 2006). For example, the Hopkins River estuary supports an important recreational fishery for Acanthopagrus butcheri (black bream) and Macquaria colonorum (estuary perch) (Tunbridge & Glenane 1985) and both spawn in the estuaries of the ecological community (Newton 1996).
Compared to marine and freshwater systems, salt-wedge estuaries characteristically have a higher abundance of zooplankton but lower species diversity (Newton 1994). Across the Salt-wedge Estuaries ecological community, three estuarine-endemic calanoid copepods are likely to dominate (Newton 1994); Gippslandia estuarina, Gladioferens pectinatus and Sulcanus conflictus. The occurrence of Gippslandia estuarina in the Hopkins River estuary represents the most westerly extent of its known distribution (Newton & Mitchell 1999).
In addition to their role in ecological processes, individual species of zooplankton generally have optimal ranges of salinity, temperature and dissolved oxygen for survival, although some have broader tolerances than others. With respect to copepods, water temperature and salinity are critical parameters that directly impact copepod size, reproduction, respiration, osmoregulation and metabolism, and thus their energy expenditure and estuarine positioning (e.g. Bayly 1965; Brand & Bayly 1971). The common estuarine copepod Gladioferens pectinatus has been
58

recorded from the full range of salinities from freshwater to marine, and is able to regulate both hypo and hyper-osmotically, with an isosmotic point at salinity 18 (Brand & Bayly 1971). This species was also found to occur in the lowest water temperature of all the estuarine calanoid copepod species in the Hopkins River estuary (Newton 1994). Temperature can also influence the range of salinity tolerated by this and other copepod species (Bayly 1965; Jarvis 1979; Newton 1994).
Population maintenance and dormancy
Zooplankton in estuaries are continually at risk of being washed out to sea where estuarine-endemic forms cannot survive. To maintain their populations in estuaries, many species of zooplankton have developed adaptive strategies, including migratory behaviour with the tides to maintain preferred horizontal and vertical positions, and the development of dormant life-history stages (Newton 1994; Newton & Mitchell 1999).
In the Hopkins River estuary, the use of boundary layers of least-net-flow, associated with the halocline, the bottom substrate and littoral vegetation, are prominent strategies used by zooplankton for position maintenance (Newton 1994).
A dormant life history stage is often critical to the existence of a species, ensuring its persistence during periods that are unfavourable for development, reproduction or adult survival (Newton & Mitchell 1999). Dormancy represents a spectrum of suppressed development ranging from diapause (arrested development) to quiescence (retarded development). Diapause stages cannot develop, even under optimal conditions, until the passage of a required dormancy period (Marcus 1996). In contrast, quiescence is induced by adverse environmental conditions and requires no prior acclimation, and development resumes immediately suitable conditions return (Grice & Marcus 1981). Of the three dominant estuarine copepods occurring within the ecological community, Sulcanus conflictus has diapause dormant eggs, Gippslandia estuarina has quiescent dormant eggs and Gladioferens pectinatus does not produce dormant eggs but rather the nauplii larvae hatch directly from an external eggs sac carried by the female (Newton 1994; Newton & Mitchell 1999).
Salt-wedge dependent fish spawning and larval fish survival
Many commercially and recreationally important native fish species use estuarine habitats as nurseries or breeding grounds and have life-cycles correlated to rainfall, salinity stratification and temperature patterns (Lenanton & Potter 1987; Meynecke et al. 2006). Many estuarine fish species have evolved spawning strategies that are adapted to the average hydrological and biological conditions of the estuary to enhance survival of their larvae (Newton 1996).
For example, black bream, a recreationally important species, completes its entire life-cycle within an estuary and is considered a keystone species and apex predator of the ecological community (Williams et al. 2013). The formation of a salt-wedge is an important process supporting black bream spawning and successful recruitment (Newton 1996; Jenkins et al. 2010; Williams et al. 2012, 2013). Physical conditions associated with salt-wedge formation may also be responsible for triggering spawning in black bream (Newton 1996; Nicholson et al. 2008). The timing and location of spawning activity is crucial to maximise the spatial and temporal overlap of larvae and prey. Having a well-defined spatial overlap between eggs and prey is an important life history strategy that maximises the reproductive success of black bream (Newton 1996; Willis et al. 1999; Williams et al. 2013). Convergence of black bream eggs at the halocline means
59

that hatching larvae are placed within an area of increased prey availability, which in turn supports higher survival of larvae (Newton 1994, 1996; Williams et al. 2013).
The halocline is a region of increased productivity, with high densities of young copepod stages (including nauplii and copepodids), which are an important prey item for feeding black bream larvae (Willis et al. 1999; Jenkins et al. 1999). It is likely that increased nutrients and phytoplankton accumulating in the halocline assist in supporting copepod production (Jassby et al. 1995; Kimmerer 2002; Williams et al. 2013).
In addition to black bream, other fish species, such as estuary perch and Engraulis australis (southern anchovy), have been found to show a similar dependence on salt-wedge dynamics and halocline formation for spawning and larval feeding (Newton 1996).
Seagrass as estuarine ecosystem engineers
Ecosystem engineers are keystone species that modify and modulate the physical environment, and thus create, maintain and change habitats and resources (Jones et al., 1994; Wright & Jones, 2006). Removal or changes in local populations of ecosystem engineers can have significant impacts on the functioning of ecosystem processes, and overall long-term stability and resilience of the ecological community.
Seagrass species, such as Zostera muelleri, and the submerged aquatic herb Ruppia megacarpa (Ruppia is seagrass-like in appearance and function), are significant ecosystem engineers contributing to ecological and biogeochemical processes, and the integrity of the ecological community. They can form large single or mixed species stands in soft sediments (mud and sand) along the margins and mudflats of estuaries, depending on their rhizomes (or underground stems) for anchorage (Kirkman 1997; Ierodiaconou & Laurenson 2002).
Seagrass beds perform a ‘nursery’ and ‘refuge’ function for fish, macroinvertebrates and other fauna, protecting them from predation, desiccation and currents, including avoiding being flushed from an estuary during high velocity flows or floods (Newton 1994; Powell & Matsumoto 1994; Paul & Amos, 2011; Ford et al. 2010; Sheaves et al. 2014). Seagrasses are also an important food source in estuaries and contribute greatly to estuarine productivity. The epiphytes and epifauna associated with seagrass leaves provide an important food resource for invertebrates and fish, and dead leaf and epiphyte matter provides a large organic source that fuels the detrital food-chain (Barnes & Hughes, 1982; Kirkman 1997; Ierodiaconou & Laurenson 2002; Macreadie et al. 2014). In addition to supporting biodiversity, seagrasses stabilise sediments, contribute to nutrient recycling, improve water quality by filtering out suspended sediments, and sequester carbon (Kirkman 1997; Fourqurean et al. 2012; Macreadie et al. 2013, 2014).
Summary model
The model at Figure C4 demonstrates the interconnectedness and interdependence of the physico-chemical and biological components for a generic estuarine system of the ecological community (in this case based on the Hopkins River estuary). It also supports the inference that the physical regime of these estuarine systems may be a useful ‘surrogate’ for the functional integrity of the Salt-wedge Estuaries ecological community.
60
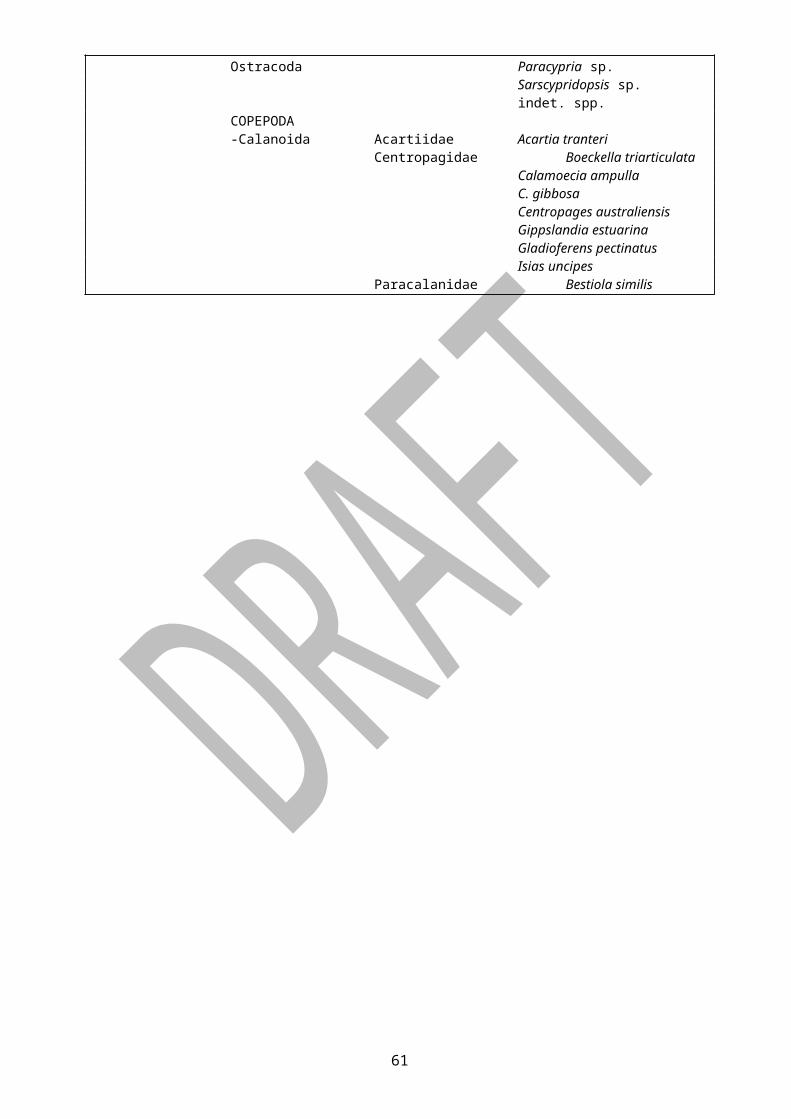
Figure C4: Model of zooplankton ecology and habitat usage in relation to estuarine hydrodynamics and three phases of salt-wedge dynamics. Based on results of study of the Hopkins River estuary (Newton 1994).
61
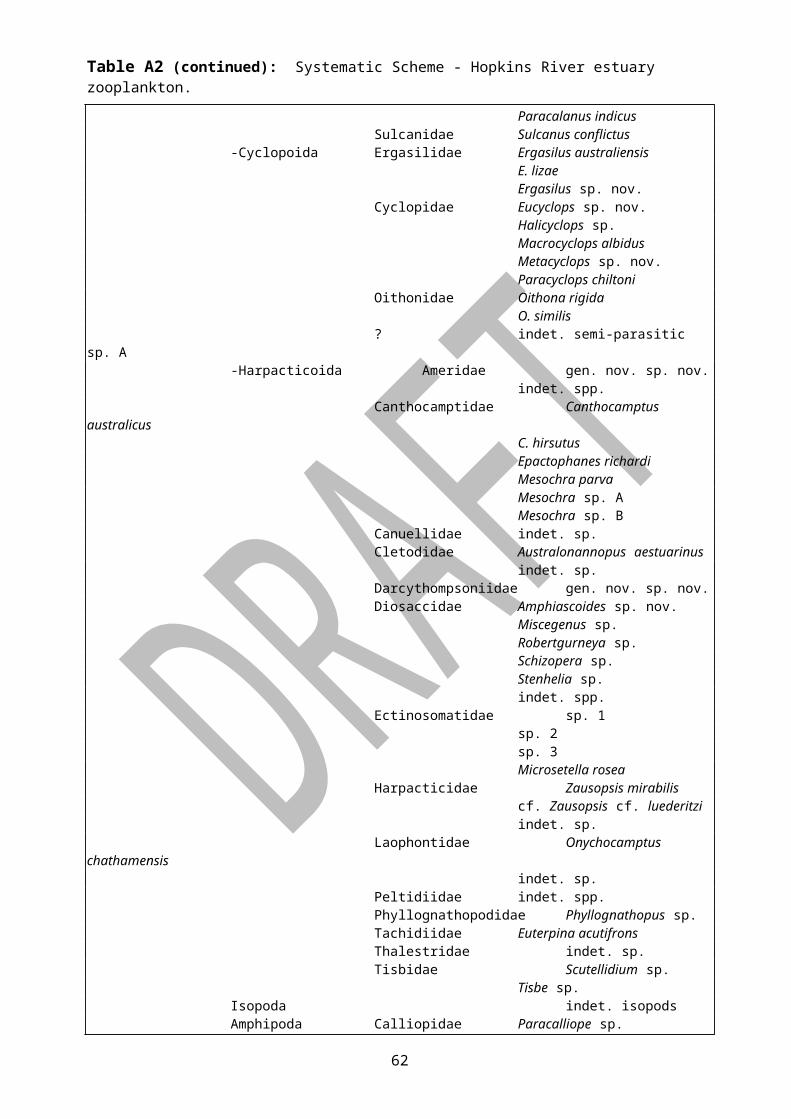
APPENDIX D – DETAILED DESCRIPTION OF THREATS
This appendix provides information about the known and potential threats to the Salt-wedge Estuaries ecological community. This information helps to explain why the ecological community merits listing as threatened, and supporting the assessment for listing against criteria at Appendix E. The threats outlined have corresponding conservation actions which are detailed in Section 6 of the Conservation Advice.
D1: Flow regime modification
D1.1: Water extraction
The extraction of water resources for domestic, agricultural and industrial use in Victoria has had a widespread and long-term impact on the aquatic ecosystems of the State’s rivers, streams and estuaries (DSE 2003b). The cumulative impact of water extraction constitutes a direct threat to most estuaries within the Salt-wedge Estuaries ecological community.
Surface water is extracted from river systems through the construction of in-stream water storages (i.e. reservoirs), diversions and through direct pumping. Reservoirs are the largest single source of water extraction in most affected estuaries and they significantly modify the flow regime of river systems (DSE 2003b). Reservoirs trap a high proportion of natural inflows, substantially reduce overall downstream flows to estuaries, alter the natural frequency and seasonality of flows and floods, and extend low-flow periods (DSE 2003b). Diversions and direct pumping also contribute to the reduction of downstream flows.
The most notable impact to the ecological community as a result of altered flow regimes is longer periods of mouth closure (Barton et al. 2008). This limits flushing of estuaries and increases water residence time. Reduced flows can result in the build-up of anoxic waters, hypersalinity, increased occurrence of algal blooms, reduced channel scouring, reduced distribution of organic matter downstream, and can lead to high concentrations of ammonia and sulphide (Barton et al. 2008; GHCMA 2006a; DPI 2016; NSW Scientific Committee 2002).
Altered hydrology of an estuarine system as a result of reduced freshwater flow is likely to have several serious impacts on the ecological community (GHCMA 2006a; NSW Scientific Committee 2002). This includes:
a reduction in available habitat for aquatic flora and fauna due to lower water levels
a reduction in lateral connectivity and reduced maintenance of ecological processes in water bodies adjacent to estuaries
affected spawning cues and conditions for hatching success for fish which rely on an estuary’s natural hydrologic regime and adequate freshwater inflow, and
altered faunal composition.
Within the ecological community, extraction for domestic water is undertaken in the Glenelg River, Gellibrand River (Wannon Water 2012), Barham River, St George River and Painkalac Creek (Barwon Water 2010). To a lesser extent, non-potable water is extracted from Kennett River and Wye River for domestic purposes (Planisphere 2008). Powlett River is indirectly affected by extraction for domestic water, with a reservoir located on its tributary, Lance Creek (South Gippsland Water 2011).
62

The Glenelg River is an example of an estuary that is strongly impacted by water extraction. The Rocklands Reservoir diverts water from the Glenelg River’s upper catchment, with additional diversions in place lower down in the catchment (Barton & Sherwood 2004). Landholders and commercial licence holders extract water from the Glenelg River for irrigation, domestic, stock, industry and dairy (Southern Rural Water 2013). Black bream, for example, rely on the estuarine hydrologic regimes and adequate freshwater inflow. Missing year classes in the black bream population in the Glenelg River estuary indicates that spawning is not always successful in the estuary, likely due to reduced water quantity (GHCMA 2006a).
Regulation of water extraction
In Victoria, water extraction is regulated under the Water Act 1989 and includes bulk entitlements and water licences. The water corporations that hold bulk entitlements for the use and delivery of water from reservoirs upstream of estuaries in the ecological community are Barwon Water, which owns and operates Olangolah, West Gellibrand, Painkalac and Allen Reservoirs, and Grampians Wimmera Mallee Water, which has bulk entitlements for the Glenelg River (Victorian Water Register 2017).
All water extraction for commercial purposes is required to be metred and data recorded (under the conditions of a bulk entitlement or licence). However, licenced water extraction for stock and domestic purposes is not required to be metred (Southern Rural Water 2017a). In addition, a person in Victoria does not require a licence to take water from a waterway for domestic and stock purposes if their property title includes or abuts a river or creek (Southern Rural Water 2017b). As a result, there is likely a large cumulative unquantified volume of unregulated water that is being extracted from each river system in western and central Victoria.
There is a high level of complexity relating to water extraction. There are insufficient data available to quantify the volume of surface water leaving a river system through extraction. The available data for commercial water extraction demonstrates that a significant volume of water is being taken out of any given river system annually. However, this does not represent the actual extractive volume. Other confounding factors, such as climate, evaporation and groundwater infiltration, contribute to the loss of surface water and further complicate any attempt to quantify the total volume of water extracted from the parent river systems and the subsequent impacts to the ecological community.
D1.2: Estuary entrance modification (artificial opening)
Estuary management includes the periodic mechanical opening of sand barriers at the estuary entrance to release water out to sea (Barton & Sherwood 2004). Artificial opening of estuaries is often undertaken to avoid flooding and associated damage to urban, industrial and agricultural land (Barton & Sherwood 2004). However, this poses a significant threat to the Salt-wedge Estuaries ecological community as it alters natural estuarine hydrodynamic cycles, natural patterns of variation in water quality, and biotic distribution and abundance (GHCMA 2006a, b).
When an estuary entrance is opened artificially, the top freshwater layer is lost. This leaves behind an anoxic or poorly oxygenated saline layer and causes a rapid increase in salinity (Barton & Sherwood 2004; GHCMA 2006b). Artificial opening of the estuary entrance can have several implications for the biological function of the ecological community (Barton & Sherwood 2004; GHCMA 2006b), including:
63

extensive mortality of estuarine organisms (e.g. fish kills) if all adequately oxygenated water is lost from the estuary
disruption to faunal migration and reproduction cycles, and
disruption of fish spawning cues and flushing of fish eggs and larvae.
The Surry River, Gellibrand River and Aire River estuaries have all recorded highly visible fish kills as a result of artificial opening, with unconfirmed reports suggesting the same situation has occurred in Yambuk Lake (Eumeralla River estuary) (Barton & Sherwood 2004; EPA 2007; GHCMA 2007; RMCG 2016). For example, a major fish kill occurred in the Surry River estuary in 2005 following illegal opening of the estuary mouth, which resulted in the mortality of an estimated 30 000 fish of various species (GHCMA 2007).
Artificial opening is undertaken in the estuaries of the Glenelg River, Fitzroy River, Merri River, Hopkins River, Curdies River, Barham River, Painkalac Creek, Anglesea River, Spring Creek, Thompson Creek and Powlett River (CCMA 2017; GHCMA 2005, 2006a, b, 2008, 2016; Water Technology 2008; WGCMA 2015).
D1.3: Regulatory infrastructure
Regulatory infrastructure, such as reservoirs, weirs and levees, are installed and operated for a variety of reasons, including water diversion and storage for urban and rural use, flood mitigation, prevention of salt-water intrusion upstream and road crossings (DPI 2016; NSW Scientific Committee 2002). Regulatory infrastructure can significantly alter natural flow regimes, with longitudinal and lateral changes to water flow impacting all orders of streams and rivers, floodplain wetlands and flow of freshwater into estuaries (DoW 2015; NSW Scientific Committee 2002).
Several estuaries within the ecological community are directly impacted by the installation of regulatory infrastructure in their parent river systems (see Table D1). Although the impacts on these affected estuaries from water regulation are difficult to quantify, it is likely that the unique balance between hydrology and morphology, which is crucial for supporting and building resilience in the ecological community, has been substantially altered. For example, the capture and release of water from in-stream reservoirs alters the frequency, duration, magnitude, variability and seasonality of freshwater flows downstream to estuaries (DPI 2016; NSW Scientific Committee 2002). Weirs and flood levees also affect the downstream flow of water into estuaries, as well as the inundation of adjacent habitats (DEPI 2013; DoW 2015; NSW Scientific Committee 2002). In addition, regulatory infrastructure can have significant impacts on natural in-stream processes, including altered rates of erosion, transport and deposition of sediment (DPI 2016) and reduced transport and distribution of organic material (DEPI 2013; DoW 2015; NSW Scientific Committee 2002).
The physical impacts of regulatory infrastructure on waterways has several implications on the biological function of the ecological community (DEPI 2013; DPI 2016; NSW Scientific Committee 2002), including:
impaired fish movement and migration due to the physical barriers, resulting in reduced genetic flow between populations located on either side of barriers (i.e. weirs, culverts and road crossings)
impaired growth of biota and disruption to natural environmental cues for spawning and reproduction from altered flows, and
64
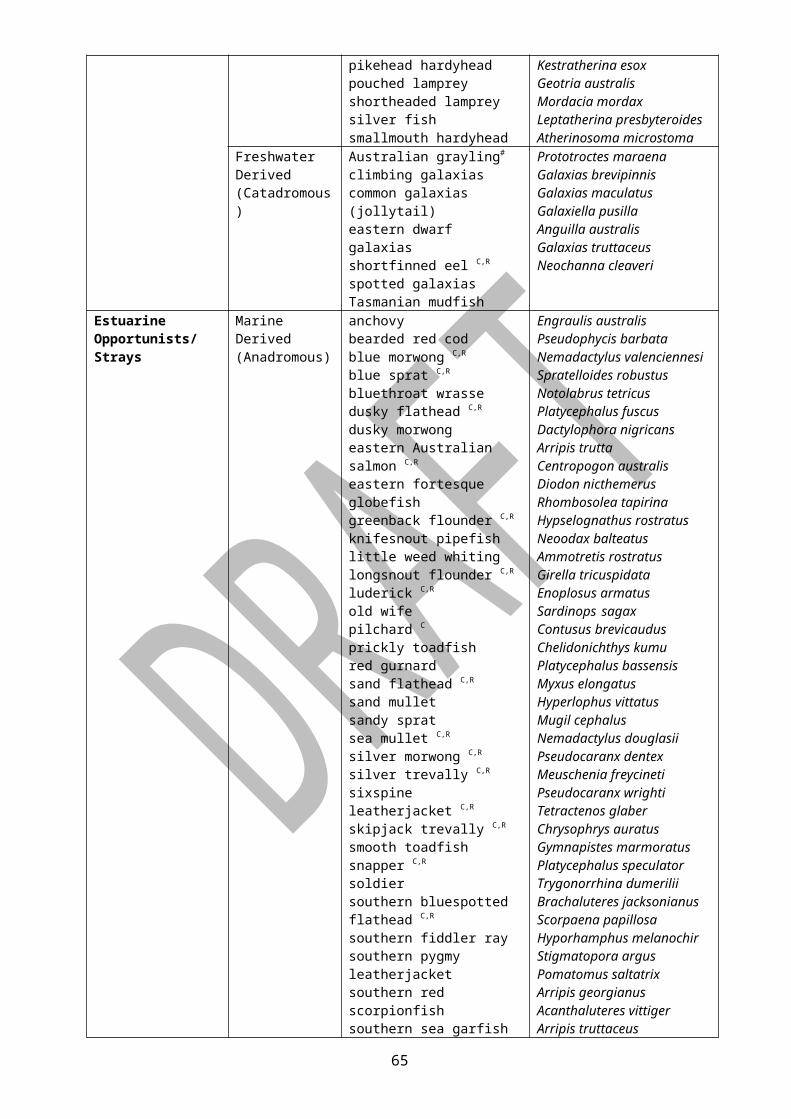
loss and degradation of habitat and altered diversity and structure of faunal community.
The construction of non-regulatory infrastructure within waterways, such as road crossings and bridges, can also result in alteration of natural flow regimes (NSW Scientific Committee 2002). Road culverts and bridge pylons can modify channel morphology, increase water velocity, obstruct movement of woody debris, influence channel anabranching, provide habitat for novel (including invasive) species and alter erosion and sedimentation patterns (Suvendu 2013).
The regulatory and non-regulatory infrastructure located in each salt-wedge estuary of the ecological community is listed in Table D1.
65

Table D1: Significant regulatory infrastructure and non-regulatory infrastructure within the rivers of the Salt-wedge Estuaries ecological community.
Estuary Infrastructure Glenelg River Rocklands Reservoir (upstream dam)Surry River Princess Highway bridgeFitzroy River Tyrendarra School Road bridgeEumeralla River Unnamed bridges.
Merri River (East)
Merri bridge, Bromfield Street weir, Swinton Street bridge, Stanley Street bridge, Harris Street bridge, Wellington Street bridge, Princes Highway bridge, Caramut Road bridge.
Hopkins River Hopkins Point Road bridgeCurdies Inlet Great Ocean Road bridge, Boggy Creek Road bridge.Port Campbell Creek Great Ocean Road bridgeSherbrook River Great Ocean Road bridge
Gellibrand River
Old Coach Road bridge, Jansons Access bridge, Coxens Access bridge, levee banks in upper estuary, West Gellibrand Reservoir and Olangolah Reservoir (upstream dams), and Gellibrand River North and South Offtakes.
Johanna River Private road crossingAire River Great Ocean Road bridge, Sand Road bridge. Barham River Great Ocean Road bridge, Apollo Bay Recreation Reserve road bridge, Barham
River offtake East and West Branch (diversion weirs)Kennett River Great Ocean Road bridgeWye River Great Ocean Road bridge, Wongarra Drive bridge.St George River Great Ocean Road bridge, Allen Reservoir (upstream dam).Erskine River Great Ocean Road bridge, Erskine River offtake (decommissioned diversion).Painkalac Creek Great Ocean Road bridge, Painkalac Reservoir (upstream dam)
Anglesea RiverGreat Ocean Road bridge, Coalmine Road bridge, Anglesea Mine (decommissioned coal mine), Anglesea Power Station (decommissioned).
Spring Creek Great Ocean Road bridgeThompson Creek Blackgate Road bridge, Thompson Creek weir (upstream).
Powlett RiverMouth of Powlett Road bridge, Nyora-Wonthaggi Rail Trail bridge, Powlett River offtake (Wonthaggi offtake).
Darby River Wilsons Promontory Road bridge Tidal River Wilsons Promontory Road bridgeGrowlers Creek None
D2: Climate change and related impacts
Climate modelling and projections by CSIRO (2015) indicates that the region of the Salt-wedge Estuaries ecological community will continue to experience a decrease in cool season rainfall, an increase in air and sea surface temperature, mean sea level rise, frequency of extreme weather events and ocean acidification, and a harsher fire weather climate. It is likely that salt-wedge estuaries are extremely vulnerable to climate change, given their reliance on salinity stratification from marine and freshwater inputs, and the associated risk of becoming marinised (Sherwood 1988; Hirst 2004). Due to other threatening processes, many estuaries within the ecological community are considered stressed systems and are less likely to be resilient to the added impacts of climate change (Mondon et al. 2003; Barton et al. 2008; Pope et al. 2015; EPA 2011). The likely impacts of climate change on the ecological community are at Table D2.
66
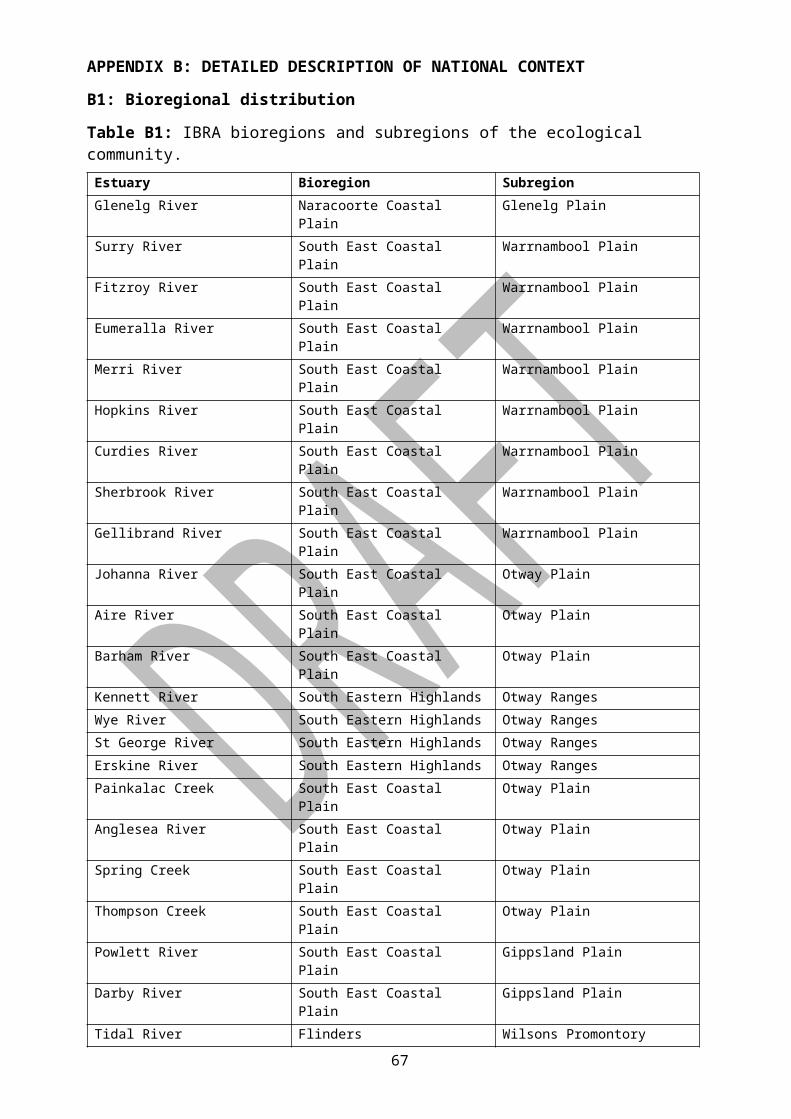
Table D2: Likely impacts of climate change on the Salt-wedge Estuaries ecological community (modified from Newton 2007, OzCoasts 2008, Sherwood 1988, Voice et al. 2006, EPA 2011, CSIRO & BoM 2015, Glamore et al. 2016 and DPI 2016).
Climate Driver Potential ImpactsIncreased temperature
Increased evaporation rates of shallow water bodies. Decreased dissolved oxygen, with increased risk of hypoxia and fish kills. Increased release of nutrients/toxicants from sediments into water column. Altered rate of photosynthesis; productivity of estuary may be compromised. Water temperature may exceed thermal tolerance of some species, which may
lead to shift or decline in abundance and distribution of sensitive species. Altered phenology, including reproduction, growth, metabolism, respiration,
spawning, migration, dormancy, dispersal and community structure. Loss of synchrony between fauna and food sources. For example as temperature
increases cues that fish respond to for spawning may not correspond with abundance of invertebrate hatching.
Changes to thermal stratification of water column may affect species distribution and movements. Increased stratification may result in lower abundance of zooplankton and increased incidence of jellyfish blooms.
Increased risk of invasive species (including algal blooms), pathogens and parasites.
Sea level rise Increased penetration of damaging waves to estuaries and low lying coastal ecosystems, causing erosion of protective dune barriers and sandbars at mouths, allowing greater marine influence. Existing wetlands may become lagoonal and new wetlands may develop in low lying areas.
Landward displacement of estuarine boundaries and riparian habitat, with increased saltwater intrusion upstream and altered estuarine tidal range. In some areas it may not be possible for the estuary to adjust range or position due to artificial barriers.
Altered periods of mouth closure; intermittently open estuaries may convert to more permanently open estuaries.
Nursery function of estuary (i.e. for fish, crustaceans) may be compromised.Reduced rainfall Lower average runoff to rivers and estuaries resulting in reduced base inflows,
and altered frequency and reduced magnitude of outflows. Altered entrance opening regimes with reduced erosion of sandbars at mouth. Shallower freshwater layer in salt-wedge. Increased marine component of estuaries, with marine zone moving further up
into estuaries, when entrance is open to the sea. Reduced flushing of estuaries resulting in increased retainment of poor quality
water and increased risk of hypersalinity and anoxia and possible fish kills. Reduced sediment inflows resulting in progressive erosion, saltwater inundation
and reduced salinity stratification. Reduced area of habitat for aquatic organisms. Productivity and nursery function of estuary may be compromised. Changes to dispersion and mixing of particulates, including pollution. Altered phenology and species composition. Loss of synchrony of species migration with entrance opening.
Extreme weather events
Increased frequency of storm events, higher reach from storm surge and flash flooding may alter salinity distribution, affecting salt-wedge stability or lead to abrupt decreases in salinity.
Increased periods of freshwater may affect sensitive estuarine species. Extreme rainfall may result in increased runoff and sediment inflows to estuaries
resulting in progressive infilling, enhanced estuary maturation, increased 67

pollution, reduced water quality and eutrophication. Stronger flushing influence of ‘high flow’ periods may result in increased loss of
local communities and erosion, particularly at mouth. Strong winds or cyclones may affect mixing, erosion, and wave climate.
Increased acidification
Increased CO2 concentration in seawater is resulting in more acidic oceans, affecting calcitic organisms, coastal food webs and productivity, with flow-on effects (physical and biological) to estuaries.
Heavy rain induced runoff from exposed acid sulphate soils may lead to acid flows into estuaries, affect plant and fish growth, and can lead to fish kills.
Increased fire and wind
Increased frequency and/or intensity of aeolian dust and fire-born particulates can affect estuarine productivity and promote algal blooms. Similarly, more intense fires in catchments is likely to exacerbate runoff and sediment inflows.
Shifts in prevailing winds may influence surge frequency and wave climate.
D3: Land use and declining water quality
Estuaries are the interface between terrestrial, freshwater and marine environments, making them vulnerable to anthropogenic pressures and consequent degradation (Hallet et al. 2016). Victorian estuaries have high land use intensity (Barton et al. 2008) and clearing of native vegetation industry has significantly modified the landscape and altered hydrology (Barton et al. 2008; RMCG 2016). Most of the estuaries within the ecological community are impacted by land clearing and development within their catchments. Impacts of land clearing and development on the ecological community include degradation and loss of estuarine habitat, altered ecology, loss of sensitive native species and increased presence of invasive species (Barton et al. 2008).
Overland water flow across cleared land and hard urban surfaces, particularly during storm events, results in:
increased volume and velocity of water runoff into waterways
increased catchment erosion, turbidity and sedimentation of waterways
reduced water quality, and
decreased infiltration and groundwater storage (Barton et al. 2008; DPI 2016).
For example, the Eumeralla River catchment now contains only 2.4 percent of its estimated vegetation cover prior to European settlement. The condition of the catchment has affected the estuary area with impacts including a patchy riparian zone, bank erosion and low levels of in-stream habitat where riparian habitat has been reduced (GHCMA 2004).
D3.1: Increased erosion, turbidity and sedimentation
Removal of native vegetation, construction of hard surfaces, overgrazing and unrestricted stock access to waterways are examples of land use that increase the rate of erosion, runoff and sediment load entering waterways (DSE 2003a; WGCMA 2015).
Increased erosion and runoff causes a higher load of suspended sediment in the water column. This results in increased turbidity, and nutrient and chemical levels, and reduced levels of dissolved oxygen and light penetration (DoW 2015; DSE 2003a). Higher than normal levels of
68
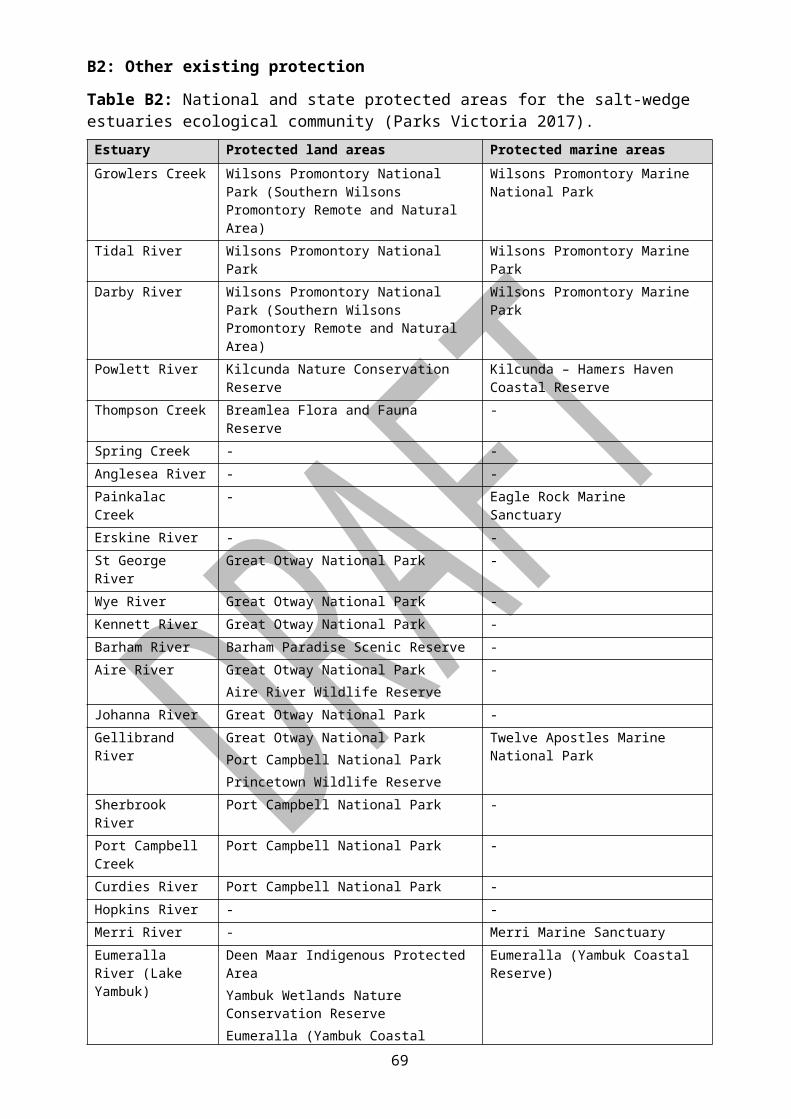
suspended sediments in the water column causes the following issues in aquatic biota (DoW 2015; DSE 2003a):
limited photosynthesis and reduced growth of seagrass and phytoplankton which can have effects on nutrient cycling up the food chain
altered behaviour and displacement of fauna
reduced feeding, development, growth rate and oxygen uptake, and
increased stress, incidence of disease and mortality.
Sedimentation is a natural process that occurs when suspended material settles out of the water column as water velocity decreases (Barton & Sherwood 2004; DoW 2015). However, changes in land use, in conjunction with reduced streamflow, can alter natural sedimentation rates (DoW 2015). Accelerated sedimentation has several implications on the ecological community (Barton et al. 2008; DoW 2015; DSE 2003a; GHCMA 2006b), including:
accumulation of sediments in river channels, causing redirection of streamflow and further erosion
movement of ‘sand slugs’ down river with alteration of aquatic habitat, including infilling of river holes and deep pools, reducing habitat diversity and eliminating refuges for aquatic fauna during summer and drought
smothering of seagrass, filter feeding organisms and eggs (reducing gas exchange and preventing development)
infilling of the estuary, decreasing water depth, and
increasing nutrient and chemical load within the water column and bed material.
The upper Glenelg River has a slow moving sand slug as a result of erosion and poor historical land management (GHCMA 2006b). The slug is moving downstream at a rate of 220 m per year and the volume of sand in the river is estimated to equate to 20-30 percent of the volume of the Glenelg River estuary (Sherwood et al. 1998). The sand slug has already caused a reduction of species diversity and loss of habitat in the river and poses a substantial threat to the ecological community should it reach the estuary (GHCMA 2006b).
D3.2: Eutrophication and algal blooms
Eutrophication (nutrient enrichment) occurs when nutrient input into a waterway is accelerated beyond natural levels (River Science 2005). Compounds containing nitrogen and phosphorus are the most common drivers of eutrophication (DoW 2015). Microalgae, macroalgae and phytoplankton growth is linked closely to the supply and bioavailability of nutrients in the water column. Algal blooms are natural phenomena, with high nutrient levels, light and temperatures promoting algae growth. However, eutrophication has led to increased frequency and duration of algal blooms (DoW 2015). Algal blooms can dominate waterways and this has several implications for the ecological community (DoW 2015), including:
altered levels of dissolved oxygen;
toxicity to aquatic organisms and interference with fish gills leading to mortalities, and
shading of seagrasses and other aquatic plants.
69

Many estuaries within the ecological community are now commonly affected by algal blooms. Algal blooms have been recorded on several occasions in the Surry River estuary as a result of elevated nutrient levels being released from sediments under anoxic conditions (GHCMA 2007). Painkalac Creek, particularly Painkalac Reservoir, is subject to seasonal blue-green algal blooms (Barwon Water 2015). Fish deaths have been recorded in the Painkalac Creek as a result of low dissolved oxygen (EPA 2007), which is likely caused by eutrophication and algal blooms. Algal blooms have also been recorded in the Curdies River (Barton & Sherwood 2004), Merri River (GHCMA 2008) and Hopkins River (GHCMA 2005).
D3.3: Acid flows and blackwater events
Acid sulphate soils and acid flows
Acid sulphate soils contain metal sulphides (DEDJTR 2015a) which produce sulphuric acid when exposed to oxygen (CCMA 2008; DEPI 2013). Acid sulphate soils occur naturally and, if undisturbed, are largely benign (DEDJTR 2015a; DEPI 2013). They are formed and contained in waterlogged soil, which forms a barrier to the air. Acid sulphate soils are referred to as potential acid sulphate soils (PASS) when they have the potential to oxidise (CCMA 2008). Oxygenation and production of acid occurs when acid sulphate soils are exposed to the air through disturbance (e.g. dredging) or when water is drained naturally (through drought) or artificially from the soil. This is referred to as actual acid sulphate soils (CCMA 2008). Surrounding soil can neutralise some sulphuric acid, however, sulphuric acid can move through soil, acidifying soil water, groundwater and surface water (CCMA 2008).
Actual acid sulphate soils and potential acid sulphate soils have been identified within the Salt-wedge Estuaries ecological community (CCMA 2008; DEPI 2013). Actual and potential acid sulphate soils occur at Anglesea River, Barham River estuary and are likely to occur at Painkalac Creek. Potential acid sulphate soils occur at the Eumeralla River estuary and may occur in areas surrounding the Glenelg River, Surry River, Fitzroy River, Merri River, Curdies River, Port Campbell Creek, Sherbrook River, Gellibrand River, Johanna River, Aire River, Kennett River, Wye River, Erskine River, Spring Creek and Thompson Creek (DEDJTR 2015a).
Acid sulphate soils and acid flows have several implications for the ecological community. The lowering of the pH in the soil severely affects land and riparian vegetation cover. Sulphuric acid reduces the availability of nutrients to plants and dissolves iron and aluminium turning the soil toxic. This retards plant growth and causes most plants to die, leaving scalded and bare soil (CCMA 2008; DEPI 2013), which has additional implications of increased erosion and runoff. Heavy rainfall following prolonged drainage of acid sulphate soils results in large slugs of sulphuric acid and dissolved metals and metalloids entering waterways causing acid flows (DPI 2017a). The implications of acid flows for the ecological community (DEDJTR 2015a; DEPI 2013; DPI 2017a) include:
widespread mortality of aquatic biota, including fish, plants, crustaceans and microscopic organisms, due to low pH, heavy metal toxicity and depletion of dissolved oxygen
increased light penetration and water temperature as a result of high levels of aluminium can increase the risk of fish suffering sunburn and melanoma
reduced health of fish and other fauna, with acid damaged skin and gills, retarding regulation of salts and water, and increasing the susceptibility of fauna to disease. For example, affected fish are susceptible to fungal infections such as red spot disease
70

reduced growth, development, spawning and recruitment (damaged/undeveloped eggs)
smothering of plants and streambeds with precipitated iron solids
habitat invasion from acid-tolerant plant and planktonic species, preventing other species from re-establishing once pH returns to normal
affected faunal migration due to chemical pollution acting as a barrier, and
long term changes to habitat and species composition.
Large fish kills as a result of acid flows have been recorded in the Anglesea River (e.g. 2001) (EPA 2007; Maher 2011; Pope 2010). The Anglesea River catchment has very high levels of sulphur-containing soils with acid sulphate soils surrounding the estuary (DEDJTR 2015a; Pope 2010). The Anglesea River frequently experiences acid flows, with low pH of 3-4 and high levels of dissolved metals (Maher 2011; Pope 2010) caused by natural leaching of acid from the catchment (EPA 2007).
Blackwater events
Blackwater events occur when high amounts of organic matter, such as leaf litter, are carried into a waterway (e.g. during high rainfall) turning the water black with carbon compounds, including tannins. Decomposition of the organic matter by bacteria results in high levels of dissolved organic carbon and chemicals (e.g. polyphenols), and low levels of dissolved oxygen (Pahor & Newton 2013). This can have catastrophic short-term consequences, including suffocation and mortality of fish, crustaceans and other fauna due to hypoxia (EPA 2007; Pahor & Newton 2013). Blackwater events have been recorded in some of the estuaries of the ecological community. For example, in 2007, an extensive fish kill was reported in the Glenelg River estuary as a result of a blackwater event occurring after heavy rainfall (EPA 2007).
D3.4: Increased pollution
Pollution of a waterway occurs when natural and man-made contaminants enter the water either directly or indirectly (EPA 2012). Direct discharge of pollution into waterways can occur through several means, including industrial spill events (EPA 2007). Indirect sources of pollution often result from runoff from urban, industrial and agricultural areas and can include topsoil, rubbish, organic waste, metals, chemicals (e.g. herbicides) and petroleum by-products (DPI 2016).
Indirect anthropogenic sources of pollution are a major contributor of pollution to Victorian waterways and can result in significant impacts to water quality (DEPI 2013). Several recorded fish kills in Victoria have been directly attributed to waterway pollution (EPA 2007). The implications of pollution on the ecological community (Islam & Tanaka 2004), include:
degradation of habitat and reduced water quality
acidification (e.g. ammonia) and chemical toxicity which can affect biota through mortality, physiological damage and deformities, reproductive failure and increased susceptibility to disease
eutrophication and hypoxia of waterways and associated impacts on biota, and
biomagnification of toxins up the food chain, reduced recruitment, decline or loss of pollution sensitive species and altered species composition.
71

D4: Pathogens and pests
D4.1: Disease (pathogens and parasites)
Pathogens (including viruses, bacteria and fungi) and parasites are a significant threat to native species. They can cause disease and infection, alter physiology and behaviour, limit reproduction and recruitment, cause widespread mortality in affected populations and alter community structure (Scott 1988; Roennfeldt 2013). Importantly, it is recognised that viral infection in phytoplankton (primary producers) can disrupt ecosystem dynamics by impacting the flow of carbon and nutrients to higher trophic levels (Suttle 2007).
Roennfeldt (2013) found that the copepod populations of the Hopkins River, Glenelg River and Painkalac Creek estuaries are affected by an Iridovirus. The virus causes behavioural and physiological changes, with infection of the reproductive systems, secretary gland cells and connective tissues of the host. It leads to a cessation of reproduction and in many cases, morbidity (Roennfeldt 2013). The virus in epidemic proportions leads to low copepod densities which has a bottom up effect on the food chain, particularly on copepodivorous larval fishes such as black bream (Roennfeldt 2013).
Several estuaries within the ecological community have been affected by pathogens and parasites other than viruses. For example, in 2004, black bream in Yambuk Lake estuary were found to have ulcers and lesions consistent with Epizootic Ulcerative Syndrome or Red Spot Disease but testing of samples was inconclusive (GHCMA 2006b).
D4.2: Invasive species
Aquatic ecosystems are highly vulnerable to invasion by pests. Since European settlement, many non-native species have become established in Victorian waterways, and these can have a range of impacts on the ecological community (DSE 2003c; GHCMA 2006c; DPI 2016), including:
predation of native species
competition for resources and exclusion of native species
alteration and degradation of habitat structure and characteristics
introduction and transfer of pathogens and parasites
decline and loss of native biodiversity, and
altered faunal composition and structure.
The following invasive species may pose a threat to the Salt-wedge Estuaries ecological community at present or in the future:
Common carp (Cyprinus carpio) is a highly fecund and opportunistic species that can tolerate brackish water (10-18 ppt, Koehn et al. 2000). Carp compete with native fish for resources, destroy submergent macrophytes, reduce water quality through feeding, and cause erosion and collapse of river banks (DPI 2017b; Roberts et al. 1995; Roberts & Sainty 1996; Vilizzi et al. 2014). Carp are known to occur in low numbers in the Glenelg River (GHCMA 2006b; DEDJTR 2015b) and in Thompsons Creek (DEDJTR 2015c).
Eastern gambusia (or mosquitofish) (Gambusia holbrooki) is a well-established and noxious species which threatens native fish through predation and competition (DPI 2017c). The species is known to harass and impact small native fish through fin-nipping (Koehn & O’Connor 1990; Bayley & Li 1992, Arthington & McKenzie 1997; Tonkin et
72

al. 2011). Eastern gambusia can tolerate and adapt to relatively high levels of salinity (Rowe et al. 2008). The species occurs in high numbers in the Hopkins River and the Merri River (GHCMA 2005, 2008). It is also known to occur in the Barham River, St George River, (DEDJTR 2015c) and Thompson Creek (Ryan & McGuckin 2007).
The yellowfin goby (Acanthogobius flavescens) occurs in both freshwater and saltwater, and breeds in estuaries. It threatens native fish mainly through competition for resources (DPI 2017d). The yellowfin goby occurs in the Powlett River and its estuary (DEDJTR 2015e).
The tubeworm (Ficopomatus enigmaticus) is a sedentary polychaete that can occur in fresh, brackish, marine and hypersaline water. The species forms extensive calcareous reef structures that can alter habitat, community structure, water flow and sedimentation rates (Dittmann et al. 2009). The tubeworm occurs downstream in the Hopkins River (GHCMA 2005b).
Willows are highly invasive plants that degrade the condition of river channels. They trap sediment in extensive root mats, raise channel bed levels, diverting water flow over the bank and cause erosion and channel widening (DEPI 2013). Willows also crowd out native species and their leaves can reduce water quality (DEPI 2013). Some willow species, such as weeping willow, are tolerant of brackish water (DEDJTR 2015d). Willows are a significant problem in the Fitzroy River (GHCMA 2006a) and the Gellibrand River (DELWP 2016).
D5: Extractive and recreational activities
D5.1: Fishing – commercial and recreational
Fisheries Victoria regulates commercial and recreational fishing by stocking waterways with target fishing species, managing fishing licences, enforcing fishing gear restrictions and seasonal or area closures (DEPI 2013). Fisheries Victoria enforces bag and size limits to ensure fishing activities do not reduce the breeding population of fish species below viable levels (DEPI 2013; GHCMA 2006b).
Fishing is a popular recreational activity but the cumulative effects of poor fishing practices pose potential threats to estuaries (GHCMA 2007), including:
inappropriate disposal of non-biodegradable waste including bait bags, fishing hooks and line resulting in entanglement of fauna
the taking of undersized fish and overfishing, and
disturbance to shoreline vegetation and damage to important habitat areas.
These threats may have several implications on the Salt-wedge Estuaries ecological community (Barton et al. 2008; Blaber et al. 2000), including:
reduced abundance of some species
altered age structure in some species
decreased recruitment of some species, and
altered ecosystem dynamics when higher trophic levels are impacted.
73

The level of impact from fishing on the ecological community is reduced through regulation by Fisheries Victoria, and the risk of overfishing is considered low. However, commercial and recreational fishing remains a potential threat to all estuaries within the ecological community.
D5.2: Mining and extraction activities – coal and sand
Mining and extraction activities pose a potential threat to at least two estuaries within the Salt-wedge Estuaries ecological community - coal mining near the Anglesea River and sand extraction works in the Glenelg River.
The Glenelg Hopkins Catchment Management Authority has implemented a program of managed sand extraction in the Glenelg River to address the ongoing impacts of sand slugs and reduce the volume of sand migrating downstream (GHCMA 2006b; GHCMA 2016). Between 2004 and 2008, the Glenelg Hopkins Catchment Management Authority was involved in the removal of 180 000 m3 of sand from the Glenelg River at 18 different sites (GHCMA 2016). Authorised extractors continue to remove sand from the river for commercial purposes (e.g. concrete manufacture) (GHCMA 2016). Sand extraction is used as a management tool upstream of the estuary to enhance river condition. It is unclear whether sand extraction is likely to have impacts on the ecological community. However, the activity is likely to cause short term or localised channel disturbance, increased turbidity and the use of machinery may cause increased bank erosion (Padmalal & Maya 2014).
In 1963, an open cut coal mine and coal-fired power station were established at the head of Anglesea River, altering river discharge from naturally intermittent flows to consistent year round flows (GHD 2016). The mine and power station were decommissioned in 2015, but during operation they contributed to the pollution of the Anglesea River through effluent discharge (GHD 2016). The Anglesea is expected to be impacted by the cessation of discharge from the power station in 2016 (GHD 2016). This has, or will, reinstate natural and variable water flow but will decrease the water level of the river by up to one metre, exposing acid sulphate soils (GHD 2016). It is considered that the cessation of discharge from the power station is likely to increase acid flows and metal concentrations in the river (GHD 2016).
D5.3: Recreation – boating
Boating activities in Victoria are an important economic driver for many local towns. Recreational and commercial vessels operate in most waterways in western and central Victoria, including within the Salt-wedge Estuaries ecological community. The use of boats in Victorian waterways is regulated under the Marine Safety Act 2010 by waterway managers (DEPI 2013a & 2013b).
Boating can have several implications on the ecological community. For example, the removal of boating safety hazards such as large woody debris from waterways can negatively affect native fish populations which require woody debris for habitat (2013a & 2013b). Permanent boat mooring causes mechanical disturbance to the river bed which can substantially impact on sea grass meadows (Demers et al. 2013). In addition, the waves caused by powered boats can contribute to bank erosion (2013a & 2013b). Boating may also cause some physical mixing of the stratified water column.
74
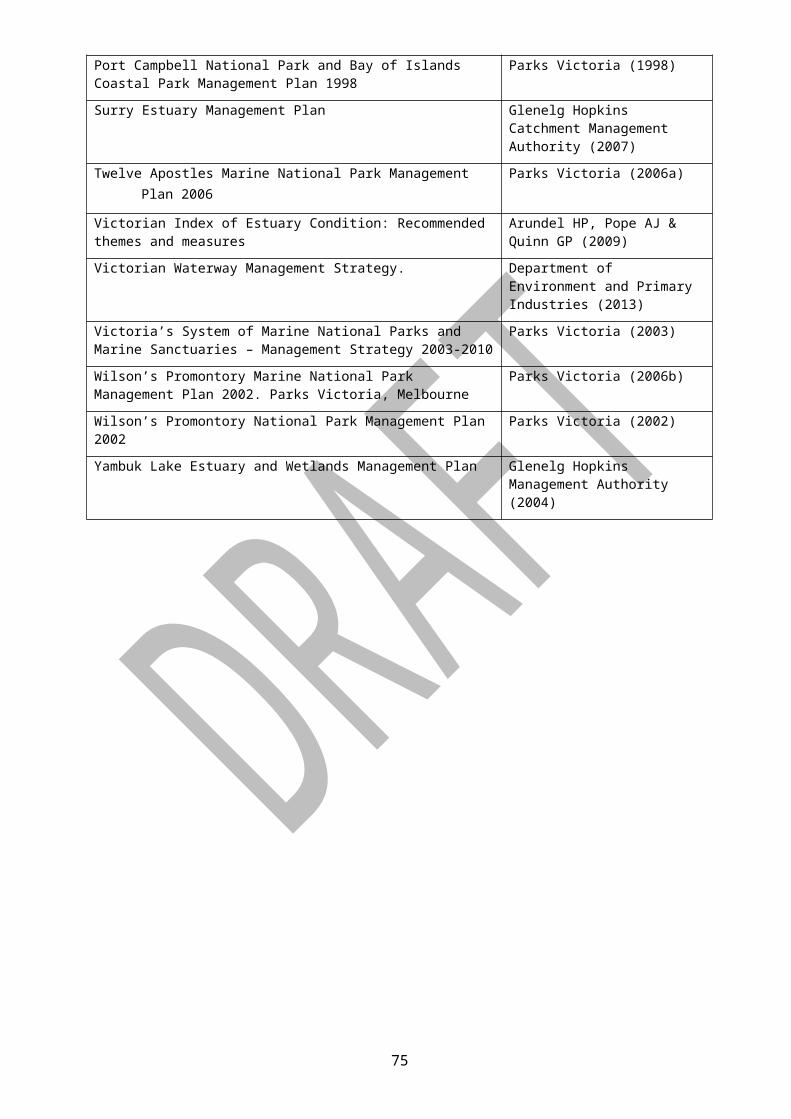
APPENDIX E: DETAILED ASSESSMENT OF ELIGIBILITY FOR LISTING AGAINST THE EPBC ACT CRITERIA
This appendix presents a detailed assessment of how the Salt-wedge Estuaries ecological community meets each of the six listing criteria. It forms the Listing Advice from the Threatened Species Scientific Committee to the Minister.
E1: Criterion 1 – Decline in geographic distribution
Criterion 1 - Decline in geographic distribution
Category Critically Endangered Endangered Vulnerable
Decline in geographic distribution is either: very severe severe substantial
a) Decline relative to the longer-term (beyond 50 years ago e.g. since 1750); or
≥ 90% ≥ 70% ≥ 50%
b) Decline relative to the shorter-term (past 50 years).
≥ 80% ≥ 50% ≥ 30%
Not Eligible for listing under Criterion 1
Evidence:
Over the longer term, there has been a decline in geographic distribution (area of occupancy) of the Salt-wedge Estuaries ecological community. The estuaries of Wattle Hill Creek and the Moyne River have been permanently opened and modified to the degree they have become marinised systems and are considered irreversibly lost to the ecological community (see Table E1).
Table E1: Estimated decline in geographic distribution of the Salt-wedge Estuaries ecological community (Source: A Pope 2017).
Estuary Area of Occupancy (ha) Timeframe Percent Decline*Wattle Hill Creek 18.7 > 50 years ago 0.99Moyne River 151.3 > 50 years ago 8.03TOTAL LOSS 170 ha 9.02 %
* Percent decline is derived using the combined total estimated surface area which is 1882.2 ha. This figure is the addition of the estimated surface area of the above estuaries (170 ha) and total estimated surface area of the Salt-wedge Estuaries ecological community (1542.2 ha) (see Table E2).
Conclusion
There has been a decline in the geographic distribution of the ecological community, but this decline is not considered to be a substantial decline (i.e. greater than 30 percent in the past 50 years). The Salt-wedge Estuaries ecological community is not eligible for listing under any category for this criterion.
75

E2: Criterion 2 – Limited geographic distribution coupled with demonstrable threat
The purpose of this criterion is to recognise that an ecological community with a limited distribution has an intrinsically higher risk of extinction, if it continues to be subjected to a threatening process. To meet this criterion, both a limited distribution and threat/s that could foreseeably cause the loss of the ecological community in a certain timeframe must be demonstrated.
Criterion 2 - Limited geographic distribution coupled with demonstrable threat
Its geographic distribution is: Very restricted Restricted Limited2.1. Extent of occurrence (EOO) < 100 km2
= <10,000 ha<1,000 km2 = <100,000 ha
<10,000 km2 = <1,000,000 ha
2.2. Area of occupancy (AOO) < 10 km2 = <1,000 ha
<100 km2 = <10,000 ha
<1,000 km2
= <100,000 ha 2.3. Patch size # < 0.1 km2
= <10 ha < 1 km2 = <100 ha
-
AND the nature of its distribution makes it likely that the action of a threatening process could cause it to be lost in:the Immediate future [within 10 years, or 3 generations of any long-lived or key species, whichever is the longer, up to a maximum of 60 years.]
Critically endangered Endangered Vulnerable
the Near future [within 20 years, or 5 generations of any long-lived or key species, whichever is the longer, up to a maximum of 100 years.]
Endangered Endangered Vulnerable
The Medium term future [within 50 years, or 10 generations of any long-lived or key species, whichever is the longer, up to a maximum of 100 years.]
Vulnerable Vulnerable Vulnerable
# A number of patch size measures may be applied here, depending on what data are available. 1) The mean or the median patch area. In cases where the ecological community is highly fragmented and the patch data distribution is skewed towards mostly small patches, the median would be a more appropriate measure. Otherwise, the smaller of the mean or median should be referred to. 2) The proportion of patches that fall within each size class. 3) Changes in patch size and distribution between the modelled pre-European and currently mapped occurrences.
Eligible under Criterion 2 for listing as Endangered
Evidence:
Extent of occurrence
The ecological community occurs along the western and central Victorian coast. The length between the mouths of the Glenelg River (most westerly estuary) and Growlers Creek (most easterly estuary) is 743 km. The extent of occurrence for the ecological community is best approximated by the area of a polygon which is bordered by the coastline between these two estuaries and a line-of-best-fit along the extent of salt-wedge penetration into the parent-rivers of the 25 systems. This area is calculated as 2268 km2, which places the extent of occurrence under Criterion 2 as ‘Limited’ (< 10,000 km2).
Area of occupancy
The area of occupancy of the ecological community is best approximated by the estimated surface area determined by the length of maximum salt-wedge penetration for each estuary and
76
their average width (see Table E2). The ecological community is estimated to occupy a total area of 15.4 km2. Under Criterion 2, the geographic distribution, or area of occupancy, of the ecological community is considered to be ‘Restricted’ (< 100 km2).
Table E2: Current area of occupancy of the Salt-wedge Estuaries ecological community (Source: Pope et al. 2015).
Salt-wedge Estuary Area of Occupancy
km2 ha
Glenelg River 5.520 552.0
Surry River 0.180 18.0
Fitzroy River 0.365 36.5
Eumeralla/Yambuk Estuary 1.000 100.0
Merri River (East) 0.541 54.1
Hopkins River 1.633 163.3
Curdies Inlet 3.466 346.6
Port Campbell Creek 0.016 1.6
Sherbrook River 0.030 3.0
Gellibrand River 0.337 33.7
Johanna River 0.019 1.9
Aire River 1.030 103.0
Barham River 0.136 13.6
Kennett River 0.015 1.5
Wye River 0.005 0.5
St George River 0.025 2.5
Erskine River 0.033 3.3
Painkalac Creek 0.125 12.577

Anglesea River 0.170 17.0
Spring Creek 0.041 4.1
Thompson Creek 0.258 25.8
Powlett River 0.300 30.0
Darby River 0.024 2.4
Tidal River 0.082 8.2
Growlers Creek 0.071 7.1
TOTAL 15.422 1542.2
Ongoing threats
There exist demonstrable and ongoing threats to the ecological community which impact the condition and functionality of the dynamic salt-wedge nature of the estuaries and the integrity of the ecological community. A comprehensive description of these threats and their implications is at Appendix D. An indicative summary of threats is provided at Table E3. Most of these threats will continue to operate, intensify and compound each other. For example, climate change impacts are projected to increase and intensify. Compounding this trend are increasing population growth, land clearance and recreational use along this coastline, which will in turn impact water extraction, water quality and estuary entrance management actions.
Conclusion
The naturally restricted geographic distribution and specific physico-chemical regime of these dynamic salt-wedge systems, combined with demonstrable, ongoing and compounding threats make it likely that the ecological community could be lost in the ‘near’ future (e.g. the next 20 years). The Committee considers that the Salt-wedge Estuaries ecological community has met the relevant elements of Criterion 2 to make it eligible for listing as Endangered.
78

Table E3 (a): Threats identified for open-coast salt-wedge estuaries of western and central Victoria.
Threat Glenelg Surry Fitzroy Eumeralla Merri Hopkins Curdies Port Campbell
Sherbrook
Climate changeSea level rise & storm surge × × × × × × × × ×Rising temperature × × × × × × × × ×Decline & altered seasonal pattern in rainfall
× × × × × × × × ×Modified flow regimeWater extraction - Domestic ×Water extraction - Agriculture / Industry
× × × × × × × p p
Estuary entrance modification × × × × × × ×Regulatory & other infrastructure (e.g. bridges)
× p p p × p p p p
Land use and declining water quality Land clearing & development × × × × × × × × ×Eutrophication & algal blooms × × × × × × × × ×Increased sedimentation, erosion & turbidity
× × × × × × × p p
Acid flows & blackwater events × p p p p p p pPollution & contaminants × × × × × × × × pPathogens and pests Disease × p p × p × p p pInvasive species × × × p × × × p pExtractive and recreational activities Fishing (commercial & recreational)
p p p p p p p p p
Mining & extraction activities (sand & coal)
×Recreation (boating) p p p p p p p
× = identified threat, p = potential threat
79
Table E3 (b): Threats identified for open-coast salt-wedge estuaries of western and central Victoria.
Threat Gellibrand Johanna Aire Barham Kennett Wye St George Erskine PainkalacClimate changeSea level rise & storm surge × × × × × × × × ×Rising temperature × × × × × × × × ×Decline & altered seasonal pattern in rainfall
× × × × × × × × ×Modified flow regimeWater extraction - Domestic × × p p × ×Water extraction - Agriculture / Industry
× p × × p p p p
Estuary entrance modification × × × ×Regulatory & other infrastructure (e.g. bridges)
× p × × p p × p ×Land use and declining water qualityLand clearing & development × × × × × × × × ×Eutrophication & algal blooms × × × × × × × × ×Increased sedimentation, erosion & turbidity
× × × × p p p × ×Acid flows & blackwater events p p p × p p p p ×Pollution & contaminants × × × × × × p × ×Pathogens and Pests Disease p p p p p p p p ×Invasive species × p × × p p × p pExtractive and recreational activitiesFishing (commercial & recreational)
p p p p p p p p p
Mining & extraction activities (sand & coal)Recreation (boating) p p p p p
× = identified threat, p = potential threat
80

Table E3 (c): Threats identified for open-coast salt-wedge estuaries of western and central Victoria.
Threat Anglesea Spring Thompson Powlett Darby Tidal GrowlersClimate changeSea level rise & storm surge × × × × × × ×Rising temperature × × × × × × ×Decline & altered seasonal pattern in rainfall
× × × × × × ×Modified flow regimeWater extraction - Domestic
Water extraction - Agriculture / Industry
p × ×Estuary entrance modification × × × ×Regulatory & other infrastructure (e.g. bridges)
× × × p p p
Land use and declining water qualityLand clearing & development × × × × ×Eutrophication & algal blooms × × × × pIncreased sedimentation, erosion & turbidity
× × × × p
Acid flows & blackwater events × p p p p p pPollution & contaminants × × × × pPathogens and Pests Disease p p p p p p pInvasive species p p × × p p pExtractive and recreational activitiesFishing (commercial & recreational)
p p p p p p p
Mining & extraction activities (sand & coal)
×Recreation (boating)
× = identified threat, p = potential threat
81
E3: Criterion 3 – Loss or decline of functionally important species
Criterion 3 - Loss or decline of functionally important speciesCategory Critically
EndangeredEndangered Vulnerable
For a population of a native species likely to play a major role in the community, there is a:
very severe decline severe decline substantial decline
3.1 Estimated decline over the last 10 years or three generations, whichever is longer of:
at least 80 % at least 50 % at least 20 %
to the extent that restoration of the community is not likely to be possible in:
the immediate future the near future the medium-term future
3.2: restoration of the ecological community as a whole is unlikely in
10 years, or 3 generations of any long-lived or key species, whichever is the longer, up to a maximum of 60 years.
20 years, or 5 generations of any long-lived or key species, whichever is the longer, up to a maximum of 100 years.
50 years, or 10 generations of any long-lived or key species, whichever is the longer, up to a maximum of 100 years.
Insufficient information to determine eligibility under Criterion 3
Evidence:
Functionally important species
This criterion refers to native species (or suites of species) that are functionally important in the processes that sustain the ecological community. For the purposes of this criterion assessment, the functionally most important species are 'keystone' species, including 'ecosystem engineers'. Keystone species maintain organisation and diversity, and contribute to the functionality of ecological communities (Mills et al. 1993; Stiling 1999). Ecosystem engineers are a type of keystone species that modify the physical environment and thus create, maintain and change habitats and resources (Jones et al. 1994; Wright & Jones 2006). Changes in local populations of keystone species, are likely to have significant impacts on ecosystem processes, trophic relationships, and the long-term stability and resilience of the ecological community.
Level of loss and restoration
It is acknowledged that there has been significant decline or loss within the ecological community (see Criterion 4) over the past 10 to 20 years, particularly in the instance of at least the Hopkins River estuary with the ecosystem engineer Zostera muelleri and the keystone secondary producer, the estuarine-endemic copepod Gippslandia estuarina (which is all but locally extinct and replaced by another estuarine-endemic calanoid copepod species with a differing biology, see Criterion 4).
Conclusion
At present, there are insufficient data to assess the level of loss or decline of Zostera muelleri or Gippslandia estuarina across the ecological community. Therefore, there is insufficient information to determine the eligibility of the Salt-wedge Estuaries ecological community under any category of Criterion 3.

E4: Criterion 4 – Reduction in community integrity
Criterion 4 - Reduction in community integrityCategory Critically Endangered Endangered VulnerableThe reduction in its integrity across most of its geographic distribution is:
very severe severe substantialas indicated by degradation of the community or its habitat, or disruption of important community processes, that is:
Reference should also be made to the indicative restorative timeframes outlined under Criterion 3.
Eligible under Criterion 4 for listing as Endangered
Evidence:
Criterion 4 is met if there has been a substantial reduction in an ecological community’s integrity across most of its geographic distribution, as indicated by a substantial degradation of the community or its habitat, or by a substantial disruption of important ecological or physico-chemical processes which may lead to decline in, or functional extinction of, the ecological community.
An ecological community can be threatened with ‘functional’ extinction through ongoing modifications that do not necessarily lead to total destruction of all its elements. An ecological community would be considered extinct when its composition has changed (across its national extent) so that it no longer fits its original description or Key Diagnostic Characteristics (TSSC 2017) (see Figure E1).
In the case of the Salt-wedge Estuaries ecological community, functional extinction would be considered to be the loss of the estuarine-endemic component of the biota, particularly the loss of estuarine-endemic copepod species, estuarine fish fauna and/or the permanent loss of a functional dynamic salt-wedge. To assess the risk of extinction under this criterion, the potential for recovery (restoration) of the ecological community must be considered as an indication of the severity of degradation or disruption.
Figure E1: Illustrative example of the potential change in the mixture of species resulting in the extinction of an ecological community.
83

The following indicators of reduction in ecological community integrity are pertinent due to the ongoing threats and likely impacts outlined in Appendix D, and the hydrological, biological and ecological requirements outlined in Appendix C:
1a) disruption/attrition of natural salt-wedge dynamics and functional ‘intermittent’ mouth condition
1b) declining water quality
1c) loss of connectivity
2a) loss of keystone biodiversity and related function
2b) decline/loss of critical fish spawning cues/habitat and compromised survival of fish larvae and subsequent recruitment
2c) invasion and epidemic infection by viral pathogen/s.
The first three indicators, 1a), b) and c), relate to the key driver of the typical salt-wedge hydrological cycle through declining river flow and loss of habitat. The last three indicators, 2a), b) and c), relate to declining estuarine-endemic biodiversity through declining productivity and loss of habitat.
Disruption/attrition of the natural cycle of salt-wedge dynamics
Although there may be long periods of stable salt-wedge presence, it is the dynamic nature of these estuarine systems that drives the ecology of the Salt-wedge Estuaries ecological community. The fauna and flora are adapted to a cycle of the three main phases of salt-wedge emplacement, presence and reduction/absence (Figure C1). These ‘natural’ salt-wedge dynamics create conditions (such as halocline formation) that confer ecological and physiological benefits as outlined in Table E4.
Threats that result in a decline in rainfall and river discharge will impact on salt-wedge dynamics (see Appendix D). This in turn will diminish the ecological benefits and functions, and result in detrimental impacts on the structure, function and productivity of the ecological community. Table E5 outlines the key symptoms, changes and impacts, and consequences of those changes and impacts, to the integrity of the ecological community, as a result of disruption/attrition of the normal cycle of salt-wedge dynamics.
Figure E2 provides records of natural versus artificial mouth openings for some estuaries in the ecological community. The estuaries of Lake Yambuk, Fitzroy, Glenelg, Hopkins and Merri had 4–14 artificial openings from mid-2006 to mid-2012 (Pope et al. 2015). One artificial opening of the Merri was noted as being conducted to relieve flooding of orange bellied parrot saltmarsh feeding area (Pope et al. 2015). Each of these systems also had ‘unknown cause’ openings (2–7) which were potentially illegal openings, or unrecorded natural openings. Overall there is a clear pattern of the number of artificial openings exceeding natural openings which indicates a severe disruption to the integrity of the ecological community.
84

Table E4: Ecological benefits and functions of salt-wedge dynamics.
Phase Conditions Benefits SourcePresence pronounced
salinity stratification (vertical & horizontal)
range of estuarine salinities (moderate to high) to suit physiology and/or function of biota (e.g. optimal growth and reproduction, primary and secondary production, dormant egg hatching, fish spawning and recruitment)
promotes nutrient cycling and phosphorus buffering mechanism of sediments
enhances productivity promotes higher biomass of copepods and fish enhances nursery function
Newton (1994); Schlacher & Wooldridge (1996); Barton & Sherwood (2004); Jenkins et al. (2010); Williams et al. (2013); Adams (2012).
Presence halocline formation
increased area of the concentration of protists and zooplankton, therefore increased productivity and availability of prey to fish and other larvae (e.g. shrimp, crabs)
barrier to limit mixing between layers and aids maintenance of preferred position in estuary for biota and helps to avoid export to ocean (refuge)
cue and location for fish spawning and enhanced larval survival
can flocculate particulates and help to buffer low pH (i.e. acidic flows)
sub-halocline waters have greater seasonal temperature stability (e.g. cooler in spring/summer and warmer in autumn/winter than surface waters)
Newton (1994); Jassby et al. (1995); Kimmerer (2002); Barton & Sherwood (2004); Corangamite CMA (2012); Williams et al. 2013).
Reduction/ Absence (Flushing)
high discharge flows and flushing floods
flushes out ‘aged’ stagnating or deoxygenated salt water (but deoxygenated waters generally only about 10% or less of estuary volume under ‘typical’ conditions) and dilutes pollutants
introduces high levels of particulates and nutrients (including detritus and associated micro-organisms)
inundation of riparian and adjacent wetland zones leading to exchange of nutrients and/or biota and raises groundwater levels, wetting floodplain soils
Arnott & McKinnon (1983); Sherwood (1985, 1988); Newton (1994); Barton & Sherwood (2004); Adams (2012).
Emplacement new salt-wedge forming along estuary
fresh, oxygenated seawater introduced (a likely cue for fish spawning)
triggers hatching of dormant eggs and life history stages (likely in conjunction with water temperature)
enhances use of estuary as a nursery for coastal species (e.g. fish larvae)
Sherwood (1985; 1988); Newton (1994); Newton & Mitchell (1999); Barton & Sherwood (2004).
85

Table E5: Decline in integrity from disruption to the typical cycle of salt-wedge dynamics in the Salt-wedge Estuaries ecological community.
Evidence of Change/Impact Consequence of Change/Impact Source
Reduced freshwater inflow (including change in quantity, quality and timing of freshwater input)
Millennium Drought (1997-2010)
drying trend in region of EC since 1960; declining rainfall, run-off and river discharge
reduced annual mean rainfall in region considered substantial compared to natural variability
seasonal change - less rainfall in winter/spring, i.e. estuary wet-season
modelling supports increased frequency and duration of extreme droughts
increasing trend in water extraction from population growth and urban/ agricultural development (Victoria is fastest growing State; increasing coastal pressure – 80% Victoria’s population situated on coast)
declining trend in river more frequent mouth closure reduction/loss of halocline
area
loss of three phases of salt-wedge dynamics
more frequent mouth closure decline/loss of salinity stratification risk of hypersalinity and
deoxygenation risk of marinisation (seawater
salinity only) loss of flushing floods – needed to
‘reset’ the salt-wedge hydrodynamic cycle
failure to flush aged, deoxygenated salt-wedge layer in winter/early-spring
increased residence time of water – increased pollutant concentration and eutrophication
loss of halocline habitat higher salinity combined with
higher temperature leads to physiological stress of biota (and potential mortality)
changes to geomorphology changes to hydrology and water
quality loss of estuarine-endemic fauna loss of primary and secondary
production loss of trophic structure reduced fishery resources reduced habitat diversity and
availability lack of wedge-reformation trigger
for hatching of dormant eggs of copepods, etc.
Newton & Mitchell (1999); Hall & Burns (2002); Mondon et al. (2003); Jones & Durack (2005); Barton et al. (2008); Adams (2012); Gross et al. (2015); Pope et al. (2015); Sherwood et al. (2008); ABS (2016),
More intense & frequent flash flooding (but timing unclear at present)
disruption of stable phase of salt-wedge presence
disruption of salt-wedge reformation process
potential triggering of hatching of dormant copepod eggs at wrong time
decline loss of secondary productivity (zooplankton)
mismatch of prey availability for larval fish and subsequent higher mortality
increased sediment loads and turbidity
decline in seagrass and macrophyte productivity
Walsh & Mitchell (1995); Newton (1996); Newton & Mitchell (1999); Arundel (2007); Lloyd et al. (2008); Sherwood et al. (2008); Jenkins et al. (2010); Grose et al. (2015).
Table E5 (Cont.): Decline in integrity from disruption to the typical cycle of salt-wedge dynamics in the
86

Salt-wedge Estuaries ecological community.
Key Symptom
Evidence of Change/Impact Consequence of Change/Impact References
Decline in natural, intermittent mouth condition
increased frequency and duration of mouth closure (see Figure E2)
low-flow period coincides with high evaporation rates (over 20 cm/month and exceeds rainfall) – particularly for estuaries with large ratios of surface area to depth, which is common in EC
increased back-flooding of adjacent floodplain including wetlands and low-lying developments (and concomitant social pressure to resolve)
1.
change in water level increased evaporation rate increased conditions of
hypersalinity (and potential deoxygenation in wedge)
increased water-column temperature
enhanced turbidity and eutrophication
increased retention of pollutants and pathogens
loss of connectivity to the ocean impacts on migratory fish reduced recruitment of marine
larval fish into estuary nursery areas
change to composition of adjacent shallow-water flood-zone fish assemblage
Schlachert & Wooldridge (1996); Grange et al. (2000); Pierson et al. (2002); Barton & Sherwood (2004); Becker (2007); Hirst (2004); Pope (2006); Sherwood et al. (2008); Whitfield et al. (2008); Perissinotto et al. (2010);van Niekerk et al. (2013); Pope et al. (2015).
Artificial mouth opening
increased incidence of artificial opening of estuary mouths (see Figure E2)
increased social pressure for artificial opening of estuary mouths
increased ‘illegal’ opening of estuary mouths
potential draining of surface oxygenated water (i.e. DO > 5 mg/L), leaving behind older poorly oxygenated or anoxic deeper water
highly visible mass ‘fish kills’ recorded in the Surry, Gellibrand, Aire, and Yambuk estuaries
higher tidal exchange and intrusion of marine species
potential increased width of estuary impacts from rapid salinity change thinner freshwater surface layer
subject to greater mixing loss of stratification and halocline changed inundation regime of
riparian zone potential export/loss of fish eggs
and larvae reduced habitat diversity and
availability reduced foraging habitat for fish
and birds reduced breeding habitat for fish
and birds may lead to gradual shallowing of
the estuary due to sedimentation may cause mass ’fish kill’ from
deoxygenation, blackwater or acid flows
use of explosives causes shock waves that are harmful to fauna
Ibanez et al. (1997); Kelly (2000); Barton & Sherwood (2004); Hirst (2004); Becker (2007); Arundel et al. (2008); Becker et al. (2009); McKenzie et al. (2011); Lill et al. (2012); Milbrandt et al. (2012); Whitfield et al. (2012); Ribeiro et al. (2013).
87

Table E5 (Cont.): Decline in integrity from disruption to the typical cycle of salt-wedge dynamics in the Salt-wedge Estuaries ecological community.
Key Symptom Evidence of Change/Impact Consequence of Change/Impact References
Decline in water quality & ecological function from increased water temperature
see Criterion 5 (climate change impact)
increased turbidity can lead to increased water temperature
decline/loss in thermal stratification
projected increased duration of combined temperature and salinity maxima
can alter physical, chemical and biological properties in estuaries (see Figure E5)
affects metabolic rate and oxygen consumption of estuarine organisms
influences rates of photosynthesis influences dissolved oxygen and
other dissolved gas concentrations (e.g. warmer water less able to hold oxygen)
increases sensitivity of estuarine organisms to pollution, parasites and disease
increases solubility of toxic compounds (e.g. heavy metals, ammonia)
temperatures above 35° C can alter metabolic function in aquatic organisms
impact the rate and degree of deoxygenation of salt-wedge
impact temperature of halocline and associated productivity
impact on development and mortality of meroplankton (larval plankton)
higher temperature combined with higher salinities can lead to increased mortality of estuarine copepods (upper salinity tolerance is often temperature-dependent) and impact on egg production
may impact ‘trigger’ function for hatching/’release’ of dormant eggs and other life-history stages of invertebrates
Bayly (1965); Ough & Bayly (1989); Kennedy 1978); Hall & Burns (2001 and references therein, 2002); FEI (2014); Grose et al. (2015).
Decline in water quality & ecological function from increased eutrophication
longer periods of salt-wedge stagnation leading to oxygen depletion (DO < 1-2 mg O2/L) and build-up of hydrogen sulphide (H2S)
periods of toxic conditions and oxygen depletion from microbial consumption, causing stress/mortality of biota
Kelly (2000); Maher (2001); Barton & Sherwood (2004); Barton (2006); Pope (2006);
88

Table E5 (Cont.): Decline in integrity from disruption to the typical cycle of salt-wedge dynamics in the Salt-wedge Estuaries ecological community.
Key Symptom Evidence of Change/Impact Consequence of Change/Impact References
(excess nutrients) & deoxygenation from associated algal blooms; decay of organic matter (blackwater flows); acid flows
increased levels of nutrients and organic matter
increased incidence of algal blooms
high proportion of adjacent acid sulphate soils and documented acidic flows
documented blackwater events
anoxic bottom waters can trigger release of sediment-bound nutrients and associated algal blooms
low DO leaves aquatic organisms in a weakened state and more susceptible to disease and pollutants
excessive growth of macroalgae (e.g. Cladophora), promoting hypoxia or anoxia
mass mortality of fish (i.e. ‘fish kills’)
Becker (2007); Becker et al. (2009); Jiménez Cisneros et al. (2014).
See also various Estuary Management Plans in Section 6, and Appendix D.
Decline in water quality & ecological function from increased sedimentation & turbidity
increasing catchment land use, clearing and development (urban and agricultural)
erosion of estuary banks in places
increasing sea level & storm surge (see Criterion 5)
higher turbidity higher sedimentation rates
gradual infilling of estuary increased nutrient loads and
organics – stimulating phytoplankton production which may increase turbidity
turbidity limiting light penetration, primary production and distribution of macrophytes
smothering of biota altered availability, mobility and
depth of benthic habitat trapping/flocculation of sediment at
halocline store and modify organic matter,
nutrients and pollutants
Carter & Rybicki (1990); Barton (2006); Scheltinga & Moss (2007); Adams & Riddin (2007); Snow & Taljaard (2007); Arundel et al. (2009).
See also various Estuary Management Plans in Section 6, and Appendix D.
Loss of Connectivity (between: estuary & ocean; estuary & river; estuary & adjacent riparian/ wetland areas)
increased natural and artificial mouth closure (and see Figure E2) – from reduced discharge levels
dams, weirs or upstream offtakes (e.g. Glenelg, Gellibrand, St George, Painkalac, Barham, Thompson)
presence of levees, seawalls and bank armouring
reduced fish diversity/biomass/cohorts
prevents upstream penetration of saltwater
prevention of movement/migration of fauna upstream, downstream and laterally
limits migration, spawning and recruitment for catadromous fish (e.g. eels, Australian grayling) and semi-anadromous fish(e.g. southern anchovy)
reduction in diversity of habitat limited coastal dispersal ability
between estuaries for some species/life-history stages (e.g. Paratya australiensis; euryhaline fish)
Walsh & Mitchell (1995); Newton & Mitchell (1999); Becker (2007); Arundel et al. (2009); Becker et al. (2009); Pope et al. (2015).
89

Figure E2: Numbers of artificial and natural opening of estuaries with regularly recorded data where at least one artificial openings took place. Periods of observation varied from 18 months and 6 observations to 6 years and 661 observations. Data was sourced and compiled from a variety of sources, including from Catchment Management Authorities, Estuary Watch, researchers and water height loggers (Pope et al. 2015).
In 2007, a formal Estuary Entrance Management Support System was released in Victoria which features a decision support tool that guides estuary managers when making the decision whether or not to artificially open an estuary (EEMSS 2007). However, the consequences of artificial opening trigger heights on estuarine ecology, particularly on wildlife or wetland habitat, have yet to be reviewed (Barton & Sherwood 2004).
Decline in water quality
Water quality within the ecological community has declined significantly due to a range of factors, (see Appendix D, Table E5). Water temperature influences several other parameters and can alter the physical, chemical and biological properties of estuaries (see Figure E3). Also, anthropogenic activities resulting in increased input of nutrients and organic matter to the estuaries are likely to accelerate the extent of oxygen depletion due to microbial consumption. Water quality assessments undertaken by Catchment Management Authorities (CMA) in the river basins that feed into the ecological community produced results ranging from poor to excellent, with about half of the reaches tested found to be in moderate condition. River reaches in the best condition were located away from development and cleared land (e.g. in forested areas of the Glenelg and Surry rivers) (DEPI 2013).
90
Figure E3: On left – Temperature affects a range of other physico-chemical parameters in the water column of estuaries. On right – increasing temperature leads to increased metabolic rate and oxygen consumption of estuarine biota (Source: FEI 2014).
It is particularly important that the aged, deoxygenated and toxic waters in the saline layers of these salt-wedge estuaries are periodically flushed from the system to avoid ill effects to biota. However, the limited tidal input in wave-dominated estuaries, such as those of the ecological community, makes them more prone to hypoxic events and more reliant on riverine flows and flushes to provide fresh oxygenated water. The declining trends in rainfall, river discharge and increasing demands on water abstraction are likely to have reduced the frequency of these flushing events and increased instances of deoxygenation, algal blooms and fish kills.
Decline in connectivity
There are a range of regulatory and other infrastructures utilised across the ecological community (see Appendix D). Most of these are small bridges and roads which would have negligible impact on these estuarine systems, apart from localised changes to current flow. However, several of the estuaries have reservoirs, weirs or offtakes upstream (i.e. Glenelg, Gellibrand, St George, Painkalac, Barham and Thompson). Artificial upstream barriers prevent movement of biota, particularly fish, up and downstream, and can also reduce the diversity of estuarine habitat by preventing upstream movements of saltwater (Arundel et al. 2009). Loss of connectivity leading to a decline in integrity of the ecological community is mainly a result of reduced discharge levels, potentially leading to longer and more frequent periods of mouth closure (see Table E10). Several species of fish that inhabit or use the ecological community’s estuaries (e.g. eels, Australian grayling and southern anchovy) depend on an open estuary entrance for migration, spawning and recruitment.
Decline/loss of keystone secondary producers
There are two hallmarks of keystone species: their presence is crucial in maintaining the organisation and diversity of their ecological communities, and these species are 'exceptional', relative to the rest of the community, in their importance (Mills et al. 1993). Dominant calanoid copepods are keystone species in estuaries (see C3.2). Within the Salt-wedge Estuaries Ecological Community, there are two important keystone zooplankton species that perform the role of secondary producing grazers, feeding on both the phytoplankton- and detrital-based food chains; Gippslandia estuarina (hereafter Gippslandia) and Gladioferens pectinatus (hereafter Gladioferens). Table E6 provides further information on their ecological role, features and how they have been impacted.
91
Due to its primitive nature and limited distribution (see Table E6), Newton & Mitchell (1999) suggested that it is likely that Gippslandia estuarina is mainly represented by ‘refuge populations’ in favourable habitats such as that afforded by stable periods or locations in stratified estuaries and it is possible that this copepod may be edging toward extinction.
While the opportunistic Gladioferens pectinatus appears to have assumed the main role as secondary producer copepod in the Hopkins estuary (and likely other nearby estuaries within the ecological community), it does not typically reach the density maxima (and thus productivity) that the specialist Gippslandia is capable of (Newton 1994). Newton (1996) found that the mass hatching of dormant eggs of Gippslandia, which coincided with post-flood salt-wedge reestablishment, provided abundant prey for the larvae of estuarine and marine fishes that had adaptively cued their reproductive cycle to take advantage of this food source (see Appendix C3.4).
Decline/loss of ecosystem engineers
The seagrass species, Zostera muelleri and Heterozostera tasmanica, along with the submerged aquatic herb Ruppia megacarpa (Ruppia is seagrass-like in appearance and function), are significant ecosystem engineers of the Salt-wedge Estuaries ecological community (see Table E6 and Appendix C3.5). These important ecosystem engineer species have been completely lost in at least two of the estuaries within the ecological community, with the status of seagrasses in the other estuaries currently unknown.
In 2000, Ierodiaconou & Laurenson (2002) surveyed and mapped seagrass beds along the length of the Hopkins estuary. They found seagrass growing in a 5-15 m band along the sides of the channel throughout most of the length of the estuary, with some sections with shallow mudflats supporting more extensive coverage – the largest bed being 223 m at its widest point. They estimated that the estuary had 25% coverage by area of the three species. Ruppia megacarpa dominated shallow waters from 0-0.5 m depth throughout the estuary, while Z. muelleri dominated depths from 0.5–1.9 m throughout the estuary and occurred in mixed stands with H. tasmanica in downstream sections.
Seagrass was observed to be present (but abundance unknown) in the Hopkins in 2014 (Dr Paul Carnell pers. comm. October 2016). Then in 2016, extensive sampling undertaken by Deakin University staff and students (benthic grabs, coring and scuba diving) along the length of the Hopkins estuary found no evidence of seagrass -including rhizomes, leaves or seed banks (D. Ierodiaconou pers. comm. November 2016).
Similarly, Zostera beds were present in the Curdies estuary in 2014 but no longer present in 2016 (P. Carnell pers. comm. November 2016). The reasons for the complete disappearance of these species is unclear, but has been hypothesised to be a combination of pressure from the Millennium Drought followed by drought-breaking floods in early 2011, combined with increasing pressure from catchment development leading to dieback (Dr D. Ierodiaconou & Dr P. Carnell pers. comm. October 2016).
Loss and fragmentation of seagrass beds via nutrient loading and turbidity are the main drivers of decline (Kirkman 1997; Short and Neckles, 1999; Kilminster et al. 2015). Pressures from activities such as land reclamation, coastal development and localised activities (including recreational boat mooring and bait digging) are a major cause of physical disturbance and damage to seagrass beds. Seagrass beds are generally shallow by nature and sensitive to the main drivers of climate change (Short & Neckles 1999; Bjork et al. 2008; Jones et al. 2011 in Mieszkowska et al. 2013).
92

Recovery and recolonisation from losses such as those in the Hopkins or Curdies estuaries are rare for temperate species of seagrass, and may take years to decades (Kirkman 1997; Jarvis et al. 2014; Thompson et al. 2014). For example, in Durras Lake, New South Wales, a community of Zostera decimated by hypersalinity (~50 psu) took 6 years to re-establish after salinity returned to acceptable levels (Kilminster et al. 2015). Jarvis et al. (2014 and references therein) suggest that the lack of a persistent seed bank may reduce the resilience of Zostera to multiple or repeated stress events. This may be a similar risk for seagrass beds of the ecological community, particularly in the Hopkins estuary, for which no viable seed bank was found in 2016. Attempts to replant seagrasses have also generally not been successful (Kirkman 1997; Orth et al. 2010; Jarvis et al. 2014; Macreadie et al. 2014).
Decline /loss of critical fish spawning cues/habitat and larval fish survival
Black bream, Acanthopagrus butcheri, is a keystone species and apex predator of the Salt-wedge Estuary ecological community (see Table E6). Black bream require salinity stratification, halocline presence, optimal temperature and adequate prey availability to maximise larval survival (Newton 1996; Williams et al. 2013). Freshwater flow leading to formation of a salt-wedge (i.e. salinity stratification and halocline formation) has been found to be critical for spawning and larval survival of this fish species (Newton 1996; Nicholson et al. 2008; Jenkins et al. 2010; Williams et al. 2012, 2013; and see Appendix C3.4). Salinity structure has also been linked to recruitment variability (Jenkins et al. 2010). Jenkins et al. (2010) reported a positive (although non-linear) relationship between freshwater flow, the level of stratification and recruitment of black bream, with the greatest recruitment occurring at intermediate flows. These authors also found a link between flow and year class strength (i.e. age cohorts).
Williams et al. (2013) suggests that sufficient freshwater flow needs to be delivered to an estuary to generate the stratified conditions that correspond to increased concentration of black bream eggs, larvae and their potential prey. For example, during the Millennium Drought in Victoria, reduced stratification of the Gippsland Lakes led to significant recruitment failure and decline in the black bream population (Williams et al. 2013). These findings imply that a marked reduction in flows such as through drought, abstraction of water, and future climate change, is likely to reduce the stratified area of the estuaries within the ecological community. This in turn would restrict the area suitable for black bream; and potentially for other species that utilise the estuaries of the ecological community to spawn, or as larval nursery habitats.
Climate change is predicted to impact on spawning and larval survival of black bream and other estuarine fishes in the ecological community. Forecasts have suggested a probable reduction in freshwater river flows in the region of the ecological community of between 5 and 45% by 2030 (Jones & Durak 2005). Temperatures are projected to rise considerably (see Criterion 5, Appendix E) which is expected to directly impact black bream who are dependent on restricted temperature ranges for spawning and optimal egg and larval survival. In addition, hypoxia and anoxia are becoming increasingly common in highly stratified estuaries where there is high nutrient loading through agricultural activities or prolonged mouth closure from extended low flows (Jiménez Cisneros et al. 2014).
These combined impacts (see Table E6) demonstrate that threats to the ecological community related to reduced discharge (from climate change and increased water extraction, see Appendix D) and rising temperature are impacting spawning habitat, prey availability and recruitment of fish species. This may not represent a severe change on its own but contributes to an overall severe loss of integrity within the ecological community.
93

Decline in integrity from invasion and epidemic infection by viral pathogens
Infections from the iridovirus ZoopIIV [HR]1, were first detected in 2007 in the estuarine copepod Gladioferens pectinatus from the Hopkins River estuary (Roennfeldt 2013; and see Table E6). Virus persistence and increased copepod morbidity were observed over late spring and summer in the Hopkins estuary (Roennfeldt 2013) and may be indicative of environmental stress (sensu Williams et al. 2005; and see Appendix D5.1). This is even more concerning given the identified relationship of the spread of infection and morbidity of the copepods with increased temperature, and the projected climate change derived increase in temperature in the region of the ecological community.
The widespread infection of the Hopkins estuary by this iridovirus and its discovery in other estuaries within the ecological community (see Table E6) combined with the projected temperature rise contributes to a severe reduction in the integrity of a key part of the ecological community.
Conclusion
The combined impact of multiple and cumulative threats (in particular water extraction, climate change, agricultural/urban development, and pathogens) have reduced the integrity of the ecological community through (and see Tables E5 and E6):
disruption and attrition of natural salt-wedge dynamics, including: loss or decline in the ‘typical’ annual hydrological cycle of salt-wedge flushing, emplacement and presence; loss or reduction or projected reduction in salinity stratification and the threat of marinisation; loss or reduction or projected reduction in area of functional halocline; loss of flushing floods or flash floods occurring in a normal season
decline in functional ‘intermittent’ mouth condition, including more extended periods of closure and inappropriate ‘artificial’ opening (which can result in major fish kill events)
declining water quality, including: increased or projected increase in water temperature, eutrophication, algal blooms, sedimentation, turbidity, deoxygenation and pollution
loss of connectivity between the estuary and the ocean (through increased mouth closure), and the estuary and the river and associated riparian and wetland floodplains (through decreased flows at the appropriate season)
loss of keystone biodiversity and related function in some estuaries, including: decline or loss of estuarine calanoid copepods as keystone secondary producer species, also resulting in loss of key prey for fish larvae; decline or loss key ecosystem engineers – seagrass beds, also resulting in loss of productivity, nursery habitat, nutrient recycling, detrital food-chain pathway, and habitat for many species of epiflora and epifauna
decline or loss of fish spawning cues and habitat, and compromised survival of estuarine fish larvae, and
infection of keystone copepods by ‘new’ viral pathogens.
These reductions in integrity have impaired the resilience and function of the ecological community right across its range due to ongoing natural and anthropogenic pressures, which will further exacerbate the continued and combined impacts of the various threats. In particular, the disruption to
1 [HR] (Hopkins River Zooplankton Invertebrate Iridescent virus, Family Iridoviridae – named with assistance of the International Committee on Taxonomy of Viruses).
94

salt-wedge dynamics, the loss of keystone and ecosystem engineer species, and widespread pathogen infection are cause for concern regarding the re-establishment of ecological processes, species composition and community structure within the range of natural variability for the ecological community.
Although many of the estuaries in the Salt-wedge Estuaries ecological community have management plans in place, and there is now a more formalised decision support scheme regarding estuary entrance management (EEMSS 2007), the high population growth in the region of much of the ecological community, combined with other ongoing and increasing multiple threats, and the losses and declines already observed, means that the integrity of the ecological community is unlikely to be restored in the near-future.
The Committee considers that the change in integrity experienced by the Salt-wedge Estuaries ecological community is severe and restoration across the extent of the ecological community is unlikely in the near future. Therefore, the ecological community is eligible for listing as Endangered under this criterion.
95

Table E6: Decline in integrity from decline/loss of keystone biodiversity and related function in the Salt-wedge Estuaries ecological community.
Key Symptom Ecological role/Ecotype Features Impact References
Decline/loss of Keystone species – estuarine-endemic calanoid copepods
Gippslandia estuarina: estuarine-endemic calanoid copepod
main secondary producer niche specialist species direct indicator of phase of
salt-wedge dynamics (statistically significant correlation)
primitive, monotypic species limited geographic
distribution and record of occurrence
dominant zooplankton and copepod species in 18 month study of Hopkins estuary under reference conditions in mid 1980s
absent during floods; rapid population increase during salt-wedge emplacement; maxima during salt-wedge presence (autumn)
extremely high density with mean-maxima of 300,000/m3
initial population increase from hatching of dormant eggs – also an important and ‘cued’ food source for fish larvae
produces quiescent dormant eggs (only limited viability and dispersal ability)
no vertical migratory behaviour (less able to affect position in an estuary apart from using barrier of halocline and berm)
study of Hopkins in 2007 to 2013 found Gippslandia to be virtually locally extinct and replaced by Gladioferens as the dominant species
unknown if viral pathogen contributed to demise of Gippslandia in the Hopkins, but the few individuals observed (<30 in four years) were all infected with iridovirus (Roennfeldt 2013).
Bayly & Arnott (1969); Newton (1994); Newton (1996); Newton & Mitchell (1999); Roennfeldt (2013)
Gladioferens pectinatus:
estuarine-endemic calanoid copepod
secondary producer opportunistic species post-flood pioneer species broad geographic
distribution, with congener in WA
second dominant zooplankton and copepod species in 18 month study of Hopkins estuary under reference conditions in mid 1980s
present in low numbers in water-column during and directly after a flood
can both hypo- and hyper-osmoregulate and survives freshwater for extended periods (2-1 months)
spines on back enable attachment to vegetation as refuge from flood and flows
population lives partly in water-column and partly among littoral vegetation
since the late-2000s and possibly before, replaced Gippslandia as the dominant species
since the late-2000s, and possibly before, also suffering infection, reproductive failure and morbidity from viral pathogen (iridovirus)
Brand & Bayly (1971); Kennedy (1978); Hodgson (1979); Sherwood et al. (1987); Sheehy & Greenwood (1989); Newton (1994); Newton & Mitchell (1999); Roennfeldt (2013)

Table E6 (Cont.): Decline in integrity from decline/loss of keystone biodiversity and related function in the Salt-wedge Estuaries ecological community.
Key Symptom Ecological role/Ecotype Features Impact References
2. population peaks occur pre-flood (early winter) and post-flood (spring), i.e. periods when Gippslandia is in decline or establishing
density mean-maxima of 87,000/m3 (an order of magnitude less than Gippslandia)
similar succession patterns found across the range of Gladioferens
no dormant eggs has vertical migratory behaviour so can
affect its position in estuary
3.
Decline/loss of Ecosystem Engineer species - seagrass
Seagrass species –
Zostera muelleri
Heterozostera tasmanica
Ruppia megacarpa (a seagrass-like submerged aquatic herb)
ecosystem engineers significant contribution to
primary production via seagrass itself and associated epiphytes
significant contribution to detrital food-chain
habitat for meiofauna (most are detritivores)
significant contribution to nutrient recycling
provides habitat and protective shelter/refuge from predators and currents
provides ‘nursery’ function for larval fish
a dominant habitat for the estuarine shrimp Paratya australiensis, harpacticoid copepods (35 species), and larval fish within the EC
In 1995, extensive seagrass beds were recorded in the Surry, Fitzroy, Hopkins, Painkalac and Anglesea
In 2000, seagrass/Ruppia of Hopkins mapped and found to be 25% coverage by area
In 2014-2016, the Surry, Fitzroy, Sherbrook and Aire were reported to have healthy seagrass beds
In 2016, 100% loss of seagrass and Ruppia reported for Hopkins, including rhizomes, leaves and seed banks)
In Curdies, Zostera beds present in 2014 but not 2016
local extinctions of seagrass and Ruppia in Hopkins (from 25% coverage in 2000) and Curdies
removal can disrupt ecosystem processes and long-term stability and resilience of EC
loss of refuge and nursery function
impact on recruitment of estuarine and coastal marine fishes (and/or missing year classes) and macroinvertebrate fauna (e.g. the shrimp Paratya)
Newton (1994); Walsh & Mitchell (1995); Ierodiaconou & Laurenson (2002); right & Jones (2006); Waycott et al. (2009); (Dr P Carnell & Dr S Trevathan-Tackett pers. comm. November 2016).
97

Table E6 (Cont.): Decline in integrity from decline/loss of keystone biodiversity and related function in the Salt-wedge Estuaries ecological community.
Key Symptom Ecological role/Ecotype Features Impact References
Decline/loss of critical fish spawning cues, habitat and larval survival – black bream
Black bream – Acanthopagrus butcheri (also applies to other fish species, e.g. estuary perch & marine southern anchovy)
black bream is apex predator of ecological community
completes entire life-cycle in stratified estuary
recreationally important species relatively long-lived (29y) spawning mainly occurs in salinities
> 10 ppt and triggered by temperature above 15 °C
in Hopkins most black bream eggs found at 14.9 – 17.5 °C and larvae at 12.6 – 17.5 °C
spawning cued with salt-wedge emplacement phase and mass hatching of dormant copepod eggs, which provides abundant prey for newly hatched larvae
salinity structure linked to recruitment variability
identified link between flow and year class strength
high levels of dissolved oxygen (DO) associated with typical spawning season
eggs fail to hatch or larvae die in DO of 40% saturation or less.
Newton (1994, 1996); Morison et al. (1998); Nicholson et al. (2008); Jenkins et al. (2010); Williams et al. (2013)
Decline/loss of biodiversity from viral pathogen epidemic of estuarine copepods
Pathogen - iridovirus ZoopIIV [HR]
viral pathogen infection found in at least
three estuarine-endemic calanoid copepods – Gladioferens pectinatus, Gippslandia estuarina and Sulcanus conflictus.
first detected in 2007 in Hopkins (and first record of virus in zooplankton)
temperature a major driver of viral infection development (especially above 23 °C)
primary location of discovery the Hopkins, but also observed in other estuaries within the EC including the Glenelg and Painkalac
virus targets reproductive system leading to reproductive failure and/or morbidity of dominant estuarine-endemic copepods
infection of male and female Gladioferens pectinatus leading to limited recruitment
behavioural effects – limited escape response on disturbance, reduced swimming efficiency
Williams et al. (2005); Roennfeldt (2013)
98

E5: Criterion 5 - Rate of continuing detrimental change: Impacts of Climate Change – Sea Level Rise and Increasing Temperature
Criterion 5 - Rate of continuing detrimental change
Category Critically Endangered Endangered Vulnerable
Its rate of continuing detrimental change is:
very severe severe substantial
as indicated by a) degradation of the community or its habitat, or disruption of important community processes, that is: or b) intensification, across most of its geographic distribution, in degradation, or disruption of important community processes, that is:5.1 An observed, estimated, inferred or suspected detrimental change over the immediate# past or projected for the immediate future of at least:
80% 50% 30%
# The immediate timeframe refers to10 years, or 3 generations of any long-lived or key species believed to play a major role in sustaining the community, whichever is the longer, up to a maximum of 60 years.
Eligible under Criterion 5 for listing as Vulnerable
Evidence:
The Intergovernmental Panel on Climate Change’s Fifth Assessment Report [AR5] (IPCC 2013) demonstrates that greenhouse gases, such as carbon dioxide and methane, have contributed significantly to a warming climate globally, in addition to other associated physical and chemical changes in the atmosphere, ocean and land surface – commonly referred to collectively as ‘Climate Change’. There are several major consequences of climate change that threaten the Salt-wedge Estuaries ecological community, namely:
rising sea level
increasing temperature, and
declining and changed seasonality of rainfall.
These consequences all threaten to adversely affect the typical annual hydrological cycle of the salt-wedge, mouth condition of the estuaries, community integrity and ecological function.
1) Increasing rate of Sea Level Rise
Sea levels are rising due to thermal expansion of the oceans (from rising temperature) and the loss of ice from glaciers and ice sheets (Church et al. 2013a). They are expected to continue rising for centuries, even if greenhouse gas emissions are curbed and their atmospheric concentrations stabilised (Hunter 2012; Church & White 2011; see Table E7). Church et al. (2013b) report as part of IPCC AR5 that for RCP8.5 (i.e. the business as usual, high emissions scenario)2 the rise by 2100 is 0.52 to 0.98 m, with the caveat that if there were collapse of marine-based sectors of the Antarctic ice sheet, this figure could rise by several tenths of a metre.
2 Representative Concentration Pathway (RCPs) are used by the Intergovernmental Panel on Climate Change (IPCC) as the full range of emissions scenarios used for the global climate model (GCM) simulations. For example, RCP4.5 represents a pathway consistent with low-level emissions, which stabilise the CO2 concentration to about 540 ppm by the end of the 21st Century. RCP8.5 represents a high-emission scenario, for which the CO2 concentration reaches about 940 ppm by the end of the 21st century (Grose et al. 2015).

Figure E4: Global average absolute sea level change from 1880 to 2015 (Note data sources as indicated above).
The estimated linear trend for the rate of sea level rise from 1900 to 2010 is 1.7 mm/y, with that estimated since 1961 being 1.9 mm/y (Church & White 2011). These trends are supported by more recent research and modelling, which indicates significant changes in the rate of sea level rise during the 20th century with the largest rates since 1993 (CSIRO & BoM 2015; Masters et al. 2012). The latest IPCC report, AR5, states that a rate of 2.0 mm/y between 1971 and 2010 and 3.2 mm/y between 1993 and 2010, is very likely (Church et al. 2013b). Importantly, Church et al. (2013a) suggest that the increased rate of rise since 1990 is not part of a natural cycle but a direct response to increased radiative forcing (both anthropogenic and natural), which will continue to grow with ongoing greenhouse gas emissions.
After accounting for and removing the effects of vertical land movements, natural climate variability, and changes in atmospheric pressure, sea levels have risen around the Australian coastline at an average rate of 2.1 mm/y over 1966-2009 and 3.1 mm/y over 1993-2009 (Grose et al. 2015). These observed rates of rise for Australia are consistent with global average values (White et al. 2014). Continued increase in sea level for the region of the ecological community (i.e. western and central Victoria) is projected with very high confidence (Grose et al. 2015).
Projected sea level rise for the two extremes of the range of occurrence of the Salt-wedge Estuaries ecological community, the border between South Australia and Victoria to the west and South Point of Wilsons Promontory to the east, and the central region at Cape Otway, are given in Table E7. Given that SLR is tracking at the higher RCP rates (IPPC 2013a) it is likely that within the next decade or so, significant sea level rises of up to 180 mm can be expected, and within 30 years rises of up to 340 mm.
100

Table E7: Projected Sea Level Rise (mm) for the region of the ecological community (i.e. western Victoria) under the RCP4.5 (i.e. intermediate emissions) and RCP8.5 (i.e. business as usual (high) emissions) scenarios (McInnes et al. 2015). (RCP = representative concentration pathways or emissions scenarios used in climate model simulations). [Sea Level Allowance (mm), using the method of Hunter (2012), is the minimum distance required to raise an asset to maintain current frequency of breaches under projected sea level rise, and is given for the SA/VIC border].
Year 2030 2050 2070 2100
Percentile 5th 50th 95th 5th 50th 95th 5th 50th 95th 5th 50th 95th
SA/VIC border
RCP4.5 80
80
120
130
170
180
140
160
220
250
300
340
220
200
340
410
460
560
330
470
530
730
740
1010RCP8.5
Cape Otway RCP4.5 70
70
120
120
160
170
130
150
210
240
290
330
200
260
320
400
450
540
310
450
510
710
710
990RCP8.5
Wilsons Promontory
RCP4.5 70
80
120
120
160
170
130
150
210
240
290
330
200
260
320
400
410
540
300
450
500
700
700
970RCP8.5
Sea Level Allowance (SA/VIC border)
RCP4.5 130
140
240
270
380
470
650
930RCP8.5
Sea level rise threatens to impact on the ‘natural’ intermittent nature of the estuary mouths within the ecological community. On Victoria’s southern, micro-tidal coast, even small changes in sea level or wave height can cause significant changes in the location of sand deposition zones (Sherwood et al. 2008). Sand deposition is instrumental in determining the state of estuary mouths. The location of the estuary mouths directly on the coast means that sea level rise and associated storm surge events resulting from climate change will have maximum impact. There is little scope for avoidance of this impact as it is not possible to translocate or retreat landward, as might be possible for more terrestrially-based ecological communities (e.g. Oliver et al. 2012; Saintilan & Rogers 2013).
Rising sea levels are likely to lead to more frequent and eventually permanent breaching of estuary entrances, which would increasingly lead to ‘marinisation’ of the estuarine systems with a loss of salinity stratification and functional, dynamic salt-wedge cycle. They would also cause water levels to rise within the estuary (Sherwood 1988), and could potentially lead to changed morphology and flooding of adjacent wetlands.
101
Tidal connection, seawater inundation and its periodicity is a ‘key ecosystem driver’ and along with river input is a major factor in determining the salinity regime and stratification of salt-wedge estuaries. True estuarine organisms are of necessity euryhaline, that is, they are adapted for optimal salinity ranges that are lower than the salinity of seawater. For example, in these Victorian estuaries, salinities may drop below 1 ppt for weeks at a time and rise to 30 ppt or more during low flow periods (Sherwood 1988). The ecological community is particularly vulnerable to the permanent marinisation (i.e. converting to well mixed marine waters) of the water-column and loss of salinity stratification. A greater marine influence in estuaries will reduce the present variability experienced in estuarine salinity regimes within the ecological community, with salinities remaining near 30–35 ppt for longer periods.
2) Increasing rate of rising temperature
CSIRO & BoM (2015) have developed climate projections for Australia’s NRM regions. Surface air temperatures in the Southern Slopes Cluster (which includes western and central coastal Victoria) have been increasing since national records began in 1910, and particularly since 1960 (see Figure E5), with mean temperature rising by 0.8 – 1.0° C (Grose et al. 2015). The rate of warming strongly follows the increase in global greenhouse concentrations (Grose et al. 2015). Australia will continue to warm substantially during the 21st Century, and warming will be large compared to natural variability in the immediate to near future (2030) and very large later in the century (2090) (CSIRO & BoM 2015). By 2030 Australian annual average temperature is projected to increase by 0.6 – 1.3° C above the climate of 1986–2005.
Figure E5: Observed annual mean temperature anomalies (°C) for 1910 – 2013 compared to the baseline 1986 – 2005 for the Southern Slopes Cluster Victoria West. (Source: Grose et al. 2015, and global data from Brohan et al. (2006).
Specifically for the extent of occurrence of the ecological community, between 1910 and 2013 daily maximum temperatures increased by 1.0 – 1.1° C, with daily minimum temperatures
102
increasing by 0.6 – 0.7° C (Grose et al. 2015). For 2030 (i.e. the immediate to near future) the annual warming across the Southern Slopes Cluster is projected to be 0.4 – 1.1° C
Changes to temperature extremes often lead to greater impacts than changes to the mean climate (Grose et al. 2015). Heat related extremes are projected to increase at a similar rate as projected mean temperature with a substantial increase in the number of warm spell days. For example, the number of days over 35° C are projected to increase in western Victoria from 11 currently, to 13 (12 – 15) by 2030 (RCP4.5) and to 16 (15 – 20) by 2090 (RCP4.5) or 24 (19 – 32) (RCP8.5) (Grose et al. 2015).
Water temperature in estuaries is strongly influenced by air temperature (Sherwood et al. 1987). For example in the Hopkins River estuary, winter minima of about 7° C and summer maxima of 25 – 30° C closely mimic average air temperatures (Newton 1994). Thus a rise in air temperature would be mirrored in changes to near-surface water temperature.
Increased water and air temperatures will result in increased evaporation, particularly in shallow water bodies with relatively large surface areas, such as the estuaries of the ecological community. This may cause hypersalinity within the estuaries (Sherwood 1988). Monthly evaporation in the region of the ecological community is currently around 20 cm during summer and autumn (Sherwood et al. 1987).
Water temperature is highly influential in the function and integrity of the ecological community. The likely impacts of an increasing rate of increasing water temperatures from climate change are highlighted in Tables D2 and E5. Importantly, these changes are closely linked to changes in water chemistry, such as the solubility of oxygen, which decreases with increasing temperature. Declining oxygen levels in the water column would cause stress to fish and other organisms, as well as causing secondary changes to water chemistry such as the release of nutrients and toxicants (like hydrogen sulphide and ammonia) from the bottom sediments into the water column (EPA Vic 2011). If stratification breaks down and these nutrient-rich bottom waters mix with surface water, this can lead to an increase in algal blooms (including harmful blue-green algae).
Many estuarine organisms are sensitive to temperatures outside of their normal range. Thus increased temperature would affect physiological and behavioural functioning (e.g. growth, reproduction, migration) and could lead to mortality. Increased water temperatures would also impact on an organism’s ability to deal with higher salinities, leading to physiological stress and potential mortality. It is expected that that while some species might favour the increased temperature (such as invasive pests), typical estuarine species adapted to specific ranges of temperature and salinity combinations would be unlikely to survive, resulting in significant changes to the composition of the ecological community. Plants and animals in the estuarine systems would face changes in food supply, competition, predation and disease. In particular, biota already stressed by poor water quality would be less able to cope with these additional pressures (EPA Victoria 2011).
Conclusion
The recent increase in the rate of sea level rise, from 1.7 mm/y to between 2.1 mm/y over 1966 – 2009 and 3.1 mm/y over 1993 – 2009 represents an increase of 24 % and 82 % (i.e. of between (2.1 – 1.7)/1.7x100% and (3.1 – 1.7)/1.7x100% respectively) over the recent past. The IPCC (AR5) further report that climate change-related sea level rise is projected to accelerate in
103
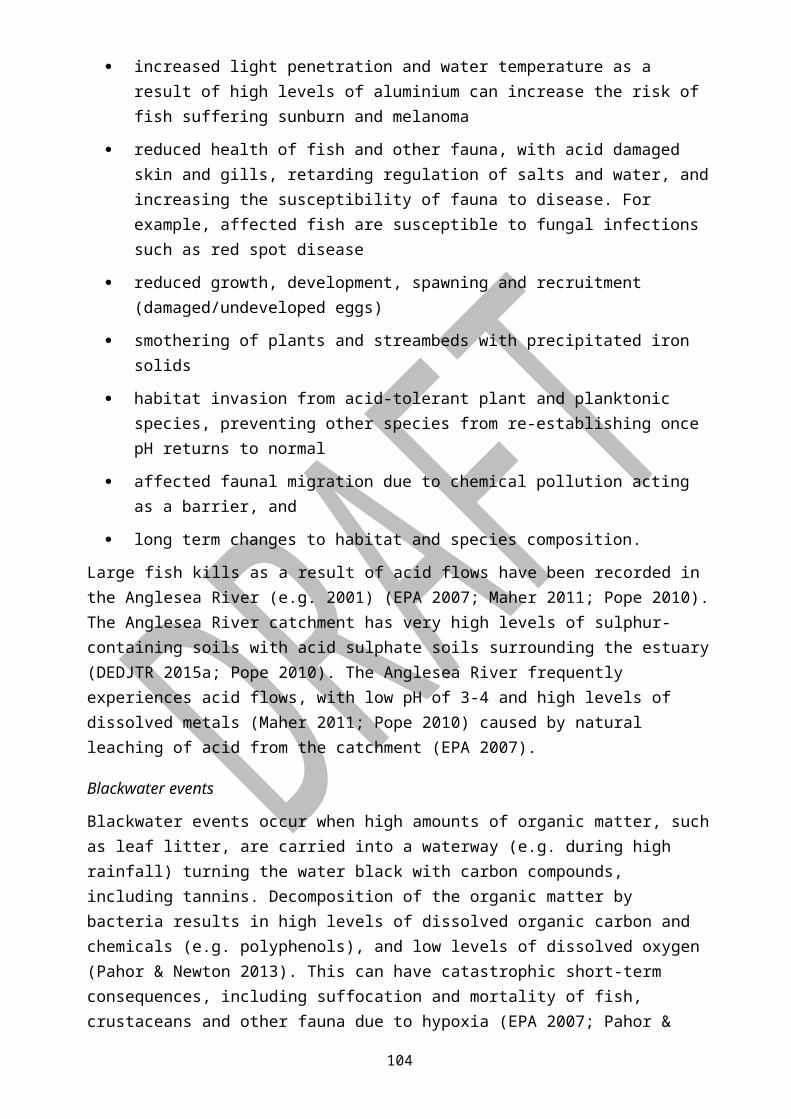
the 21st century (Church et al. 2013b) with similar rates projected for the region of the ecological community (i.e. Southern Slopes Cluster NRM region) (Grose et al. 2015).
This detrimental change represents a serious intensification, across the ecological community's geographic distribution, of sea level rise. The rate of continuing detrimental change in the ecological community is substantial as indicated by a serious intensification in the disruption of a key driver of important community processes, i.e. salt-wedge dynamics, salinity stratification, salinity regime and mouth condition.
Similarly, the rate of temperature rise, both atmospheric (which affects estuarine surface waters) and sea surface temperature (which affects seawater entering the estuaries of the ecological community), has intensified and is projected to continue rising at an increasing rate as outlined above. In particular there has been a serious intensification since the 1960s. Temperature is a key driver of physiological and behavioural functioning of estuarine biota, and may lead to disruption of key ecological processes, such as primary and secondary productivity and nutrient cycling, in addition to reproduction and recruitment.
In light of the substantial rate of continuing detrimental change of rising sea level and rising temperature across the entire distribution, and their projected continuing change causing serious disruption of important community processes, the ecological community may be eligible for listing as Vulnerable under this criterion.
E6: Criterion 6 – Quantitative analysis showing probability of extinction
Criterion 6 - Quantitative analysis showing probability of extinctionCategory Critically Endangered Endangered VulnerableA quantitative analysis shows that its probability of extinction, or extreme degradation over all of its geographic distribution, is:
at least 50% in the immediate future.
at least 20% in the near future.
at least 10% in the medium-term future.
Not eligible for listing under Criterion 6
There are no quantitative data available to assess this ecological community under this criterion. Therefore, there is insufficient information to determine the eligibility of the Salt-wedge Estuaries ecological community under this criterion.
104

7. BIBLIOGRAPHY
Australian Bureau of Statistics (ABS) (2016) 3218.0 - Regional Population Growth, Australia, 2014-15. Victoria State Summary. Accessed: January 2017. Available on the internet at: http://www.abs.gov.au/ausstats/[email protected]/Latestproducts/3218.0Main%20Features252014-15?opendocument&tabname=Summary&prodno=3218.0&issue=2014-15&num=&view=
Adam P, Burchmore J, Christal J, Crieghton C, Downey J, Geary M, Hughes P, Leadbitter D, Llewelly L & Patten J (1992) Estuary management manual. New South Wales Government.
Adams J (2012) Determination and implementation of environmental water requirements for estuaries. RAMSAR Technical Report No. 9/CBD Technical Series No. 69. Ramsar Convention Secretariat, Gland, Switzerland & Secretariat of the Convention on Biological Diversity, Montreal, Canada.
Adams JB (2013) A review of methods and frameworks used to determine the environmental water requirements of estuaries. Hydrological Sciences Journal 59(3), 1–15.
Adams J & Riddin T (2007) Macrophytes. In: Whitfield A & Bate GC (Eds) A Review of Information on Temporarily Open/Closed Estuaries in the Warm and Cool Temperate Biogeographic Regions of South Africa, with Particular Emphasis on the Influence of River Flow on These Systems. Water Research Commission, Report No. 1581/1/07.
Arnott GH & McKinnon D (1983) The zooplankton communities of the Gipplsand Lakes from November 1978 to March 1980. Internal Report No. 51. Ministry for Conservation Fisheries and Wildlife, Victoria.
Arthington A, & McKenzie F (1997) Review of impacts of displaced/introduced fauna associated with inland waters, Australia: State of the Environment Technical Paper Series (Inland Waters), Department of Environment, Canberra.
Arundel HP (2003) Invertebrate Larval Dynamics in Seasonally Closed Estuaries. PhD Thesis, School of Ecology and Environment, Deakin University, Warrnambool.
Arundel H, Barton J, Becker A & Quinn G (2008) Reporting on the environmental condition of Victorian estuaries – a discussion paper, Deakin University. Prepared for the National Land & Water Resources Audit, Canberra.
Arundel HP, Pope AJ & Quinn GP (2009) Victorian Index of Estuary Condition: Recommended themes and measures. Deakin University. Prepared for the Department of Sustainability & Environment, Warrnambool, Victoria.
Australian Institute of Aboriginal and Torres Strait Islander Studies (AIATSIS) (2017) AIATSIS map of Indigenous Australia. Accessed: February 2017. Available on the internet at: http://aiatsis.gov.au/explore/articles/aiatsis-map-indigenous-australia
Barnes RSK & Hughes RN (1982) An Introduction to Marine Ecology. Oxford, Blackwell.
Baron JS, Poff NL, Angermeier PL, Dahm CN, Gleick PH, Hairston NG Jr, Jackson RB, Johnston CA, Richter BD & Steinman AD (2003) Sustaining healthy freshwater ecosystems. Ecological Society of America. Issues in Ecology 10, winter 2003.
Barton JL (2003) Estuarine health monitoring and assessment review. State Water Quality Monitoring and Assessment Committee. Victorian Catchment Management Council, Melbourne.
105
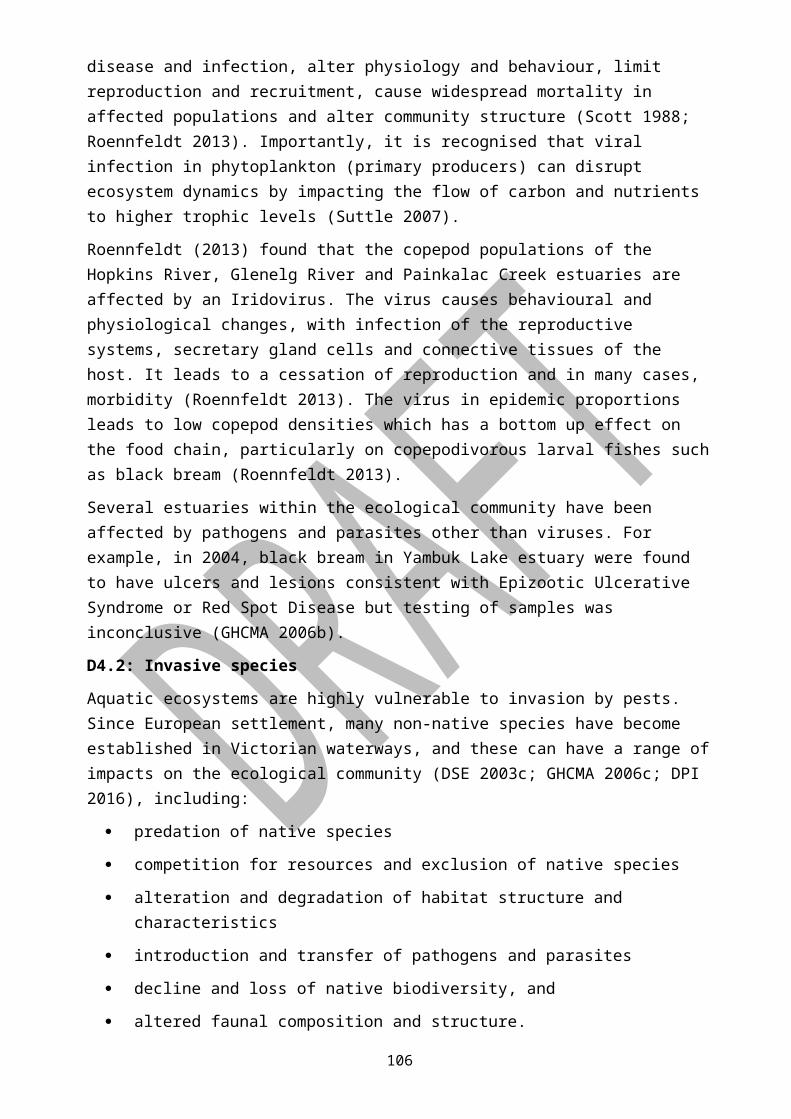
Barton JL (2006) Indicators of estuarine health in south-east Australian estuaries. PhD thesis, School of Biological Sciences, Flinders University, Adelaide.
Barton JL & Sherwood J (2004) Estuary opening management in Western Victoria: An information analysis. Parks Victoria Technical Series No. 15. Parks Victoria, Melbourne.
Barton JL, Pope AJ, Quinn GP & Sherwood JE (2008) Identifying threats to the ecological condition of Victorian estuaries. Department of Sustainability and Environment Technical Report.
Barwon Water (2010). Your Water Supply. Accessed: January 2017. Available on the internet at: https://www.barwonwater.vic.gov.au/learning/water-supply/aireys-inlet
Bayley PB & Li HW (1992) Riverine fishes. In: Calow, P. & Petts, G.E. (eds.) (1992). The Rivers Handbook Volume 1. Blackwell Scientific Publications, pp: 251 – 281.
Bayly IAE (1965) Ecological studies on the planktonic copepod of the Brisbane River estuary with special reference to Gladioferens pectinatus (Brady) (Calanoida). Aust. J. Mar. Freshw. Res. 16, 315–350.
Bayly IEA (1971) Comments on medusa from inland waters and estuaries with reference to a recent find in Australia. Aust. Soc. Limnology. Bulletin No. 4, 4-6.
Bayly IEA & Arnott GH (1969) A new centropagid genus (Copepod: Calanoida) from Australian estuarine waters. Aust. J. Mar. Freshw. Res. 20(2), 189-198.
Becker A (2007) Fish use of flooded margins of an intermittently open estuary. PhD Thesis. School of Life and Environmental Sciences, Deakin University, Warrnambool, Victoria.
Becker A, Laurenson LJB & Bishop K (2009) Artificial mouth opening fosters anoxic conditions that kill small estuarine fish. Estuarine Coastal and Shelf Science 82(4), 566-572.
Bjork M, Short F, Mcleod E & Beer S (2008) Managing seagrasses for resilience to climate change. IUCN. Gland, Switzerland.
Blaber SJM, Cyrus DP, Albaret JJ, Chong Ving Ching, Day JW, Elliott M, Fonseca MS, Hoss DE, Orensanz J, Potter IC & Silvert W (2000) Effects of fishing on the structure and functioning of estuarine and nearshore ecosystems. ICES Journal of Marine Science 57, 590-602.
Boyd L (2001) Wetland Buffer Zones and Beyond: Wildlife use of wetland buffer zones and their protection under the Massachusetts Wetland Protection Act. Wetland Conservation Professional Program, Department of Natural Resources Conservation, University of Massachusetts.
Brand GW & Bayly IAE (1971) A comparative study of osmotic regulation in four specie of calanoid copepod. Comp. Biochem. Physiol. 38B: 361–371.
Brock J (1994) Aquatic vegetation of inland wetlands In: Australian Vegetation. (Ed. R.H. Groves) pp. 437–466. Cambridge Univ. Press, Cambridge.
Brohan P, Kennedy JJ, Harris I, Tett SF & Jones PD (2006) Uncertainty estimates in regional and global observed temperature changes: A new data set from 1850. Journal of Geophysical Research: Atmospheres (1984-2012), 111, D12: 1–21.
Builth H (2004) Mt Eccles lava flow and the Gunditijmara connection: a landform for all seasons. Proceedings of the Royal Society of Victoria 116(1), 165-184.
106

Bureau of Meteorology (2016) Annual climate statementent 2015. Available on the internet at: http://www.bom.gov.au/climate/current/annual/aus/2015/
Carter V & Rybicki N (1990) Light Attenuation and Submersed Macrophyte Distribution in the Tidal Potomac River and Estuary. Estuaries 13, 441–452.
Chiswell SM, Wilkin J, Booth JD & Stanton B (2003) Trans-Tasman sea-larval transport: is Australia a source for New Zealand rock lobsters? Marine Ecology Progress Series 247, 173–182.
Church JA, Monselesan D, Jonathan M, Gregory JM & Marzeionb B (2013a) Evaluating the ability of process based models to project sea-level change. Environmental Research Letters 8 (2013) 014051.
Church JA, Clark PU, Cazenave A, Gregory JM, Jevrejeva S, Levermann A, Merrifield MA, Milne GA, Nerem RS, Nunn PD, Payne AJ, Pfeffer WT, Stammer D & Unnikrishnan AS (2013b) Sea Level Change. In: Climate Change 2013: The Physical Science Basis. Contribution of Working Group I to the Fifth Assessment Report of the Intergovernmental Panel on Climate Change [Stocker, T.F., D. Qin, G.-K. Plattner, M. Tignor, S.K. Allen, J. Boschung, A. Nauels, Y. Xia, V. Bex and P.M. Midgley (eds.)]. Cambridge University Press, Cambridge, United Kingdom and New York, NY, USA.
Church JA & White NJ (2011) Sea-level rise from the late 19th to the early 21st century. Surveys in Geophysics 3, 485–602.
Cloern JE, Alpine AE, Cole BE, Wong RLJ, Arthur JF & Ball MD (1983) River discharge controls phytoplankton dynamics in the northern San Francisco Bay estuary. Estuarine Coastal Shelf Science. 16, 415–429.
Commonwealth Scientific and Industrial Research Organisation (CSIRO) (2015) Climate Change in Australia. Projections for Australia’s NRM Regions. Southern Slopes (Victoria West). Accessed: November 2016. Available on the internet at: http://www.climatechangeinaustralia.gov.au/en/climate-projections/future-climate/regional-climate-change-explorer/sub-clusters/?current=SSVWC&popup=true&tooltip=true
Corangamite Catchment Management Authority (CCMA) (2005) Corangamite Native Vegetation Plan 2003-2008.
Corangamite Catchment Management Authority (CCMA) (2006) Corangamite Wetland Strategy 2006 – 2011.
Corangamite Catchment Management Authority (CCMA) (2009) Corangamite Marine and Biodiversity Coastal Strategy.
Corangamite Catchment Management Authority (CCMA) (2008) Corangamite Catchment Management Authority Training Manual 2008-2012.
Corangamite Catchment Management Authority (CCMA) (2012) Anglesea River Estuary Management Plan 2012–2020.
Corangamite Catchment Management Authority (CCMA) (2013) Data Analyis and Interpretation Gellibrand River Estuary 2007-2012.
Corangamite Catchment Management Authority (CCMA) (2014) Corangamite Waterway Strategy Community Consultation Draft.
107

Corangamite Catchment Management Authority (CCMA) (2015) Aire River Estuary Management Plan 2015–2023.
Corangamite Catchment Management Authority (CCMA) (2017) Artificial estuary openings. Accessed: January 2017. Available on the internet at: http://www.ccma.vic.gov.au/What-we-do/Water/Estuary-Management/Artificial-estuary-openings.aspx
Costanza R, dArge R, de Groot R, Farber S, Grasso M, Hannon B, Limburg K, Naeem S, Oneill RV, Paruelo J, Raskin RG, Sutton P & van den Belt (1997) The value of the world’s ecosystem services and natural capital. Nature 387, 256–260.
CSIRO & Bureau of Meteorology (BoM) (2015) Climate Change in Australia Information for Australia’s Natural Resource Management Regions: Technical Report, CSIRO and Bureau of Meteorology, Australia.
Daase M, Oystein V & Stig F (2013) Non-consumptive mortality in copepods: occurrence of Calanus spp. carcasses in the Arctic Ocean during winter. Journal of Plankton Research 0 (0), 1–16.
Davies JL (1974) Geomorphology and Quaternary environments. In: Biogeography and Ecology in Tasmania. Ed. Williams Dr W Junk, The Hague, The Netherlands. pp. 17-27.
De Groot R, Brander L, van der Ploeg S, Costanza R, Bernard F, Braat L, Christie M, Crossman N, Ghermandi A, Hein L, Hussain S, Kumar P, McVittie A, Portela R, Rodriguez LC, Brink P & van Beukering P (2012) Global estimates of the value of ecosystems and their services in monetary units. Ecosystem Services 1, 50–61.
Deeley DM & Paling EI (1999) Assessing the ecological health of Australia’s estuaries. Occasional paper series (Land and Water Resources Research and Development Corporation (Australia)); 99/17. Report (National River Health Program (Australia)). No. 10.
Demers MA, Davis AR & Knott NA (2013) A comparison of the impact of 'seagrass-friendly' boat mooring systems on Posidonia australis. Marine Environmental Research, 83, 54-62.
Department of Economic Development, Jobs, Transport, and Resources (DEDJTR) (2015a) Coastal Acid Sulfate Soils. Victorian Resources Online. Accessed: 24 January 2017. Available on the internet at: http://vro.agriculture.vic.gov.au/dpi/vro/vrosite.nsf/pages/soil_acid_sulfate_soils
Department of Economic Development, Jobs, Transport, and Resources (DEDJTR) (2015b) Glenelg – Angling Waters. Accessed: 18 January 2017. Available on the internet at: http://agriculture.vic.gov.au/fisheries/recreational-fishing/fishing-locations/inland-angling-guide/glenelg/glenelg-angling-waters
Department of Economic Development, Jobs, Transport, and Resources (DEDJTR) (2015c) Hopkins – Angling Waters. Accessed: 18 January 2017. Available on the internet at: http://agriculture.vic.gov.au/fisheries/recreational-fishing/fishing-locations/inland-angling-guide/hopkins/hopkins-angling-waters
Department of Economic Development, Jobs, Transport, and Resources (DEDJTR (2015d) Invasiveness assessment – Weeping Willow (Salix x sepulcralis) in Victoria (Nox). Accessed: 7 February 2017. Available on the internet at: http://vro.agriculture.vic.gov.au/dpi/vro/vrosite.nsf/pages/invasive_weeping_willow1
108
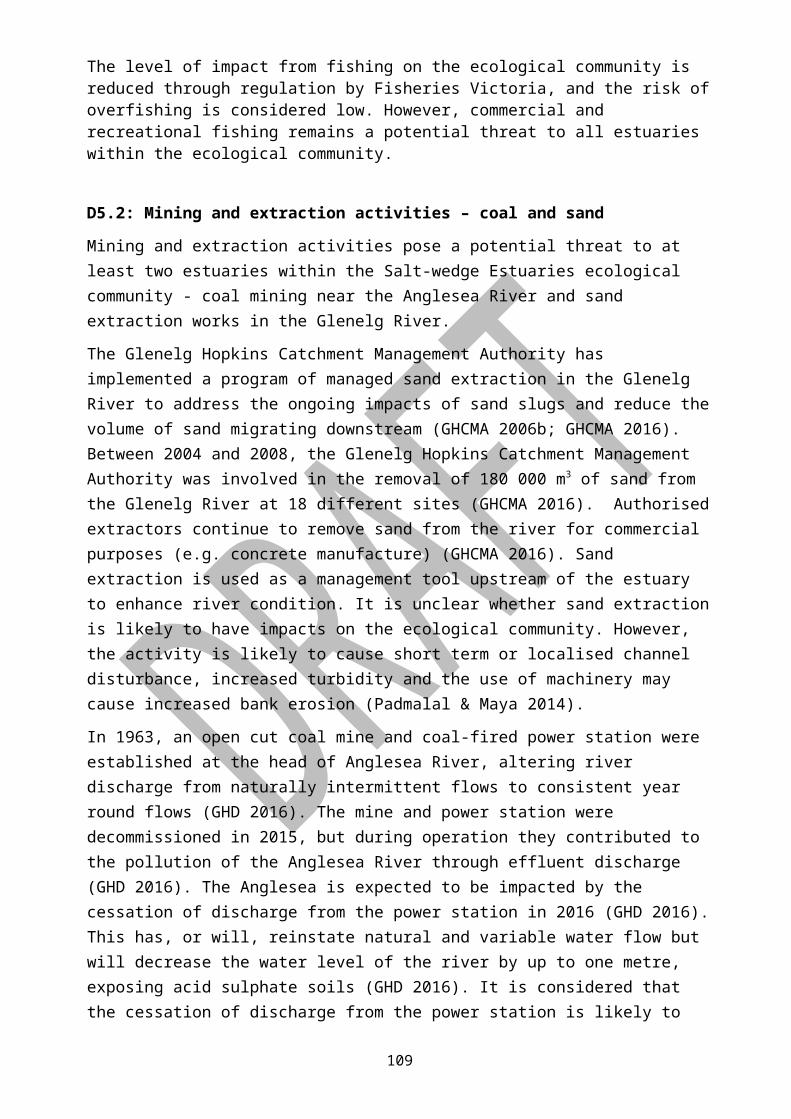
Department of Economic Development, Jobs, Transport, and Resources (DEDJTR) (2015e) Otway – Angling Waters. Accessed: 18 January 2017. Available on the internet at: http://agriculture.vic.gov.au/fisheries/recreational-fishing/fishing-locations/inland-angling-guide/otway/otway-angling-waters
Department of Environment, Land, Water and Planning (DELWP) (2016) Managing willows in Victoria. Victorian Government.
Department of Environment and Primary Industries (DEPI) (2013a) Index of Stream Condition: The third benchmark of Victorian river condition. The Glenelg Hopkins Region and the Corangamite Region. Accessed: February 2017. Available on the internet at: http://www.depi.vic.gov.au/water/water-resource-reporting/Third-Index-of-Stream-Condition-report
Department of Environment and Primary Industries (DEPI) (2013b) Victorian Waterway Management Strategy. Victorian Government, East Melbourne.
Department of Primary Industries (DPI) (2007) Primefacts: Seagrasses. Primefact 629. New South Wales Department of Primary Industries, September 2007. Accessed: February 2017. Available on the internet at: http://www.dpi.nsw.gov.au/__data/assets/pdf_file/0019/203149/seagrasses-primefact-629.pdf
Department of Primary Industries (DPI) (2016) Impacts of urban and rural development. State of New South Wales. Accessed: 24 October 2016. Available on the internet at: (http://www.dpi.nsw.gov.au/fishing/habitat/threats/urban
Department of Primary Industries (DPI) (2017a) Acid sulfate soils. State of New South Wales. Accessed: 25 January 2017. Available on the internet at: http://www.dpi.nsw.gov.au/fishing/habitat/threats/acid-sulfate-soils
Department of Primary Industries (DPI) (2017b) General information about carp. State of New South Wales. Accessed: 7 February 2017. Available on the internet at: http://www.dpi.nsw.gov.au/fishing/pests-diseases/freshwater-pests/species/carp/general-information
Department of Primary Industries (DPI) (2017c) Eastern Gambusia. State of New South Wales. Accessed: 25 January 2017. Available on the internet at: http://www.dpi.nsw.gov.au/fishing/pests-diseases/freshwater-pests/species/gambusia
Department of Primary Industries (DPI) (2017d) Yellowfin goby. State of New South Wales. Accessed: 7 February 2017. Available on the internet at: http://www.dpi.nsw.gov.au/fishing/pests-diseases/marine-pests/found-in-nsw/yellowfin-goby
Department of Sustainability and Environment (DSE) (2003a) Action Statement No. 122. Increase in sediment input to rivers and streams due to human activities. Victorian Government, East Melbourne.
Department of Sustainability and Environment (DSE) (2003b) Action Statement No. 177. Alteration to the natural flow regimes of rivers and streams. Victorian Government, East Melbourne.
109

Department of Sustainability and Environment (DSE) (2003c) Action Statement No. 190. Introduction of live fish into waters within Victorian river catchments. Victorian Government, East Melbourne.
Department of Sustainability and Environment (DSE) (2007) 2007 EVC bioregional conservation status, tenure and depletion statement for Victoria. Excel Spreadsheet. Department of Sustainability and Environment, Melbourne
Department of the Environment and Energy (DEE) (2016) Directory of Important Wetlands in Australia, Commonwealth of Australia. Accessed: January 2017. Available on the internet at: http://www.environment.gov.au/water/wetlands/australian-wetlands-database/directory-important-wetlands
Department of the Environment and Energy (DEE) (2017) EPBC Act Protected Matters Report, Environmental Reporting Tool, Commonwealth of Australia.
Department of Water (DoW) (2015) Threats to our waterways. Government of Western Australia. Accessed: 8 November 2016. Available on the internet at: http://www.water.wa.gov.au/water-topics/waterways/threats-to-our-waterways/statewide-river-assessment
Director of National Parks (2013) South-east Commonwealth Marine Reserves Network management plan 2013-23. Director of National Parks, Canberra.
Dittmann S, Rolston A, Benger SN & Kupriyanova EK (2009) Habitat requirements, distribution and colonisation of the tubeworm Ficopomatus enigmaticus in the Lower Lakes and Coorong. Report for the South Australian Murray-Darling Basin Natural Resources Management Board, Adelaide.
Edmunds M, Roob R & Ferns L (2000) Chapter 6: Marine biogeography of Central Victoria and Flinders Bioregions – A preliminary analysis of reef flora and fauna. In: Environmental Inventory of Victoria’s Marine Ecosystems Stage 3 (2nd Edition) – Understanding biodiversity representativeness of Victoria’s rocky reefs. Eds LW Ferns and D Hough. Parks, Flora and Fauna Division, Department of Natural Resources and Environment, East Melbourne, Australia. pp.55.
Environment Protection AuthorityVictoria (EPA) (2007). Fish deaths reported to EPA Victoria, 1998-2007. EPA Victoria Publication 1175.
Environment Protection Authority Victoria (EPA) (2011). How will climate change affect Victorian estuaries? EPA Victoria Publication 1389.
Environment Protection Authority Victoria (EPA) (2012). Water. Fact Sheet. EPA Victoria Publication 1470.
Eyre BD (1998) Transport, retention and transformation of material in Australian estuaries. Estuaries 21, 540–551.
Fischer RA, Martin CO & Fischenich JC (2000) Improving riparian buffer strips and corridors for water quality and wildlife. International Conference on riparian ecology and management in multi-land use watersheds. American Water Resources Association.
Fondriest Environmental Inc. (FEI) (2014) Fundamentals of Environmental Measurements: Water Temperature. Accessed: January 2017. Available on the internet at:
110

http://www.fondriest.com/environmental-measurements/parameters/water-quality/water-temperature
Ford JR, Williams RJ, Fowler AM & Suthers I (2010) Identifying critical estuarine seagrass habitat for settlement of coastally spawned fish. Marine Ecology Progress Series 408, 181–193.
Fourqurean JW, Cuarte CM, Kennedy H, Marba N, Holmer M, Mateo MA, Apostolaki ET, Kendrick GA, Krause-Jensen D, McGlathery KJ & Serrano O (2012) Seagrass ecosystems as a globally significant carbon stock. Nature Geoscience DOI: 10.1038/NGE01477.
Framlingham Aboriginal Trust & Winda Mara Aboriginal Corporation (2004) Kooyang Sea Country Plan. Accessed: January 2017. Available on the internet at: https://www.environment.gov.au/system/files/resources/4fc3aad8-47f4-4d90-b58e-bbadbd9e369d/files/kooyang-plan05.pdf
Froneman PW (2004) Zooplankton community structure and biomass in a southern African temporarily open/closed estuary. Estuarine Coastal and Shelf Science 60, 125–132.
GHD (2016). Anglesea River Estuary Flow Assessment Final Approved Report. Corangamite Catchment Management Authority.
Glamore WC, Raynor DS & Rahman PF (2016). Estuaries and climate change. Technical monograph prepared for the National Climate Change Adaption Research Facility. Water Research Laboratory of the School of Civil and Environmental Engineering, University of New South Wales.
Glenelg Hopkins Catchment Management Authority (GHCMA) (2004) Yambuk Lake Estuary and Wetlands Management Plan.
Glenelg Hopkins Catchment Management Authority (GHCMA) (2005) Hopkins Estuary Management Plan. Hamilton, Victoria.
Glenelg Hopkins Catchment Management Authority (GHCMA) (2006a) Fitzroy Estuary Management Plan. Hamilton, Victoria.
Glenelg Hopkins Catchment Management Authority (GHCMA) (2006b) Glenelg Estuary Management Plan. Hamilton, Victoria.
Glenelg Hopkins Catchment Management Authority (GHCMA) (2007) Surry Estuary Management Plan. Hamilton, Victoria.
Glenelg Hopkins Catchment Management Authority (GHCMA) (2008) Merri Estuary Management Plan. Hamilton, Victoria.
Glenelg Hopkins Catchment Management Authority (GHCMA) (2016) Sand Management. Accessed: 18 January 2017. Available on the internet at: http://www.ghcma.vic.gov.au/projects/current-project/what-is-the-glenelg-river-restoration-project/sand-management/
Grange N, Whitfield AK, De Villiers DJ & Allanson BR (2000) The response of two South African east coast estuaries to altered river flow regimes. Aquatic Conversion. Marine and Freshwater Ecosystems 10, 155 – 177.
Grice GD & Marcus NH (1981) Dormant eggs of marine copepods. Oceanography and Marine Biology Annual Review 19, 125–40.
111

Grose M (2015) Southern Slopes Cluster Report, Climate Change in Australia Projections for Australia’s Natural Resource Management Regions: Cluster Reports. Eds Ekstrom M et al., CSIRO and Bureau of Meteorology, Australia.
Haines PE & Thom BG (2007) Climate change impacts on entrance processes of intermittently open/closed coastal lagoons in New South Wales, Australia. Journal of Coastal Research SI 50: 242–246.
Hall CJ & Burns CW (2002) Effects of salinity and temperature on survival and reproduction of Boeckella hamata (Copepoda: Calanoida) from a periodically brackish lake. Journal of Plankton Research 23(1), 97–103.
Hall CJ & Burns CW (2002) Hatching of Boeckella hamata (Copepoda: Calanoida) resting eggs from sediments of a tidally influenced lake, New Zealand Journal of Marine and Freshwater Research, 35(2), 235-238, DOI: 10.1080/00288330.2001.9516994.
Hallet CS, Valensi FJ & Elliott M (2016 in press) A review of Australian approaches for monitoring, assessing and reporting estuarine condition: III. Evaluation against international best practice and recommendations for the future.
Hirst AJ (2004) Broad-scale environmental gradients among estuarine benthic macrofaunal assemblages of south-eastern Australia: implications for monitoring estuaries. Marine and Freshwater Research 55, 79–92.
Hoedt F & Dimmlich W (1995) Egg and Larval Abundance and Spawning Localities of the Anchovy (Engraulis australis) and Pilchard (Sardinops neopilchardsus) near Phillip Island, Victoria. Marine and Freshwater Research, 1995, 46, 735-43. CSIRO Publishing, Victoria.
Hotchin K (1980) Three previously unrecorded Aboriginal stone alignments on the Hopkins River, Western District Records of the Victorian Archaeological Survey 10, 119.
Hunter J (2012) A simple technique for estimating an allowance for uncertain sea-level rise. Climatic Change 113, 239–252.
Ibañez C, Pont D & Prat N (1997) Characterisation of the Ebre and Rhone estuaries: A basis for defining and classifying salt-wedge estuaries. Limnology and Oceanography 42(1), 89–101.
Ierodiaconou DA & Laurenson LJB (2002) Estimates of Heterozostera tasmanica, Zostera muelleri and Ruppia megacarpa distribution and biomass in the Hopkins Estuary, western Victoria, by GPS. Australian Journal of Botany 50, 215–228.
Intergovernmental Panel on Climate Change (IPCC) (2013) Summary for Policymakers. In: Climate Change 2013: The Physical Science Basis. Contribution of Working Group I to the Fifth Assessment Report of the Intergovernmental Panel on Climate Change [Stocker, TF, D Qin, G-K Plattner, M Tignor, SK Allen, J Boschung, A Nauels, Y Xia, V Bex & PM Midgley (eds.)]. Cambridge University Press, Cambridge, United Kingdom and New York, NY, USA. 29 pp.
Islam S & Tanaka M (2004) Impacts of pollution on coastal and marine ecosystems including coastal and marine fisheries and approach for management: a review and synthesis. Marine Pollution Bulletin 48, 624-649.
Jarvis AC (1979) A seasonal study of zooplankton in the Botany Bay – Georges River estuary. MSc Thesis, University of New South Wales.
112
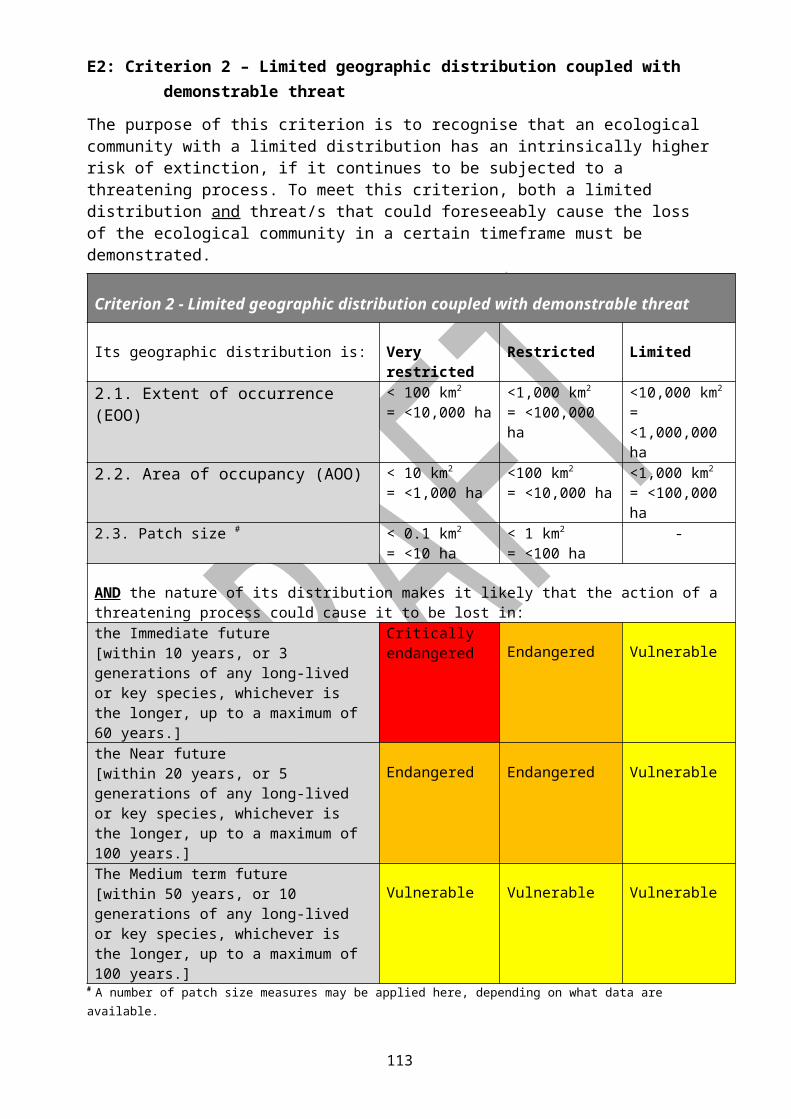
Jarvis JC, Moore KA & Kenworthy WJ (2014) Persistence of Zostera marina L (eelgrass) seeds in the sediments seed bank. Journal Experimental Marine Biology and Ecology 459, 126–136.
Jassby AD, Kimmerer WJ, Monismith SG, Armor C, JE Cloern, Powell TM, Schubel JR & Vendlinski TI (1995) Isohaline position as a habitat indicator for estuarine populations. Ecological Applications 5(1), 272–289.
Jenkins GP, Conron SD & Morison AK (2010) Highly variable recruitment in an estuarine fish is determined by salinity stratification and freshwater flow: implications of a changing climate. Marine Ecology Progress Series 417, 249–261.
Jenkins GP, Frankish KR & Partridge GJ (1999) Manual for the hatchery production of black bream (Acanthopagrus butcheri). Fremantel Maritime Centre, Perth.
Jiménez Cisneros BE, Oki T, Arnell NW, Benito G, Cogley JG, Döll P, Jiang T & Mwakalila SS (2014) Freshwater resources. In: Climate Change 2014: Impacts, Adaptation, and Vulnerability. Part A: Global and Sectoral Aspects. Contribution of Working Group II to the Fifth Assessment Report of the Intergovernmental Panel on Climate Change [Field CB, Barros VR, Dokken DJ, Mach KJ, Mastrandrea MD, Bilir TE, Chatterjee M, Ebi KL, Estrada YO, Genova RC, Girma B, Kissel ES, Levy AN, MacCracken S, Mastrandrea PR & White LL (eds.)]. Cambridge University Press, Cambridge, United Kingdom and New York, NY, USA, pp. 229–269.
Jones RN & Durack PJ (2005) Estimating the Impacts of Climate Change on Victoria’s Runoff using a Hydrological Sensitivity Model. CSIRO Atmospheric Research, Melbourne.
Jones CG, Lawton JH & Schachak M (1994) Organisms as ecosystem engineers. Oikos 69, 373–386.
Kelly L (2000) The management of ecological impacts of nutrients, vegetation and river mouth opening processes in the Gellibrand River Estuary and Wetlands. Honours Thesis, Deakin University, Warrnambool.
Kennedy GR (1978) Plankton of the Fitzroy River estuary Queensland. Proc. Roy. Soc. Queensland 89,29–37.
Kilminster K, McMahon, Waycott M, Kendrick GA, Scanes P, McKenzie L, O’Brien FR, Lyons M, Ferguson A, Maxwell P, Glasby T & Udy J (2015). Unravelling complexity in seagrass systems for management: Australia as a microcosm. Sci Total Environ. Article in Press. pp 13. Accessed: February 2017. Available on the internet at: http://dx.doi.org/10.1016/j.scitotenv.2015.04.061
Kimmerer WJ (2002) Effects of freshwater flow on abundance of estuarine organisms: physical effects or trophic linkages? Marine Ecology Progress Series 243, 39–55.
Kirkman H (1997) Seagrasses of Australia. State of the Environment Technical Paper Series (Estuaries and the Sea). Central Queensland University Publishing Unit, North Beach, WA.
Koehn JD & O’Connor WG (1990) Threats to Victorian native freshwater fish. Victorian Naturalist 107, 5–12.
Koehn J, Brumley A, & Gehrke P (2000) Managing the Impacts of Carp. Bureau of Rural Sciences, Department of Agriculture, Fisheries and Forestry, Canberra.
113

Kurup GR, Hamilton DP & Patterson JC (1998) Modelling the effect of seasonal flow variations on the position of salt wedge in a microtidal estuary. Estuarine, Coastal and Shelf Science 47(2), 191-208.
Lenanton RCJ & Potter IC (1987) Contribution of estuaries to the commercial fisheries in temperate Western Australia and the concept of estuarine dependence. Estuaries 10(1), 28–35.
Lill A, Closs G, Schallenberg M & Savage C (2012) Impact of berm breaching on hyperbenthic macroinvertebrate communities in intermittently closed estuaries. Estuaries and Coasts 35(1), 155-168.
Lloyd LN, Anderson BG, Cooling M, Gippel CJ, Pope AJ & Sherwood JE (2008) Environmental water requirements of the Gellibrand Estuary: final estuary FLOWS report, Lloyd Environmental Pty Ltd, [Syndal, Vic.]. Accessed: February 2017. Available on the internet at: http://dro.deakin.edu.au/eserv/DU:30018733/pope-environmentalwater-2008.pdf
Lloyd LN, Anderson BG, Cooling M, Gippel CJ, Pope AJ & Sherwood JE (2009) Estuary environmental flows assessment methodology: final specification report, Lloyd Environmental Pty Ltd, Colac, Victoria. Accessed: February 2017. Available on the internet at: http://dro.deakin.edu.au/eserv/DU:30047195/pope-estuaryenvironmental-2009.pdf
McInnes KL, Church J, Monselesan D, Hunter JR, O’Grady JG, Haigh ID & Zhang X (2015) Information for Australian impact and adaptation planning in response to Sea-Level-Rise. Australian Meteorological and Oceanographic Journal 65(1), 127–149.
McKenzie JL, Quinn GP, Matthews TG, Barton J & Bellgrove A (2011) Influence of intermittent estuary outflow on coastal sediments of adjacent sandy beaches. Estuarine Coastal and Shelf Science 92, 59–69.
McLean EJ & Hinwood JB (2011) Physical Response to the Spring 2010 Environmental Flow Release to the Snowy River Estuary. Ed. S. Williams, prepared by GeoQuest, Geomax & Coastal Environmental Consultants for NSW Office of Water, Sydney.
McSweeney SL, Kennedy DM, Rutherfurd ID & Stout JC (2017) Intermittently Closed/Open Lakes and Lagoons: Their global distribution and boundary conditions. Geomor doi: 10.1016/j.geomorph.2017.04.022
Macreadie PI, Baird ME, Trevathan-Tackett SM, Larkum AWD & Ralph PJ (2013) Quantifying and modelling the carbon sequestration capacity of seagrass meadows – A critical assessment. Marine Pollution Bulletin 83, 430–439.
Macreadie PI, York PH & Sherman CDH (2014) Resilience of Zostera muelleri seagrass to small-scale disturbances: the relative importance of asexual versus sexual recovery. Ecology and Evolution 4(4), 450–461. doi: 10.1002/ece3.933.
Maher W (2011) Anglesea River Water Quality Review. Independent review for the Corangamite Catchment Management Authority. Accessed: February 2017. Available on the internet at: http://www.ccma.vic.gov.au/admin/file/content2/c7/03_Anglesea-River-Water-Quality-Review.pdf
Marcus NH (1996) Ecological and evolutionary significance of resting eggs in marine copepods: past, present, and future studies. Hydrobiolgia 320, 141–52.
114

Masters D, Nerem RS, Choe C, Leuliette E, Beckley B, White N & Ablain M (2012) Comparison of global mean sea level time series from TOPEX/Poseidon, Jason-1, and Jason-2. Mar. Geodesy 35, 20–41.
Meynecke JO, Lee SY, Duke NC, Warnken J (2006) Effect of rainfall as a component of climate change on estuarine fish production in Queensland, Australia. Estuarine Coastal and Shelf Science 69, 491–504.
Mieszkowska N, Firth L & Bently M (2013) Impacts of climate change on intertidal habitats. Marine Climate Change Impacts Partnership Science Review 2013, 180–190.
Milbrandt EC, Bartleson RD, Coen LD, Rybak O, Thompson MA, DeAngelo JA and Stevens PW (2012) Local and regional effects of reopening a tidal inlet on estuarine water quality, seagrass habitat, and fish assemblages. Continental Shelf Research 41(0), 1–16.
Miller CB (1983) The zooplankton of estuaries. In: Ecosystems of the World 26. Estuaries and Enclosed Seas. Ed. BH Ketchum. Elsiever Scientific Publishing Co., Amsterdam. pp. 103–149.
Miller DC, Geider, RJ and MacIntrye HL (1996) Microphytobenthos: the ecological role of the ‘secret garden’ of unvegetated, shallow-water marine habitats. II. Role in sediment stability and shallow-water food webs. Estuaries 19, 202–212.
Mills LS, Soule ME & Doak DF (1993) The keystone-species concept in ecology and conservation: management and policy must explicitly consider the complexity of interactions in natural systems. BioScience 43(4), 219–224.
Mondon J, Sherwood J & Chandler F (2003) Western Victorian Estuaries Classification Project. Prepared for the Western Coastal Board, Warrnambool, Victoria, 120 p.
Morison AK, Coutin PC & Robertson SG (1998) Age determination of black bream, Acanthopagrus butcheri (Sparidae), from the Gippsland Lakes of south-eastern Australia indicates slow growth and episodic recruitment. Marine and Freshwater Research 49, 491–498.
Mortazavi B, Iverson RL, Landing WM, Lewis FG & Huang W (2000) Control of phytoplankton production and biomass in a river dominated estuary: Apalachicola Bay, Florida, USA. Marine Ecology Progress Series 198, 19–31.
Moverley J & Hirst A (1999) Estuarine Health Assessment Using Benthic Macrofauna. LWRRDC Report No. 11, Occasional Paper 18/99. Accessed: December 2016. Available on the internet at: http://www.precisioninfo.com/rivers_org/au/archive/?dic_id=12
NSW Scientific Committee (2002). Alteration to the natural flow regimes of rivers, streams, floodplains & wetlands - key threatening process listing. State of New South Wales and Office of Environment and Heritage. Accessed: November 2016. Available on the internet at: http://www.environment.nsw.gov.au/threatenedspecies/AlterationNaturalFlowKTPListing.htm
Newton G (1994) Estuarine Zooplankton Ecology in Relation to the Hydrological Cycles of a Salt-wedge Estuary. PhD Thesis Par I and II. School of Aquatic Science and Natural Resources Management, Deakin University, Australia.
Newton G (1995) Zooplankton and estuaries … let us not forget! Australasian Science. 16 (2), 18–20.
115

Newton GM (1996) Estuarine ichthyoplankton ecology in relation to hydrology and zooplankton dynamics in a salt-wedge estuary. Marine and Freshwater Research 47, 99-111.
Newton G (2008) Estuaries and climate change. Waves 14(2): 7–8. Accessed: January 2017. Available on the internet at: https://ginanewton.com/books-publications/scientific-publications/
Newton GM (2012) Buffer zones for aquatic biodiversity conservation. Australasian Plant Conservation 21(2), 18–23.
Newton GM & Mitchell BD (1999) Egg dormancy in the Australian estuarine-endemic copepods Gippslandia estuarina and Sulcanus conflictus, with reference to dormancy of other estuarine fauna. Marine and Freshwater Research 50, 441–9.
Nicholson G, Jenkins GP, Sherwood J & Longmore A (2008) Physical environmental conditions, spawning and early-life stages of an estuarine fish: climate change implications for recruitment in intermittently open estuaries. Marine and Freshwater Research 59, 735–749.
North EW & Houde, ED (2003) Linking ETM physics, zooplankton prey, and fish early-life histories to striped bass Morone saxatilis and white perch M. americana recruitment. Marine Ecology Progress Series 260, 219–236. doi:10.3354/MEPS260219
O’Hara TD & Poore GCB (2000) Patterns of distribution for southern Australian marine echinoderms and decapods. Journal of Biogeography 27, 1321–1335.
Oliver TSN, Rogers K, Chafer CJ & Woodroffe CD (2012) Measuring, mapping and modelling: an integrated approach to the management of mangrove and saltmarsh in the Minnamurra River estuary, southeast Australia. Wetlands Ecology and Management 20, 353–371.
Orth RJ, Marion SR, Moore KA, Wilcox DJ (2010). Eelgrass (Zostera marina L.) in the Chesapeake Bay region of mid-Atlantic Coast of the USA: challenges in conservation and restoration. Estuar. Coast. 33, 139–150, http://dx.doi.org/10.1007/s12237-009-9234-0
Ough K & Bayly IAE (1989) Salinity tolerance, development rates and predation capabilities of Sulcanus conflictus Nicholls (Copepoda: Calanoida). Estuarine Coastal Shelf Science 28, 195–209.
Padmala D & Maya K (2014). Sand mining: Environmental Impacts and Selected Case Studies. Environmental Science and Engineering. Springer Science, Netherlands.
Pahor S & Newton G (2013) Understanding blackwater events in rivers. Australasian Plant Conservation 22(2), 18–19.
Paul M & Amos CL (2011) Spatial and seasonal variation in wave attenuation over Zostera noltii. J Geophys Res. 116, C08019. doi: 10.1029/2010JC006797
Parks Victoria (1998) Port Campbell National Park and Bay of Islands Coastal Park Management Plan 1998. Parks Victoria, Melbourne.
Parks Victoria (2002) Wilson’s Promontory National Park Management Plan 2002. Parks Victoria, Melbourne.
Parks Victoria (2003) Victoria’s System of Marine National Parks and Marine Sanctuaries – Management Strategy 2003-2010. Parks Victoria, Melbourne.
Parks Victoria (2006a) Twelve Apostles Marine National Park Management Plan 2006. Parks Victoria, Melbourne.
116

Parks Victoria (2006b) Wilson’s Promontory Marine National Park Management Plan 2006. Parks Victoria, Melbourne.
Parks Victoria (2009) Great Otway National park and Otway Forest Park Management Plan 2009. Parks Victoria, Melbourne.
Parks Victoria (2017) Park locator map search. Victoria State Government. Accessed: January 2017. Available on the internet at: http://parkweb.vic.gov.au/explore/parks
Perissinotto R, Stretch DD, Whitfield AK, Adams JB, Forbes AT & Demetriades NT (2010) Ecosystem Functioning of Temporarily Open/Closed Estuaries in South Africa. In: Estuaries: Types, Movement Patterns… Eds. JR Crane and AE Solomon. pp. 1–69.
Phil L, Baden SP & Diaz RJ (1991) Effects of periodic hypoxia on the distribution of demersal fish and crustaceans. Marine Biology 108, 349–360.
Pierson WT, Bishop K, Van Senden D, Horton PR & Adamantidis CA (2002) Environmental Water Requirements to Maintain Estuarine Processes. Environment Australia, Environmental Flows Initiative Technical Report No. 3.
Planisphere (2008). Kennet River, Wye River and Separation Creek Structure Plans. Final report for Colac Otway Shire.
Pope A (2006) Freshwater influences on hydrology and seagrass dynamics of intermittent estuaries. PhD Thesis. School of Life and Environmental Sciences, Deakin University, Warrnambool.
Pope A (2010) Anglesea Fish Deaths. Causes and Recent Investigations. Report for EPA Victoria. Deakin University.
Pope AJ, Barton JL & Quinn GP (2015) Victorian Index of Estuary Condition: Implementation Trial Final Report. Report by the School of Life and Environmental Sciences, Deakin University for the Department of Environment, Land, Water and Planning, Warrnambool, Victoria.
Powell PGL & Matsumoto J (1994). Texas estuarine mathematical programming model: Tool for freshwater inflow management, p. 401–406.In K. R. Dyer and R. J. Orth (Eds.). Changes in Fluxes in Estuaries: Implications from Science to Management. Olsen & Olsen, Fredensborg, Denmark.
Ranashingi R & Pattiaratchi C (2003) The seasonal closure of tidal inlets: causes and effects. Coastal Engineering 45 (4), 601–627.
Ribeiro JPN, Saggio  and Salgueiro Lima MI (2013) The effects of artificial sandbar breaching on the macrophyte communities of an intermittently open estuary. Estuarine, Coastal and Shelf Science 121–122(0), 33–39.
RM Consulting Group (RMCG) (2016) Gellibrand River Estuary Literature Review – Working Draft. Torquay, Victoria.
Roberts J, Chick A, Oswald L, & Thompson P (1995) Effects of carp, Cyprinus carpio, an exotic benthivorous fish, on aquatic plants and water quality in experimental ponds. Marine and Freshwater Research 46, 1171 – 1180.
Roberts J & Sainty G (1996) Listening to the Lachlan. Geoff Sainty and Associates, Potts Point, NSW.
117

Roennfeldt R (2013) Iridoviruses of copepods: their identification, estuarine ecology and host histopathology. PhD thesis, Deakin University, Victoria.
Rogers K and Ralph T (Eds) (2011) Floodplain Wetland Biota in the Murray-Darling Basin: Water and Habitat Requirements. CSIRO Publishing, Collingwood, Victoria.
Rouse AP (1998) Annual phytoplankton and nutrient fluctuations of the Hopkins estuary in south-west Victoria, Australia. PhD Thesis, Deakin University, Warrnambool.
Rovira L, Trobajo R & Ibanez C (2009) Periphytic diatom community in a Mediterranean salt wedge estuary: the Egro Estuary (NE Iberian Peninsula). Acta Bot. Croat. 68(2), 285–300.
Rowe DK, Moore A, Giorgetti A, Maclean C, Grace P, Wadhwa S & Cooke J (2008) Review of the impacts of gambusia, redfin perch, tench, roach, yellowfin goby and streaked goby in Australia. Prepared for the Australian Government Department of the Environment, Water, Heritage and the Arts.
Ryan T & McGuckin J (2007). Drought impact on fish communities and river health in the Corangamite Region Report. Prepared for Corangamite Catchment Management Authority Accessed: 18 January 2017. Available on the internet at: http://www.ccmaknowledgebase.vic.gov.au/resources/Drought_impact_on_river_health_in_the_corangamite_region__2007_.pdf
Saintilan N & Rogers K (2013) The significance and vulnerability of Australian saltmarshes: implications for management in a changing climate. Marine and Freshwater Research 64, 66–79.
Schell P (1995) An Archaeological Survey of the Hopkins River. Unpublished report to the Framlingham Aboriginal Trust and Aboriginal Affairs Victoria.
Scheltinga DM & A Moss (2007) A framework for assessing the health of coastal waters: a trial of the national set of estuarine, coastal and marine indicators in Queensland. Report for National Land and Water Resources Audit. Queensland Government Environment Protection Agency.
Schlacher TA & Wooldridge TH (1996) Ecological responses to reductions in freshwater supply and quality in South Africa’s estuaries: lessons for management and conservation. Journal of Coastal Conservation 2, 115–130.
Scott ME (1988). The impact of infection and disease on animal populations: implication for conservation biology. Conservation Biology 2(1), 40-56.
Sheaves M, Baker R, Nagelkerken I & Connolly R (2014) True Value of Estuarine and Coastal Nurseries for Fish: Incorporating Complexity and Dynamics. Estuaries and Coasts DOI 10.1007/s12237-014-9846-x.
Sheehy MRJ & Greenwood JG (1989) Mechanisms of horizontal distribution maintenance by Gladioferens pectinatus (Brady) [Calanoida: Centropagidae] in the Brisbane River estuary. Proc. R. Soc. Qld. 100: 1–11
Sherwood J (1983) Hydrodynamics of the Gellibrand River Estuary. Report to the Victorian S.R.W.S. Commission. Warrnambool Institute of Advanced Education, Faculty of Applied Science and Technology, Report 83/1.
118

Sherwood J (1985) Hydrodynamics of South-west Victorian Estuaries. Warrnambool, Warrnambool Institute of Advanced Education: 9.
Sherwood JE (1988) The likely impact of climate change on south-west Victorian estuaries. In: Greenhouse: Planning for Climate Change. (Ed. GI Pearman). CSIRO, Division of Atmospheric Research, Melbourne. p. 456–472.
Sherwood J, Magilton C & Rouse A (1998). The Glenelg River: Nutrients and Estuarine Hydrodynamics. Deakin University, Warrnambool. A report to the Department of Natural Resources and Environment.
Sherwood JE, Mitchell BD, Magilton, CJ, Walsh CJ & Newton GM (1987) A study of the Barwon Estuary Complex. Warrnambool Institute of Advanced Education. Faculty of Applied Science and Technology, Report 87–2, Report to the South-West Regional Water Resources Task Force, Department of Water Resources, Melbourne, Victoria.
Sherwood J, Mondon, J & Fenton C (2008) Classification and management issues of estuaries in Western Victoria, Australia. Proc. Roy. Soc. Victoria 120(1), 257–276.
Short FT & Neckles H (1999) The effects of global climate change on seagrasses. Aquatic Botany 63, 169–196.
Snow G & Taljaard S (2007) Water quality. In: Whitfield A. & G.C. Bate (Eds) A Review of Information on Temporarily Open/Closed Estuaries in the Warm and Cool Temperate Biogeographic Regions of South Africa, with Particular Emphasis on the Influence of River Flow on These Systems. Water Research Commission, Report, Report No. 1581/1/07: 214 pp.
South Gippsland Water (2011) Water Supply Demand Strategy. Accessed: 23 January 2017. Available on the internet at: http://www.sgwater.com.au/wp-content/uploads/2014/04/Appendix-1-2.pdf
Southern Rural Water (2013) Local Management Plan. Glenelg River Basin. Accessed: 4 January 2017. Available on the internet at: http://www.srw.com.au/files/Local_management_rules/Glenelg_Basin_LMP_September_2013.pdf
Southern Rural Water (2017a) Taking water from rivers and creeks. Fact Sheet. Accessed: 6 February 2017. Available on the internet at: http://www.srw.com.au/wp-content/uploads/2016/03/Taking-water-from-rivers-and-creeks-1.pdf
Southern Rural Water (2017b) Your right to domestic and stock water. Fact sheet. Accessed: 6 February 2017. Available on the internet at: http://www.srw.com.au/wp-content/uploads/2016/03/Your-right-to-domestic-and-stock-water-1.pdf
Stiling P (1999) Ecology: theories and Applications. Third Edition. Prentice Hall, New Jersey.
Suttle CA (2007) Marine viruses – major players in the global ecosystem. Nature Reviews, Microbiology 5, 801–812.
119

Suvendu R (2013). The effect of road crossing on river morphology ad riverine aquatic life: a case study in Kunar River Basin, West Bengal. Ethiopian Journal of Environmental Studies and Management 6, 835-845.
Threatened Species Scientific Committee (TSSC) (2013) Commonwealth Conservation Advice for Subtropical and Temperate Coastal Saltmarsh. Department of Sustainability, Environment, Water, Population and Communities, Canberra.
Department of the Environment and Energy (DEE) & Threatened Species Scientific Committee (TSSC) (2017) Guidelines for nominating and assessing the eligibility for listing of ecological communities as threatened according to the Environment Protection and Biodiversity Conservation Act 1999 and the EPBC Regulations 2000. Eds. M White, N Ward and P Barraclough. Department of the Environment and Energy, Canberra.
Tonkin Z, Macdonald J, Kaus A, Ramsey D, Hames F, Crook D & King A (2011) A field based assessment of native fish responses following eastern gambusia removal: putting theory into practice. Presentation, Gambusia Forum 2011: Small fish…big problem, 1–2 June 2011, Crown Plaza Hotel, Melbourne, Victoria, Australia.
Tunbridge BR & Glenane TG (1985) Fisheries value and classification of fresh and estuarine waters in Victoria. Fisheries and Wildlife, Ministry for Conservation, Victoria.
Van Niekerk L, Adams JB, Bate GC, Forbes AT, Forbes NT, Huizinga P, Lamberth SJ, MacKay CF, Petersen C, Taljaard S, Weerts SP, Whitfield AK & Wooldridge TH (2013) Country-wide assessment of estuary health: An approach for integrating pressures and ecosystem response in a data limited environment. Estuarine, Coastal and Shelf Science 130 (0): 239–251.
Victorian Water Register (2017). Bulk entitlements. The State of Victoria. Department of Environment, Land, Water and Planning. Accessed: 6 February 2017. Available on the internet at: http://waterregister.vic.gov.au/water-entitlements/bulk-entitlements
Vilizzi L, Thwaites LA, Smith BB, Nicol JM & Madden CP (2014). Ecological effects of common carp (Cyprinus carpio) in a semi-arid floodplain wetland. Marine and Freshwater Research 65, 802 – 817.
Walsh CJ (1994) Ecology of epifaunal caridean shrimps in the Hopkins River estuary, and the role of estuaries in the life history of the atyid Paratya australiensis Kemp, 1917 in south-eastern Australia. PhD Thesis, School of Aquatic Science and Natural Resources Management, Deakin University, Australia.
Walsh CJ & Mitchell BD (1995) The Freshwater Shrimp Paratya australiensis (Kemp, 1917) (Decapoda: Atyidae) in Estuaries of South-western Victoria, Australia. Marine and Freshwater Research 46: 959–65.Wannon Water (2012). Supply System. Accessed: 23 January 2017. Available on the internet at: https://www.wannonwater.com.au/index.php?option=com_content&task=view&id=386&Itemid=402
Water Technology (2008). Curdies Estuary Management Plan. Report No. J624/R02. Notting Hill, Victoria.
Waters JM, King TM, O’Laughlin PM & Spencer HG (2005) Phylogeographical disjunction in abundant high-dispersal littoral gastropods. Molecular Ecology 14: 2789–2802.
120

Waters JM, O’Loughlin PM & Roy MS (2004) Cladogenesis in a starfish species complex from southern Australia: evidence for vicariant speciation? Molecular Phylogenetics and Evolution 32: 236–245.
Waters JM & Roy MS (2003) Marine biogeography of southern Australia: phylogeographical structure in a temperate sea-star. Journal of Biogeography 30: 1787–1796.
Waters JM, Wernberg T, Connell SD, Thomsen MS, Zuccarello GC, Kraft GT, Sanderson JC, West JA & Gurgel CFD (2010) Australia’s marine biogeography revisited: Back to the future? Austral Ecology 35: 988–992.
Waycott M, Duarte CM, Carruthers T J B, Orth RJ, Dennison WC & Olyarnik S (2009) Accelerating loss of seagrasses across the globe threatens coastal ecosystems. Proc. Natl. Acad. Sci. U.S.A. 106:12377–12381
Wenger S (1999) A review of the scientific literature on riparian buffer width, extent and vegetation. Office of Public Service and Outreach, Institute of Ecology, University of Georgia.
West Gippsland Catchment Management Authority (WGCMA) (2015). Powlett River Estuary Management Plan. Traralgon, Victoria.
White NJ, Haigh ID, Church JA, Koen T, Watson CS, Pritchard TR, Watson PJ, Burgette RJ, McInnes KL, You Z-J, Zhang X & Tregoning P (2014) Australian sea levels – Trends, regional variability and influencing factors. Earth-Science Reviews 136: 155–174.
Whitfield AK, Adams JB, Bate GC, Bezuidenhout K, Bornman TG, Cowley PD, Froneman PW, Gama PT, James NC, Mackenzie B, Riddin T, Snow GC, Strydom NA, Taljaard S, Terörde AI, Theron AK, Turpie JK, van Niekerk L, Vorwerk PD & Wooldridge TH (2008) A multidisciplinary study of a small, temporarily open/closed South African estuary, with particular emphasis on the influence of mouth state on the ecology of the system. African Journal of Marine Science 30(3): 453–473.
Whitfield AK, Bate GC, Adams JB, Cowley PD, Froneman PW, Gama PT, Strydom NA, Taljaard S, Theron AK, Turpie JK, Niekerk LV & Wooldridge TH (2012) A review of the ecology and management of temporarily open/closed estuaries in South Africa with particular emphasis on river flow and mouth state as primary drivers of these systems. African Journal of Marine Science 34(2): 163–180.
Williams T, Barbosa-Solomieu V & Chinchar G (2005) A decade of advances in iridovirus research. Advances in Virus Research 65: 173–248.
Williams J, Hindell JS, Swearer SE & Jenkins GP (2012) Influence of freshwater flows on the distribution of eggs and larvae of black bream Acanthopagrus butcheri within a drought-affected estuary. Journal of Fish Biology 80: 2281–2301.
Williams J, Jenkins GP, Hindell JS & Swearer SE (2013) Linking environmental flows with the distribution of black bream Acanthopagrus butcheri eggs, larvae and prey in a drought affected estuary. Marine Ecology Progress Series 483: 273–287.
Willis SE, Laurenson LJB, Mitchell BD & Harrington DJ (1999) Diet of larval and juvenile black bream, Acanthopagrus butcheri, in the Hopkins River Estuary, Victoria, Australia. Proceedings of the Royal Society of Victoria 111 (2): 283–295.
121

Wright JP & Jones CG (2006) The concept of organisms as ecosystem engineers ten year on: progress, limitations and challenges. Bioscience 56: 203–209.
Zampatti BP, Bice CM & Jennings PR (2011) Fish assemblage structure, movement and recruitment in the Coorong and Lower Lakes from 2006-2010. South Australian Research and Development Institute (Aquatic Sciences), Adelaide. SARDI Publication No. F211/000186-1.SARDI Research Report Series No. 569.
122