draft - city of newport beach | home
TRANSCRIPT

Vulnerability of the Newport Harbor Area to Flooding by Extreme Tides
Draft Final Report
Prepared for:
City of Newport Beach, California
Prepared by:
FlowSimulation, LLC
September 22, 2008
Draft

i
Executive Summary
This study addresses the vulnerability of the Newport Harbor area in Newport Beach, California to flooding by extreme high tides. Extreme high tides represent the highest high tides of each year with the potential to rise above bulk heads and inundate low-lying topography. Rainfall and ocean waves represent another threat to flooding but were not the focus of this study. Analysis of a 2006 Light Detection And Ranging (LiDAR) topographic survey shows that Balboa Island, Little Balboa Island, Newport Island, and nearly the full length of Balboa Peninsula along its bay-ward side fall below the height of present-day extreme high tides. A review of site conditions shows that flood control systems are in place to guard these areas against tidal flooding. This includes a combination of public and private infrastructure and operational practices. Infrastructure includes bulk heads (i.e., retaining walls or sea walls) and valves or plugs at the outlets of storm drains and storm sewers that prevent back-flooding. Operational practices include City General Services staff efforts to monitor tide conditions, close storm drain outlets in anticipation of high tides, construct sand berms at bay-side beaches, interface with occupants to ensure that drains on private land are plugged, interface with occupants to encourage sand bagging of low bulkheads, and operation of pumps to drain flooded areas. These efforts are particularly challenging on Balboa Peninsula because the vast majority of shoreline is privately owned, many parcels require that drains be plugged or low bulkheads be sandbagged, yet there appears to be no formal process for occupant cooperation. In contrast, a City owned bulk head encircles both Balboa Island and Little Balboa Island so occupant cooperation is not required. A review of historical data shows that two times a tide height of nearly 8 ft above Mean Lower Low Water (MLLW) was attained: January 28, 1983 (7.8 ft) and January 10, 2005 (7.8 ft). There were reports of flooding in the Harbor area in both cases. Several lines of evidence suggest that the onset of flooding on Balboa Peninsula and Balboa Island, when all tide valves are closed, occurs when the tide rises above the 7.0 foot level relative to Mean Lower Low Water (MLLW). This includes first-hand observation of flooding from a 7.5 ft tide, photographs of historical tides nearly even with the top of the Balboa Island bulk head, and LiDAR ground elevation data. On Balboa Peninsula, flooding commences as a consequence of low and leaky bulk heads. On Balboa Island, flooding commences with overtopping of the Balboa Island Ferry ramp. Topographic survey data shows that the west side of Balboa Island (location of the Ferry ramp) slumps in comparison to the east side, perhaps as a consequence of differential settling. The height of the bulk heads around Balboa and Little Balboa islands were estimated by a combination of LiDAR ground elevation data and field measurements of wall heights. These data indicate that the bulk head varies in height between 7.9 and 9.2 ft (MLLW) around Balboa Island and 8.7 and 9.8 ft around Little Balboa Island. However, seepage through cracks in Balboa and Little Balboa island bulk heads has been reported by
Draft
ii
General Services staff and this could cause flooding at lower tide heights. Also, waves in the harbor could promote overtopping and subsequent flooding at lower tide heights. The southeast corner of Little Balboa Island, in particular, faces the harbor entrance and therefore may be exposed to greater wave energy than other parts of the harbor. There are predictable and unpredictable aspects to the height attained by extreme high tides that should be recognized for effective short and long-term planning purposes. The effect of astronomical factors is predictable. This causes the highest extreme high tides to occur in Winter and Summer but never in Fall or Spring. In addition, there is a cycle lasting several years that causes tide heights to vary by approximately 0.5 ft. This causes tides to be higher one year versus another. This cycle is peaking at present (2007- 2008 time frame) and will peak again in 2011-2012. Through 2020, the highest extreme tide is predicted for December, 2008. The effects of inter-annual phenomena such as El Nino/La Nina, weather conditions, and global warming on tide heights are more difficult to predict. These effects can be characterized by studying historical differences between actual and predicted tides or the Non-Tide Residual (NTR). A review of data for Los Angeles shows that NTRs exceeding 0.5 ft have persisted for days at a time, and 1.0 ft for hours at a time, during Winter. NTRs exceeding 1.0 ft have occurred during strong El-Nino conditions as well as neutral El Nino/La Nina conditions, but never during weak or strong La Nina conditions. Hence, climatic conditions give some indication of flooding risk. Global warming is expected to heighten sea levels further and current projections call for a 1-3 ft rise by 2100. There are also indications that global warming has intensified Winter storms. Therefore, global warming could cause larger NTRs than in recent history as well as more wind and wave energy and more intense rainfall. The worst case scenario for coastal flooding is a strong winter storm that approaches the California coastline from the Gulf of Alaska during an El Nino winter, arriving simultaneously with a high astronomical tide. By monitoring climatic conditions seasonally, and weather conditions daily, it should be possible to forecast a worse-case scenario on a 24-48 hour basis and have a good indication of its severity. To identify and map the vulnerability of the Newport Harbor area to future flooding by extreme high tides, a flood inundation model was developed and applied. A total of nine model simulations were completed corresponding to three tide scenarios (tide heights of 8, 9 and 10 ft), two infrastructure scenarios (an “as-is” scenario and an “improved” scenario corresponding to bulk head improvements presently planned or in progress by the City) and two stream flow scenarios. The 8, 9 and 10 ft tide scenarios represent a range of tide heights that could occur through 2100 from the combined influence of astronomical tides, sea level rise, and environmental conditions such as storms. The probability of these events decreases with tide height, and increases with time due to sea level rise. Model simulations of the 8 ft tide show localized flooding along Balboa Peninsula and widespread flooding across the western half of Balboa Island. This is largely consistent with historical observations of flooding from extreme high tides, particularly considering
Draft
iii
that the largest historical tide only reached the 7.8 ft level. Model simulations of the 9 ft tide show widespread flooding along the bay side of Balboa Peninsula and near complete flooding of Balboa Island, Little Balboa Island and Newport Island. Model simulations of the 10 ft tide show near complete flooding of developed parts of Balboa Peninsula, Balboa Island, Little Balboa Island, Newport Island, and parts of Bay Island and Linda Island. Model predictions suggest that planned bulk head improvements will reduce flooding from future tides with heights of 8 ft, but do little to reduce the impact of 9 ft or higher tides. Further, model predictions suggest that a high rate of stream flow into Upper Bay will exacerbate flooding by an 8 ft tide but have relatively little impact on flooding caused by a 9 or 10 ft tide. That is, tidal effects will overwhelm stream flow effects. To be better prepared for future extreme high tides, the following is recommended:
1) The City should consider creating or formalizing a monitoring system for environmental conditions that affect coastal flooding. This would include not only high astronomical tides but also climatic and weather conditions that contribute to damaging high tides (large NTRs). On a short term basis (24-48 hours), the system could be used to improve the City’s emergency preparedness. On a seasonal or inter-annual basis, the system could help staff to prioritize and guide infrastructure improvement efforts (e.g., sand replenishment).
2) The City should consider creating and maintaining a database of public and private flood control infrastructure, and implementing a monitoring system to track key factors that bear on flood control. For example, the database could provide an inventory of the location, height and condition of bulkheads encircling the harbor, the height and thickness of beach sand along the coastline, and other important data such as tide valves and plugs. This data would logically be integrated into the City GIS, and could be coupled to the flood model developed here to maintain up-to-date maps of flood-vulnerable areas. The model could also be used to evaluate the benefit of proposed flood control measures.
3) In support of item (2) above, the City should consider hiring or employing a qualified surveyor to precisely measure the height of bulk heads around the harbor.
4) The City should consider strengthening efforts to improve Departmental coordination relative to flood protection. For example, General Services staff deal with flood problems first-hand and have an excellent working knowledge of infrastructure deficiencies, but do not appear to be in an ideal position to address these problems through construction efforts (Public Works) or a regulatory/permitting framework (Planning).
5) The City should consider exploring the legal or policy framework that would allow for more systematic improvement of the condition and continuity of bulkheads around the bay in the future, particularly considering that most bulk heads appear to be privately owned.
6) The City should consider developing and adopting a flood risk management plan for the Harbor area before moving forward with any major efforts to improve flood control infrastructure (e.g., raising bulk heads). Flood risk management plans consider the economic, environmental and social consequences of flooding
Draft

iv
to identify the optimal structural (e.g., bulk heads, pump stations) and non-structural (e.g., zoning, insurance) measures for implementation.
7) The City should examine the impact of waves on flooding in a future study. Based on a cursory review of LiDAR data characterizing the height of beach sand along Balboa Peninsula, it is not clear that there is adequate protection against the combined effects of an extreme high tide and ocean waves typical of storm conditions. Such a study could be used to guide future sand replenishment efforts.
Draft
v
Table of Contents Executive Summary ............................................................................................................. i Chapter 1: Introduction ........................................................................................................1 Chapter 2: Review and Synthesis of Terrain Data...............................................................4 Chapter 3: Review of Historical Tides and Development of Design Tides.......................12 Chapter 4: Review of Tidal Flood Control Infrastructure .................................................19 Chapter 5: Modeling of Tidal Flooding Scenarios ............................................................29 Chapter 6: Conclusions and Recommendations ................................................................43 References..........................................................................................................................46 Appendices Appendix I: Tides and Non-Tide Residuals (NTRs) for 1982-2007 Appendix II: NTR Annual Probability Distribution for 1982-2007 Appendix III: Tide Predictions for 2008-2020 Appendix IV: Tide Valve Check List used by City staff
Draft

1
Chapter 1: Introduction The highest high tides in Newport Beach threaten flooding of low-lying terrain. Historically, the highest high tides have reached approximately 7.8 ft above Mean Lower Low Water (MLLW). This has occurred twice: January 28, 1983 and January 10, 2005. In both instances, flooding of Balboa Peninsula and Balboa Island was reported. The highest high tides of each month are called “extreme high tides,” and to some extent are predictable. Based on astronomical factors, the height of future tides can be predicted many years in advance. However, such predictions do not account for factors such as El Nino or La Nina, changes in atmospheric pressure, and weather effects. These effects can cause significant deviations from predicted tides, i.e., greater than one foot in southern California. While sea levels have been rising for decades, higher rates of rise are forecast for the coming century as a consequence of climate change. Increases can be attributed to warmer temperatures, which cause water to expand, as well more liquid mass caused by the melting of ice caps. Current estimates of future sea level rise generally fall in the range of 1-3 ft for the year 2100 (IPCC 2007). A United States Environmental Protection Agency (USEPA) study put these figures in a probabilistic perspective, suggesting there was a 50% chance that sea level rise would exceed 0.4, 0.7 and 1.5 ft by 2025, 2050 and 2100, respectively, and a 10% chance that sea level rise would exceed 0.6, 1.1 and 2.9 ft by 2025, 2050 and 2100, respectively (Titus and Narayanan 1995). A California Coastal Commission report has suggested that a 1 ft increase in sea level is very likely by 2050, and a 3 ft increase is very likely by 2100 (California Coastal Commission 2001). Global warming may impact flooding in other ways as well. Warmer water could intensify North Pacific storms, bringing greater wind and wave energy to the shoreline in Winter and higher intensity precipitation. In support of the Harbor Area Management Plan (HAMP), this report presents a study addressing the vulnerability of the Newport Harbor area to flooding by extreme high tides. To limit the scope and budget of the project, this project focuses on tidal effects and stream flow only. That is, we consider what flooding is likely to occur as the rising tide and stream flow into the bay cause water levels to rise above bulk heads and spill into the developed portions of Newport Harbor. The study does not consider the impact of wind and waves on coastal flooding, although a subsequent study along these lines is recommended, or the effect of local precipitation and flow into storm drains. The study includes the following tasks which are each addressed in subsequent chapters of this report: Task 1: Review and synthesize terrain data sources. Accurate terrain data are crucial for flood inundation modeling. Therefore, this study will begin with a review and synthesis of terrain elevation data likely to be useful for this study including: (1) Bay bathymetry data (land below water) collected by the US Army Corps of Engineers (2002, 2005), (2) City of Newport Beach LiDAR terrain data (2006), (3) Upper Newport Bay LiDAR terrain data collected by the US Army Corps of Engineers (2002), (4) Offshore
Draft

2
bathymetry data distributed by the NOAA Geophysical Data Center (NOAA/GDC) bathymetry data and (5) coastline LiDAR data distributed by NOAA Coastal Services Center (NOAA/CSC). These data are likely to adopt different datums and/or projections. In addition, the coverage of these data sources is not presently clear. In this task, we will convert all data to the California State Plane Coordinate System (Zone VI) using NAVD88 for vertical control. Furthermore, we will review the coverage and accuracy of all data sources and identify the most accurate data sources for the proposed modeling. This is expected to include the recent City LiDAR survey for above-water areas around the Bay and Corps bathymetry data for the below-water areas of the Bay. A map will be prepared showing the coverage and quality of relevant data sources. Deliverable: Interim Report 1 describing the coverage, accessibility and quality of terrain data for flood inundation modeling. This appears as Chapter 2 of this report. Task 2: Develop hypothetical design tides. Records and reports on extreme tides in California will be reviewed first, focusing on information relevant to Newport Harbor. A set of design tides will then be developed to reflect a range of likelihoods based on a 25, 50 and 100 year planning horizon. The specifics of this have yet to be determined, but one possibility is to take the tide record from January 28, 1983 tide as a base case, and to add an uniform offset consistent with EPA sea level rise projections. By running the flood inundation model several times using increasingly larger offsets, a range of flooding scenarios will be depicted corresponding to decreasing probability. Deliverable: Interim Report 2 presenting a set of design tides for subsequent flood inundation modeling. This appears as Chapter 3 of this report. Task 3: Review of sea defense infrastructure. Bulk heads protect several parts of Newport Bay from high Bay levels. Knowledge of the extent of this infrastructure, as well as its exact height, is essential for an accurate depiction of ocean flooding. In addition, a review of drainage infrastructure will be needed to ascertain routes by which ocean water may bypass sea defenses (e.g., through storm drain system) and cause flooding. This task will require support from City staff and involve a site visit around the perimeter of Newport Harbor. Deliverable: Interim Report 3 presenting an overview of sea defense infrastructure in the Newport Harbor area. This appears as Chapter 4 of this report. Task 4a: Prepare a computational grid for model simulations. A model grid will be prepared to support flood inundation modeling. The grid will adopt a variable resolution that balances the demands for accuracy and computational efficiency. Large computational cells will be used in deep water that is always flooded, and small computational cells will be used in areas where inundation of normally dry land is predicted. In addition, the model grid will be aligned with bulk heads and new modeling techniques will be used to realistically simulate overtopping. The resolution of the grid
Draft

3
will be sufficient resolve surface flow along streets. Quality control checks will be made to ensure that model predictions of flood zones are not grid dependent. Task 4b: Perform flood simulations. A 2D numerical model developed by Professor Sanders, BreZo, will be applied to simulate flooding. The model has previously been applied in a number of coastal and inland flow simulation applications, and there are a number of published papers that validate its use. Electronic versions of Professor Sanders’ papers can be accessed from his university web page http://gram.eng.uci.edu/~bfs/sanders2.html or a hard copy can be provided upon request. In each simulation, flow conditions will be forced by two factors: the design tide and storm water inputs from major tributaries that drain to the Bay. The model will assume that all terrain is impermeable, implying no infiltration or drainage of flooding ocean water into storm sewers. In addition, the model will not consider precipitation directly. This approach will allow the model to isolate the impact of ocean levels on flooding. At a future time, BreZo could be coupled to a City drainage model to see how readily ocean water flooding can be mitigated with existing infrastructure, or to design improvements to the sewer infrastructure to better cope with ocean water flooding. However, these tasks are outside the scope of the present study. An executable version of the flood model used for this study will be provided to the City upon completion of the study to support additional modeling if the need arises (e.g., simulations could be repeated with higher bulk-head heights or a different design tide). Task 4c: Prepare flood inundation maps corresponding to extreme tides. The results of model simulations will be processed and distilled into a set of flood inundation maps. These maps will depict regions of inundation corresponding to design tides of various heights. Deliverable: A Project Report incorporating the previous reports and presenting the flood modeling methodology, flood modeling results, a discussion of the vulnerability of the Newport harbor area to flooding, and recommendations for flood hazard mitigation. Flood predictions are presented in Chapter 5 of this report, and recommendations appear in the Executive Summary and in Chapter 6 (Conclusions and Recommendations). Draf
t
4
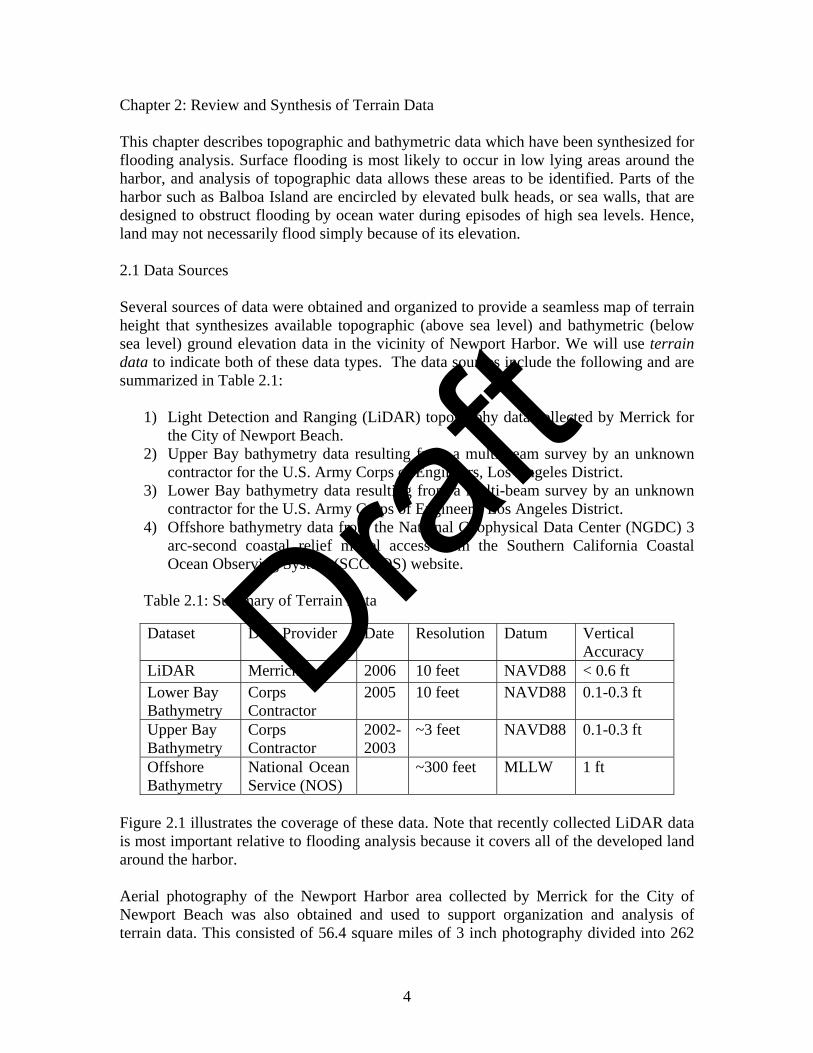
Chapter 2: Review and Synthesis of Terrain Data This chapter describes topographic and bathymetric data which have been synthesized for flooding analysis. Surface flooding is most likely to occur in low lying areas around the harbor, and analysis of topographic data allows these areas to be identified. Parts of the harbor such as Balboa Island are encircled by elevated bulk heads, or sea walls, that are designed to obstruct flooding by ocean water during episodes of high sea levels. Hence, land may not necessarily flood simply because of its elevation. 2.1 Data Sources Several sources of data were obtained and organized to provide a seamless map of terrain height that synthesizes available topographic (above sea level) and bathymetric (below sea level) ground elevation data in the vicinity of Newport Harbor. We will use terrain data to indicate both of these data types. The data sources include the following and are summarized in Table 2.1:
1) Light Detection and Ranging (LiDAR) topography data collected by Merrick for the City of Newport Beach.
2) Upper Bay bathymetry data resulting from a multi-beam survey by an unknown contractor for the U.S. Army Corps of Engineers, Los Angeles District.
3) Lower Bay bathymetry data resulting from a multi-beam survey by an unknown contractor for the U.S. Army Corps of Engineers, Los Angeles District.
4) Offshore bathymetry data from the National Geophysical Data Center (NGDC) 3 arc-second coastal relief model access from the Southern California Coastal Ocean Observing System (SCCOOS) website.
Table 2.1: Summary of Terrain Data
Figure 2.1 illustrates the coverage of these data. Note that recently collected LiDAR data is most important relative to flooding analysis because it covers all of the developed land around the harbor. Aerial photography of the Newport Harbor area collected by Merrick for the City of Newport Beach was also obtained and used to support organization and analysis of terrain data. This consisted of 56.4 square miles of 3 inch photography divided into 262
Dataset Data Provider Date Resolution Datum Vertical Accuracy
LiDAR Merrick 2006 10 feet NAVD88 < 0.6 ft Lower Bay Bathymetry
Corps Contractor
2005 10 feet NAVD88 0.1-0.3 ft
Upper Bay Bathymetry
Corps Contractor
2002-2003
~3 feet NAVD88 0.1-0.3 ft
Offshore Bathymetry
National Ocean Service (NOS)
~300 feet MLLW 1 ft
Draft

5
tiles, each covering an area of 3000 x 2000 feet. In addition, we obtained a 1 foot re-sampled version of the same photography from City of Newport Beach GIS personnel for faster processing. The spatial extent of the LiDAR data was the same as the aerial imagery and included over 53.5 million surface samples. These were extracted at an average spacing of 10 feet with vertical accuracy better than 0.6 feet at 95% confidence level to comply with National Standard for Spatial Data Accuracy (NSSDA) requirements for 1 foot contours. Imagery and LiDAR were processed by Merrick to use the NAD 1983 California State Plane Zone VI (feet) coordinate system and the NAVD 1988 vertical datum. NAD83 and NAVD88 were also adopted for subsequent processing. Of the 262 available tiles, a subset of 112 tiles covering an area of 24.1 square miles was identified for further analysis. The discarded tiles included terrain on Newport Mesa and in San Joaquin Hills where coastal flooding is not a threat. Figure 1.2 shows 1 ft aerial imagery of the selected tiles. 2.2 Data Processing LiDAR survey data obtained in this study consisted of point clouds corresponding to remotely sensed samples of the land surface height. In addition, the provided data had been processed by Merrick to include only ground elevation points. Hence, points corresponding to non-terrain features including tree tops and building roof tops were not included. The dataset included over 10 million points. Whereas the LiDAR sensor adopted by Merrick passed over Newport Bay, it has no capability to penetrate water and measure the underlying ground height. The LiDAR point cloud therefore includes many points that correspond to water heights which must be removed for flooding analysis. In addition, the obtained bathymetric datasets provide a number of points that correspond to bottom elevation of the bay and coastal ocean that can be combined with the topography. A strategy was to filter and merge these topographic and bathymetric datasets was devised and applied. Topographic and upper and lower bay bathymetric data were loaded into ArcGIS (ESRI, Redlands, Calif.) in a point format to facilitate data filtering and merging. First, to eliminate LiDAR points over water a proximity search was performed whereby all LiDAR points overlapping bathymetric points were identified and removed. Second, LiDAR points were manually removed from areas corresponding to shallow water where bathymetric data were sparse or completely absent. Third, in a few areas where no bathymetric data was available (e.g., Newport Island Channels), LiDAR points over water were manually selected and the elevation was set to the nearest available bathymetric reading. To include offshore bathymetry in the Harbor terrain dataset, data from the National Ocean Service (NOS) three second coastal bathymetry model were obtained and converted using ArcGIS (ESRI, Redlands, Calif.) from geodetic coordinates to NAD 1983 California State Plane Zone VI (feet) projection. These data points are spaced roughly 300 ft apart, relatively coarse in comparison to the LiDAR data. NOS data
Draft

6
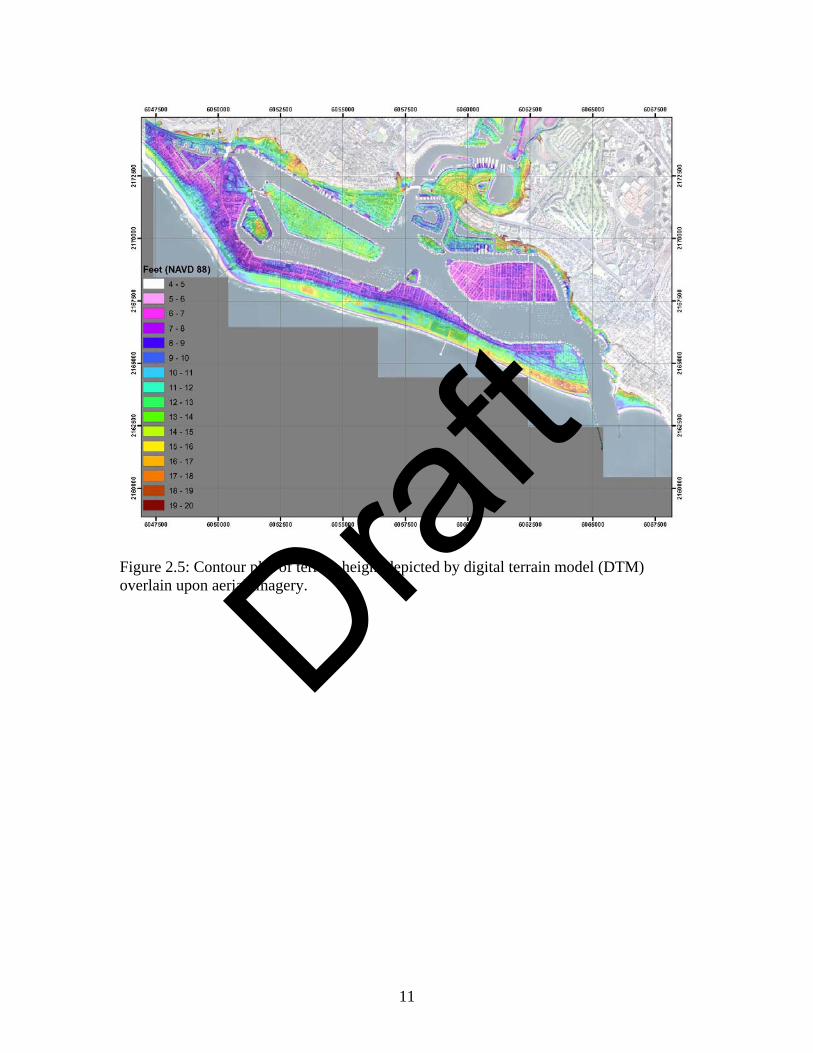
heights were specified relative to Mean Lower-Low Water (MLLW) which differs from the NAVD 1988 datum used for the overland LiDAR survey by 0.18 feet. Given that these data correspond to offshore depths that are not essential for flooding analysis, this difference was considered to be insignificant and therefore ignored. Along the offshore perimeter of Balboa Peninsula and around the harbor mouth, a number of LiDAR points were located in areas corresponding to water and these were identified based on aerial imagery and removed manually to preference the NOS data. Once the four datasets were filtered and synthesized into a single point file, a 10 ft digital terrain model (DTM) was created using an inverse distance interpolation (IDW) scheme that utilizes eight neighboring points. The DTM provides continuous description of terrain elevations from -1,245 feet to 594 ft and will be used in modeling studies presented in Chapter 5 to parameterize ground elevation in a mesh used for flow simulation. The DTM that results from synthesizing the available topographic and bathymetric data is illustrated as a hill shade plot in Figure 2.3 and a contour plot in Figure 2.4. Figure 2.5 shows a contour plot of terrain elevation in the vicinity of lower bay where land elevations are closest to sea level. 2.3 DTM Accuracy Horizontal accuracies of the original LiDAR and bathymetric RMSEs are stated to better than 0.5 feet and no significant loss of accuracy resulted from re-projection of the bathymetry data, so an RMSE of 0.5 ft applies to the DTM as well. Vertical RMSEs differ across the modeling domain as LiDAR and bathymetry sensors feature unequal accuracies. LiDAR elevations were collected to conform to NSSDA requirements of better than 0.6 feet, while bathymetry sensors usually capture depth at accuracies between 0.1-0.3 feet. However, sedimentation is a notorious problem in Newport Bay and dredging has taken place since the time of the last bathymetric data, so measurement precision of the bathymetric sensor is not a good indicator of the DTM vertical accuracy. Based on professional judgment, we suspect the vertical accuracy of bathymetric data may be as poor as 3 ft in upper bay and closer to 1 ft in lower bay. To evaluate DTM accuracy over land, a comparison was made to the original point data and a RMSE of 0.7 ft was measured. Therefore, based on the RMSE of the measurement and resampling errors we estimate the vertical accuracy of the DTM to be 0.9 ft over land.
Draft

7
Upper Bay Bathymetry
Lower Bay Bathymetry
LiDAR
Offshore Bathymetry
6042407 6047407 6052407 6057407 6062407 6067407 6072407 6077407
2151
445
2156
445
2161
445
2166
445
2171
445
2176
445
2181
445
2186
445
2191
445
/
5,000 0 5,000 10,0002,500 Feet
Upper Bay Bathymetry
Lower Bay Bathymetry
Offshore Bathymetry
LiDAR Figure 2.1: Coverage of data sources that were merged to create a Digital Terrain Model (DTM) of the Newport Harbor area.
Draft

8
B
C
D
E
F
G
H
I
J
K
L
M
N
O
P
Q
R
S
T
U
V
W
2 3 4 5 6 7 8 9 10 12 13 14 15 16
B
C
D
E
F
G
H
I
J
K
L
M
N
O
P
Q
R
S
T
U
V
W2 3 4 5 6 7 8 9 10 12 13 14 15 16
-
6,000 0 6,000 12,0003,000 Feet
Figure 2.2: Tiles corresponding to imagery and LiDAR data selected for inclusion in Digital Terrain Model (DTM)
Draft

9
6038402 6043402 6048402 6053402 6058402 6063402 6068402 6073402 6078402
2148
445
2153
445
2158
445
2163
445
2168
445
2173
445
2178
445
2183
445
2188
445 /
5,000 0 5,000 10,0002,500 Feet
Feet (NAVD 88)597.3
-1245.1
Figure 2.3: Hill shade plot of digital terrain model (DTM). Draf
t

10
6038402 6043402 6048402 6053402 6058402 6063402 6068402 6073402 6078402
2148
445
2153
445
2158
445
2163
445
2168
445
2173
445
2178
445
2183
445
2188
445 /
5,000 0 5,000 10,0002,500 Feet
Feet (NAVD 88)-1,245 - -500
-500 - -100
-100 - -10
-10 - 0
0 - 3
3 - 6
6 - 9
9 - 12
12 - 15
15 - 18
18 - 20
20 - 25
25 - 30
30 - 40
40 - 50
50 - 600
Figure 2.4: Contour plot of terrain height depicted by digital terrain model (DTM).
Draft
11
Figure 2.5: Contour plot of terrain height depicted by digital terrain model (DTM) overlain upon aerial imagery. Draf
t

12
Chapter 3: Review of Historical Tides and Development of Design Tides This chapter begins by reviewing historical tides to elucidate the salient features that bear on coastal flooding risk. This includes the seasonal and inter-annual variability of the high tides due to astronomical factors as well as anomalies associated with ENSO events and winter storms which we will call Non-Tidal Residuals (NTRs). We also look to the future to identify those years when extreme tides are expected to be maximum according to astronomical factors, and we consider trends in sea level rise. Finally, the range of tides heights that could result from the combined effects of high astronomical tides, NTRs and sea level rise are identified and used to identify a set of tide scenarios for flood inundation modeling. The results of subsequent model simulations are expected to provide insight into the vulnerability of the Newport Harbor area to flooding and likely patterns of inundation. An important caveat to note is that the modeling aspect of this study is focused on extreme tides which are most important relative to flooding of Newport Harbor; we are not considering ocean waves in our modeling which could contribute to flooding via overtopping of the beach dunes and temporary sand berms along the open coast. This is outside the scope of the present study but should be considered in a future study. 3.1 Data Sources To review historical tides, tide height data were obtained from the NOAA Center for Operational Oceanographic Products and Services (CO-OPS) “Tides and Currents” website, http://co-ops.nos.noaa.gov/ (Data accessed April, 2008). Year-long records of hourly tide predictions and measurements for Station ID: 9410660 (Los Angeles) were accessed for 1982-2007. In addition, year-long records of hourly tide predictions were accessed for 2008-2020. All tide heights were saved in units of feet relative to Mean Lower Low Water (MLLW) and relative to Greenwich Mean Time (GMT). Los Angeles was chosen because it is the nearest NOAA tide station with tide measurement data. A review of benchmark data for Los Angeles versus Newport Harbor shows that tide heights typically differ by less than an inch. For example, NOAA benchmark data reports that the mean tide range at Newport Harbor is 3.76 ft versus 3.81 ft at Los Angeles, a difference of 0.05 ft or 0.6 inches. In order to examine sea level heights in relation to climatic conditions of the Pacific Ocean, the monthly Oceanic Nino Index (ONI) was obtained for the period 1950-2007 from the NOAA, National Weather Service (NWS) Climate Prediction Center http://www.cpc.noaa.gov/index.php (Data Accessed April, 2008). The ONI represents the sea surface temperature anomaly (oC) for the equatorial Pacific region defined by 5o N-5o
S and 120o-170o W, averaged over a three month period. El Nino (warm) and La Nina (cool) events are defined by 5 consecutive months above +0.5 oC or below -0.5 oC, respectively. Sea level rise projections associated with global climate change were also reviewed. For example, an Intergovernmental Panel on Climate Change (IPCC) 2007 report calls for a
Draft

13
global mean sea level rise of 0.6 to 1.9 ft by 2100 (IPCC 2007), a USEPA report suggests there is a 10% chance sea level will rise 2.9 ft by 2100, and a California Coastal Commission report suggests that 3 ft of sea level rise is “very likely” by 2100. The California Coastal Commission report cites the USEPA study in arriving at the 3 ft figure, so it appears that “very likely” implies a 10% chance. A more recent study based on satellite observations indicates that, globally, sea levels are rising at a rate of approximately 0.01 ft per year (Colorado Center for Astrodynamics Research, http://sealevel.colorado.edu/). Were this rate extrapolated to 2100, the increase in sea level would be approximately 1 ft. However, climate models indicate that this rate is likely to increase over time, pointing to a higher cumulative rise by 2100 (IPCC 2007). In addition, sea level will not rise uniformly over the earth so the rate in Newport Beach could be higher or lower. Furthermore, these numbers do not reflect the considerable uncertainty in future sea levels related to the stability of the Greenland and West Antarctic ice sheets. There is enough water in the Greenland ice sheet to raise mean sea level 23 ft, and the West Antarctic ice sheet could raise sea levels by 17-20 ft. However, there is no consensus regarding the time scale over which these ice caps could melt. The preceding information points to considerable uncertainty in the magnitude of sea level rise, but a clear indication that a rise in the range of 1-3 ft by 2100 is likely. 3.2 Data Analysis Methods Hourly Non-Tide Residuals (NTRs) were computed for years 1982-2007 by subtracting the predicted tide height from the measured tide height. Positive NTR corresponds to higher tides than predicted and negative NTR correspond to lower tides than predicted. To characterize the magnitude and frequency of historical NTRs during the winter season when maximum astronomical tides occur, hourly NTRs for the months of December, January and February were compiled for each year between 1982/83 and 2006/07 and rank ordered. From this ranking the 98th percentile NTRs were extracted; this corresponds to a 2% exceedance probability. To examine possible linkages between NTRs and climatic conditions (e.g., El Nino), annual NTR were plotted versus ONI for January of each year and analyzed for trends. Lastly, hourly tide forecasts for the years 2000-2020 were reviewed to identify future instances of extreme high tides according to astronomical factors alone. Maximum monthly tide heights were tabulated to help readily identify the years and months with the highest expected tides, and a plot of monthly maximum tide heights was prepared. 3.3 Results Appendix I shows plots of measured hourly tides (top panels) and NTR (bottom panels) during January, February and December of each year from 1982 to 2007 (26 years). A review of the measured tides shows that the highest tide on record nearly reached the 8 ft mark (relative to MLLW) on January 28, 1983, and a tide of nearly the same magnitude occurred on January 10, 2005.
Draft

14
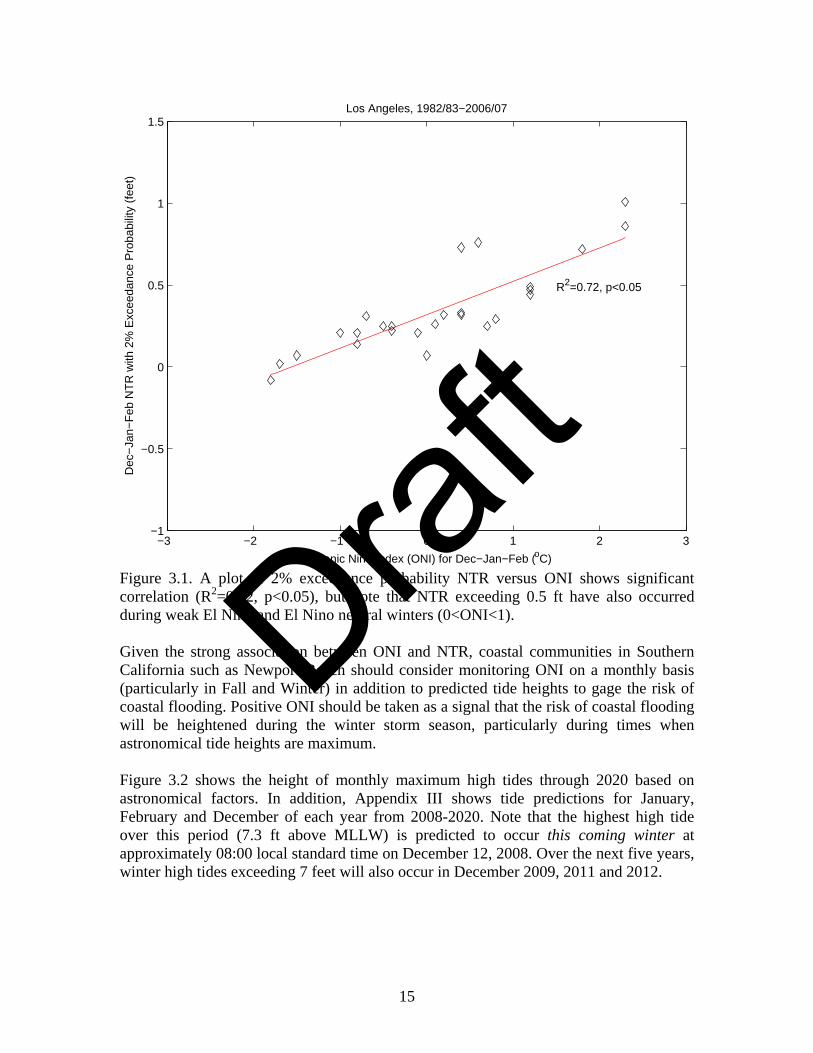
Widespread flooding and storm damage occurred all along the California coastline as a consequence of the 1983 event (Zetler and Flick 1985). Reports of widespread flooding along Balboa Peninsula appeared in the Orange County Register. The 2005 event appeared to have far less state-wide impact, probably because of less wind and wave energy. A prominent spike in NTR lasting several hours and coincident with the 1983 event (Appendix I) reflects the strength of storm conditions; the spike is relatively small in the case of the 2005 event. However, City staff photo-documented flooding at several sites on Balboa Peninsula and Balboa Island in 2005. Hence, it is clear that a tide of 7.8 ft (MLLW) or higher causes considerable flooding. Further inspection of the NTR time series from December of 1982 through February of 1983 (Appendix I) shows that sea levels can rise 0.5 ft or more above predicted tides and persist for a week or more at a time, even reaching heights over 1.0 ft above predicted tides. In January and February of 1992, and December of 1997 through February of 1998, elevated NTR are observed and these episodes all correspond to strong El Nino conditions. There are also many instances of NTR greater than 0.5 ft lasting less than a week and as short as a few hours. For example, in February 2002 an NTR of nearly 1 ft lasted only about a day. Appendix II shows the NTR probability distribution for each winter season based on the rank-ordering of hourly NTR levels over three months (Dec-Jan-Feb). A review of these plots shows that in many years NTR is less than 0.5 ft 100% of the time, but in other years NTR values exceed 1.0 ft. For example, during the strong El Nino winter of 1982-83, NTR exceeded 1 ft roughly 1% of the time and exceeded 0.5 ft about 30% of the time. Large NTR values also occurred during the 1997-98 winter; NTR exceeded 1.0 ft 3% of the time and exceeded 0.5 ft about 40% of the time. To further explore the association between NTR and strong El Nino conditions, the 98th percentile NTR for each winter (2% exceedance probability) was plotted versus ONI as shown in Figure 3.1 and a positive correlation was identified (R2=0.72, p<0.05). The implication for coastal flooding is not only that the probability of coastal flooding, or flood risk, varies from year to year depending on climatic conditions in addition to astronomical factors (Zetler and Flick 1985, Flick 1986), but that the stronger the El Nino the greater the coastal flood risk. There are important exceptions to this trend, however. Figure 3.1 shows two instances where NTR exceeded 0.5 ft even though ONI values were between 0 and 1 oC corresponding to El Nino neutral or weak El Nino conditions. On the other hand, Figure 3.1 also shows that 2% exceedance probability NTR values never exceeded 0.5 ft when ONI values were less than zero (i.e., during La Nina conditions). This suggests that coastal flood risk is minimized during La Nina conditions.
Draft
15
−3 −2 −1 0 1 2 3−1
−0.5
0
0.5
1
1.5
Oceanic Nino Index (ONI) for Dec−Jan−Feb (oC)
Dec
−Ja
n−F
eb N
TR
with
2%
Exc
eeda
nce
Pro
babi
lity
(fee
t)
R2=0.72, p<0.05
Los Angeles, 1982/83−2006/07
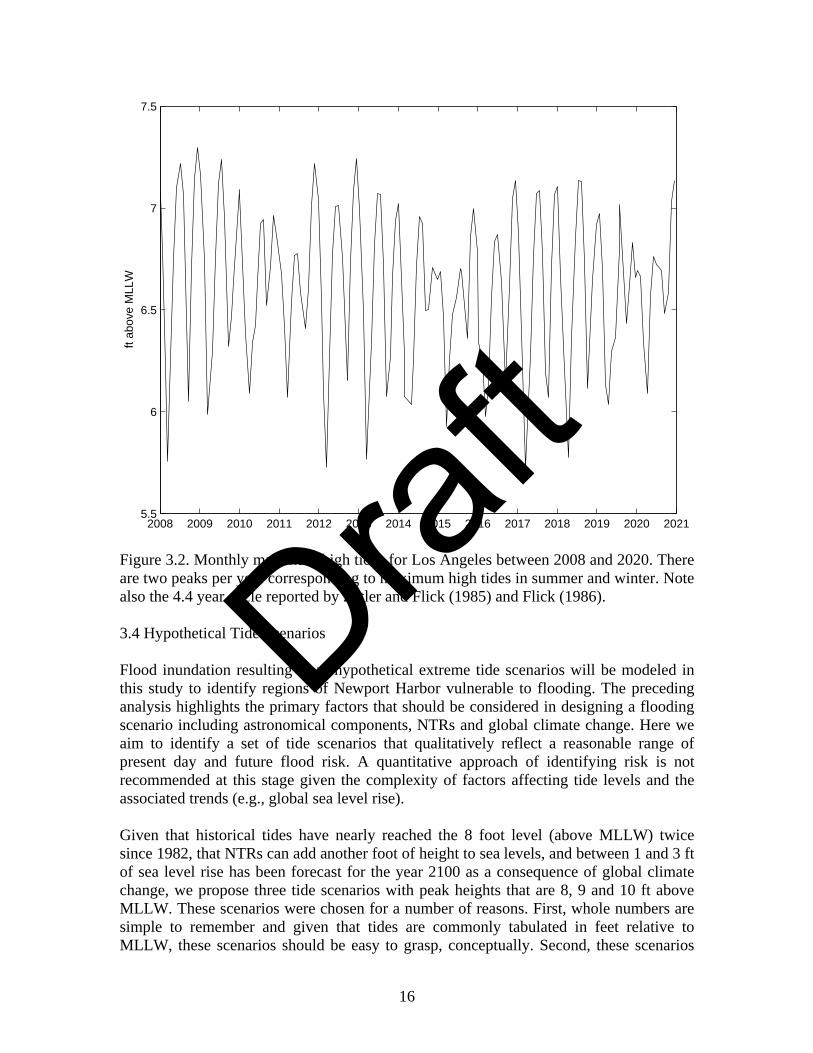
Figure 3.1. A plot of 2% exceedance probability NTR versus ONI shows significant correlation (R2=0.72, p<0.05), but note that NTR exceeding 0.5 ft have also occurred during weak El Nino and El Nino neutral winters (0<ONI<1). Given the strong association between ONI and NTR, coastal communities in Southern California such as Newport Beach should consider monitoring ONI on a monthly basis (particularly in Fall and Winter) in addition to predicted tide heights to gage the risk of coastal flooding. Positive ONI should be taken as a signal that the risk of coastal flooding will be heightened during the winter storm season, particularly during times when astronomical tide heights are maximum. Figure 3.2 shows the height of monthly maximum high tides through 2020 based on astronomical factors. In addition, Appendix III shows tide predictions for January, February and December of each year from 2008-2020. Note that the highest high tide over this period (7.3 ft above MLLW) is predicted to occur this coming winter at approximately 08:00 local standard time on December 12, 2008. Over the next five years, winter high tides exceeding 7 feet will also occur in December 2009, 2011 and 2012.
Draft
16
2008 2009 2010 2011 2012 2013 2014 2015 2016 2017 2018 2019 2020 20215.5
6
6.5
7
7.5
ft ab
ove
MLL
W
Figure 3.2. Monthly maximum high tides for Los Angeles between 2008 and 2020. There are two peaks per year corresponding to maximum high tides in summer and winter. Note also the 4.4 year cycle reported by Zetler and Flick (1985) and Flick (1986). 3.4 Hypothetical Tide Scenarios Flood inundation resulting from hypothetical extreme tide scenarios will be modeled in this study to identify regions of Newport Harbor vulnerable to flooding. The preceding analysis highlights the primary factors that should be considered in designing a flooding scenario including astronomical components, NTRs and global climate change. Here we aim to identify a set of tide scenarios that qualitatively reflect a reasonable range of present day and future flood risk. A quantitative approach of identifying risk is not recommended at this stage given the complexity of factors affecting tide levels and the associated trends (e.g., global sea level rise). Given that historical tides have nearly reached the 8 foot level (above MLLW) twice since 1982, that NTRs can add another foot of height to sea levels, and between 1 and 3 ft of sea level rise has been forecast for the year 2100 as a consequence of global climate change, we propose three tide scenarios with peak heights that are 8, 9 and 10 ft above MLLW. These scenarios were chosen for a number of reasons. First, whole numbers are simple to remember and given that tides are commonly tabulated in feet relative to MLLW, these scenarios should be easy to grasp, conceptually. Second, these scenarios
Draft
17
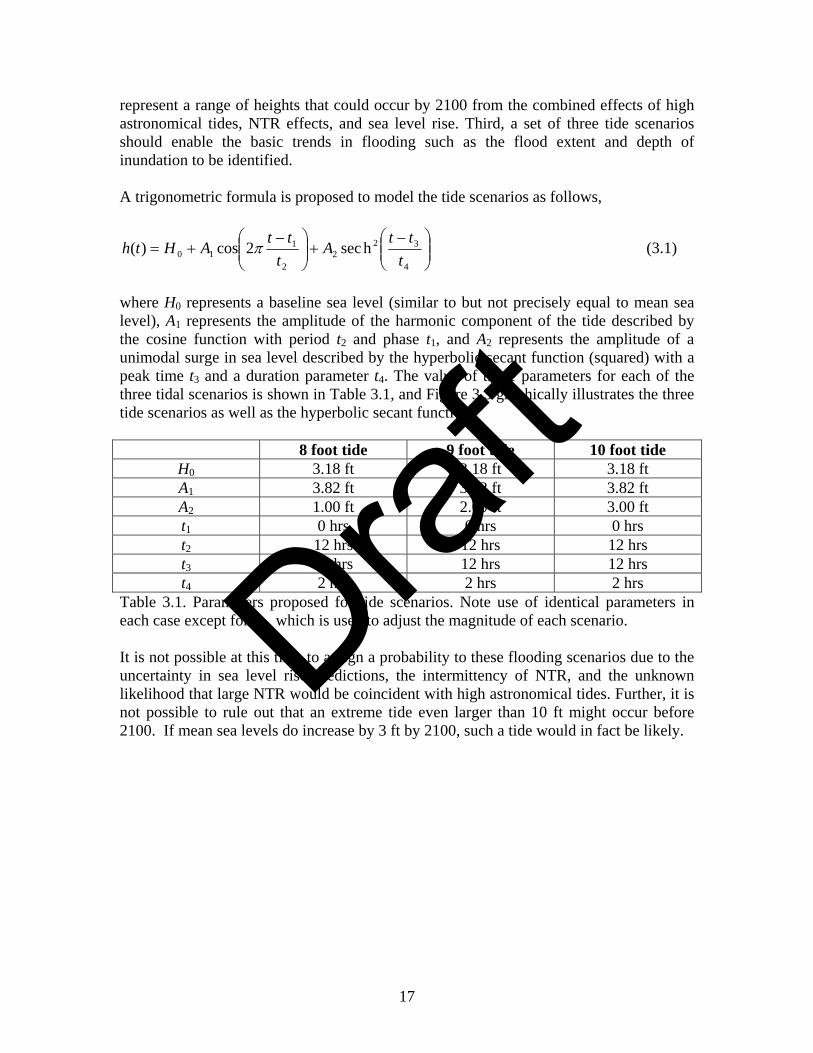
represent a range of heights that could occur by 2100 from the combined effects of high astronomical tides, NTR effects, and sea level rise. Third, a set of three tide scenarios should enable the basic trends in flooding such as the flood extent and depth of inundation to be identified. A trigonometric formula is proposed to model the tide scenarios as follows,
⎟⎟⎠
⎞⎜⎜⎝
⎛ −+⎟⎟
⎠
⎞⎜⎜⎝
⎛ −+=
4
322
2
110 hsec2cos)(
ttt
At
ttAHth π (3.1)
where H0 represents a baseline sea level (similar to but not precisely equal to mean sea level), A1 represents the amplitude of the harmonic component of the tide described by the cosine function with period t2 and phase t1, and A2 represents the amplitude of a unimodal surge in sea level described by the hyperbolic secant function (squared) with a peak time t3 and a duration parameter t4. The value of these parameters for each of the three tidal scenarios is shown in Table 3.1, and Figure 3.3 graphically illustrates the three tide scenarios as well as the hyperbolic secant function. 8 foot tide 9 foot tide 10 foot tide
H0 3.18 ft 3.18 ft 3.18 ft A1 3.82 ft 3.82 ft 3.82 ft A2 1.00 ft 2.00 ft 3.00 ft t1 0 hrs 0 hrs 0 hrs t2 12 hrs 12 hrs 12 hrs t3 12 hrs 12 hrs 12 hrs t4 2 hrs 2 hrs 2 hrs
Table 3.1. Parameters proposed for tide scenarios. Note use of identical parameters in each case except for A2, which is used to adjust the magnitude of each scenario. It is not possible at this time to assign a probability to these flooding scenarios due to the uncertainty in sea level rise predictions, the intermittency of NTR, and the unknown likelihood that large NTR would be coincident with high astronomical tides. Further, it is not possible to rule out that an extreme tide even larger than 10 ft might occur before 2100. If mean sea levels do increase by 3 ft by 2100, such a tide would in fact be likely.
Draft

18
0 3 6 9 12 15 18 21 24
0
2
4
6
8
10
12
t (hrs)
heig
ht (
ft ab
ove
MLL
W)
8 ft9 ft10 ft
0 3 6 9 12 15 18 21 24
0
0.2
0.4
0.6
0.8
1
t (hrs)
heig
ht (
ft)
sech2((t−12)/2)
Figure 3.3. Top panel shows tide scenarios recommended for flooding analysis including 8 ft, 9 ft, and 10 ft cases. Bottom panel shows the hyperbolic secant function used to scale the magnitude of the tide. Draf
t

19
Chapter 4: Review of Tidal Flood Control Infrastructure This chapter provides an overview of infrastructure and operating practices that are presently in use to protect the harbor area from flooding by extreme high tides. Further, based on a combination of limited first-hand observations, analysis of aerial imagery and Light Detection and Ranging (LiDAR) topographic data, and information supplied City staff, we report on the potential for this infrastructure to provide protection from future extreme tides. The first three sections of this chapter describe observational data in the order it was collected. Section 4.1 describes observations from a first survey of bulk heads, Section 4.2 describes observations during a ride-along with Mr. Thomas Miller of the City’s General Services Department, who closed tide valves in anticipation of an extreme high tide. Section 4.3 describes observations from a second survey of bulk heads, those around Balboa and Little Balboa islands. 4.1 First Survey of Bulk Heads The digital terrain model (DTM) presented in Chapter 2 (Figs. 2.3-2.5) depicts ground heights in and around Newport Harbor. Many regions fall below the height of extreme high tides, but these do not necessarily flood because elevated bulk heads or sea walls are in place to provide protection. On March 25, 2008, Dr. Sanders visited the site to become familiar with site conditions and estimate the elevation of several bulk heads above a reference datum (NAVD 88). This information was collected to characterize the threshold of tidal flooding (i.e., overtopping) which is required for accurate flood modeling. A few sites without sea walls were also observed, in which case the ground height represents the threshold for flooding. Note that the efforts described here do not represent a comprehensive, high-precision survey of bulk heads. This would require a qualified surveyor which was not part of this study design. The efforts described here provide a representative sample of bulk head heights with a vertical accuracy of approximately 0.6 ft, which is reasonable for the purpose of this study which is to identify the flood vulnerable areas of the harbor related to extreme high tides. To guide the first bulk head survey, the DTM shown in Fig. 4.1 was manually inspected to identify the lowest regions of developed land around the bay. Recognizing that annual maximum high tides typically reach about 7 ft (MLLW) or 6.8 ft (NAVD 88), Fig. 4.1 shows that there are essentially two built areas vulnerable to flooding by present-day tides. The first is Balboa and Little Balboa Islands, particularly the western half of Balboa Island. The second is the bay side of Balboa Peninsula, along nearly its full length, including the region surrounding Newport Island Channels and the western side of the Rhine Channel. Consequently, bulk heads in both of these areas were examined.
Draft

20
Figure 4.1. Contours of ground elevation in the Newport Harbor area depicted by a DTM based on a 2006 LiDAR survey, and location of tide valves that prevent back-flooding through storm sewers. Note that annual maximum high tides typically exceed 7 ft but fall short of 8 ft relative to NAVD 88. Heights between 6 and 7 ft appear pink.
Figure 4.2. The elevation of sea walls was estimated at selected locations by adding measurements of wall height (left) to LiDAR-based estimates of ground elevation (right) which appear as green dots.
Draft

21
The height of elevated bulk heads or sea walls was measured with a tape-measure, as shown in Fig. 4.2, and added to LiDAR-based estimates of ground elevation to obtain the bulk head elevation. LiDAR point measurements of ground elevation, which appear as green dots in the image on the right in Fig. 4.2, were used to indicate the ground elevation. In each case, the nearest available LiDAR survey point representative of the surface next to the bulk head (e.g., sidewalk) was used. Recall the vertical accuracy of LiDAR point measurements is less than 0.6 ft, and we estimate the vertical accuracy of the tape measurement to be less than 0.1 ft, so we estimate the vertical accuracy of bulk head heights to be less than 0.6 ft. At some of the examined sites, the bulk head was not elevated as in a wall so the height is based on LiDAR point measurements only. Fig. 4.3 shows sites around the harbor where the preceding method was applied, and results are shown in Table 4.1. Note that elevations are listed relative to NAVD 88 and MLLW.
Figure 4.3. Sites where the elevation of sea defenses was estimated by adding wall heights to LiDAR estimates of ground height, as shown in Fig. 4.2. These data suggest that overtopping of bulk heads can occur with tides as small as 7.0 ft (MLLW). This corresponds to the Balboa Island Ferry ramp on Balboa Island. Further, these data indicate heights for Balboa Island bulk head of 7.3, 8.4 and 8.5 ft and a height of 9.2 ft for the Little Balboa Island bulk head. Around Newport Island channels, heights ranging from 7.8 to 9.1 ft (MLLW) were estimated, along the Rhine channel a height of
Draft
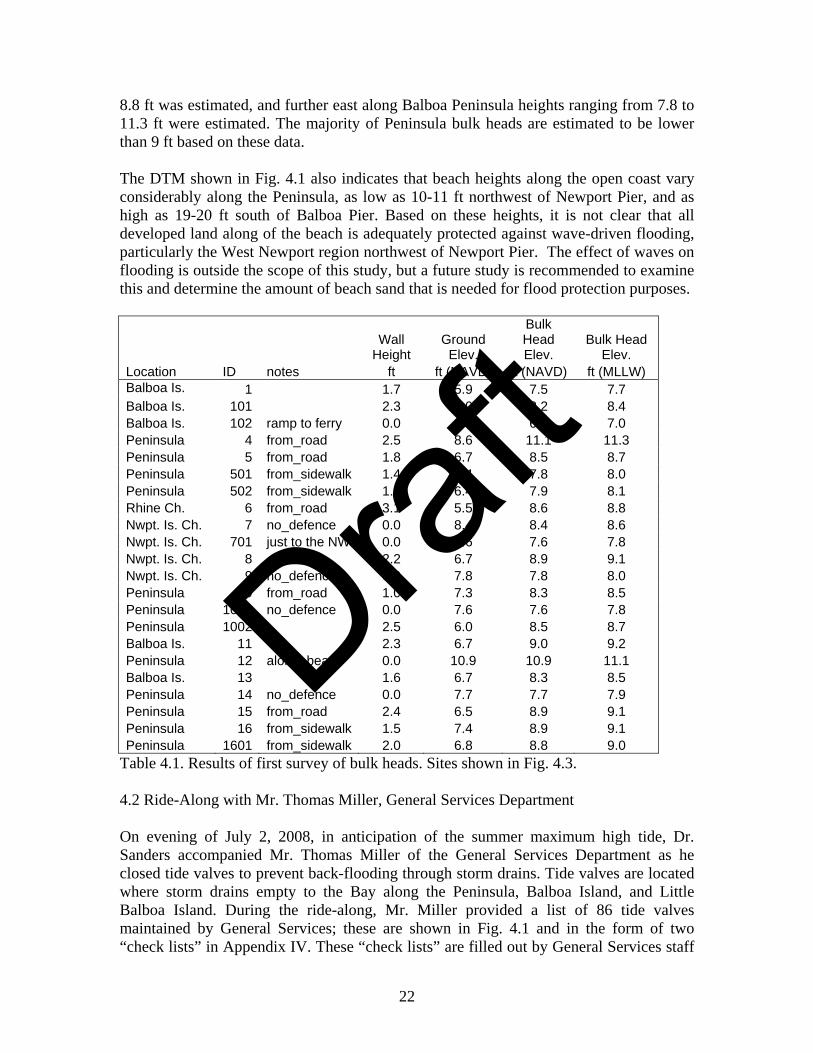
22
8.8 ft was estimated, and further east along Balboa Peninsula heights ranging from 7.8 to 11.3 ft were estimated. The majority of Peninsula bulk heads are estimated to be lower than 9 ft based on these data. The DTM shown in Fig. 4.1 also indicates that beach heights along the open coast vary considerably along the Peninsula, as low as 10-11 ft northwest of Newport Pier, and as high as 19-20 ft south of Balboa Pier. Based on these heights, it is not clear that all developed land along of the beach is adequately protected against wave-driven flooding, particularly the West Newport region northwest of Newport Pier. The effect of waves on flooding is outside the scope of this study, but a future study is recommended to examine this and determine the amount of beach sand that is needed for flood protection purposes.
Wall
Height Ground
Elev.
Bulk Head Elev.
Bulk Head Elev.
Location ID notes ft ft (NAVD) ft (NAVD) ft (MLLW) Balboa Is. 1 1.7 5.9 7.5 7.7 Balboa Is. 101 2.3 6.0 8.2 8.4 Balboa Is. 102 ramp to ferry 0.0 6.8 6.8 7.0 Peninsula 4 from_road 2.5 8.6 11.1 11.3 Peninsula 5 from_road 1.8 6.7 8.5 8.7 Peninsula 501 from_sidewalk 1.4 6.4 7.8 8.0 Peninsula 502 from_sidewalk 1.5 6.4 7.9 8.1 Rhine Ch. 6 from_road 3.1 5.5 8.6 8.8 Nwpt. Is. Ch. 7 no_defence 0.0 8.4 8.4 8.6 Nwpt. Is. Ch. 701 just to the NW 0.0 7.6 7.6 7.8 Nwpt. Is. Ch. 8 2.2 6.7 8.9 9.1 Nwpt. Is. Ch. 9 no_defence 0.0 7.8 7.8 8.0 Peninsula 10 from_road 1.0 7.3 8.3 8.5 Peninsula 1001 no_defence 0.0 7.6 7.6 7.8 Peninsula 1002 2.5 6.0 8.5 8.7 Balboa Is. 11 2.3 6.7 9.0 9.2 Peninsula 12 along_beach 0.0 10.9 10.9 11.1 Balboa Is. 13 1.6 6.7 8.3 8.5 Peninsula 14 no_defence 0.0 7.7 7.7 7.9 Peninsula 15 from_road 2.4 6.5 8.9 9.1 Peninsula 16 from_sidewalk 1.5 7.4 8.9 9.1 Peninsula 1601 from_sidewalk 2.0 6.8 8.8 9.0
Table 4.1. Results of first survey of bulk heads. Sites shown in Fig. 4.3. 4.2 Ride-Along with Mr. Thomas Miller, General Services Department On evening of July 2, 2008, in anticipation of the summer maximum high tide, Dr. Sanders accompanied Mr. Thomas Miller of the General Services Department as he closed tide valves to prevent back-flooding through storm drains. Tide valves are located where storm drains empty to the Bay along the Peninsula, Balboa Island, and Little Balboa Island. During the ride-along, Mr. Miller provided a list of 86 tide valves maintained by General Services; these are shown in Fig. 4.1 and in the form of two “check lists” in Appendix IV. These “check lists” are filled out by General Services staff
Draft

23
as tide valves are closed and opened. The vast majority of tide valves are manually closed prior to extreme high tide conditions, and opened subsequent to high tide conditions, as shown in Fig. 4.4. A very small minority of the tide valves are opened and closed with electronic, motorized valves. There is also one example where a plug is used instead of a valve. Mr. Miller noted that plugs were also used at many privately owned properties to prevent tidal flooding. He reported that several instances of flooding occurred the previous night because plugs on private property were not inserted. Mr. Miller also reported that low bulkheads along private property contributed to tidal flooding, and he noted several sites along the peninsula that were problematic. Most of these sites are utilized as boat yards (i.e., dry dock facilities). Mr. Miller subsequently prepared a list of “High Tide Problem Areas” associated with privately owned lots that contribute to flooding. The location of these is shown in Fig. 4.5.
Figure 4.4. General Services staff is responsible for closing 86 tide valves such as this one that prevent bay water from back-flooding the Harbor area during high tides. Once the tide has receded, the tide valve is opened again to permit drainage. During the second site visit, Mr. Miller also exhibited several types of flood control facilities utilized by General Services: Temporary sand berms which are constructed at low points along bay-side beaches, seasonal pumps which are set up for Winter, and mobile pumps which can be deployed from pick-up trucks at various locations. The location of three temporary sand berms observed by Dr. Sanders are shown in Fig. 4.5, and each of these was observed to be between 18 and 24 inches tall. Mobile pumps were
Draft

24
deployed on Finley Ave. near 36th St., and Newport Blvd at 26th St. Mr. Miller also indicated two additional locations where seasonal pumps were set up during Winter: 30th St. near Lafayette, and River Ave at Channel Place. During the second site visit, mobile pumps were also set up on Balboa Island but these were not observed by Dr. Sanders. The ride-along was limited to Balboa Peninsula. Dr. Sanders observed several instances of tidal flooding over and through bulkheads during the ride-along. In some cases, flooding was clearly the result of water overtopping a low bulkhead, in other cases flooding resulted from water seeping through flood walls, and in other cases flooding occurred for reasons that are not clear (e.g., unknown leak in flood walls). The most severe case of flooding on the peninsula was observed on 26th Street at Newport Blvd., where back-flooding from a storm sewer caused one of the two northbound traffic lanes along Newport Blvd. to be flooded. The tide valve on the storm sewer at the east end of 26th St. was closed, but the bulkhead there was in poor condition and leaking. Overtopping of the bulk head of a neighboring boat yard was also observed, and this contributed to the observed flooding. Less significant flooding was also observed along Finley Ave. at 34th St., on Marcus Ave. at 38th St., at the East end of Channel Pl., on Bay Ave. at 10th St., along W. Edgewater Ave. between Island Ave. and Lindo Ave., along the Balboa Fun Zone, and at a marina along E. Bay Ave, just east of the Pavilion. The Balboa Pier parking lot was inspected for flooding which could result from the combination of high tides and waves, but none was observed. However, water marks indicated that wave run-up had come within 10 ft (approximately) of the parking lot shortly before our arrival. Further, radio conversations between Mr. Miller and another General Services staff member stationed on Balboa Island indicated that flooding had occurred there as well. Overtopping at the Ferry launch on Agate was reported, as well as flooding at other sites on the island due to a tide valve that would not close completely (it has since been replaced) and seepage through small cracks in the bulk head. NOAA tide observations at Los Angeles indicate that the tide reached a height of 7.5 ft (MLLW) on the evening of July 2, 2008, 0.3 ft above the predicted high tide level. Given the moderate amount of flooding that was observed on July 2, these observations indicate that the present-day threshold for flooding is between the 7.0 and 7.5 ft level (MLLW). In addition, overtopping of several bulkheads occurred at the 7.5 ft level notably the Balboa Island Ferry ramp and several sites along the peninsula. Leakage of sea defense infrastructure was also observed with water at the 7.5 ft level. At the beginning of the ride-along, Mr. Miller pointed to a tide stick near Marcus Ave. and 32nd St. that the city uses to indicate and record the height of tides. Further, Mr. Miller noted that heights indicated by the tide stick regularly exceed heights predicted in tide charts. This is likely explained by differences in datums, and the City is encouraged to survey this tide stick to record its height relative to NAVD 88 and MLLW.
Draft

25
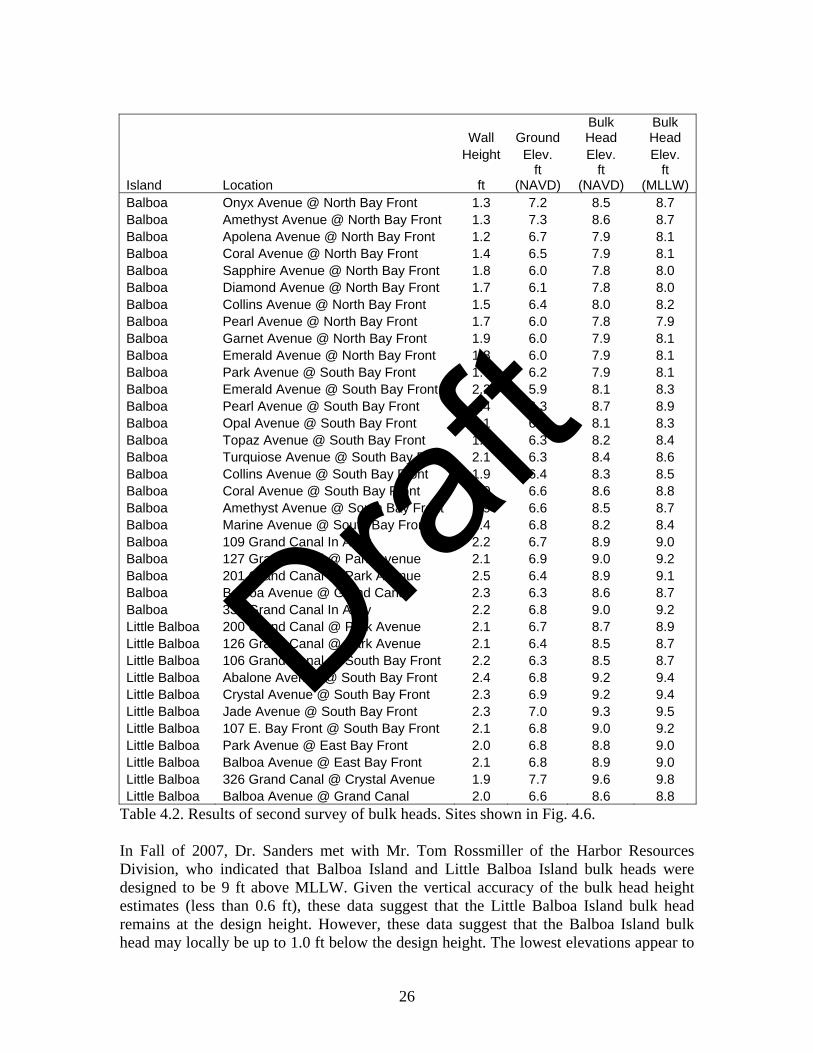
Figure 4.5. Map of Newport Harbor showing “Problem Areas” reported by City General Services staff, the location of temporary sand berms, and tide valves. 4.3 Second Survey of Bulk Heads A second survey of bulk head heights was completed on September 4, 2008 to improve the characterization of the Balboa Island and Little Balboa Island bulk heads for flood modeling purposes. As in the first survey, bulk head height was estimated by adding LiDAR-based ground elevation data to tape measurements of wall heights. Heights were estimated at each of the tide-valve locations listed in Appendix IV and shown in Fig. 4.1 (around Balboa and Little Balboa islands). The results of this second survey indicate that the Balboa Island sea wall varies in height between 7.9 and 9.2 ft (MLLW), and the little Balboa Island sea wall varies between 8.7 and 9.8 ft. Recall from the first survey that the ramp to the Balboa Island Ferry corresponds to 7.0 ft, and adjacent to the ramp the bulk head was estimated to be 7.7 ft (MLLW). Hence, the ferry ramp represents the lowest section of the bulk head around Balboa Island.
Draft
26
Wall Ground Bulk Head
Bulk Head
Height Elev. Elev. Elev.
Island Location ft ft
(NAVD)ft
(NAVD) ft
(MLLW)Balboa Onyx Avenue @ North Bay Front 1.3 7.2 8.5 8.7 Balboa Amethyst Avenue @ North Bay Front 1.3 7.3 8.6 8.7 Balboa Apolena Avenue @ North Bay Front 1.2 6.7 7.9 8.1 Balboa Coral Avenue @ North Bay Front 1.4 6.5 7.9 8.1 Balboa Sapphire Avenue @ North Bay Front 1.8 6.0 7.8 8.0 Balboa Diamond Avenue @ North Bay Front 1.7 6.1 7.8 8.0 Balboa Collins Avenue @ North Bay Front 1.5 6.4 8.0 8.2 Balboa Pearl Avenue @ North Bay Front 1.7 6.0 7.8 7.9 Balboa Garnet Avenue @ North Bay Front 1.9 6.0 7.9 8.1 Balboa Emerald Avenue @ North Bay Front 1.8 6.0 7.9 8.1 Balboa Park Avenue @ South Bay Front 1.7 6.2 7.9 8.1 Balboa Emerald Avenue @ South Bay Front 2.2 5.9 8.1 8.3 Balboa Pearl Avenue @ South Bay Front 2.4 6.3 8.7 8.9 Balboa Opal Avenue @ South Bay Front 2.1 6.0 8.1 8.3 Balboa Topaz Avenue @ South Bay Front 1.9 6.3 8.2 8.4 Balboa Turquiose Avenue @ South Bay Front 2.1 6.3 8.4 8.6 Balboa Collins Avenue @ South Bay Front 1.9 6.4 8.3 8.5 Balboa Coral Avenue @ South Bay Front 2.0 6.6 8.6 8.8 Balboa Amethyst Avenue @ South Bay Front 1.9 6.6 8.5 8.7 Balboa Marine Avenue @ South Bay Front 1.4 6.8 8.2 8.4 Balboa 109 Grand Canal In Alley 2.2 6.7 8.9 9.0 Balboa 127 Grand Canal @ Park Avenue 2.1 6.9 9.0 9.2 Balboa 201 Grand Canal @ Park Avenue 2.5 6.4 8.9 9.1 Balboa Balboa Avenue @ Grand Canal 2.3 6.3 8.6 8.7 Balboa 333 Grand Canal In Alley 2.2 6.8 9.0 9.2 Little Balboa 200 Grand Canal @ Park Avenue 2.1 6.7 8.7 8.9 Little Balboa 126 Grand Canal @ Park Avenue 2.1 6.4 8.5 8.7 Little Balboa 106 Grand Canal @ South Bay Front 2.2 6.3 8.5 8.7 Little Balboa Abalone Avenue @ South Bay Front 2.4 6.8 9.2 9.4 Little Balboa Crystal Avenue @ South Bay Front 2.3 6.9 9.2 9.4 Little Balboa Jade Avenue @ South Bay Front 2.3 7.0 9.3 9.5 Little Balboa 107 E. Bay Front @ South Bay Front 2.1 6.8 9.0 9.2 Little Balboa Park Avenue @ East Bay Front 2.0 6.8 8.8 9.0 Little Balboa Balboa Avenue @ East Bay Front 2.1 6.8 8.9 9.0 Little Balboa 326 Grand Canal @ Crystal Avenue 1.9 7.7 9.6 9.8 Little Balboa Balboa Avenue @ Grand Canal 2.0 6.6 8.6 8.8
Table 4.2. Results of second survey of bulk heads. Sites shown in Fig. 4.6. In Fall of 2007, Dr. Sanders met with Mr. Tom Rossmiller of the Harbor Resources Division, who indicated that Balboa Island and Little Balboa Island bulk heads were designed to be 9 ft above MLLW. Given the vertical accuracy of the bulk head height estimates (less than 0.6 ft), these data suggest that the Little Balboa Island bulk head remains at the design height. However, these data suggest that the Balboa Island bulk head may locally be up to 1.0 ft below the design height. The lowest elevations appear to
Draft
27
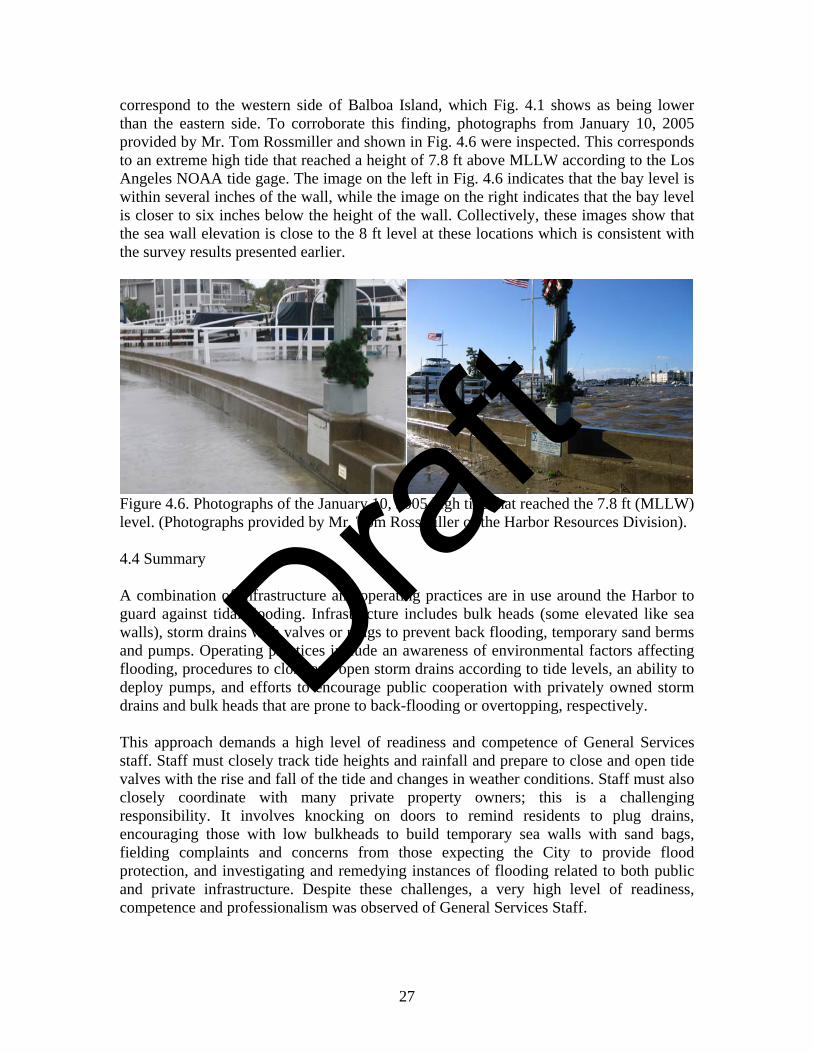
correspond to the western side of Balboa Island, which Fig. 4.1 shows as being lower than the eastern side. To corroborate this finding, photographs from January 10, 2005 provided by Mr. Tom Rossmiller and shown in Fig. 4.6 were inspected. This corresponds to an extreme high tide that reached a height of 7.8 ft above MLLW according to the Los Angeles NOAA tide gage. The image on the left in Fig. 4.6 indicates that the bay level is within several inches of the wall, while the image on the right indicates that the bay level is closer to six inches below the height of the wall. Collectively, these images show that the sea wall elevation is close to the 8 ft level at these locations which is consistent with the survey results presented earlier.
Figure 4.6. Photographs of the January 10, 2005 high tide that reached the 7.8 ft (MLLW) level. (Photographs provided by Mr. Tom Rossmiller of the Harbor Resources Division). 4.4 Summary A combination of infrastructure and operating practices are in use around the Harbor to guard against tidal flooding. Infrastructure includes bulk heads (some elevated like sea walls), storm drains with valves or plugs to prevent back flooding, temporary sand berms and pumps. Operating practices include an awareness of environmental factors affecting flooding, procedures to close and open storm drains according to tide levels, an ability to deploy pumps, and efforts to encourage public cooperation with privately owned storm drains and bulk heads that are prone to back-flooding or overtopping, respectively. This approach demands a high level of readiness and competence of General Services staff. Staff must closely track tide heights and rainfall and prepare to close and open tide valves with the rise and fall of the tide and changes in weather conditions. Staff must also closely coordinate with many private property owners; this is a challenging responsibility. It involves knocking on doors to remind residents to plug drains, encouraging those with low bulkheads to build temporary sea walls with sand bags, fielding complaints and concerns from those expecting the City to provide flood protection, and investigating and remedying instances of flooding related to both public and private infrastructure. Despite these challenges, a very high level of readiness, competence and professionalism was observed of General Services Staff.
Draft

28
When all flood control infrastructure is in place and operating procedures are active, the preceding observations and analysis suggests that the present-day threshold for flooding of Balboa Island is approximately 7.0 ft above MLLW based on overtopping of the Balboa Island Ferry ramp. On Little Balboa Island, the threshold for overtopping is 8.7 ft based on the minimum observed bulk head height but flooding may occur at lower levels due to seepage. On the peninsula, the threshold for flooding is somewhere between 7.0 and 7.5 ft. On July 2, 2008, flooding of the Peninsula commenced at roughly the 7.0 ft level because of a leaky bulkhead on 26th St.
Draft

29
Chapter 5: Modeling of Tidal Flooding Scenarios 5.1 Background A computer model, BreZo, developed by Dr. Sanders at UC Irvine was applied to simulate flooding caused by the combined effects of an extreme high tide and stream flow into Upper Newport Bay from San Diego Creek and Santa Ana Delhi Channel. The computer model solves 2D flow equations to predict the spatial and temporal distribution of water depth and horizontal velocity. The equations are solved in each of the approximately 250,000 cells that make up the computational mesh shown in Fig. 5.1. At the southern boundary of the model domain, far offshore of the harbor, the water level is specified using Eq. 3.1 to simulate the rise and fall of an extreme high tide. Concurrently, water is added to the domain at a point in Upper Newport Bay close to Jamboree Road to simulate the input of stream flow from San Diego Creek and Santa Ana Delhi Channel. Based on these two constraints, i.e., the water level offshore of the harbor and the stream flow into Upper Newport Bay, the computer model predicts the depth and velocity of water inside the bay. If and when water rises above bulk heads along the shoreline of the bay, the model resolves the flooding of water inland and the subsequent recession that ensues once the tide reaches its maximum height and begins to fall. BreZo is state-of-the-art, multi-dimensional flood inundation model. A comprehensively description can be found in a series of archival journal papers (Begnudelli and Sanders 2006, Begnudelli et al. 2008, Sanders 2008, Schubert et. al. 2008). Nevertheless, note that the model was applied to account for tidal and stream flow effects only. It was not configured to account for flooding caused by waves or precipitation. 5.2 Computational Mesh The computational mesh used by BreZo, shown in Fig. 5.1, requires that ground elevation be assigned to each of the mesh vertices and a flow resistance parameter be assigned to each of the cells in the mesh. For this study, NAD 1983 California State Plane Zone VI (feet) was adopted for horizontal control and NAVD 1988 was adopted for vertical control. This made it straightforward to use the DTM presented in Chapter 2 to assign an elevation to each of the vertices. However, the DTM does not necessarily reflect the height of bulkheads (particularly sea walls) because these are relatively thin, linear features that cannot be detected by the airborne laser sensor. To accurately depict sea walls, the strategy adopted in this study was to align edges of the mesh with each wall (x and y coordinate) and to assign vertex elevations (z coordinate) consistent with bulkhead heights reported in Chapter 4. The model also accounts for flow resistance (or friction) using a parameter known as the Manning coefficient which was set to n=0.025 m-1/3s. This value was selected based on previous modeling studies of Newport Bay. A spatially variable mesh resolution was used in this study to focus computational resources on the areas most likely to be impacted by tidal flooding, as indicated by Fig. 5.1. The finest resolution (ca. 30 ft) was used for all islands and shoreline around lower bay, an intermediate resolution was used for the channels and open water areas of the bay
Draft

30
(ca. 80 ft), and the coarsest resolution (ca. 1000 ft) was used offshore. The meshes consist of approximately 250,000 computational cells.
Figure 5.1. Computational mesh used for flood inundation modeling. 5.3 Infrastructure Scenarios Two slightly different meshes were created to reflect: (a) the existing condition of bulk heads, and (b) the expected condition following a number of planned improvements described by City General Services staff in a spreadsheet provided to Dr. Sanders. These will be termed the “as-is” and “improved” conditions, respectively. 5.4 Tide and Stream Flow Scenarios Three tide scenarios were examined in this study corresponding to an 8, 9 and 10 ft tide. The rise and fall of the tide, which was specified offshore of the harbor at the southern boundary of the model domain shown in Fig. 5.1, was described using Eq. 3.1.
Draft
31
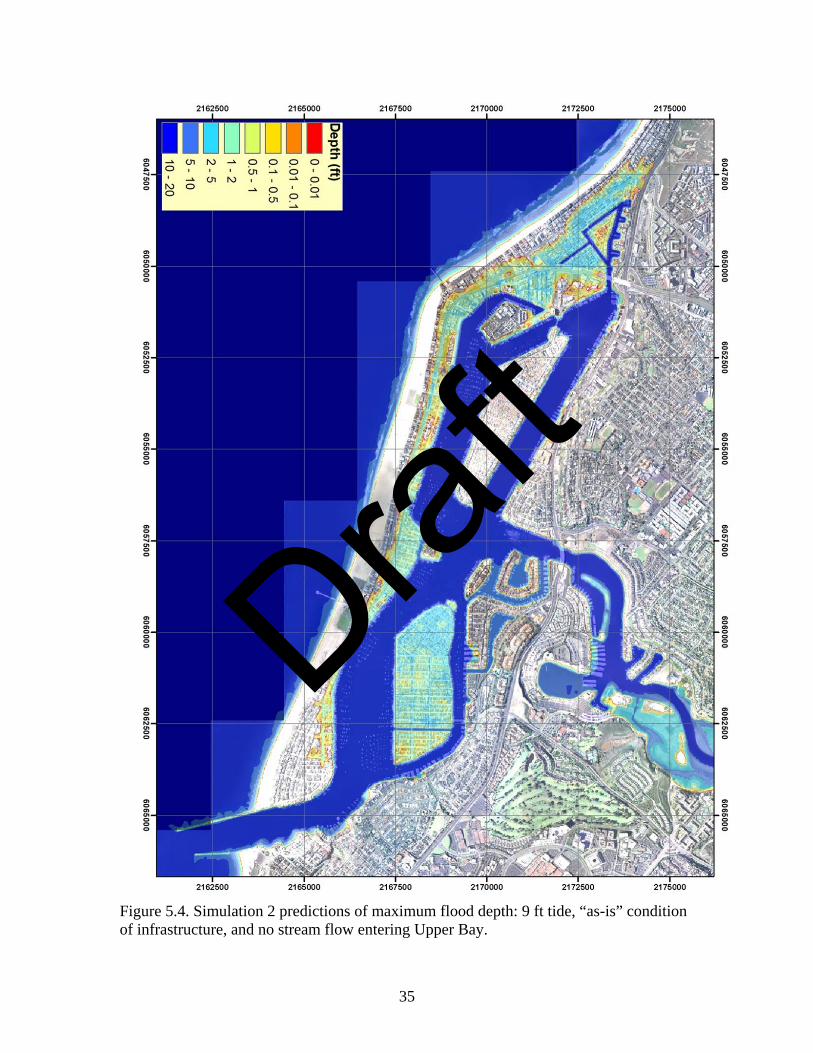
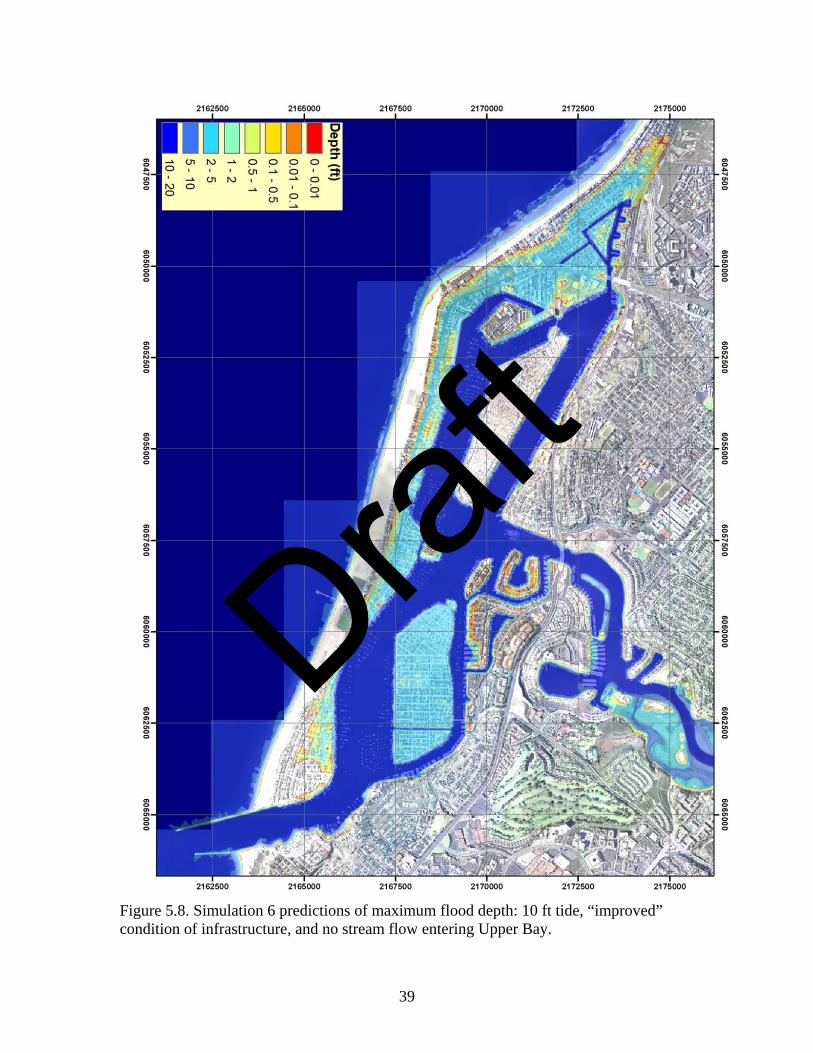
To model stream flow, a point source of 30,000 cfs was specified at a point in Upper Bay very close to San Diego Creek, just east of Jamboree Road. This value was selected to account for storm flow contributed by both San Diego Creek and Santa Ana Delhi Channel, based on a previous study by McLaughlin et al. (2007). 5.5 Modeling Scenarios A total of nine scenarios were completed to depict the range of flooding that could occur as a consequence of the infrastructure scenarios, tide scenarios and stream flow scenarios described above. First, using the “as-is” condition of infrastructure, the model was executing using 8, 9 and 10 ft tides and without any stream flow (Simulations 1-3). Second, using the “improved” condition of infrastructure, the model was executing using 8, 9 and 10 ft tides and without any stream flow (Simulations 4-6). And third, using the “improved” condition of infrastructure, the model was executing using 8, 9 and 10 ft tides and stream flow entering Upper Bay at rate of 30,000 cfs (Simulations 7-9). 5.6 Results To illustrate computer model results, predictions of maximum flood depths (maximum over the tide cycle) were color contoured and superimposed upon aerial imagery using ArcGIS (ESRI, Redlands, CA). A summary slide showing the results of all nine simulations is presented Fig. 5.2, and then Figs. 5.3-5.11 show the results of Simulations 1-9, respectively. The coloring scheme used here depicts deep water with dark blue, shoreline with a dark red, and intermediate depths with light blue, green, yellow and orange. These results indicate that two regions are likely to be impacted by an 8 ft tide: Balboa Island and Balboa Peninsula. On Balboa Island, the model depicts water overtopping the bulk head at the Balboa Island Ferry ramp and flooding the western half of the island with water as deep as two feet, but mostly less than 1 feet. On Balboa Peninsula, the model depicts water overtopping bulkheads at several places along the bay side and causing flooding as deep as 1 feet, but typically less than 0.5 feet. Areas impacted by the 8 ft “as is” flooding scenario without stream flow (Simulation 1) include: several blocks between Edgewater Ave. and Bay Ave., from Buena Vista to Main St.; several blocks along the Rhine channel, roughly between 19th St. and 30th St.; several blocks in the vicinity of Finley Ave. and 36th St.; portions of Newport Island, several points along Bay Ave. including 7th, 10th and 14th Streets.; and Balboa Blvd. between A St. and C St. The 8 ft “improved” scenario without stream flow (Simulation 4) depicts considerably less flooding in the vicinity of Finley Ave. and 36th St. and less flooding along the Rhine channel. On the other hand, the 8 ft “improved” scenario with 30,000 cfs entering Upper Bay (Simulation 7) indicates more widespread flooding along Park Ave. and Balboa Ave. on Balboa Island, and along Balboa Blvd. on Balboa Peninsula, compared to the “improved” case without stream flow. Focusing now on the 9 ft tide predictions, model predictions indicate complete flooding of Balboa Island with depths exceeding 3 ft near the Balboa Island Ferry ramp and
Draft

32
exceeding 2 ft on key routes such as Marine Ave. and Park Ave. (Scenarios 2, 5 and 8). Flooding on Little Balboa Island is predicted with depths less than 2 ft., and near complete flooding of Newport Island is predicted. On Balboa Peninsula, predictions indicate the 9 ft tide would impact most developed areas north of Balboa Blvd. as well as key access routes. Depths exceeding 2 ft are predicted for Balboa Blvd. between 40th and 45th streets; depths exceeding 1 ft are predicted from Newport Blvd. at Finley Ave., southeast to Balboa Blvd. at 8th St.; and depths exceeding 1 feet are predicted for Lido Park Dr. It appears that Bay Island would also be impacted by a 9 ft tide, as well as shoreline south of Pacific Coast Highway (PCH) along Lido Channel. Comparing Scenarios 2, 5, and 8 (Fig. 5.2), it appears that differences in infrastructure configurations and stream flow would have little impact on flood extent. Hence, the role of the tide is clearly dominant at this tide stage. Focusing now on the 10 ft tide predictions (Scenarios 3, 6 and 9), these indicate flooding of Balboa Island with water over 4 ft deep, and Little Balboa Islands with water over 3 ft deep. Along Balboa Peninsula, the vast majority of developed land are predicted to be impacted by flooding including Newport Island. Further, Linda Island, Bay Island, shoreline south of Harbor Island Drive, shoreline south of PCH along Lido Channel are predicted to be impacted. Lastly, the 10 ft tide is predicted to submerge a section of PCH near Superior Ave. 5.4 Disclaimer Predictions presented here are sensitive to the height of bulk heads that encircle the bay, and every attempt was made to depict these features as accurately as possible given the time and budget constraints which did not involve a comprehensive survey of bulk head height, continuity or integrity. Furthermore, it should be stressed that the vertical accuracy of bulk head heights was limited by the vertical accuracy of the LiDAR terrain survey which corresponds to approximately 0.6 ft. Hence, there may be areas around the harbor where we incorrectly predict flooding based on a given tide height because our depiction of the bulk head is too low compared to reality. Conversely, there may be areas likely to flood that we have missed because our depiction of the bulk head is too high. Furthermore, we have simplified the depiction of flooding in our model by only considering tide and Upper Bay stream flow effects, and by ignoring the effects of rainfall, waves and the storm drain system.
Draft

33
Figure 5.2. Summary slide showing maximum flood depth based on Simulations 1-9.
Draft

34
Figure 5.3. Simulation 1 predictions of maximum flood depth: 8 ft tide, “as-is” condition of infrastructure, and no stream flow entering Upper Bay.
Draft
35
Figure 5.4. Simulation 2 predictions of maximum flood depth: 9 ft tide, “as-is” condition of infrastructure, and no stream flow entering Upper Bay.
Draft

36
Figure 5.5. Simulation 3 predictions of maximum flood depth: 10 ft tide, “as-is” condition of infrastructure, and no stream flow entering Upper Bay.
Draft

37
Figure 5.6. Simulation 4 predictions of maximum flood depth: 8 ft tide, “improved” condition of infrastructure, and no stream flow entering Upper Bay.
Draft

38
Figure 5.7. Simulation 5 predictions of maximum flood depth: 9 ft tide, “improved” condition of infrastructure, and no stream flow entering Upper Bay.
Draft
39
Figure 5.8. Simulation 6 predictions of maximum flood depth: 10 ft tide, “improved” condition of infrastructure, and no stream flow entering Upper Bay.
Draft

40
Figure 5.9. Simulation 7 predictions of maximum flood depth: 8 ft tide, “improved” condition of infrastructure, and 30,000 cfs entering Upper Bay.
Draft
41
Figure 5.10. Simulation 8 predictions of maximum flood depth: 9 ft tide, “improved” condition of infrastructure, and 30,000 cfs entering Upper Bay.
Draft

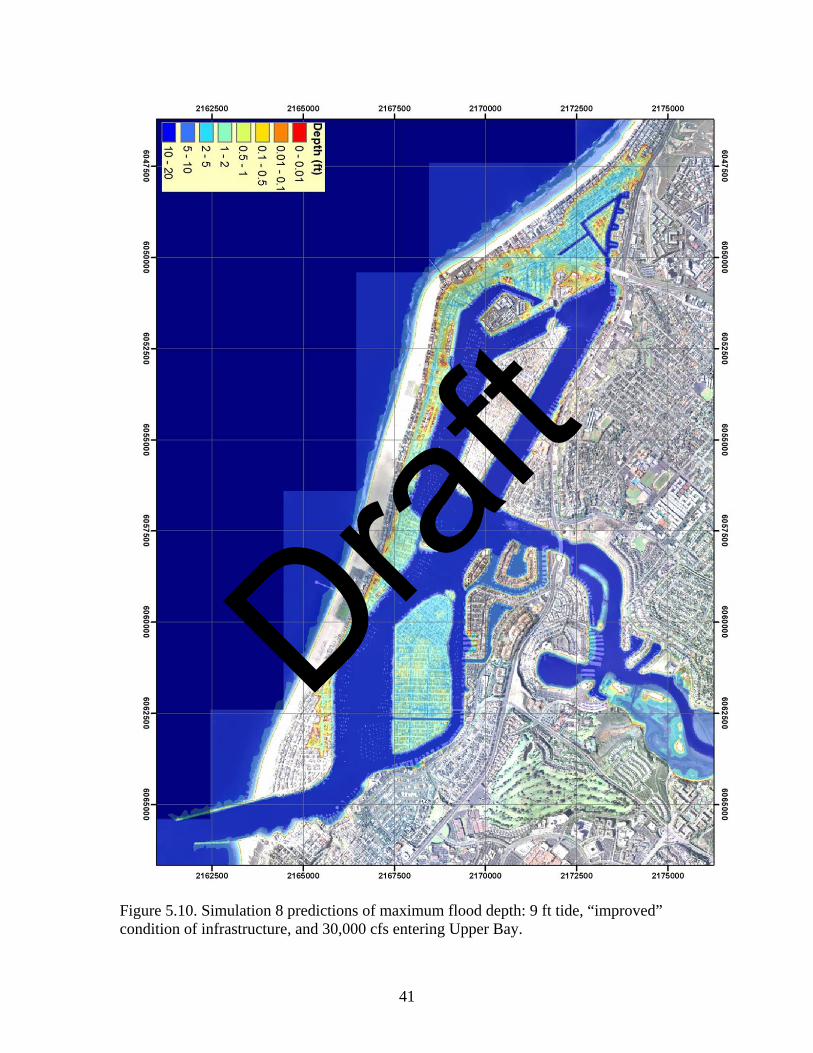
42
Figure 5.11. Simulation 9 predictions of maximum flood depth: 10 ft tide, “improved” condition of infrastructure, and 30,000 cfs entering Upper Bay.
Draft
43
Chapter 6: Conclusions and Recommendations The largest tides in recent history have nearly reached the 8 ft level relative to Mean Lower Low Water (MLLW), attaining heights of 7.8 ft in 1983 and 2005. Strong storms can cause tides to crest more than 1 ft above the predicted tide height, and the highest high tides of each year are typically 7.0 ft (+/- 0.3 ft), so an 8 ft tide is approximately representative of the combined effects of a high tide and a winter storm that elevates sea levels. Furthermore, climate projections presently call for between 1 and 3 ft of sea level rise by 2100, and as much as 1 ft by 2050. Hence, a 9 and 10 ft tide could be taken to be approximately representative of 2050 and 2100 conditions, but it should be recognized that this represents only an educated guess. It is too early to quantify the probability of these levels occurring. Several developed parts of Newport Harbor presently fall below the height of extreme high tides including Balboa Island, Little Balboa Island, Newport Island and much of Balboa Peninsula along its bay-ward side. To guard these areas from flooding during extreme high tides, bulk heads (i.e., sea walls) encircle the bay, valves at the outlets of storm drains are closed by City staff to prevent back flooding, temporary sand berms are constructed, and pumps are deployed. On Balboa Island, the Balboa Island Ferry ramp represents the low point in the bulk head encircling the island. A field survey indicates that an 8 ft (MLLW) tide would overtop the ramp by approximately 1 ft and model predictions indicate that this would flood the western half of the island. Analysis of recent topographic data indicates the western half is lower than the eastern half. Results of a field survey also indicate that bulk head may be as low as 8 ft in places, so overtopping from an 8 ft tide is likely to occur in other places aside from the Ferry ramp. Complete flooding of the island is predicted to result from a 9 and 10 ft tide. On Little Balboa Island, a field survey indicates that the bulk head is closer to the 9 ft level and the 8 ft tide is not predicted to cause flooding here. However, dips in the wall below the 9 ft level are predicted to enable significant flooding from a 9 ft tide, and complete flooding of the island is predicted for a 10 ft tide. On Balboa Peninsula, the vast majority of bulk heads are privately owned and bulk heights vary considerably in height and integrity. The integrity of bulk heads can be compromised by storm drains that allow back flooding if not properly plugged, gaps at parcel boundaries, as well as cracks and poor or outdated construction practices that enable seepage. City General Services staff seek cooperation from owners and occupants of bulk heads to ensure that drains are plugged, low bulk heads are sand bagged, and deficient bulk heads are improved. However, this is a challenging task because the level of public cooperation is varied. Based on a field survey and observations of flooding from a 7.5 ft tide, the threshold for flooding along Balboa Peninsula is somewhere between the 7.0 and 7.5 ft levels. Model predictions indicate that the 8 ft tide would cause
Draft
44
flooding in several places along Balboa Peninsula which are described in detail in Chapter 5. Both the 9 and 10 ft tide are predicted to cause near complete flooding of the developed parts of Balboa Peninsula, because most bulk heads fall below the 9 ft level. There are predictable and unpredictable aspects to the height attained by extreme high tides that should be recognized for effective short and long-term planning purposes. The effect of astronomical factors is predictable. This causes the highest extreme high tides to occur in Winter and Summer but never in Fall or Spring. In addition, there is a cycle lasting several years that causes tide heights to vary by approximately 0.5 ft. This causes tides to be higher one year versus another. This cycle is peaking at present (2007- 2008 time frame) and will peak again in 2011-2012. Through 2020, the highest extreme tide is predicted for December, 2008. The effects of inter-annual phenomena such as El Nino/La Nina, weather conditions, and global warming on tide heights are more difficult to predict. These effects can be characterized by studying historical differences between actual and predicted tides or the Non-Tide Residual (NTR). A review of data for Los Angeles shows that NTRs exceeding 0.5 ft have persisted for days at a time, and 1.0 ft for hours at a time, during Winter. NTRs exceeding 1.0 ft have occurred during strong El-Nino conditions as well as neutral El Nino/La Nina conditions, but never during weak or strong La Nina conditions. Hence, climatic conditions give some indication of flooding risk. The worst case scenario for coastal flooding is a strong winter storm that approaches the California coastline from the Gulf of Alaska during an El Nino winter, arriving simultaneously with a high astronomical tide. By monitoring climatic conditions seasonally, and weather conditions daily, it should be possible to forecast a worse-case scenario on a 24-48 hour basis and have a good indication of its severity. To be better prepared for future extreme high tides, the following is recommended:
1) The City should consider creating or formalizing a monitoring system for environmental conditions that affect coastal flooding. This would include not only high astronomical tides but also climatic and weather conditions that contribute to damaging high tides (large NTRs). On a short term basis (24-48 hours), the system could be used to improve the City’s emergency preparedness. On a seasonal or inter-annual basis, the system could help staff to prioritize and guide infrastructure improvement efforts (e.g., sand replenishment).
2) The City should consider creating and maintaining a database of public and private flood control infrastructure, and implementing a monitoring system to track key factors that bear on flood control. For example, the database could provide an inventory of the location, height and condition of bulkheads encircling the harbor, the height and thickness of beach sand along the coastline, and other important data such as tide valves and plugs. This data would logically be integrated into the City GIS, and could be coupled to the flood model developed here to maintain up-to-date maps of flood-vulnerable areas. The model could also be used to evaluate the benefit of proposed flood control measures.
Draft
45
3) In support of item (2) above, the City should consider hiring or employing a qualified surveyor to precisely measure the height of bulk heads around the harbor.
4) The City should consider strengthening efforts to improve Departmental coordination relative to flood protection. For example, General Services staff deal with flood problems first-hand and have an excellent working knowledge of infrastructure deficiencies, but do not appear to be in an ideal position to address these problems through construction efforts (Public Works) or a regulatory/permitting framework (Planning).
5) The City should consider exploring the legal or policy framework that would allow for more systematic improvement of the condition and continuity of bulkheads around the bay in the future, particularly considering that most bulk heads appear to be privately owned.
6) The City should consider developing and adopting a flood risk management plan for the Harbor area before moving forward with any major efforts to improve flood control infrastructure (e.g., raising bulk heads). Flood risk management plans consider the economic, environmental and social consequences of flooding to identify the optimal structural (e.g., bulk heads, pump stations) and non-structural (e.g., zoning, insurance) measures for implementation.
7) The City should examine the impact of waves on flooding in a future study. Based on a cursory review of LiDAR data characterizing the height of beach sand along Balboa Peninsula, it is not clear that there is adequate protection against the combined effects of an extreme high tide and ocean waves typical of storm conditions. Such a study could be used to guide future sand replenishment efforts.
Draft

46
References Begnudelli L., and Sanders B.F. (2006) Unstructured Grid Finite Volume Algorithm for Shallow-water Flow and Transport with Wetting and Drying, ASCE Journal of Hydraulic Engineering, 132(4), 371-384. Begnudelli L. and Sanders B.F. (2007a) Conservative Wetting and Drying Methodology for Quadrilateral Grid Finite Volume Models, ASCE Journal of Hydraulic Engineering 133(3), 312-322, 2007. Begnudelli L. and Sanders B.F. (2007b) Simulation of the St. Francis Dam-Break Flood, ASCE Journal of Engineering Mechanics 133(11), 1200-1212, 2007. Begnudelli, L., Sanders, B.F. and Bradford, S.F. (2008) An adaptive Godunov-based model for flood simulation, ASCE Journal of Hydraulic Engineering, 134(6), 714-725. Bromirski, P.D., Flick, R.E. and Cayan, D.R. (2003) Storminess variability along the California coast: 1858-2000, J. Climate, 16, 982-993. California Climate Change Center (2006) Our changing climate: assessing the risks to California, Report to the State of California. California Coastal Commission (2001) Overview of sea level rise and some implications for Coastal California, Report by the State of California – The Resources Agency, San Francisco. Flick, R.E. (1986) A review of conditions associated with high sea levels in Southern Calfornia, Sci. Tot. Environ. 55, 251-259. Graham, N.E. and Diaz, H.F. (2001) Evidence for intensification of North Pacific cyclones since 1948, Bulletin of the American Meteorological Society, 82(9), 1869-1893. Intergovernmental Panel on Climate Change (2007) The Physical Science Basis, Working Group I Report, Chapter 10. McLaughlin, K, Ahn, JH, Litton, RM and Grant, SB (2007) Use of salinity mixing models to estimate the contribution of creek water fecal indicator bacteria to an estuarine environment: Newport Bay, California. Water Research, 41(16), 3595-3604. National Research Council (2000) Risk analysis and uncertainty in flood damage reduction studies, Report by the Committee on Risk-Based Analysis for Flood Damage Reduction, National Academy Press. Sanders, B.F. (2007) Evaluation of on-line DEMs for flood inundation modeling. Advances in Water Resources, 30(8) 1831-1843, 2007.
Draft
47
Sanders, B.F. (2008) Integration of a shallow-water model with a local time step, Journal of Hydraulic Research, 46(4) 466-475. Sanders, B.F., Gallegos, H. and Schubert, J.E. (2008) Integral formulation of shallow-water equations with anisotropic porosity for urban flood modeling, Journal of Hydrology, doi:10.10.1016/j.jhyrol.2008.08.009. Schubert, J.E., Sanders, B.F. Smith, M.J. and Wright N.G. (2008) Unstructured mesh generation and landcover-based resistance for hydrodynamic modeling of urban flooding, Advances in Water Resources, doi:10.1016/j.advwatres.2008.07.012. Titus, J.G. and Narayanan, V. (1995) The probability of sea level rise, Report to the U.S. Environmental Protection Agency, Washington, EPA 230-R95-008, 186 pp. Tol, R.S.J. et al. (2006) Adaptation to five metres of sea level rise, J. Risk Res. 9(5), 467-482. Zetler, B.D. and Flick, R.E. (1985) Predicted Extreme High Tides for Mixed-Tide Regimes, J. Phys. Ocean. 15, 357-359.
Draft